
Identification of a High-Risk Group of New-Onset Cardiovascular Disease in Occupational Drivers by Analyzing Heart Rate Variability


Abstract
:1. Introduction
2. Materials/Subjects and Methods
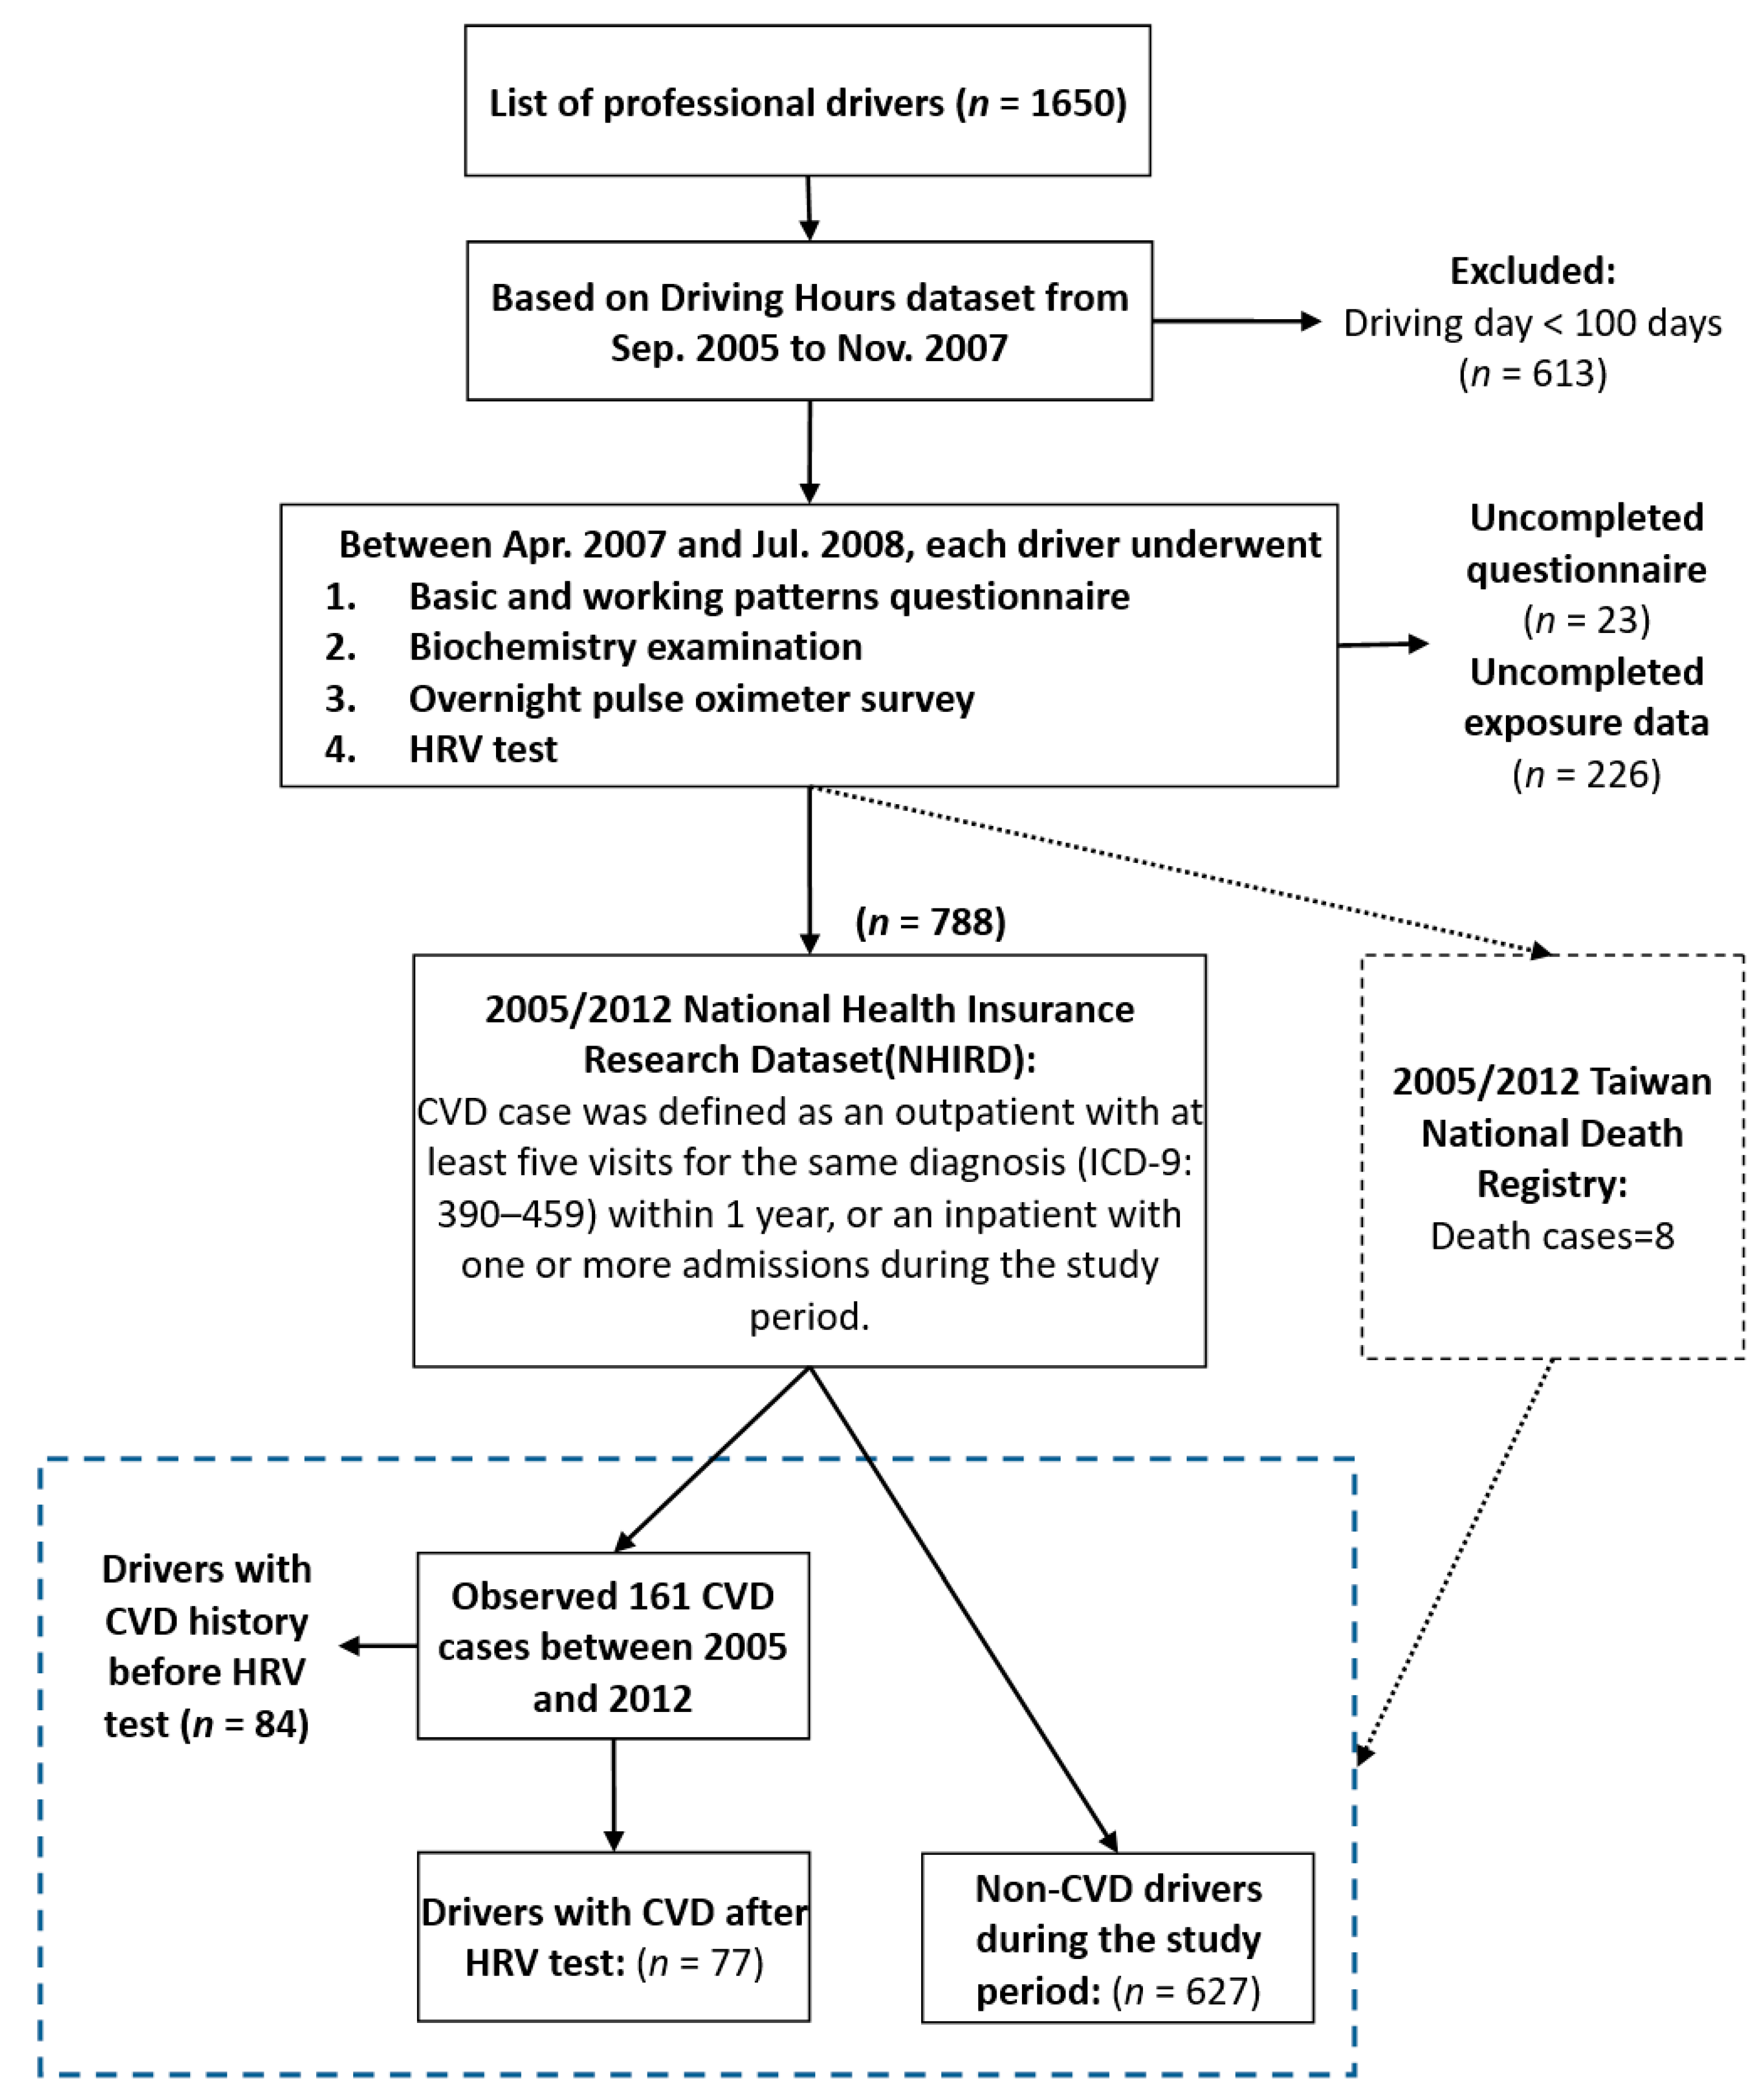
2.1. Study Population
2.2. HRV and Biochemical Measurements
2.3. Statistical Analysis
3. Results
3.1. HRV Indices and 8-Year CVD Risks
3.2. HRV Indices and 8 Year Cardiovascular Diagnostic Risk Categories
4. Discussion
Supplementary Materials
Author Contributions
Funding
Institutional Review Board Statement
Informed Consent Statement
Data Availability Statement
Acknowledgments
Conflicts of Interest
Abbreviations
| HRV | heart rate variability |
| TBDCS | Taiwan Bus Driver Cohort Study |
| CVD | cardiovascular disease |
| SDNN | standard deviation of N–N intervals |
| LF | low frequency |
| RMSSD | root-mean-square of the successive differences |
| HF | high frequency |
| MI | myocardial infarction |
| IHD | ischemic heart disease |
| CHD | coronary heart disease |
| ANS | autonomic nervous system |
| NHIRD | Taiwan’s National Health Insurance Research Database |
| ICH-GCP | International Conference on Harmonization–Good Clinical Practice |
| CHF | congestive heart failure |
| VLF | very low frequency |
| TP | total power |
| PSI | physical stress index |
| CHOL | total cholesterol |
| HDL-C | high-density lipoprotein cholesterol |
| TG | triglycerides |
| FG | fasting blood glucose |
| HRs | hazard ratios |
| CIs | confidence intervals |
| BMI | body mass index |
| SAS | Statistical Analysis System |
| ICD-9 | International Classification of Diseases 9th Revision |
| ICD-10 | International Classification of Diseases 10th Revision |
| PCS | procedure codes |
References
- Hwang, W.J.; Hong, O. Work-related cardiovascular disease risk factors using a socioecological approach: Implications for practice and research. Eur. J. Cardiovasc. Nurs. 2012, 11, 114–126. [Google Scholar] [CrossRef]
- World Health Organization. Cardiovascular Diseases (CVDs). 2021. Available online: https://www.who.int/news-room/fact-sheets/detail/cardiovascular-diseases-(cvds) (accessed on 11 June 2021).
- Tse, J.L.M.; Flin, R.; Mearns, K. Bus driver well-being review: 50 years of research. Transport. Res. F-Traf. 2006, 9, 89–114. [Google Scholar] [CrossRef]
- Bigert, C.; Gustavsson, P.; Hallqvist, J.; Hogstedt, C.; Lewne, M.; Plato, N.; Reuterwall, C.; Schéele, P. Myocardial infarction among professional drivers. Epidemiology 2003, 14, 333–339. [Google Scholar] [CrossRef]
- Netterstrom, B.; Juel, K. Impact of Work-Related and Psychosocial Factors on the Development of Ischemic Heart-Disease among Urban Bus Drivers in Denmark. Scand. J. Work Environ. Health 1988, 14, 231–238. [Google Scholar] [CrossRef] [Green Version]
- Hartvig, P.; Midttun, O. Coronary heart disease risk factors in bus and truck drivers. A controlled cohort study. Int. Arch. Occup. Environ. Health. 1983, 52, 353–360. [Google Scholar] [CrossRef]
- Tuchsen, F.; Hannerz, H.; Roepstorff, C.; Krause, N. Stroke among male professional drivers in Denmark, 1994-2003. Occup. Environ. Med. 2006, 63, 456–460. [Google Scholar] [CrossRef] [Green Version]
- Chen, C.C.; Shiu, L.J.; Li, Y.L.; Tung, K.Y.; Chan, K.Y.; Yeh, C.J.; Chen, S.C.; Wong, R.H. Shift Work and Arteriosclerosis Risk in Professional Bus Drivers. Ann. Epidemiol. 2010, 20, 60–66. [Google Scholar] [CrossRef]
- Gimeno, D.; Benavides, F.G.; Mira, M.; Martinez, J.M.; Benach, J. External validation of psychological job demands in a bus driver sample. J. Occup. Health 2004, 46, 43–48. [Google Scholar] [CrossRef] [Green Version]
- Wang, P.D.; Lin, R.S. Coronary heart disease risk factors in urban bus drivers. Public Health 2001, 115, 261–264. [Google Scholar] [CrossRef]
- Tsai, S.S.; Lai, C.H.; Shih, T.S.; Lin, M.H.; Liou, S.H. High job strain is associated with inflammatory markers of disease in young long-haul bus drivers. J. Occup. Health Psychol. 2014, 19, 336. [Google Scholar] [CrossRef]
- Von Borell, E.; Langbein, J.; Despres, G.; Hansen, S.; Leterrier, C.; Marchant-Forde, J.; Marchant-Forde, R.; Minero, M.; Mohr, E.; Prunier, A.; et al. Heart rate variability as a measure of autonomic regulation of cardiac activity for assessing stress and welfare in farm animals—A review. Physiol. Behav. 2007, 92, 293–316. [Google Scholar] [CrossRef] [PubMed]
- Cowan, M.J. Measurement of Heart-Rate-Variability. West. J. Nurs. Res. 1995, 17, 32–48. [Google Scholar] [CrossRef] [PubMed]
- Liao, D.P.; Barnes, R.W.; Chambless, L.E.; Simpson, R.J.; Sorlie, P.; Heiss, G. Age, Race, and Sex-Differences in Autonomic Cardiac-Function Measured by Spectral-Analysis of Heart-Rate-Variability—The Aric Study. Am. J. Cardiol. 1995, 76, 906–912. [Google Scholar] [CrossRef]
- Tsuji, H.; Venditti, F.J.; Manders, E.S.; Evans, J.C.; Larson, M.G.; Feldman, C.L.; Levy, D. Determinants of heart rate variability. J. Am. Coll. Cardiol. 1996, 28, 1539–1546. [Google Scholar] [CrossRef] [Green Version]
- Berntson, G.G.; Bigger, J.T.; Eckberg, D.L.; Grossman, P.; Kaufmann, P.G.; Malik, M.; Nagaraja, H.N.; Porges, S.W.; Saul, J.P.; Stone, P.H.; et al. Heart rate variability: Origins, methods, and interpretive caveats. Psychophysiology 1997, 34, 623–648. [Google Scholar] [CrossRef]
- Greiser, K.H.; Kluttig, A.; Schumann, B.; Swenne, C.A.; Kors, J.A.; Kuss, O.; Haerting, J.; Schmidt, H.; Thiery, J.; Werdan, K. Cardiovascular diseases, risk factors and short-term heart rate variability in an elderly general population: The CARLA study 2002–2006. Eur. J. Epidemiol. 2009, 24, 123–142. [Google Scholar] [CrossRef] [PubMed]
- Harris, K.F.; Matthews, K.A. Interactions between autonomic nervous system activity and endothelial function: A model for the development of cardiovascular disease. Psychosom. Med. 2004, 66, 153–164. [Google Scholar] [CrossRef]
- Task Force of the European Society of Cardiology and the North American Society of Pacing and Electrophysiology. Heart rate variability: Standards of measurement, physiological interpretation and clinical use. Circulation 1996, 93, 1043–1065. [Google Scholar]
- Zheng, Z.H.; Zeng, Y.T.; Wu, J.Y. Increased neuroplasticity may protect against cardiovascular disease. Int. J. Neurosci. 2013, 123, 599–608. [Google Scholar] [CrossRef]
- Thayer, J.F.; Ahs, F.; Fredrikson, M.; Sollers, J.J.; Wager, T.D. A meta-analysis of heart rate variability and neuroimaging studies: Implications for heart rate variability as a marker of stress and health. Neurosci. Biobehav. R. 2012, 36, 747–756. [Google Scholar] [CrossRef]
- Shaffer, F.; Ginsberg, J.P. An Overview of Heart Rate variability Metrics and Norms. Front. Public Health 2017, 28, 258. [Google Scholar] [CrossRef] [Green Version]
- Tsuji, H.; Venditti, F.J.; Manders, E.S.; Evans, J.C.; Larson, M.G.; Feldman, C.L.; Levy, D. Reduced Heart-Rate-Variability and Mortality Risk in an Elderly Cohort—The Framingham Heart-Study. Circulation 1994, 90, 878–883. [Google Scholar] [CrossRef] [Green Version]
- Bilchick, K.C.; Fetics, B.; Djoukeng, R.; Fisher, S.G.; Fletcher, R.D.; Singh, S.N.; Nevo, E.; Berger, R.D. Prognostic value of heart rate variability in chronic congestive heart failure (veterans affairs’ survival trial of antiarrhythmic therapy in congestive heart failure). Am. J. Cardiol. 2002, 90, 24–28. [Google Scholar] [CrossRef]
- Dekker, J.M.; Schouten, E.G.; Klootwijk, P.; Pool, J.; Swenne, C.A.; Kromhout, D. Heart rate variability from short electrocardiographic recordings predicts mortality from all causes in middle-aged and elderly men—The zutphen study. Am. J. Epidemiol. 1997, 145, 899–908. [Google Scholar] [CrossRef] [Green Version]
- La Rovere, M.T.; Bigger, J.T.; Marcus, F.I.; Mortara, A.; Schwartz, P.J.; Investigators, A. Baroreflex sensitivity and heart-rate variability in prediction of total cardiac mortality after myocardial infarction. Lancet 1998, 351, 478–484. [Google Scholar] [CrossRef]
- Papaioannou, V.; Pneumatikos, I.; Maglaveras, N. Association of heart rate variability and inflammatory response in patients with cardiovascular diseases: Current strengths and limitations. Front. Physiol. 2013, 4, 174. [Google Scholar] [CrossRef] [Green Version]
- Janszky, I.; Ericson, M.; Mittleman, M.A.; Wamala, S.; Al-Khalili, F.; Schenck-Gustafsson, K.; Orth-Gomer, K. Heart rate variability in long-term risk assessment in middle-aged women with coronary heart disease: The Stockholm Female Coronary Risk Study. J. Intern. Med. 2004, 255, 13–21. [Google Scholar] [CrossRef] [Green Version]
- Stein, P.K.; Barzilay, J.I.; Chaves, P.H.M.; Mistretta, S.Q.; Domitrovich, P.P.; Gottdiener, J.S.; Rich, M.W.; Kleiger, R.E. Novel Measures of Heart Rate Variability Predict Cardiovascular Mortality in Older Adults Independent of Traditional Cardiovascular Risk Factors: The Cardiovascular Health Study (CHS). J. Cardiovasc. Electr. 2008, 19, 1169–1174. [Google Scholar] [CrossRef] [Green Version]
- Fyfe-Johnson, A.L.; Muller, C.J.; Alonso, A.; Folsom, A.R.; Gottesman, R.F.; Rosamond, W.D.; Whitsel, E.A.; Agarwal, S.K.; MacLehose, R.F. Heart Rate Variability and Incident Stroke The Atherosclerosis Risk in Communities Study. Stroke 2016, 47, 1452–1458. [Google Scholar] [CrossRef] [Green Version]
- Dekker, J.M.; Crow, R.S.; Folsom, A.R.; Hannan, P.J.; Liao, D.; Swenne, C.A.; Schouten, E.G. Low heart rate variability in a 2-minute rhythm strip predicts risk of coronary heart disease and mortality from several causes—The ARIC study. Circulation 2000, 102, 1239–1244. [Google Scholar] [CrossRef]
- Leino, J.; Virtanen, M.; Kahonen, M.; Nikus, K.; Lehtimaki, T.; Koobi, T.; Lehtinen, R.; Turjanmaa, V.; Viik, J.; Nieminen, T. Exercise-test-related heart rate variability and mortality The Finnish cardiovascular study. Int. J. Cardiol. 2010, 144, 154–155. [Google Scholar] [CrossRef] [PubMed]
- Weber, C.S.; Thayer, J.F.; Rudat, M.; Wirtz, P.H.; Zimmermann-Viehoff, F.; Thomas, A.; Perschel, F.H.; Arck, P.C.; Deter, H.C. Low vagal tone is associated with impaired post stress recovery of cardiovascular, endocrine, and immune markers. Eur. J. Appl. Physiol. 2010, 109, 201–211. [Google Scholar] [CrossRef] [Green Version]
- Wu, W.T.; Tsai, S.S.; Liao, H.Y.; Lin, Y.J.; Lin, M.H.; Wu, T.N.; Shih, T.S.; Liou, S.H. Usefulness of overnight pulse oximeter as the sleep assessment tool to assess the 6-year risk of road traffic collision: Evidence from the Taiwan Bus Driver Cohort Study. Int. J. Epidemiol. 2017, 46, 266–277. [Google Scholar] [CrossRef]
- Wu, W.T.; Wang, C.C.; Liou, S.H. Effects of nanoparticles exposure and PON1 genotype on heart rate variability. Environ. Res. 2019, 176, 108377. [Google Scholar] [CrossRef]
- Hillebrand, S.; Gast, K.B.; de Mutsert, R.; Swenne, C.A.; Jukema, J.W.; Middeldorp, S.; Rosendaal, F.R.; Dekkers, O.M. Heart rate variability and first cardiovascular event in populations without known cardiovascular disease: Meta-analysis and dose-response meta-regression. Europace 2013, 15, 742–749. [Google Scholar] [CrossRef]
- Hallman, D.M.; Jorgensen, M.B.; Holtermann, A. On the health paradox of occupational and leisure-time physical activity using objective measurements: Effects on autonomic imbalance. PLoS ONE 2017, 12, e0177042. [Google Scholar] [CrossRef] [PubMed] [Green Version]
- Thayer, J.F.; Yamamoto, S.S.; Brosschot, J.F. The relationship of autonomic imbalance, heart rate variability and cardiovascular disease risk factors. Int. J. Cardiol. 2010, 141, 122–131. [Google Scholar] [CrossRef]
- Van Amelsvoort, L.G.P.M.; Schouten, E.G.; Maan, A.C.; Swenne, C.A.; Kok, F.J. Occupational determinants of heart rate variability. Int. Arch. Occup. Environ. Health 2000, 73, 255–262. [Google Scholar] [CrossRef]
- Solarikova, P.; Turonova, D.; Brezina, I.; Rajčáni, J. Heart rate variability in psychosocial stress: Comparison between laboratory and real-life setting. Act. Nerv. Super. Rediviva 2016, 58, 77–82. [Google Scholar]
- Lischke, A.; Jacksteit, R.; Mau-Moeller, A.; Pahnke, R.; Hamm, A.O.; Weippert, M. Heart rate variability is associated with psychosocial stress in distinct social domains. J. Psychosom. Res. 2018, 106, 56–61. [Google Scholar] [CrossRef]
- Mulle, J.G.; Vaccarino, V. Cardiovascular Disease, Psychosocial Factors, and Genetics: The Case of Depression. Prog. Cardiovasc. Dis. 2013, 55, 557–562. [Google Scholar] [CrossRef] [Green Version]
- Hernandez-Gaytan, S.I.; Rothenberg, S.J.; Landsbergis, P.; Becerril, L.C.; De Leon-Leon, G.; Collins, S.M.; Díaz-Vásquez, F.J. Job Strain and Heart Rate Variability in Resident Physicians Within a General Hospital. Am. J. Ind. Med. 2013, 56, 38–48. [Google Scholar] [CrossRef] [PubMed]
- Fang, Y.; Sun, J.T.; Li, C.; Poon, C.S.; Wu, G.Q. Effect of Different Breathing Patterns on Nonlinearity of Heart Rate Variability. In Proceedings of the Annual International Conference of the IEEE Engineering in Medicine and Biology Society, Vancouver, BC, Canada, 20–25 August 2008; pp. 3220–3223. [Google Scholar] [CrossRef]
- Aronson, D.; Burger, A.J. Effect of beta-blockade on heart rate variability in decompensated heart failure. Int. J. Cardiol. 2001, 79, 31–39. [Google Scholar] [CrossRef]
- O’Regan, C.; Kenny, R.A.; Cronin, H.; Finucane, C.; Kearney, P.M. Antidepressants strongly influence the relationship between depression and heart rate variability: Findings from The Irish Longitudinal Study on Ageing (TILDA). Psychol. Med. 2015, 45, 623–636. [Google Scholar] [CrossRef] [Green Version]
- Collins, S.; Karasek, R. Reduced vagal cardiac control variance in exhausted and high strain job subjects. Int. J. Occup. Med. Environ. Health 2010, 23, 267–278. [Google Scholar] [CrossRef] [PubMed] [Green Version]


| Variables | All Drivers | Person Years | ||
|---|---|---|---|---|
| n | (%) | sum | (%) | |
| Total subjects | 788 | 100.0 | 5334.2 | 100.0 |
| Non-CVD drivers | 627 | 79.6 | 5014.3 | 94.0 |
| CVD drivers a | 161 | 20.4 | 319.9 | 6.0 |
| CVD history before 2006 a,b | 84 | 10.7 | 11.7 | 0.2 |
| Age (years) | ||||
| <35 | 87 | 11.0 | 666.5 | 12.5 |
| 35–44 | 340 | 43.1 | 2417.4 | 45.3 |
| 45–49 | 199 | 25.3 | 1339.6 | 25.1 |
| ≥50 | 162 | 20.6 | 910.7 | 17.1 |
| Age at first employment (years) | ||||
| ≤32 | 175 | 22.2 | 1320.6 | 24.8 |
| 33–38 | 272 | 34.5 | 1872.6 | 35.1 |
| ≥39 | 341 | 43.3 | 2141.1 | 40.1 |
| Time since first employment (years) | ||||
| ≤2 | 150 | 19.0 | 1091.8 | 20.5 |
| 2.1–5 | 232 | 29.4 | 1647.2 | 30.9 |
| 5.1–8 | 164 | 20.8 | 1059.9 | 19.9 |
| >8 | 242 | 30.7 | 1535.4 | 28.8 |
| Shift work modes c | ||||
| Day shifts only | 338 | 42.9 | 2264.8 | 42.5 |
| Irregular shift | 370 | 47.0 | 2587.1 | 48.5 |
| Evening and Night shift | 80 | 10.2 | 482.4 | 9.0 |
| BMI (kg/m2) | ||||
| <25 | 299 | 37.9 | 2166.6 | 40.6 |
| 25–29.9 | 359 | 45.6 | 2361.8 | 44.3 |
| ≥30 | 130 | 16.5 | 805.9 | 15.1 |
| Marital status | ||||
| Unmarried | 124 | 15.7 | 919.8 | 17.2 |
| Married | 577 | 73.2 | 3841.7 | 72.0 |
| Others | 87 | 11.0 | 572.7 | 10.7 |
| Education | ||||
| ≤Junior high school | 235 | 29.8 | 1556.9 | 29.2 |
| Senior high and vocational school | 498 | 63.2 | 3396.2 | 63.7 |
| University and College | 55 | 7.0 | 381.1 | 7.1 |
| Cigarette smoking | ||||
| Current smokers | 276 | 35.0 | 1808.7 | 33.9 |
| Ex-smokers | 54 | 6.9 | 337.4 | 6.3 |
| Never smokers | 453 | 57.5 | 3148.1 | 59.0 |
| Missing | 5 | |||
| Alcohol use | ||||
| Yes | 612 | 77.7 | 4240.5 | 79.5 |
| No | 171 | 21.7 | 1061.3 | 19.9 |
| Missing | 5 | |||
| Moderate exercise | ||||
| Yes | 557 | 70.7 | 3857.0 | 72.3 |
| No | 221 | 28.0 | 1397.3 | 26.2 |
| Missing | 10 | |||
| All Drivers (n =788) | Drivers (n = 704) a | ||||||||||||||||
|---|---|---|---|---|---|---|---|---|---|---|---|---|---|---|---|---|---|
| Model 1 b | Model 2 c | Model 1 b | Model 2 c | ||||||||||||||
| Independent Variables d | HR | 95% CI | p-Value | HR | 95% CI | p-Value | HR | 95% CI | p-Value | HR | 95% CI | p-Value | |||||
| 1 | As a continuous (LnSDNN) | 0.67 | 0.48 | 0.93 | 0.018 | 0.70 | 0.50 | 1.00 | 0.047 | 0.57 | 0.35 | 0.95 | 0.029 | 0.56 | 0.34 | 0.95 | 0.031 |
| 2 | As a categorical variable: SDNN (≤30 vs. >30) | 1.47 | 1.04 | 2.07 | 0.029 | 1.44 | 1.01 | 2.05 | 0.044 | 1.83 | 1.10 | 3.04 | 0.020 | 1.87 | 1.11 | 3.13 | 0.018 |
| 3 | As a continuous (LnRMSSD) | 0.83 | 0.62 | 1.10 | 0.185 | 0.85 | 0.64 | 1.13 | 0.264 | 0.83 | 0.54 | 1.28 | 0.397 | 0.81 | 0.52 | 1.26 | 0.348 |
| 4 | As a categorical variable: RMSSD (≤20 vs. >20) | 1.34 | 0.95 | 1.89 | 0.098 | 1.34 | 0.94 | 1.91 | 0.104 | 1.34 | 0.81 | 2.20 | 0.256 | 1.38 | 0.83 | 2.28 | 0.211 |
| 5 | As a continuous (LnLF) | 0.85 | 0.74 | 0.97 | 0.016 | 0.88 | 0.76 | 1.02 | 0.084 | 0.80 | 0.66 | 0.98 | 0.031 | 0.79 | 0.64 | 0.98 | 0.032 |
| 6 | As a categorical variable: LF (≤380 vs. >380) | 1.18 | 0.79 | 1.74 | 0.420 | 1.14 | 0.76 | 1.69 | 0.535 | 1.25 | 0.70 | 2.23 | 0.445 | 1.25 | 0.70 | 2.25 | 0.453 |
| 7 | As a continuous (LnHF) | 0.91 | 0.79 | 1.04 | 0.176 | 0.93 | 0.81 | 1.06 | 0.283 | 0.84 | 0.69 | 1.03 | 0.098 | 0.84 | 0.68 | 1.04 | 0.112 |
| 8 | As a categorical variable: HF (≤168 vs. >168) | 1.05 | 0.72 | 1.54 | 0.786 | 1.07 | 0.72 | 1.58 | 0.743 | 0.98 | 0.58 | 1.67 | 0.949 | 1.00 | 0.58 | 1.71 | 0.996 |
| 9 | As a continuous (LnLF/HF) | 0.90 | 0.76 | 1.06 | 0.212 | 0.94 | 0.80 | 1.11 | 0.486 | 0.93 | 0.73 | 1.18 | 0.541 | 0.93 | 0.72 | 1.19 | 0.544 |
| 10 | As a categorical variable: LF/HF (≤3.5 vs. >3.5) | 1.27 | 0.90 | 1.78 | 0.173 | 1.16 | 0.82 | 1.63 | 0.409 | 1.24 | 0.75 | 2.03 | 0.405 | 1.20 | 0.72 | 1.97 | 0.486 |
| Cardiovascular Disease (Not Including Hypertensive Disease) | Hypertensive Disease | Ischemic Heart Disease | Congestive Heart Failure (CHF) | |||||||||||||||
|---|---|---|---|---|---|---|---|---|---|---|---|---|---|---|---|---|---|---|
| Independent Variables d | HR | 95% CI | p-Value | HR | 95% CI | p-Value | HR | 95% CI | p-Value | HR | 95% CI | p-Value | ||||||
| Model 1 b | 1 | As a continuous (LnSDNN) | 1.44 | 0.59 | 3.55 | 0.423 | 0.35 | 0.19 | 0.66 | 0.001 | 1.12 | 0.35 | 3.54 | 0.851 | 2.46 | 0.64 | 9.42 | 0.188 |
| 2 | As a categorical variable: SDNN (≤30 vs. >30) | 1.61 | 0.64 | 4.05 | 0.316 | 1.99 | 1.03 | 3.84 | 0.039 | 1.36 | 0.45 | 4.14 | 0.584 | 1.96 | 0.35 | 10.95 | 0.441 | |
| 3 | As a continuous (LnRMSSD) | 2.06 | 1.01 | 4.21 | 0.048 | 0.54 | 0.31 | 0.92 | 0.024 | 2.02 | 0.81 | 5.03 | 0.133 | 2.92 | 0.92 | 9.29 | 0.069 | |
| 4 | As a categorical variable: RMSSD (≤20 vs. >20) | 0.80 | 0.34 | 1.91 | 0.615 | 1.87 | 0.94 | 3.70 | 0.074 | 0.64 | 0.23 | 1.79 | 0.392 | 0.82 | 0.18 | 3.71 | 0.795 | |
| 5 | As a continuous (LnLF) | 1.05 | 0.73 | 1.51 | 0.783 | 0.76 | 0.59 | 0.97 | 0.027 | 0.96 | 0.61 | 1.50 | 0.855 | 1.30 | 0.64 | 2.66 | 0.470 | |
| 6 | As a categorical variable: LF (≤380 vs. >380) | 1.01 | 0.36 | 2.80 | 0.988 | 1.31 | 0.62 | 2.74 | 0.479 | 1.13 | 0.31 | 4.11 | 0.852 | 0.42 | 0.07 | 2.73 | 0.366 | |
| 7 | As a continuous (LnHF) | 0.99 | 0.69 | 1.42 | 0.971 | 0.73 | 0.57 | 0.94 | 0.015 | 1.15 | 0.73 | 1.80 | 0.543 | 0.90 | 0.45 | 1.80 | 0.764 | |
| 8 | As a categorical variable: HF (≤168 vs. >168) | 0.71 | 0.28 | 1.77 | 0.460 | 1.29 | 0.63 | 2.64 | 0.492 | 0.66 | 0.22 | 1.98 | 0.453 | 0.54 | 0.09 | 3.26 | 0.502 | |
| 9 | As a continuous (LnLF/HF) | 1.09 | 0.71 | 1.67 | 0.708 | 1.04 | 0.77 | 1.42 | 0.786 | 0.78 | 0.47 | 1.32 | 0.358 | 1.70 | 0.72 | 4.00 | 0.228 | |
| 10 | As a categorical variable: LF/HF (≤3.5 vs. >3.5) | 0.95 | 0.40 | 2.26 | 0.901 | 1.02 | 0.56 | 1.85 | 0.954 | 1.34 | 0.42 | 4.28 | 0.621 | 0.77 | 0.17 | 3.53 | 0.740 | |
| Model 2 c | 11 | As a continuous (LnSDNN) | 1.70 | 0.64 | 4.52 | 0.290 | 0.35 | 0.19 | 0.67 | 0.002 | 1.04 | 0.30 | 3.66 | 0.947 | 3.18 | 0.75 | 13.47 | 0.117 |
| 12 | As a categorical variable: SDNN (≤30 vs. >30) | 1.61 | 0.62 | 4.18 | 0.332 | 2.02 | 1.03 | 3.96 | 0.041 | 1.40 | 0.44 | 4.41 | 0.568 | 1.94 | 0.30 | 12.57 | 0.485 | |
| 13 | As a continuous (LnRMSSD) | 2.17 | 1.03 | 4.59 | 0.043 | 0.55 | 0.31 | 0.96 | 0.035 | 2.30 | 0.88 | 5.98 | 0.089 | 3.51 | 1.03 | 12.02 | 0.046 | |
| 14 | As a categorical variable: RMSSD (≤20 vs. >20) | 0.79 | 0.33 | 1.91 | 0.600 | 1.92 | 0.96 | 3.87 | 0.067 | 0.57 | 0.20 | 1.68 | 0.310 | 0.55 | 0.09 | 3.42 | 0.519 | |
| 15 | As a continuous (LnLF) | 1.02 | 0.68 | 1.51 | 0.936 | 0.77 | 0.59 | 1.01 | 0.057 | 0.90 | 0.55 | 1.47 | 0.674 | 1.35 | 0.59 | 3.10 | 0.477 | |
| 16 | As a categorical variable: LF (≤380 vs. >380) | 1.03 | 0.36 | 2.91 | 0.960 | 1.21 | 0.57 | 2.58 | 0.620 | 1.19 | 0.32 | 4.41 | 0.790 | 0.29 | 0.03 | 2.67 | 0.272 | |
| 17 | As a continuous (LnHF) | 1.03 | 0.70 | 1.53 | 0.880 | 0.74 | 0.57 | 0.96 | 0.026 | 1.19 | 0.73 | 1.93 | 0.482 | 0.89 | 0.41 | 1.95 | 0.774 | |
| 18 | As a categorical variable: HF (≤168 vs. >168) | 0.62 | 0.24 | 1.61 | 0.330 | 1.28 | 0.61 | 2.66 | 0.517 | 0.62 | 0.19 | 1.96 | 0.412 | 0.46 | 0.06 | 3.35 | 0.445 | |
| 19 | As a continuous (LnLF/HF) | 0.98 | 0.62 | 1.56 | 0.932 | 1.08 | 0.79 | 1.48 | 0.617 | 0.70 | 0.40 | 1.22 | 0.207 | 1.72 | 0.67 | 4.43 | 0.261 | |
| 20 | As a categorical variable: LF/HF (≤3.5 vs. >3.5) | 0.95 | 0.39 | 2.31 | 0.901 | 0.91 | 0.50 | 1.67 | 0.762 | 1.44 | 0.45 | 4.63 | 0.543 | 0.79 | 0.15 | 4.09 | 0.779 | |
Publisher’s Note: MDPI stays neutral with regard to jurisdictional claims in published maps and institutional affiliations. |
© 2021 by the authors. Licensee MDPI, Basel, Switzerland. This article is an open access article distributed under the terms and conditions of the Creative Commons Attribution (CC BY) license (https://creativecommons.org/licenses/by/4.0/).
Share and Cite
Wang, Y.-C.; Wang, C.-C.; Yao, Y.-H.; Wu, W.-T. Identification of a High-Risk Group of New-Onset Cardiovascular Disease in Occupational Drivers by Analyzing Heart Rate Variability. Int. J. Environ. Res. Public Health 2021, 18, 11486. https://doi.org/10.3390/ijerph182111486
Wang Y-C, Wang C-C, Yao Y-H, Wu W-T. Identification of a High-Risk Group of New-Onset Cardiovascular Disease in Occupational Drivers by Analyzing Heart Rate Variability. International Journal of Environmental Research and Public Health. 2021; 18(21):11486. https://doi.org/10.3390/ijerph182111486
Chicago/Turabian StyleWang, Ying-Chuan, Chung-Ching Wang, Ya-Hsin Yao, and Wei-Te Wu. 2021. "Identification of a High-Risk Group of New-Onset Cardiovascular Disease in Occupational Drivers by Analyzing Heart Rate Variability" International Journal of Environmental Research and Public Health 18, no. 21: 11486. https://doi.org/10.3390/ijerph182111486
APA StyleWang, Y.-C., Wang, C.-C., Yao, Y.-H., & Wu, W.-T. (2021). Identification of a High-Risk Group of New-Onset Cardiovascular Disease in Occupational Drivers by Analyzing Heart Rate Variability. International Journal of Environmental Research and Public Health, 18(21), 11486. https://doi.org/10.3390/ijerph182111486