
Snacking on Almonds Lowers Glycaemia and Energy Intake Compared to a Popular High-Carbohydrate Snack Food: An Acute Randomised Crossover Study


Abstract
:1. Introduction
2. Materials and Methods
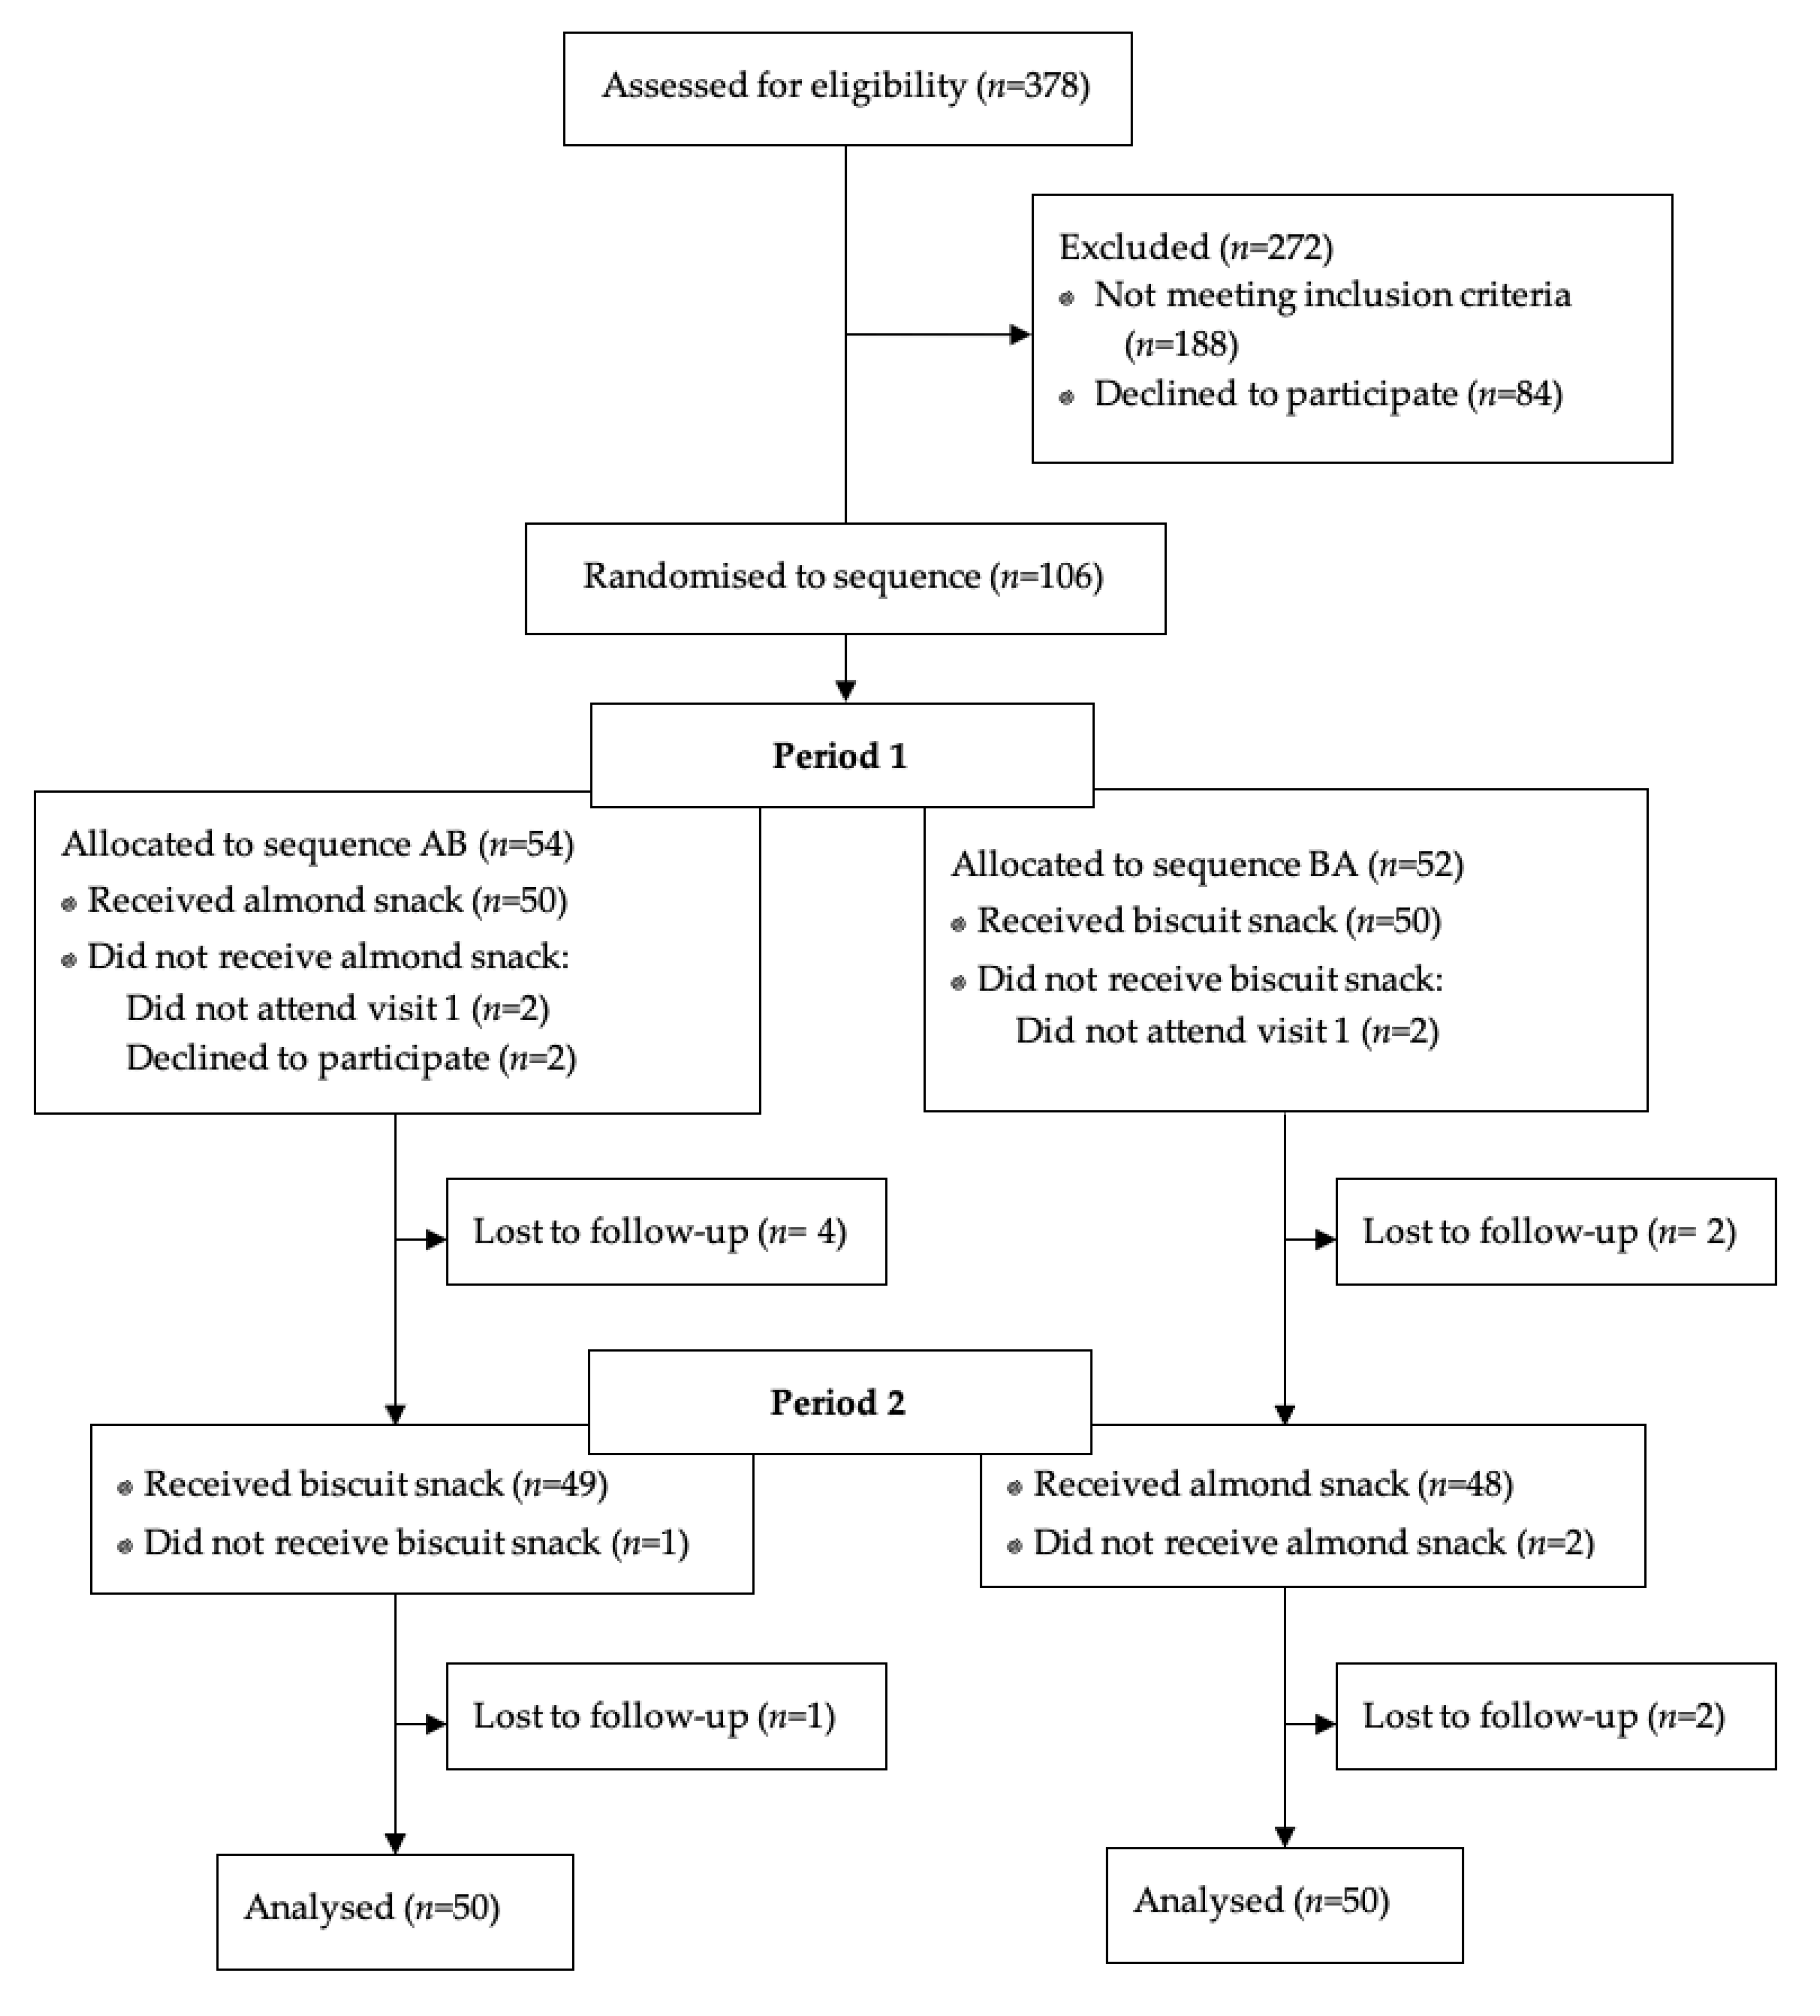
2.1. Study Design
2.2. Participants
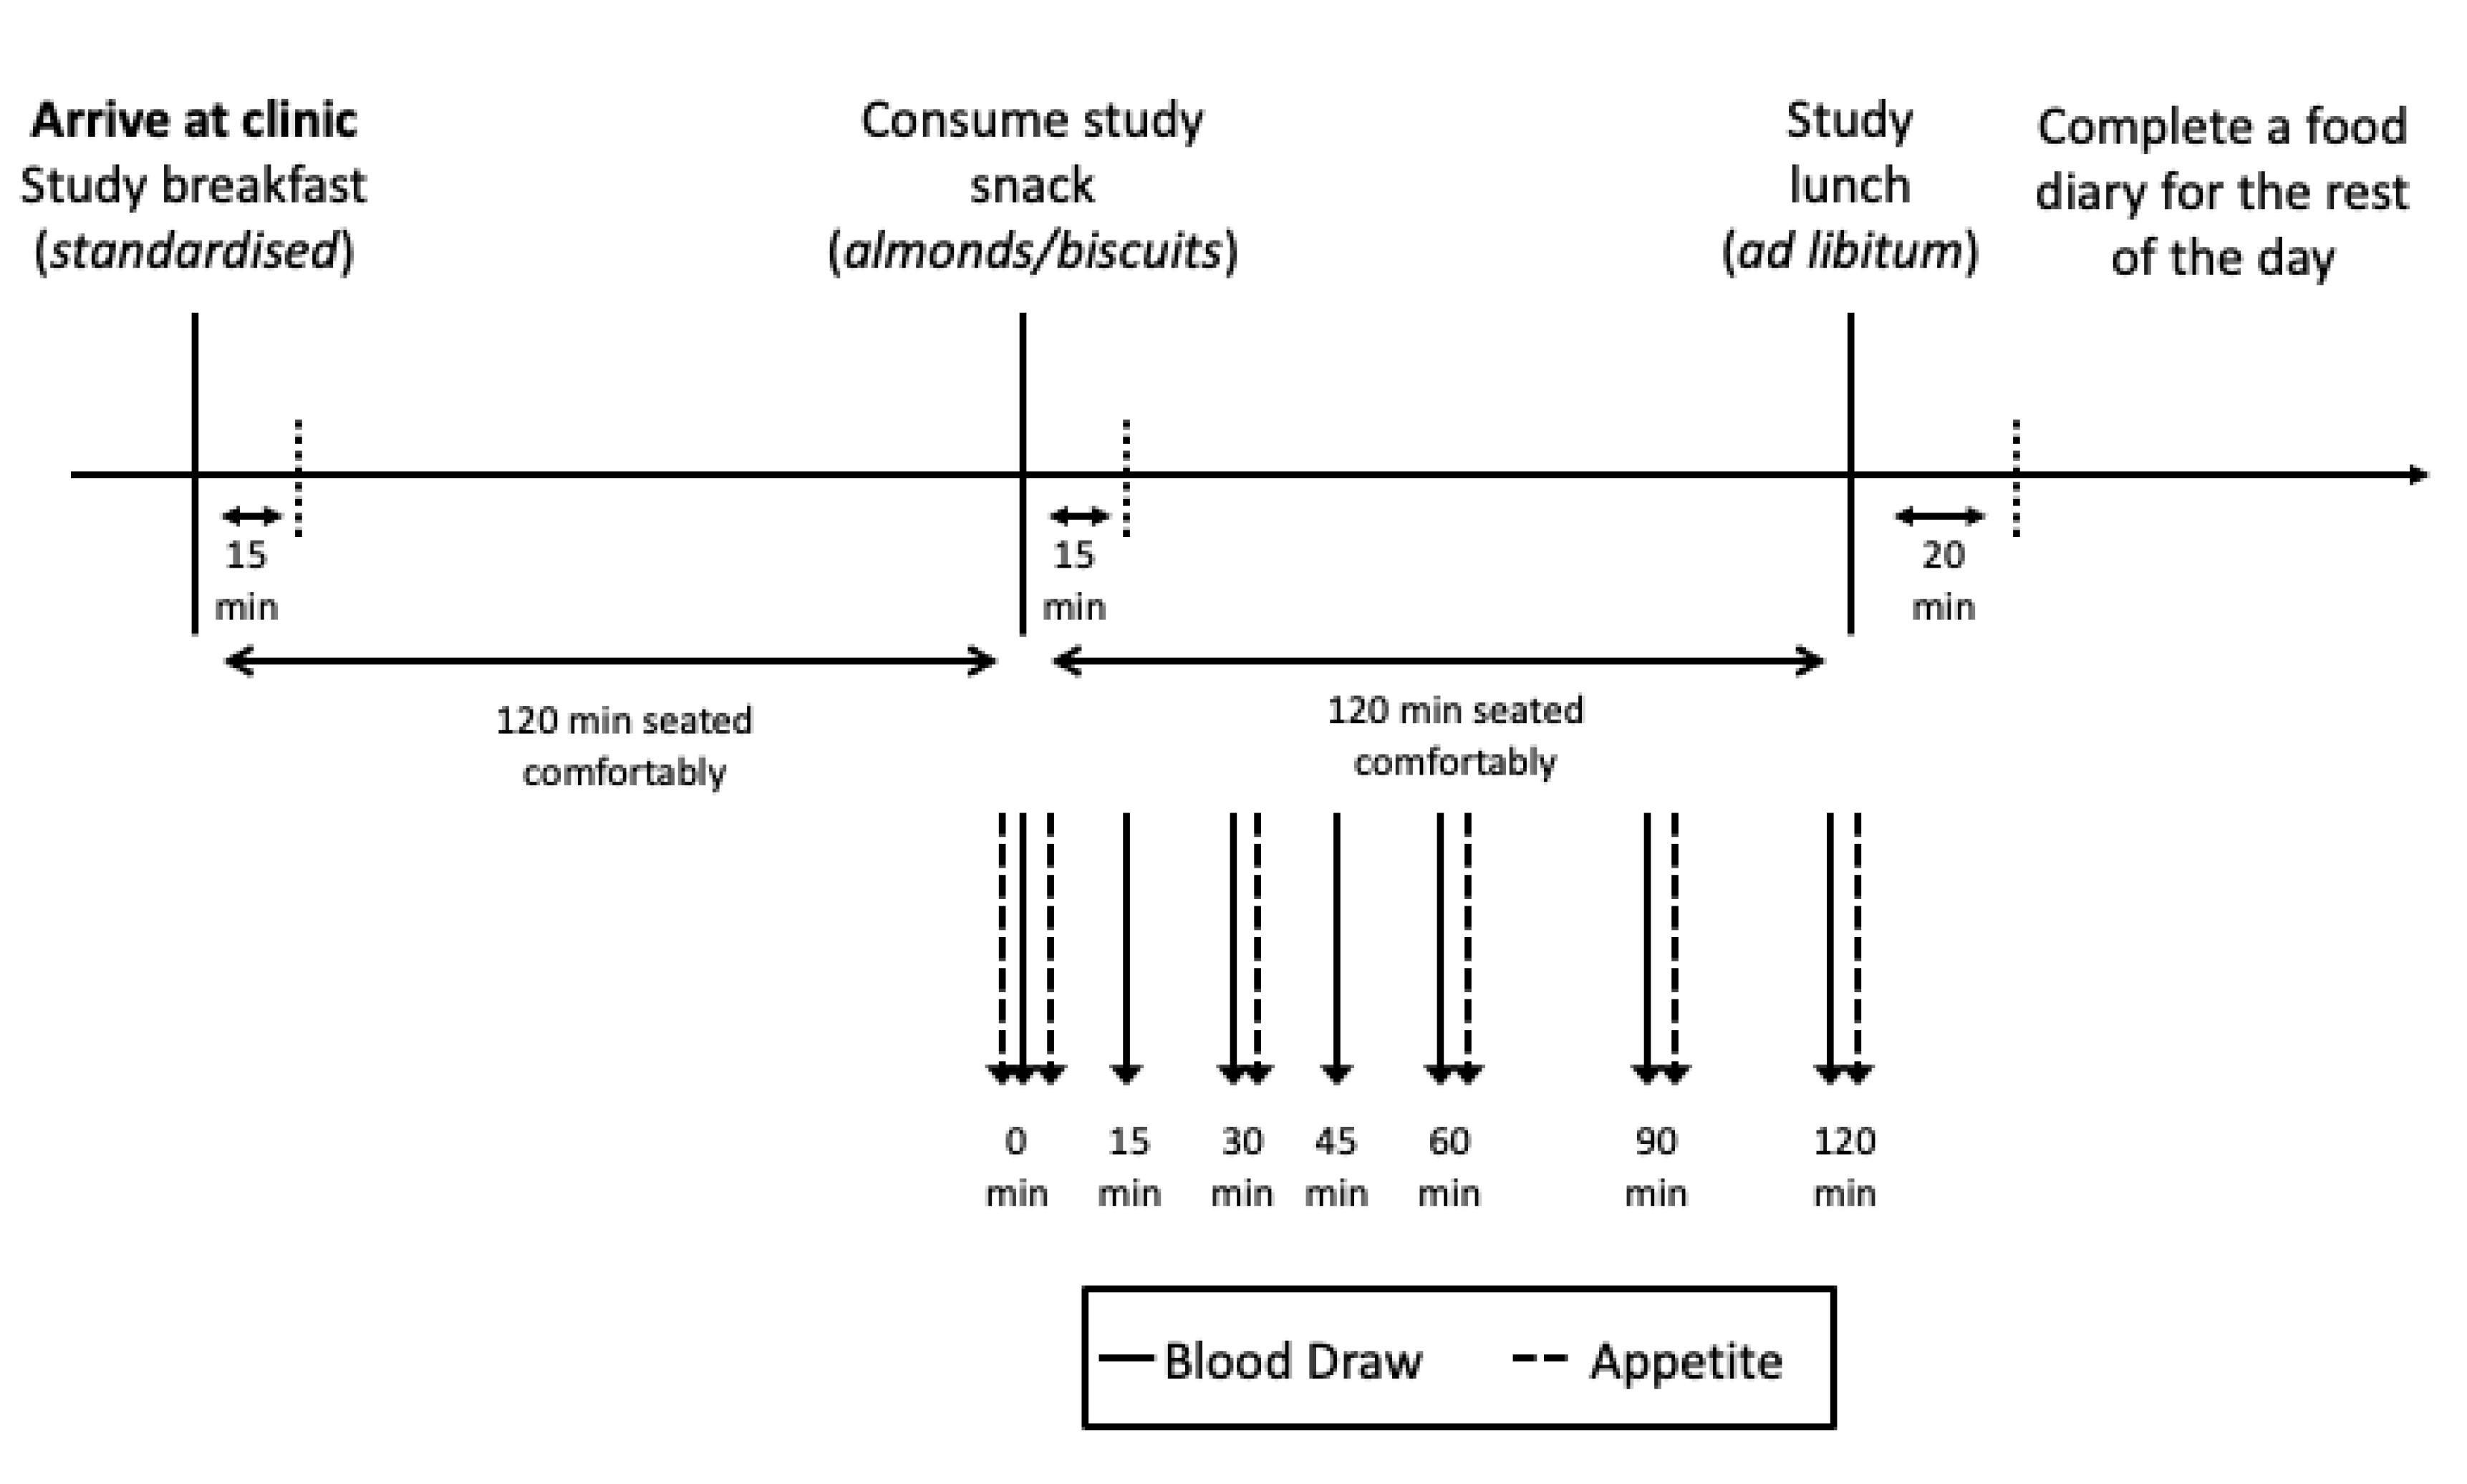
2.3. Study Protocol
2.4. Preload Breakfast
2.5. Test Snack Foods
2.6. Glycaemic Response Protocol
2.7. Satiety Testing Protocol
2.8. Ad Libitum Lunch
2.9. Dietary Assessment
2.10. Sample Size and Statistical Analysis
3. Results
3.1. Participants
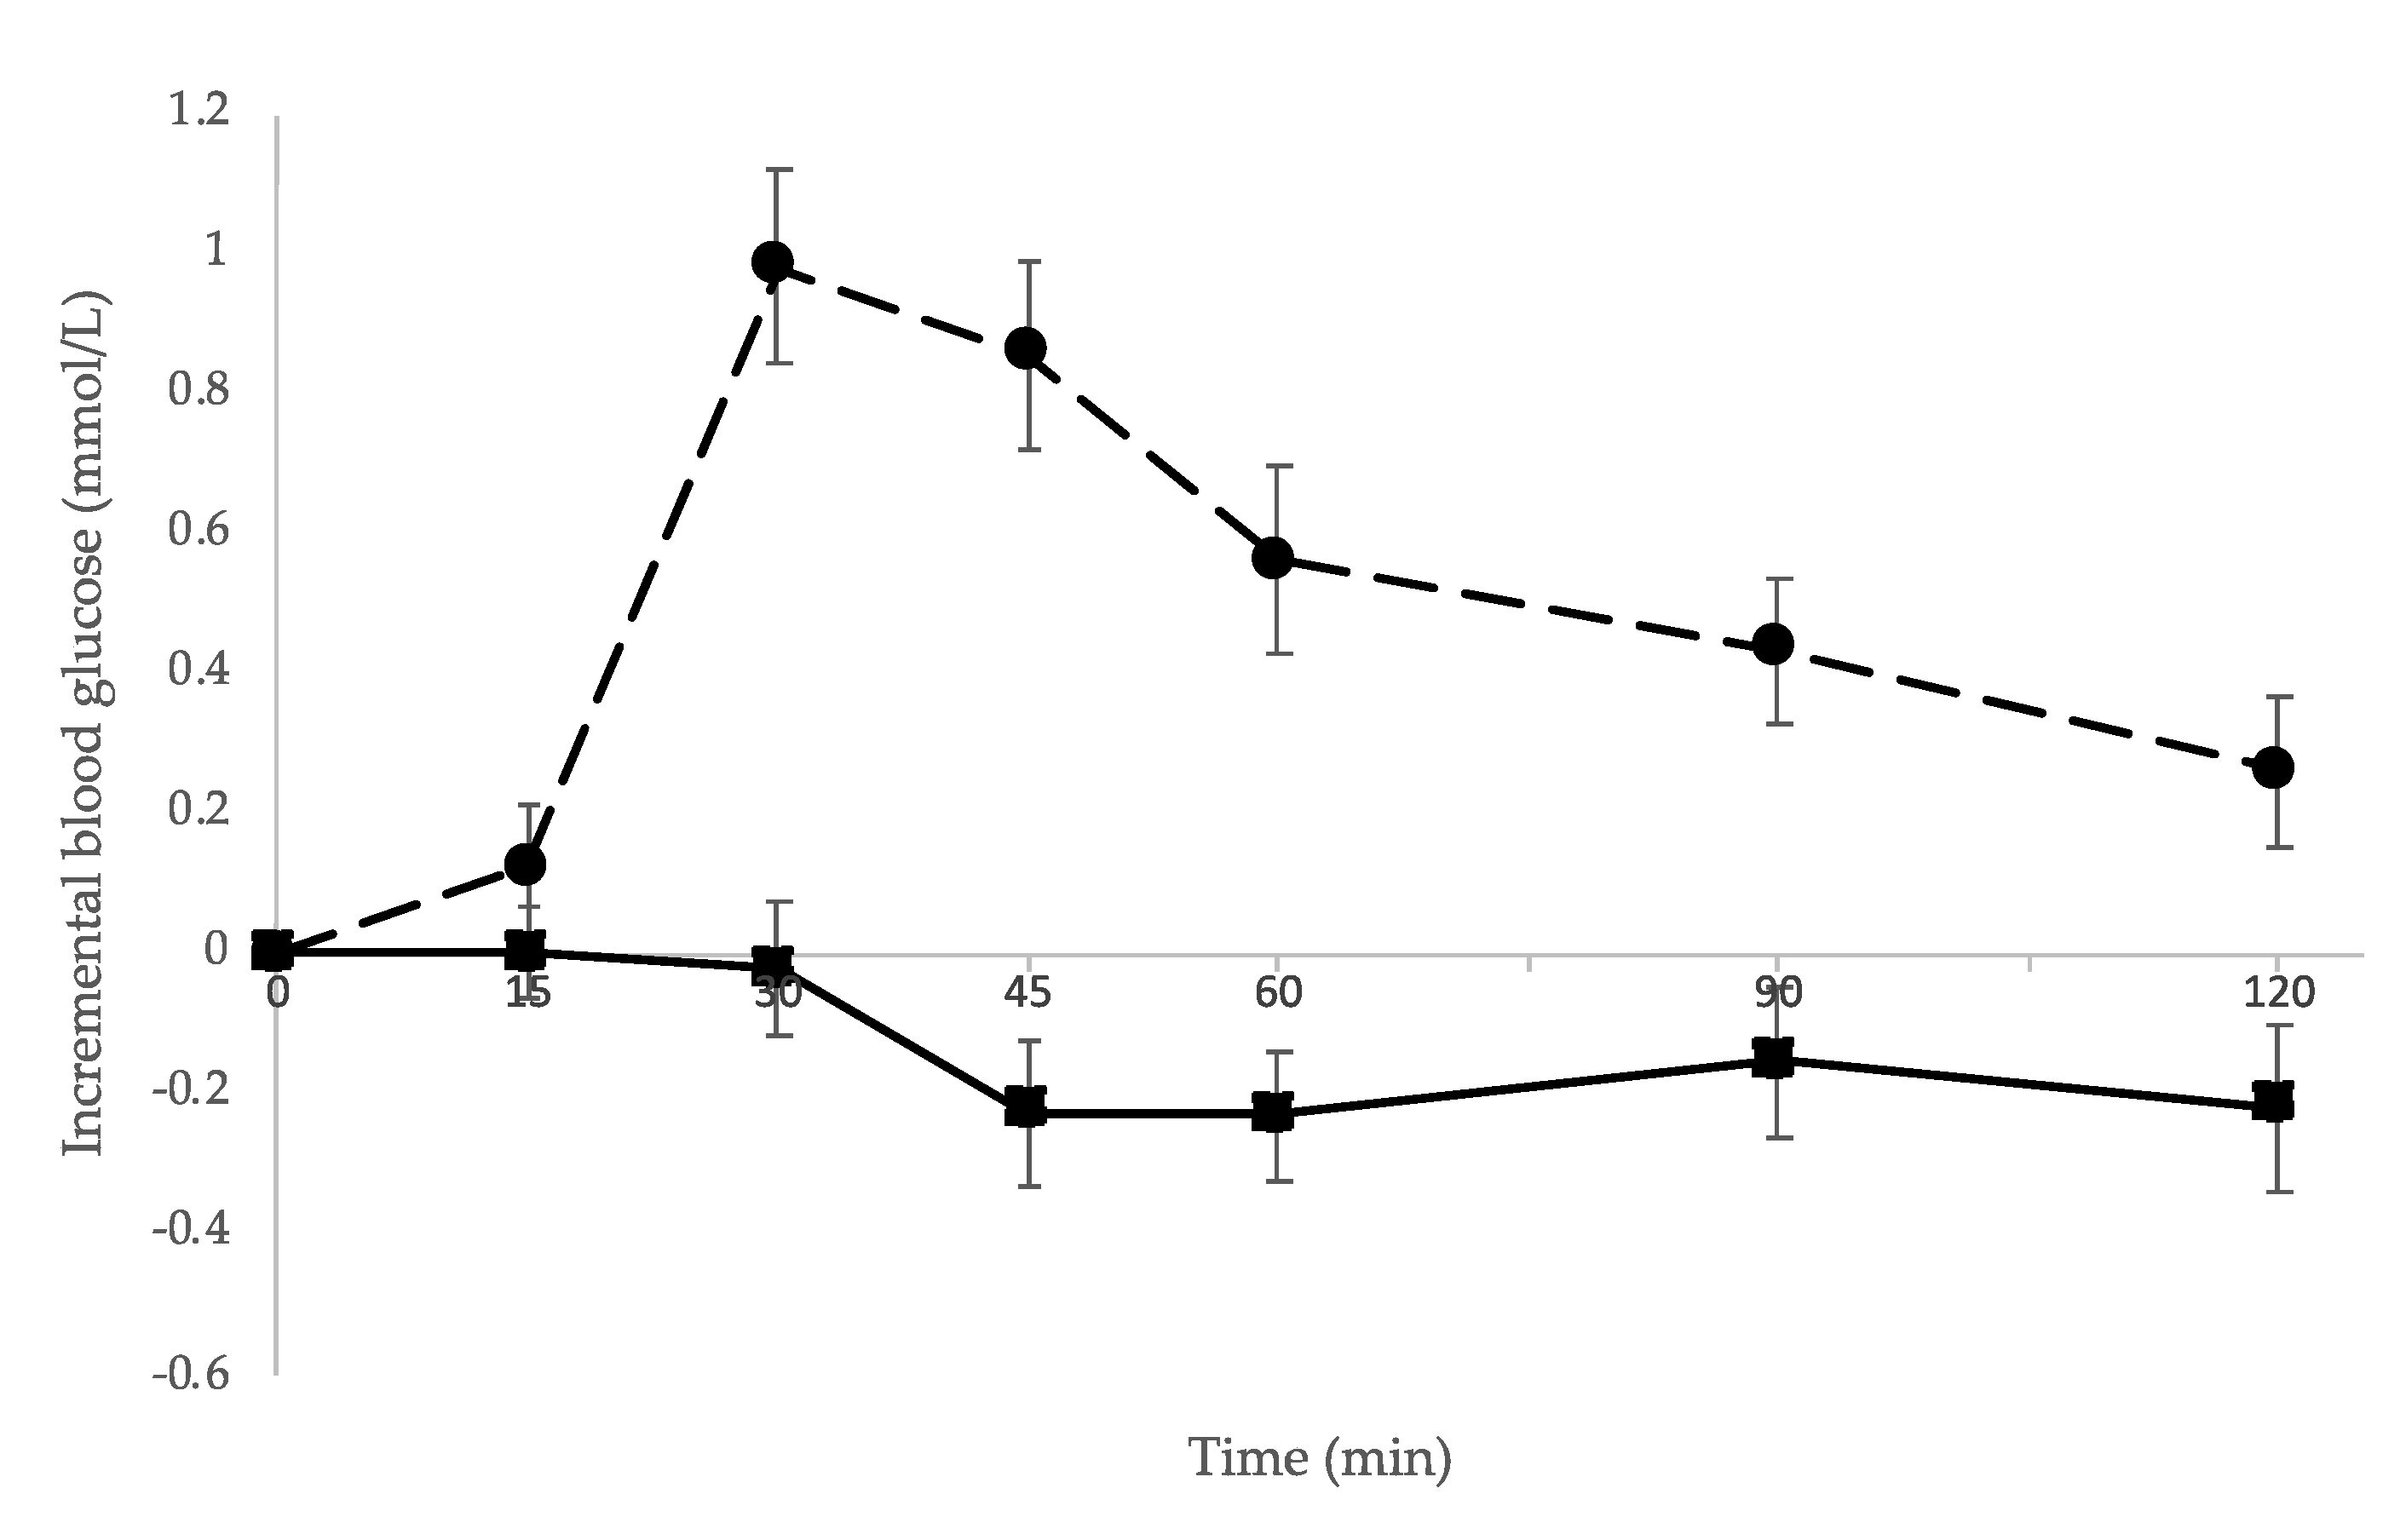
3.2. Glycaemic Response
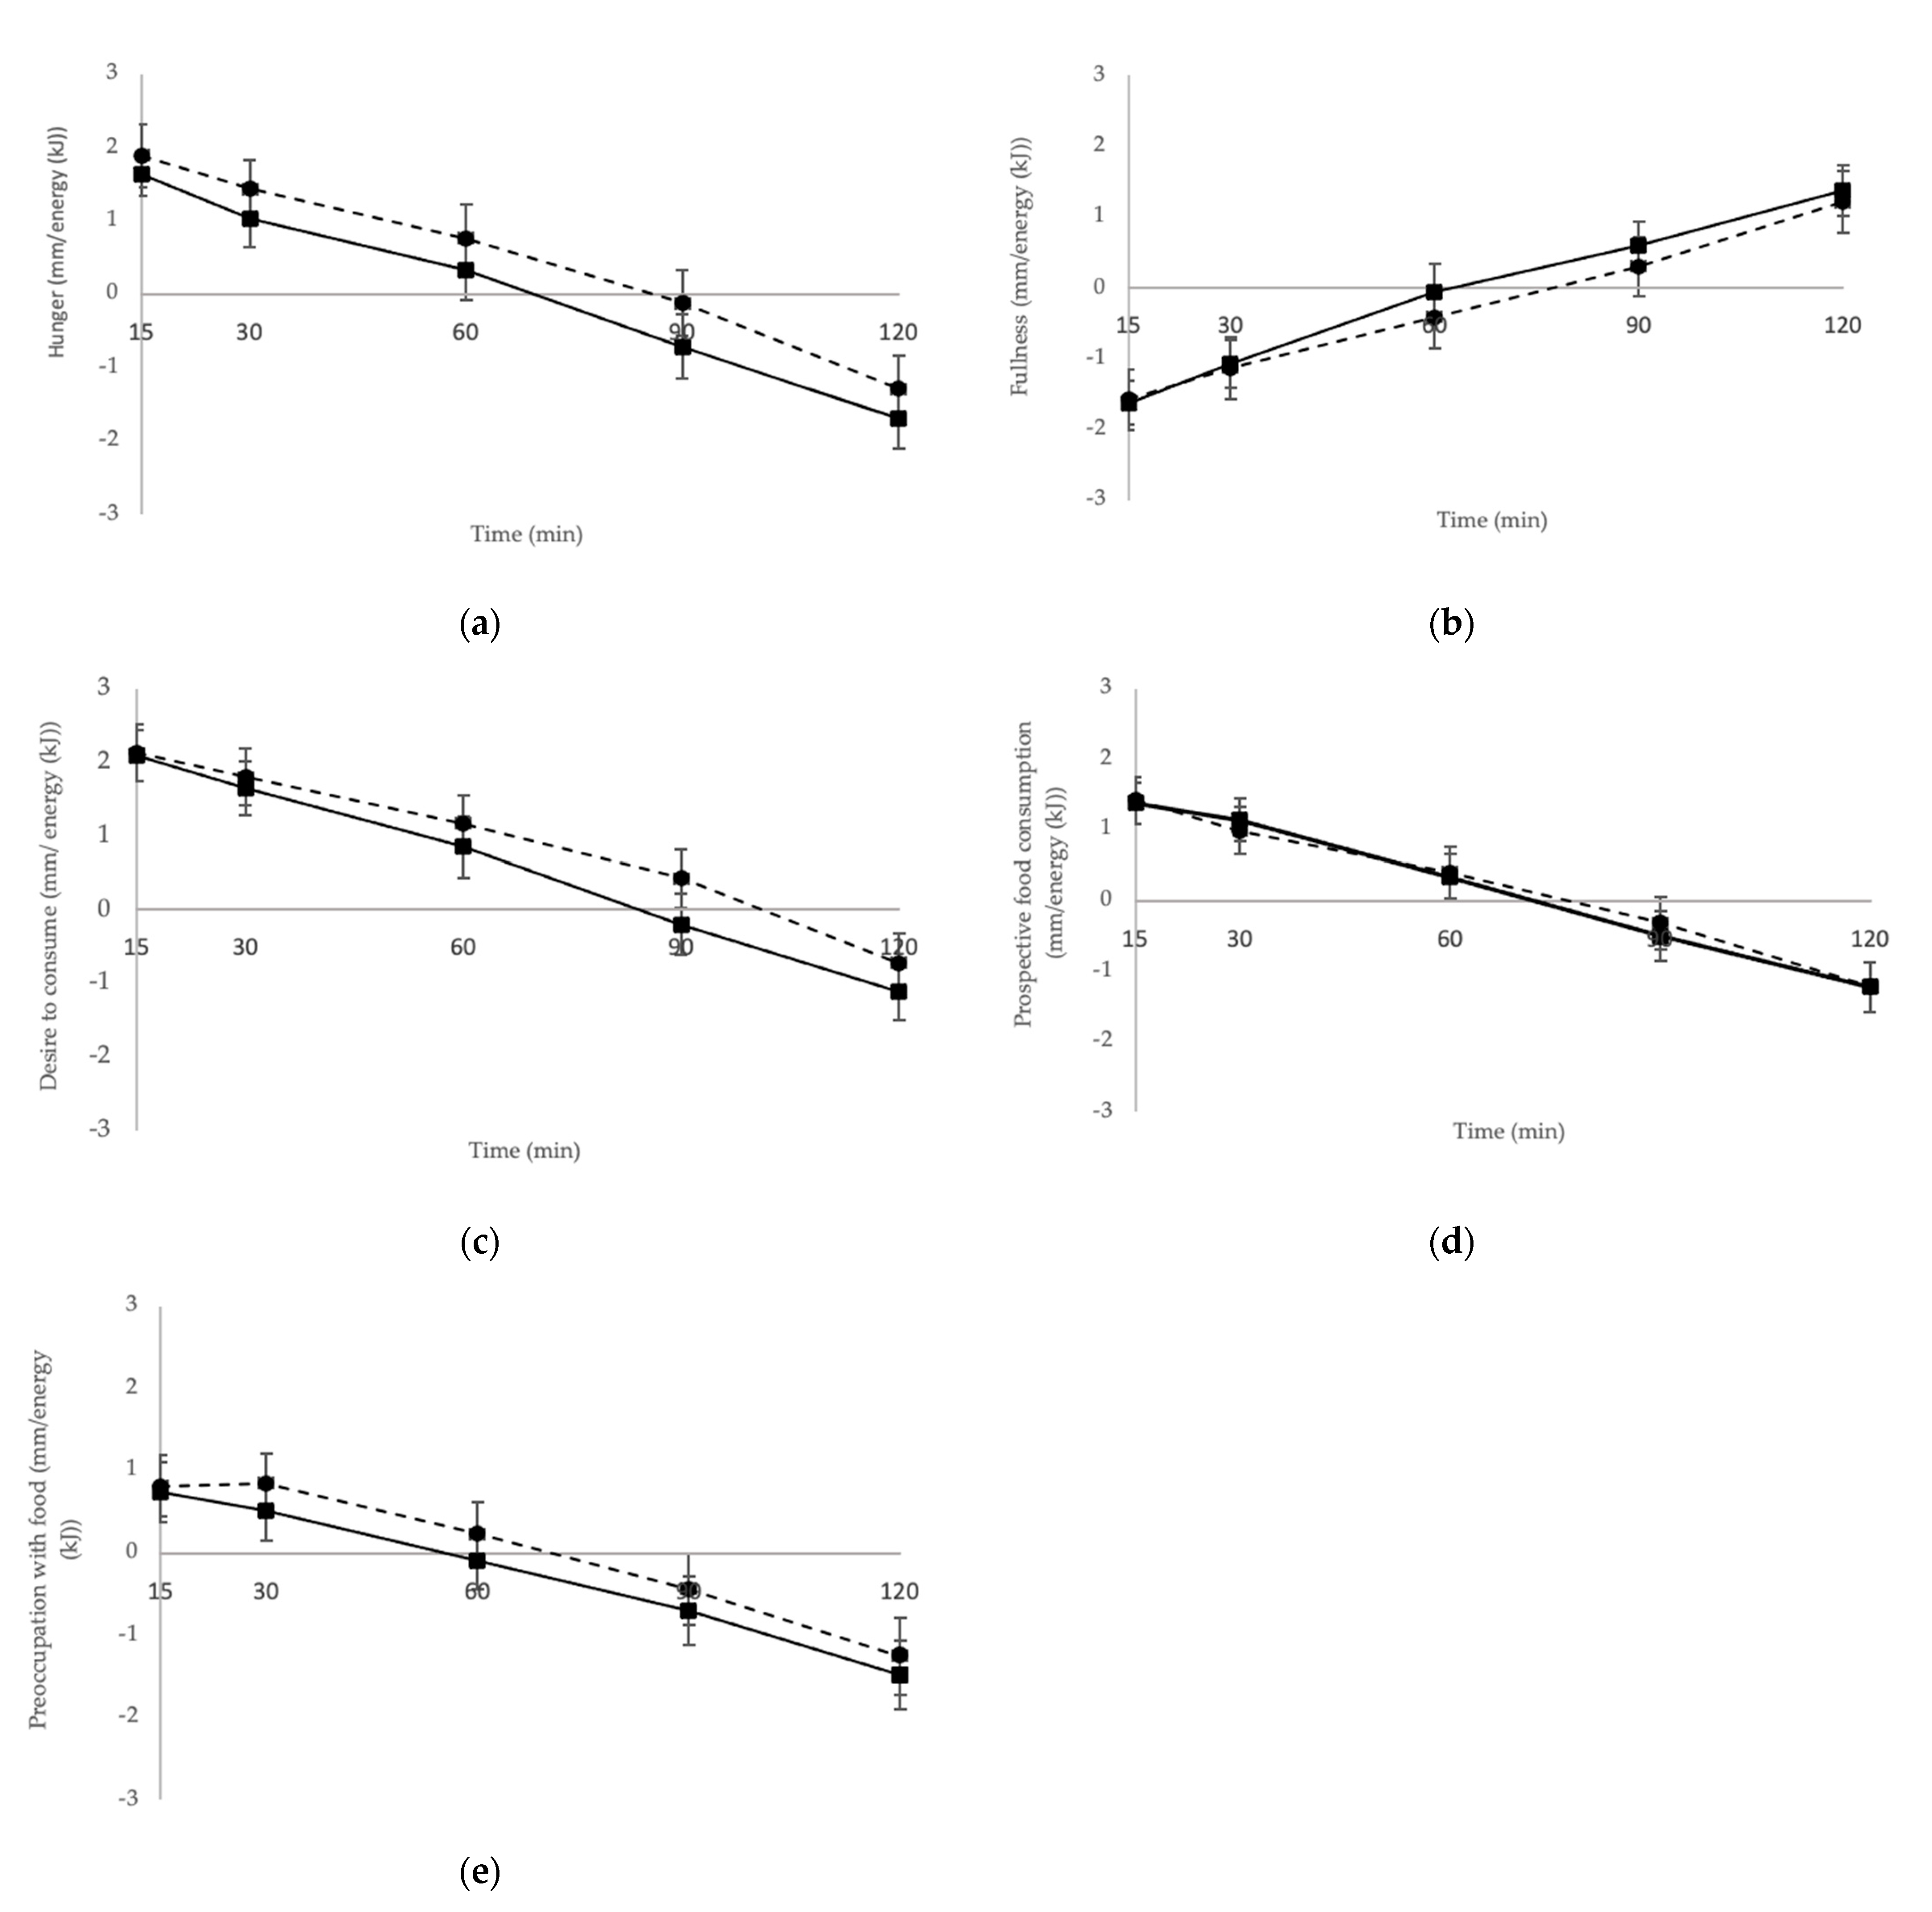
3.3. Appetite Ratings
3.3.1. Area under the Curve for Appetite
3.3.2. Appetite Scores
3.3.3. Satiety Quotient
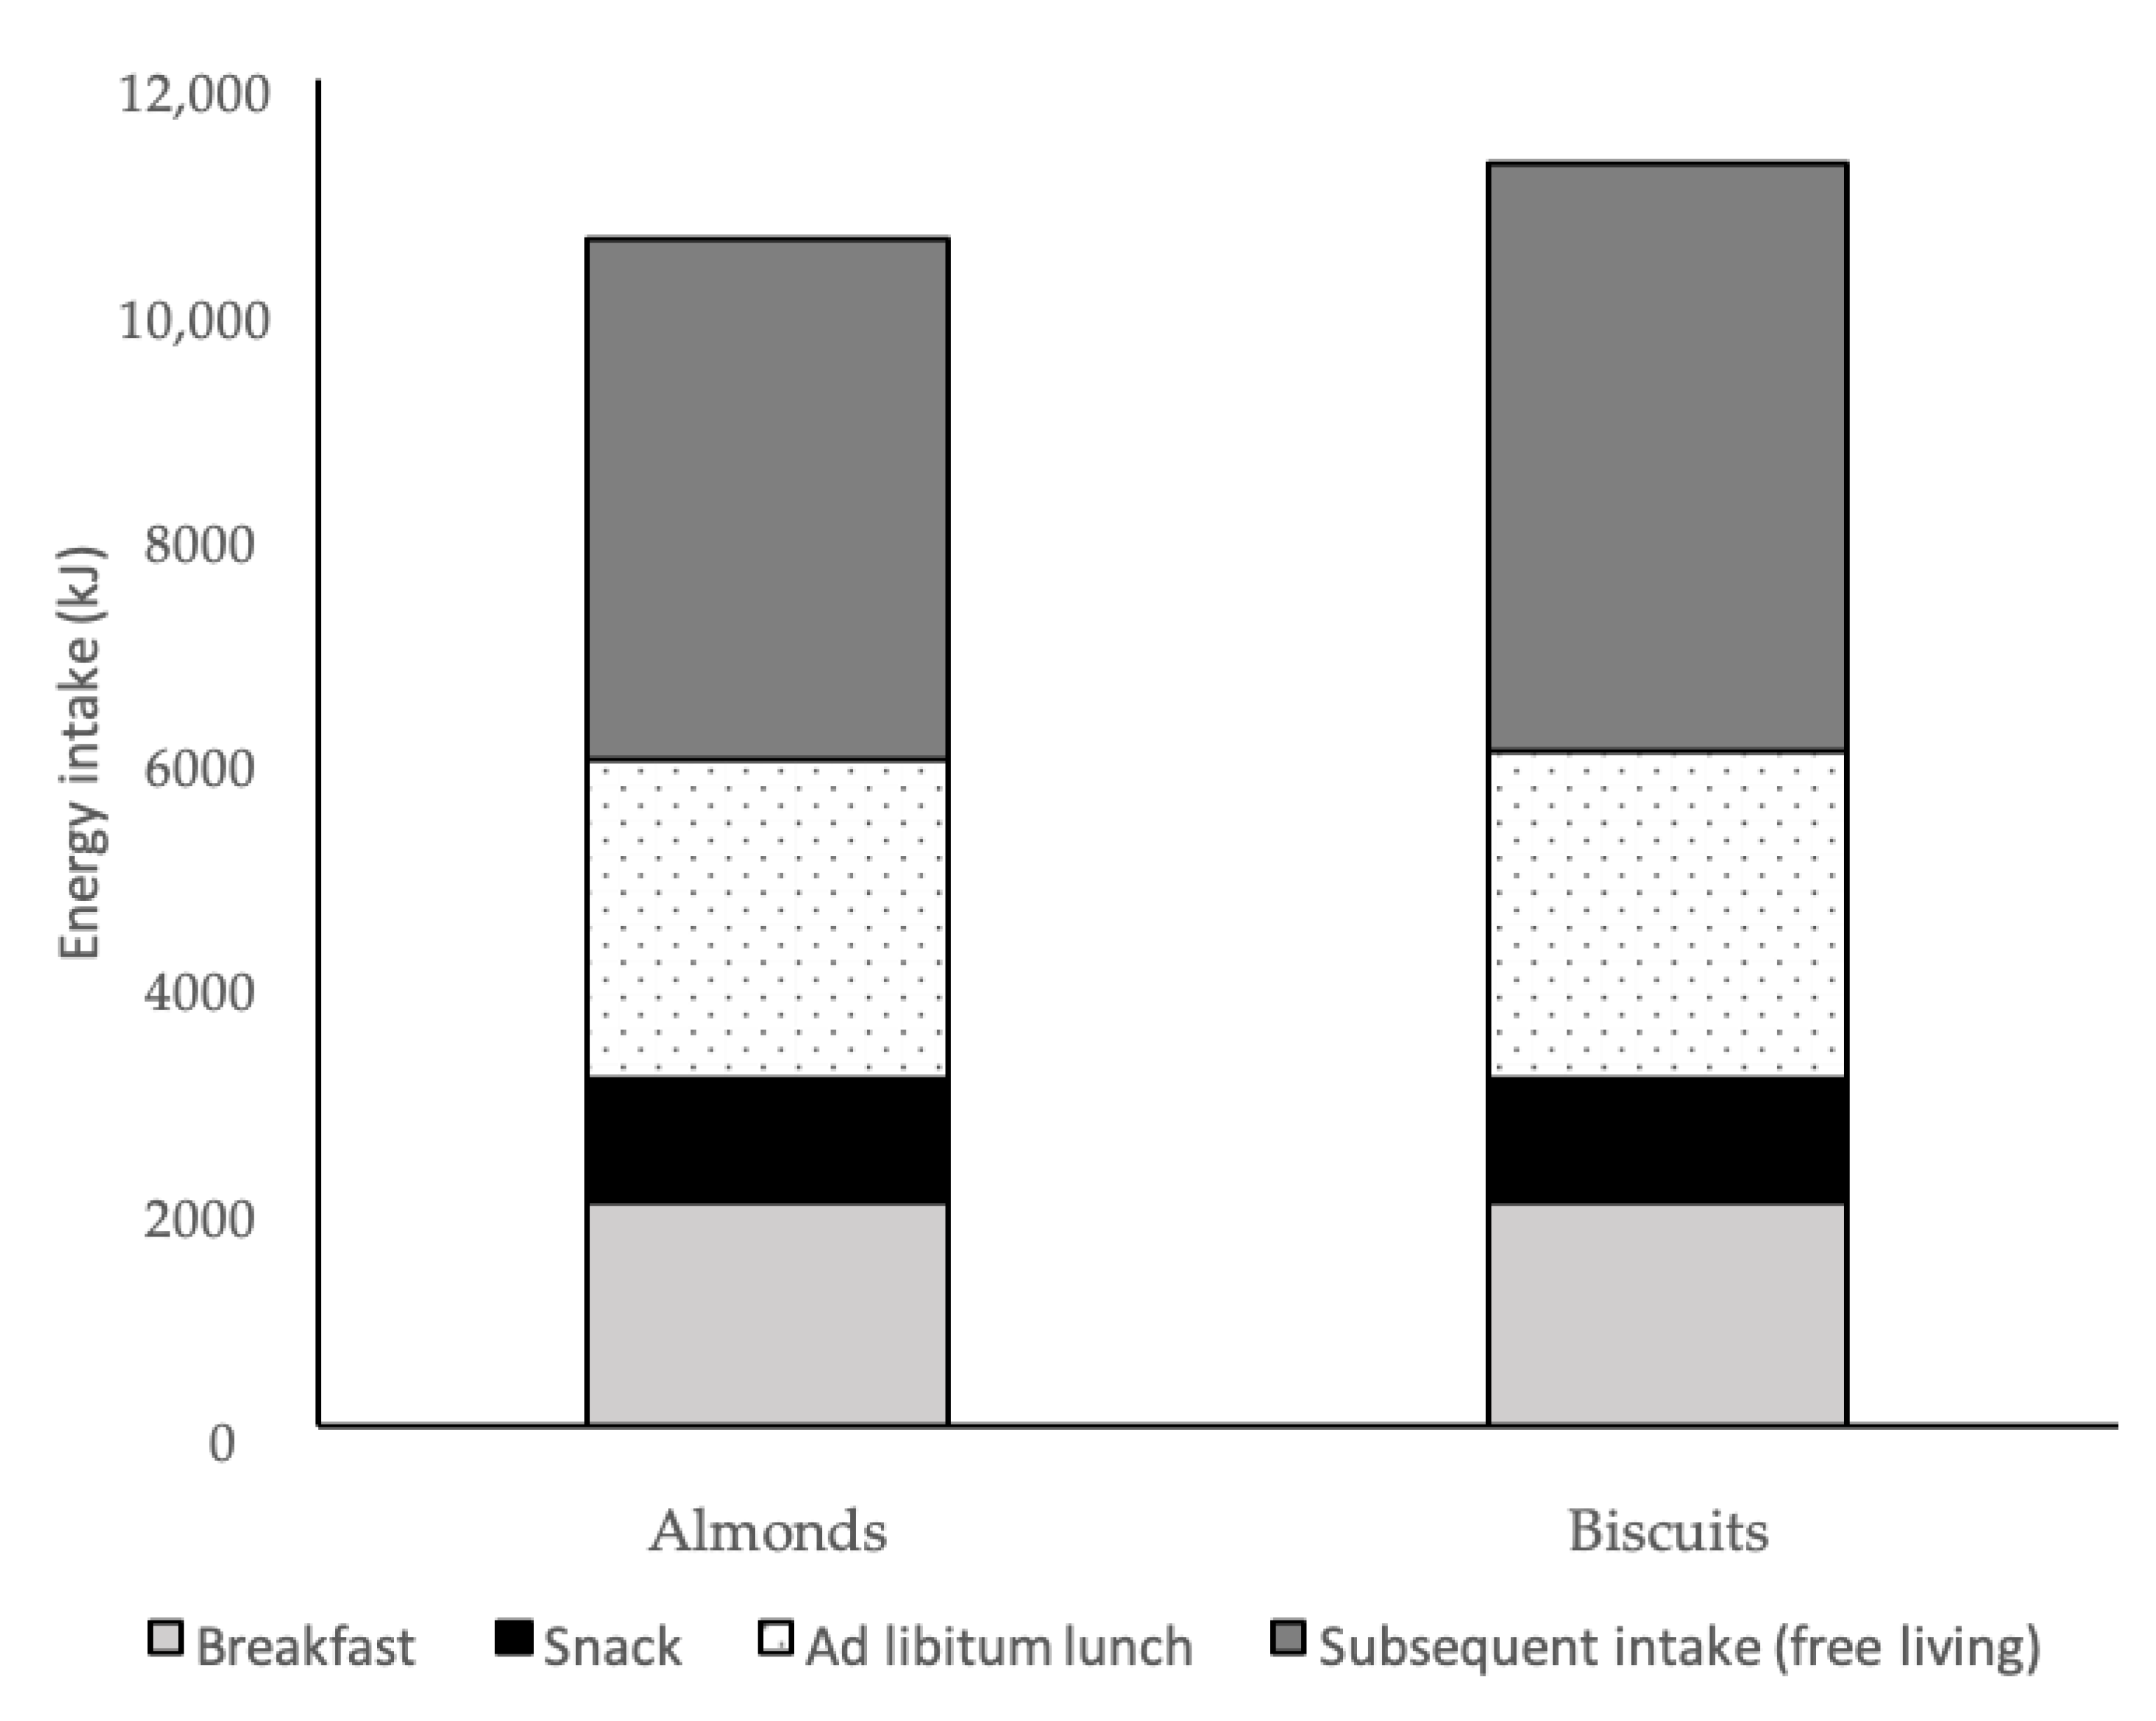
3.4. Energy and Nutrient Intakes
4. Discussion
5. Conclusions
Supplementary Materials
Author Contributions
Funding
Institutional Review Board Statement
Informed Consent Statement
Data Availability Statement
Acknowledgments
Conflicts of Interest
References
- King, J.C.; Blumberg, J.; Ingwersen, L.; Jenab, M.; Tucker, K.L. Tree nuts and peanuts as components of a healthy diet. J. Nutr. 2008, 138, S1736–S1740. [Google Scholar] [CrossRef]
- Pearson, K.R.; Tey, S.L.; Gray, A.R.; Chisholm, A.; Brown, R.C. Energy compensation and nutrient displacement following regular consumption of hazelnuts and other energy-dense snack foods in non-obese individuals. Eur. J. Nutr. 2017, 56, 1255–1267. [Google Scholar] [CrossRef]
- Piernas, C.; Popkin, B.M. Snacking increased among U.S. adults between 1977 and 2006. J. Nutr. 2010, 140, 325–332. [Google Scholar] [CrossRef] [Green Version]
- Rehm, C.D.; Drewnowski, A. Replacing American snacks with tree nuts increases consumption of key nutrients among US children and adults: Results of an NHANES modeling study. Nutr. J. 2017, 16, 17. [Google Scholar] [CrossRef] [Green Version]
- Tey, S.L.; Brown, R.; Gray, A.; Chisholm, A.; Delahunty, C. Nuts improve diet quality compared to other energy-dense snacks while maintaining body weight. J. Nutr. Metab. 2011, 2011, 357350. [Google Scholar] [CrossRef]
- Bes-Rastrollo, M.; Sabate, J.; Gomez-Gracia, E.; Alonso, A.; Martinez, J.A.; Martinez-Gonzalez, M.A. Nut consumption and weight gain in a Mediterranean cohort: The SUN Study. Obesity 2007, 15, 107–116. [Google Scholar] [CrossRef]
- Bes-Rastrollo, M.; Wedick, N.M.; Martinez-Gonzalez, M.A.; Li, T.Y.; Sampson, L.; Hu, F.B. Prospective study of nut consumption, long-term weight change, and obesity risk in women. Am. J. Clin. Nutr. 2009, 89, 1913–1919. [Google Scholar] [CrossRef]
- Brown, R.C.; Tey, S.L.; Gray, A.R.; Chisholm, A.; Smith, C.; Fleming, E.; Parnell, W. Association of Nut Consumption with Cardiometabolic Risk Factors in the 2008/2009 New Zealand Adult Nutrition Survey. Nutrients 2015, 7, 7523–7542. [Google Scholar] [CrossRef] [Green Version]
- Martinez-Gonzalez, M.A.; Bes-Rastrollo, M. Nut consumption, weight gain and obesity: Epidemiological evidence. Nutr. Metab. Cardiovasc. Dis. 2011, 21, S40–S45. [Google Scholar] [CrossRef]
- Mozaffarian, D.; Hao, T.; Rimm, E.B.; Willett, W.C.; Hu, F.B. Changes in diet and lifestyle and long-term weight gain in women and men. N. Engl. J. Med. 2011, 364, 2392–2404. [Google Scholar] [CrossRef] [Green Version]
- O’Neil, C.E.; Fulgoni, V.L.; Nicklas, T.A. Tree Nut consumption is associated with better adiposity measures and cardiovascular and metabolic syndrome health risk factors in U.S. Adults: NHANES 2005-2010. Nutr. J. 2015, 14, 64. [Google Scholar] [CrossRef] [Green Version]
- Alper, C.M.; Mattes, R.D. Effects of chronic peanut consumption on energy balance and hedonics. Int. J. Obes. Relat. Metab. Disord. 2002, 26, 1129–1137. [Google Scholar] [CrossRef] [Green Version]
- Fraser, G.E.; Bennett, H.W.; Jaceldo, K.B.; Sabate, J. Effect on body weight of a free 76 kilojoule (320 calorie) daily supplement of almonds for six months. J. Am. Coll. Nutr. 2002, 21, 275–283. [Google Scholar] [CrossRef]
- Hollis, J.; Mattes, R. Effect of chronic consumption of almonds on body weight in healthy humans. Br. J. Nutr. 2007, 98, 651–656. [Google Scholar] [CrossRef]
- Sabate, J.; Cordero-MacIntyre, Z.; Siapco, G.; Torabian, S.; Haddad, E. Does regular walnut consumption lead to weight gain? Br. J. Nutr. 2005, 94, 859–864. [Google Scholar] [CrossRef] [Green Version]
- Mela, D.J. Eating for pleasure or just wanting to eat? Reconsidering sensory hedonic responses as a driver of obesity. Appetite 2006, 47, 10–17. [Google Scholar] [CrossRef]
- Cassady, B.A.; Hollis, J.H.; Fulford, A.D.; Considine, R.V.; Mattes, R.D. Mastication of almonds: Effects of lipid bioaccessibility, appetite, and hormone response. Am. J. Clin. Nutr. 2009, 89, 794–800. [Google Scholar] [CrossRef] [Green Version]
- Coelho, S.B.; de Sales, R.L.; Iyer, S.S.; Bressan, J.; Costa, N.M.B.; Lokko, P.; Mattes, R. Effects of peanut oil load on energy expenditure, body composition, lipid profile, and appetite in lean and overweight adults. Nutrition 2006, 22, 585–592. [Google Scholar] [CrossRef]
- Frecka, J.M.; Hollis, J.H.; Mattes, R.D. Effects of appetite, BMI, food form and flavor on mastication: Almonds as a test food. Eur. J. Clin. Nutr. 2008, 62, 1231–1238. [Google Scholar] [CrossRef] [Green Version]
- Iyer, S.S.; Boateng, L.A.; Sales, R.L.; Coelho, S.B.; Lokko, P.; Monteiro, J.B.R.; Costa, N.M.B.; Mattes, R.D. Effects of peanut oil consumption on appetite and food choice. Int. J. Obes. 2006, 30, 704–710. [Google Scholar] [CrossRef] [Green Version]
- McKiernan, F.; Lokko, P.; Kuevi, A.; Sales, R.L.; Costa, N.M.; Bressan, J.; Alfenas, R.C.; Mattes, R.D. Effects of peanut processing on body weight and fasting plasma lipids. Br. J. Nutr. 2010, 104, 418–426. [Google Scholar] [CrossRef]
- Smeets, P.A.; Erkner, A.; de Graaf, C. Cephalic phase responses and appetite. Nutr. Rev. 2010, 68, 643–655. [Google Scholar] [CrossRef]
- Wien, M.A.; Sabaté, J.M.; Iklé, D.N.; Cole, S.E.; Kandeel, F.R. Almonds vs complex carbohydrates in a weight reduction program. Int. J. Obes. Relat. Metab. Disord. 2003, 27, 1365–1372. [Google Scholar] [CrossRef] [Green Version]
- Akhlaghi, M.; Ghobadi, S.; Zare, M.; Foshati, S. Effect of nuts on energy intake, hunger, and fullness, a systematic review and meta-analysis of randomized clinical trials. Crit. Rev. Food Sci. Nutr. 2020, 60, 84–93. [Google Scholar] [CrossRef]
- Tan, S.Y.; Dhillon, J.; Mattes, R.D. A review of the effects of nuts on appetite, food intake, metabolism, and body weight. Am. J. Clin. Nutr. 2014, 100, S412–S422. [Google Scholar] [CrossRef] [Green Version]
- Tan, S.Y.; Mattes, R.D. Appetitive, dietary and health effects of almonds consumed with meals or as snacks: A randomized, controlled trial. Eur. J. Clin. Nutr. 2013, 67, 1205–1214. [Google Scholar] [CrossRef] [Green Version]
- Anderson, G.H.; Woodend, D. Effect of glycemic carbohydrates on short-term satiety and food intake. Nutr. Rev. 2003, 61, S17–S26. [Google Scholar] [CrossRef]
- Augustin, L.S.; Kendall, C.W.; Jenkins, D.J.; Willett, W.C.; Astrup, A.; Barclay, A.W.; Bjorck, I.; Brand-Miller, J.C.; Brighenti, F.; Buyken, A.E.; et al. Glycemic index, glycemic load and glycemic response: An International Scientific Consensus Summit from the International Carbohydrate Quality Consortium (ICQC). Nutr. Metab. Cardiovasc. Dis. 2015, 25, 795–815. [Google Scholar] [CrossRef] [Green Version]
- Niwano, Y.; Adachi, T.; Kashimura, J.; Sakata, T.; Sasaki, H.; Sekine, K.; Yamamoto, S.; Yonekubo, A.; Kimura, S. Is glycemic index of food a feasible predictor of appetite, hunger, and satiety? J. Nutr. Sci. Vitaminol. 2009, 55, 201–207. [Google Scholar] [CrossRef] [Green Version]
- Roberts, S.B. High-glycemic index foods, hunger, and obesity: Is there a connection? Nutr. Rev. 2000, 58, 163–169. [Google Scholar] [CrossRef]
- Kim, Y.; Keogh, J.B.; Clifton, P.M. Benefits of Nut Consumption on Insulin Resistance and Cardiovascular Risk Factors: Multiple Potential Mechanisms of Actions. Nutrients 2017, 9, 1271. [Google Scholar] [CrossRef] [Green Version]
- Viguiliouk, E.; Kendall, C.W.; Blanco Mejia, S.; Cozma, A.I.; Ha, V.; Mirrahimi, A.; Jayalath, V.H.; Augustin, L.S.; Chiavaroli, L.; Leiter, L.A.; et al. Effect of tree nuts on glycemic control in diabetes: A systematic review and meta-analysis of randomized controlled dietary trials. PLoS ONE 2014, 9, e103376. [Google Scholar] [CrossRef]
- Tindall, A.M.; Johnston, E.A.; Kris-Etherton, P.M.; Petersen, K.S. The effect of nuts on markers of glycemic control: A systematic review and meta-analysis of randomized controlled trials. Am. J. Clin. Nutr. 2019, 109, 297–314. [Google Scholar] [CrossRef]
- Kendall, C.W.C.; Josse, A.R.; Esfahani, A.; Jenkins, D.J.A. The impact of pistachio intake alone or in combination with high-carbohydrate foods on post-prandial glycemia. Eur. J. Clin. Nutr. 2011, 65, 696–702. [Google Scholar] [CrossRef] [Green Version]
- Rosenstock, A.; Connolly, M.; Weller, R.; Hong, M.Y. Brazil nut consumption promotes satiety without increasing blood glucose and insulin responses in healthy adults. Nutrire 2020, 45, 1–7. [Google Scholar] [CrossRef]
- Hollingworth, S.; Dalton, M.; Blundell, J.E.; Finlayson, G. Evaluation of the Influence of Raw Almonds on Appetite Control: Satiation, Satiety, Hedonics and Consumer Perceptions. Nutrients 2019, 11, 2030. [Google Scholar] [CrossRef] [Green Version]
- Hull, S.; Re, R.; Chambers, L.; Echaniz, A.; Wickham, M.S. A mid-morning snack of almonds generates satiety and appropriate adjustment of subsequent food intake in healthy women. Eur. J. Nutr. 2015, 54, 803–810. [Google Scholar] [CrossRef] [Green Version]
- Pawlak, R.; Colby, S.; Herring, J. Beliefs, benefits, barriers, attitude, intake and knowledge about peanuts and tree nuts among WIC participants in eastern North Carolina. Nutr. Res. Pract. 2009, 3, 220–225. [Google Scholar]
- Pawlak, R.; London, H.A.; Colby, S.E.; Wall-Bassett, E.; Sira, N. Perception of nut intake among individuals with or at risk for heart disease and/or diabetes. J. Behav. Health 2012, 1, 185–188. [Google Scholar]
- Yong, L.C.; Gray, A.R.; Chisholm, A.; Leong, S.L.; Tey, S.L.; Brown, R.C. Barriers to and facilitators and perceptions of nut consumption among the general population in New Zealand. Public Health Nutr. 2017, 20, 3166–3182. [Google Scholar] [CrossRef] [Green Version]
- Smith, C.; Gray, A.R.; Mainvil, L.A.; Fleming, E.A.; Parnell, W.R. Secular changes in intakes of foods among New Zealand adults from 1997 to 2008/09. Public Health Nutr. 2015, 18, 3249–3259. [Google Scholar] [CrossRef] [Green Version]
- Blundell, J.; de Graaf, C.; Hulshof, T.; Jebb, S.; Livingstone, B.; Lluch, A.; Mela, D.; Salah, S.; Schuring, E.; van der Knaap, H.; et al. Appetite control: Methodological aspects of the evaluation of foods. Obes. Rev. 2010, 11, 251–270. [Google Scholar] [CrossRef] [Green Version]
- Brouns, F.; Bjorck, I.; Frayn, K.N.; Gibbs, A.L.; Lang, V.; Slama, G.; Wolever, T.M. Glycaemic index methodology. Nutr. Res. Rev. 2005, 18, 145–171. [Google Scholar] [CrossRef] [Green Version]
- Joint Food and Agriculture Organizaton; World Health Organization; United Nations University. Expert Consultation on Energy and Protein Requirements, Energy and Protein Requirements: Report of a Joint FAO/WHO/UNU Expert Consultation; World Health Organization, WHO Publications Center USA Distributor: Geneva, Switzerland, 1985; p. 206. [Google Scholar]
- University of Otago and Ministry of Health. A Focus on Nutrition: Key Findings of the 2008/09 New Zealand Adult Nutrition Survey; Ministry of Health: Wellington, New Zealand, 2011. [Google Scholar]
- Novotny, J.A.; Gebauer, S.K.; Baer, D.J. Discrepancy between the Atwater factor predicted and empirically measured energy values of almonds in human diets. Am. J. Clin. Nutr. 2012, 96, 296–301. [Google Scholar] [CrossRef] [Green Version]
- Diaz, E.O.; Prentice, A.M.; Goldberg, G.R.; Murgatroyd, P.R.; Coward, W.A. Metabolic response to experimental overfeeding in lean and overweight healthy volunteers. Am. J. Clin. Nutr. 1992, 56, 641–655. [Google Scholar] [CrossRef]
- Guarneiri, L.L.; Cooper, J.A. Intake of Nuts or Nut Products Does Not Lead to Weight Gain, Independent of Dietary Substitution Instructions: A Systematic Review and Meta-Analysis of Randomized Trials. Adv. Nutr. 2020, 12, 384–401. [Google Scholar] [CrossRef]
- Barbour, J.A.; Howe, P.R.; Buckley, J.D.; Wright, G.C.; Bryan, J.; Coates, A.M. Lower energy intake following consumption of Hi-oleic and regular peanuts compared with iso-energetic consumption of potato crisps. Appetite 2014, 82, 124–130. [Google Scholar] [CrossRef]
- Devi, A.; Chisholm, A.; Gray, A.; Tey, S.L.; Williamson-Poutama, D.; Cameron, S.L.; Brown, R.C. Nut-enriched bread is an effective and acceptable vehicle to improve regular nut consumption. Eur. J. Nutr. 2016, 55, 2281–2293. [Google Scholar] [CrossRef]
- Josse, A.R.; Kendall, C.W.; Augustin, L.S.; Ellis, P.R.; Jenkins, D.J. Almonds and postprandial glycemia--A dose-response study. Metabolism 2007, 56, 400–404. [Google Scholar] [CrossRef]
- Kendall, C.W.C.; Esfahani, A.; Josse, A.R.; Augustin, L.S.A.; Vidgen, E.; Jenkins, D.J.A. The glycemic effect of nut-enriched meals in healthy and diabetic subjects. Nutr. Metab. Cardiovasc. Dis. 2011, 21, S34–S39. [Google Scholar] [CrossRef]
- Gulati, S.; Misra, A.; Pandey, R.M.; Bhatt, S.P.; Saluja, S. Effects of pistachio nuts on body composition, metabolic, inflammatory and oxidative stress parameters in Asian Indians with metabolic syndrome: A 24-wk, randomized control trial. Nutrition 2014, 30, 192–197. [Google Scholar] [CrossRef]
- Hernandez-Alonso, P.; Giardina, S.; Salas-Salvado, J.; Arcelin, P.; Bullo, M. Chronic pistachio intake modulates circulating microRNAs related to glucose metabolism and insulin resistance in prediabetic subjects. Eur. J. Nutr. 2017, 56, 2181–2191. [Google Scholar] [CrossRef] [PubMed]
- Fillon, A.; Beaulieu, K.; Mathieu, M.E.; Tremblay, A.; Boirie, Y.; Drapeau, V.; Thivel, D. A systematic review of the use of the Satiety Quotient. Br. J. Nutr. 2021, 125, 212–239. [Google Scholar] [CrossRef] [PubMed]
- Godwin, N.; Roberts, T.; Hooshmand, S.; Kern, M.; Hong, M.Y. Mixed Nuts May Promote Satiety While Maintaining Stable Blood Glucose and Insulin in Healthy, Obese, and Overweight Adults in a Two-Arm Randomized Controlled Trial. J. Med. Food 2019, 22, 427–432. [Google Scholar] [CrossRef] [PubMed]
- Mori, A.M.; Considine, R.V.; Mattes, R.D. Acute and second-meal effects of almond form in impaired glucose tolerant adults: A randomized crossover trial. Nutr. Metab. 2011, 8, 6. [Google Scholar] [CrossRef] [PubMed] [Green Version]
- Wang, J.; Wang, S.; Henning, S.M.; Qin, T.; Pan, Y.; Yang, J.; Huang, J.; Tseng, C.H.; Heber, D.; Li, Z. Mixed Tree Nut Snacks Compared to Refined Carbohydrate Snacks Resulted in Weight Loss and Increased Satiety during Both Weight Loss and Weight Maintenance: A 24-Week Randomized Controlled Trial. Nutrients 2021, 13, 1512. [Google Scholar] [CrossRef]


| Raw Almonds * | Biscuits † | |
|---|---|---|
| Per 100 g | ||
| Energy (kJ) | 2423 | 1972 |
| Protein (g) | 21.2 | 5.4 |
| Total fat (g) | 49.9 | 18.2 |
| Carbohydrate (g) | 21.6 | 70.1 |
| Percent of total energy per serve | ||
| Protein | 14.9 | 4.7 |
| Total fat | 76.2 | 34.1 |
| Carbohydrate | 10.2 | 60.4 |
| Demographic Variable | All Participants |
|---|---|
| Age (y) † | 29 (21, 41) |
| Gender | |
| Male, n (%) | 25 (25) |
| Female, n (%) | 75 (75) |
| Height (m) | 1.69 (0.09) |
| Weight (kg) | 65.95 (11.54) |
| BMI (kg/m2) | 23.1 (2.8) |
| Ethnicity n (%) | |
| NZ European | 61 (61) |
| Māori | 9 (9) |
| Asian | 26 (26) |
| Other | 4 (4) |
| Variable | Almonds | Biscuits | Mean (95%CI) Difference | p-Value * |
|---|---|---|---|---|
| 2-h area under the curve (2-h AUC, mm x min) | ||||
| 2-h AUC for hunger | 4247 (2353) | 3921 (2029) | −310 (−699, 72) | 0.119 |
| 2-h AUC for fullness | 6215 (2139) | 6380 (2110) | 132 (−252, 515) | 0.501 |
| 2-h AUC for desire to consume | 4515 (2415) | 4176 (2088) | −334 (−729, 61) | 0.097 |
| 2-h AUC for prospective food consumption | 4730 (2269) | 4602 (1977) | −121 (−497, 255) | 0.530 |
| 2-h AUC for preoccupied with food | 3577 (2567) | 3459 (2294) | −118 (−466, 230) | 0.506 |
| 2-h AUC for appetite score | 4572 (2169) | 4331 (1899) | −235 (−558, 87) | 0.152 |
| Appetite score over time (mm) | ||||
| Baseline | 39.6 (18.4) | 40.7 (18.7) | ||
| 15 min | 23.7 (17.9) | 24.0 (17.7) | −0.3 (−3.3, 2.7) | 0.823 |
| 30 min | 28.2 (19.5) | 27.5 (17.7) | −1.4 (−4.4, 1.7) | 0.382 |
| 60 min | 36.6 (20.6) | 34.4 (18.0) | −2.7 (−6.0, 0.60) | 0.109 |
| 90 min | 45.7 (20.8) | 42.4 (19.1) | −3.6 (−6.9, −0.3) | 0.035 |
| 120 min | 54.5 (20.7) | 52.8 (18.8) | −1.9 (−5.5, 1.6) | 0.282 |
| Mean post-consumption satiety quotient (SQ, mm/kJ) using Atwater factors | ||||
| SQ for hunger | 0.103 (1.655) | 0.545 (1.799) | 4.336 (0.026, 0.841) | 0.037 |
| SQ for fullness | −0.131 (−1.251) | −0.271 (1.494) | −0.135 (−0.492, 0.222) | 0.457 |
| SQ for desire to consume | 0.539 (1.311) | 0.798 (1.375) | 0.263 (−0.085, 0.612) | 0.139 |
| SQ for prospective food consumption | 0.180 (1.122) | 0.213 (1.210) | 0.026 (−0.241, 0.293) | 0.849 |
| SQ for preoccupied with food | −0.176 (1.390) | 0.033 1.523) | 0.188 (−0.156, 0.531) | 0.284 |
| Mean post-consumption satiety quotient (SQ, mm/kJ) using digestible energy | ||||
| SQ for hunger | 0.122 (2.153) | 0.545 (1.799) | 0.411 (−0.053, 0.876) | 0.082 |
| SQ for fullness | −0.173 (1.646) | −0.271 (1.494) | −0.093 (−0.500, 0.314 | 0.653 |
| SQ for desire to consume | 0.713 (1.721) | 0.798 (1.375) | 0.090 (−0.315, 0.495) | 0.663 |
| SQ for prospective food consumption | 0.237 (1.476) | 0.213 (1.210) | −0.033 (−0.342, 0.273) | 0.835 |
| SQ for preoccupied with food | −0.227 (1.825) | 0.033 (1.523) | 2.35 (−0.160, 0.629) | 0.243 |
| Variable | Almonds | Biscuits | Mean (95%CI) Difference | p-Value * |
|---|---|---|---|---|
| Energy (kJ) | 7494 (2589) | 8132 (3044) | 638 (44, 1233) | 0.035 |
| Protein g | 78.8 (31.7) | 80.1 (29.1) | 1.3 (−3.8, 6.5) | 0.612 |
| Protein (%TE) | 18.1 (4.1) | 17.3 (3.8) | −0.9 (−2.0, 0.2) | 0.110 |
| Carbohydrate (g) † | 185 (1.42) | 197 (1.46) | 1.06 (0.98, 1.16) | 0.150 |
| Carbohydrate (%TE) | 44.8 (6.8) | 44.5 (7.9) | −0.2 (−1.9, 1.4) | 0.771 |
| Total fat (g) † | 66.0 (1.5) | 70.9 (1.54) | 1.07 (0.98, 1.18) | 0.125 |
| Total fat (%TE) | 35.2 (6.6) | 35.2 (7.6) | 0.1 (−1.7, 1.8) | 0.938 |
| Saturated fat (g) | 26.8 (11.6) | 29.7 (15.3) | 2.9 (−0.1, 5.9) | 0.056 |
| Saturated fat (%TE) | 13.2 (3.5) | 13.4 (4.4) | 0.2 (−0.8, 1.1) | 0.725 |
| Monounsaturated fat (g) † | 21.0 (1.66) | 22.5 (1.64) | 1.07 (0.95, 1.20) | 0.258 |
| Monounsaturated fat (%TE) † | 10.9 (1.36) | 10.9 (1.40) | 0.99 (0.91, 1.08) | 0.906 |
| Polyunsaturated fat (g) † | 12.3 (1.54) | 12.9 (1.54) | 1.05 (0.96, 1.15) | 0.278 |
| Polyunsaturated fat (%TE) | 6.7 (1.8) | 6.6 (2.1) | −0.1 (−0.5, 0.3) | 0.563 |
| Cholesterol (mg) † | 133 (2.02) | 129 (1.97) | 0.97 (0.82, 1.15) | 0.747 |
| Sugar (g) † | 56.4 (1.84) | 64.8 (1.69) | 1.15 (1.00, 1.32) | 0.053 |
| Sugar (%TE) † | 13.5 (1.65) | 14.4 (1.52) | 10.7 (0.96, 1.18) | 0.207 |
| Fibre (g) † | 21.9 (1.46) | 23.1 (1.57) | 1.05 (0.97, 1.14) | 0.192 |
Publisher’s Note: MDPI stays neutral with regard to jurisdictional claims in published maps and institutional affiliations. |
© 2021 by the authors. Licensee MDPI, Basel, Switzerland. This article is an open access article distributed under the terms and conditions of the Creative Commons Attribution (CC BY) license (https://creativecommons.org/licenses/by/4.0/).
Share and Cite
Brown, R.; Ware, L.; Gray, A.R.; Chisholm, A.; Tey, S.L. Snacking on Almonds Lowers Glycaemia and Energy Intake Compared to a Popular High-Carbohydrate Snack Food: An Acute Randomised Crossover Study. Int. J. Environ. Res. Public Health 2021, 18, 10989. https://doi.org/10.3390/ijerph182010989
Brown R, Ware L, Gray AR, Chisholm A, Tey SL. Snacking on Almonds Lowers Glycaemia and Energy Intake Compared to a Popular High-Carbohydrate Snack Food: An Acute Randomised Crossover Study. International Journal of Environmental Research and Public Health. 2021; 18(20):10989. https://doi.org/10.3390/ijerph182010989
Chicago/Turabian StyleBrown, Rachel, Lara Ware, Andrew R. Gray, Alex Chisholm, and Siew Ling Tey. 2021. "Snacking on Almonds Lowers Glycaemia and Energy Intake Compared to a Popular High-Carbohydrate Snack Food: An Acute Randomised Crossover Study" International Journal of Environmental Research and Public Health 18, no. 20: 10989. https://doi.org/10.3390/ijerph182010989
APA StyleBrown, R., Ware, L., Gray, A. R., Chisholm, A., & Tey, S. L. (2021). Snacking on Almonds Lowers Glycaemia and Energy Intake Compared to a Popular High-Carbohydrate Snack Food: An Acute Randomised Crossover Study. International Journal of Environmental Research and Public Health, 18(20), 10989. https://doi.org/10.3390/ijerph182010989