
The Relationships between Perceived Design Intensity, Preference, Restorativeness and Eye Movements in Designed Urban Green Space

Abstract
:1. Introduction
1.1. Landscape Design Intensity
1.2. Landscape Preference in Relation to Restorativeness
1.3. Eye-Tracking Analysis in Landscape Perception Research
1.4. Research Questions
- How does design intensity affect people’s eye movements, landscape preference and restorativeness?
- What is the overall relationship among UGS design intensity preference, restorativeness, and eye movement?
- Are there linear or curvilinear regressions relationship between design intensity and preference, restorativeness, and eye movement? Which equation works better?
2. Materials and Methods
2.1. Study Design
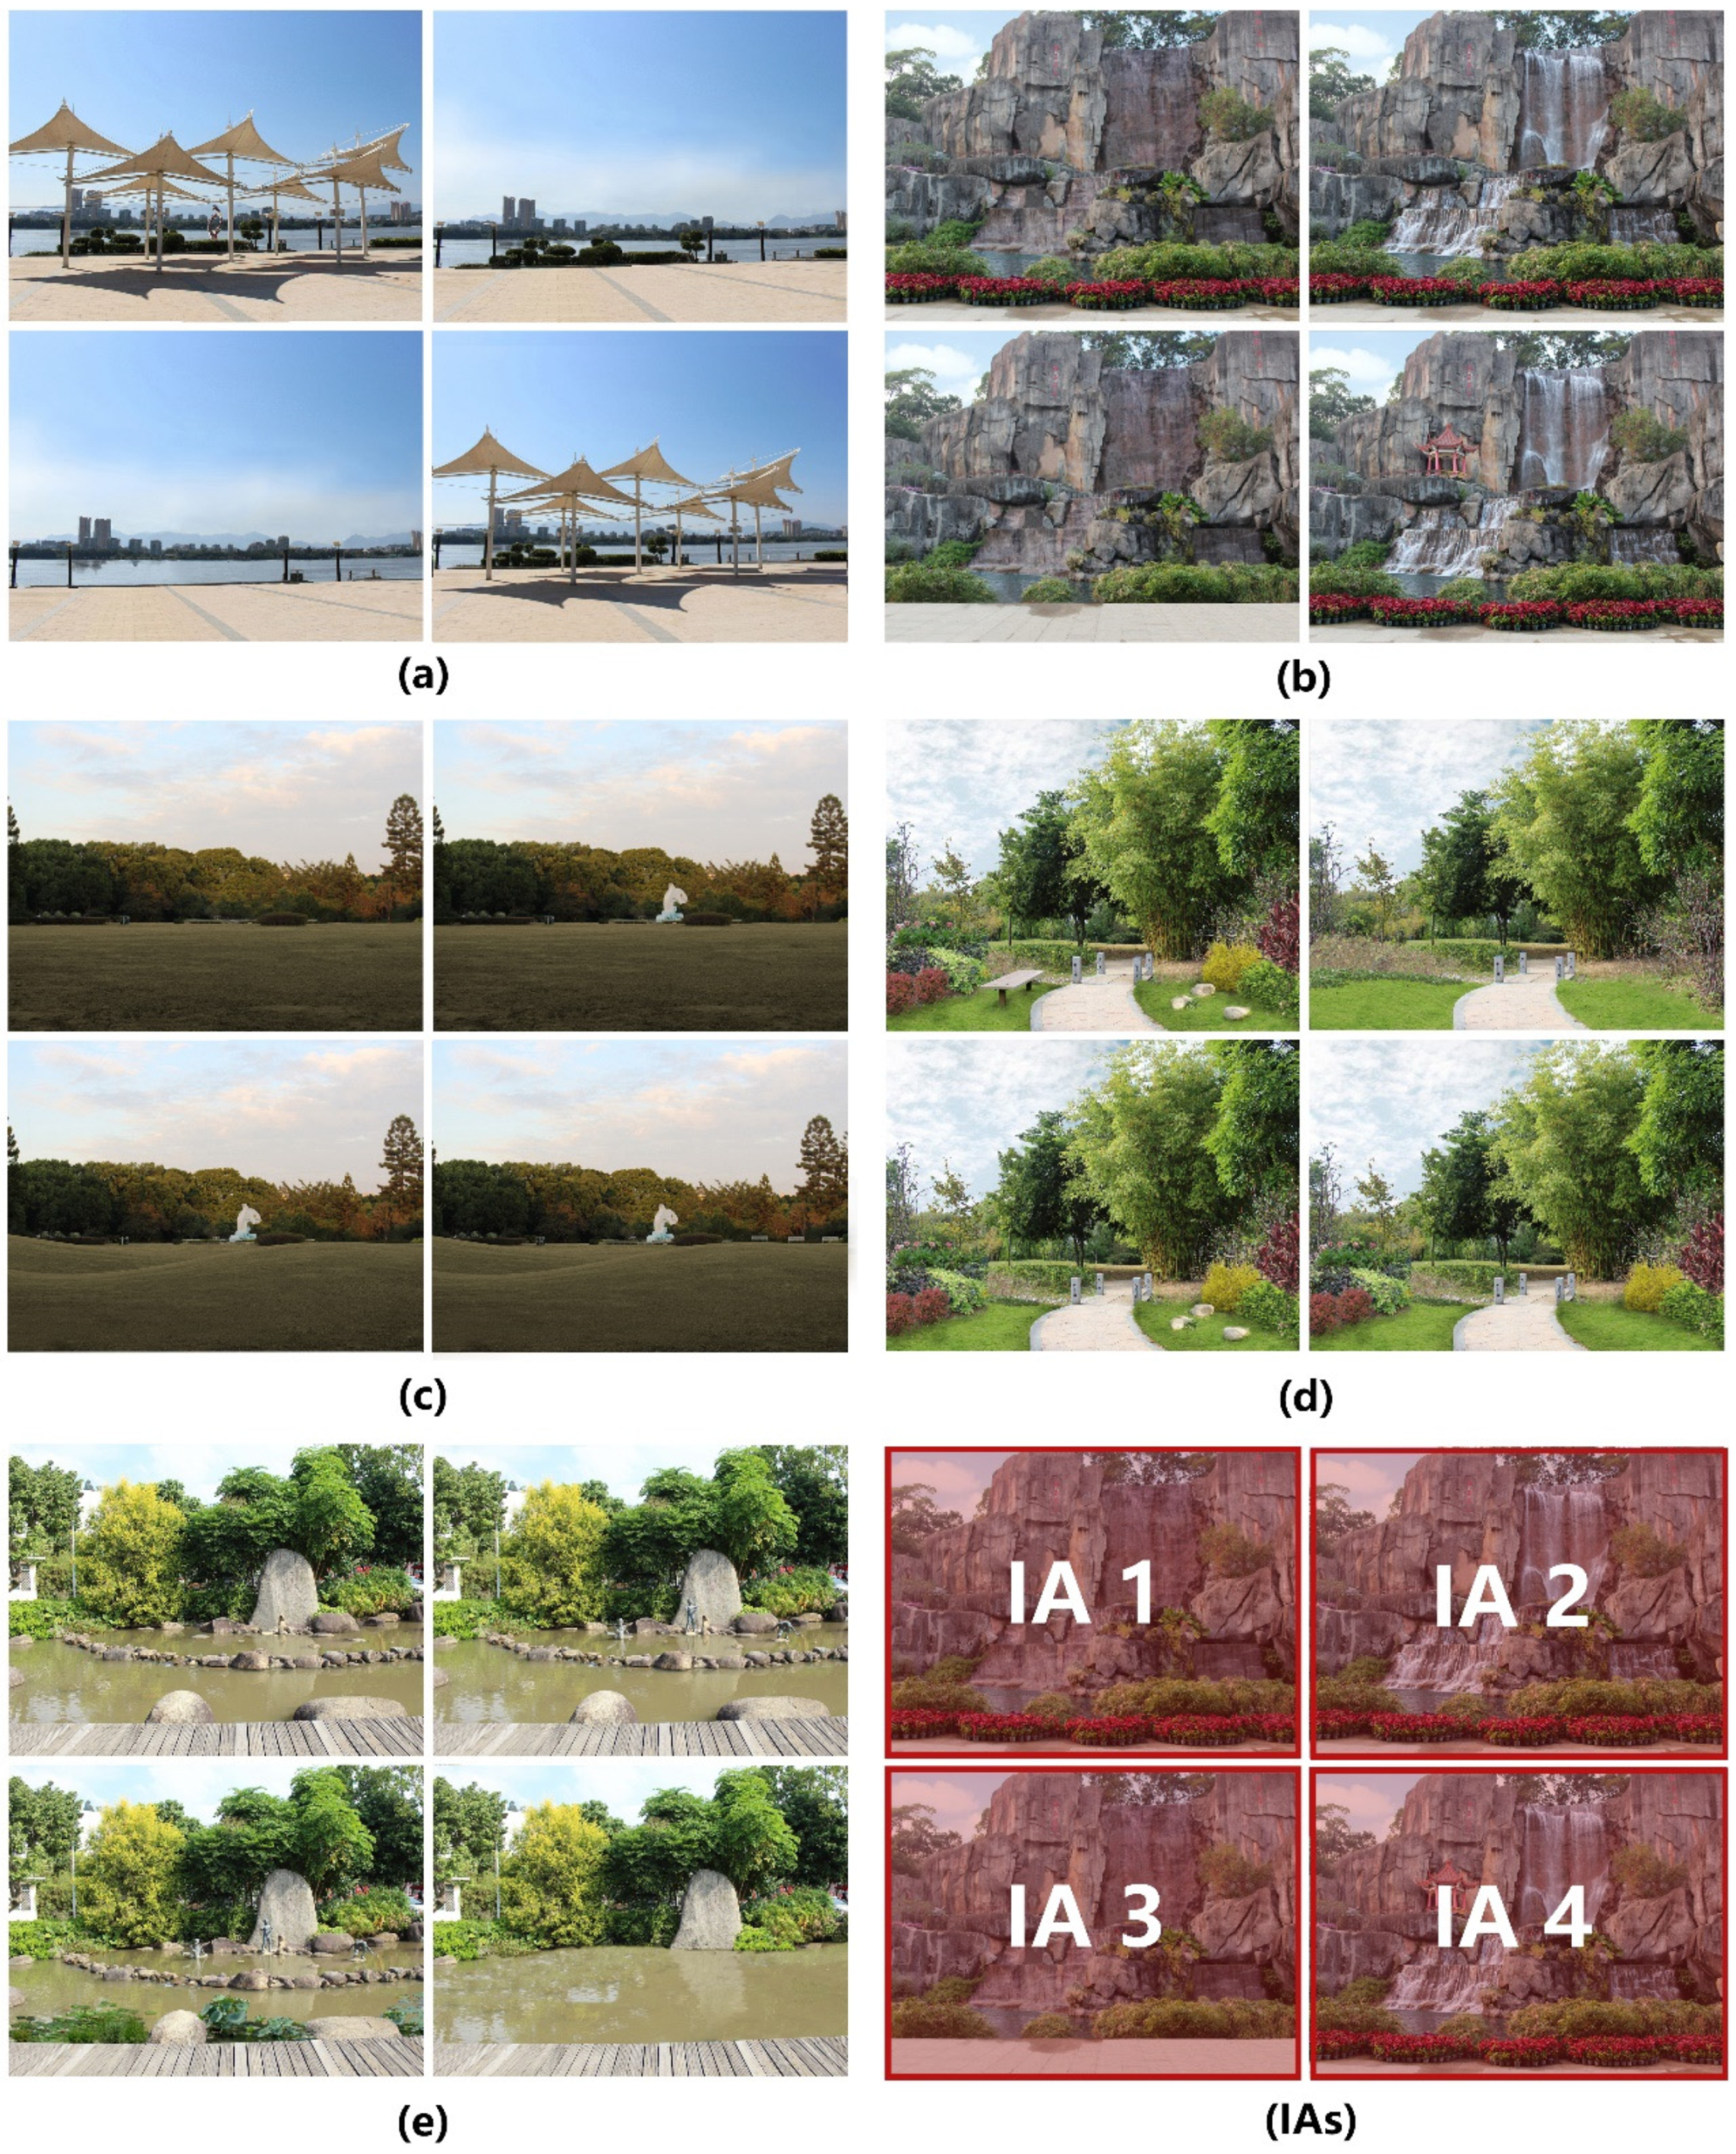
2.2. Study Stimulus
2.3. Eye-Tracking Apparatus and Metrics
2.4. Participants
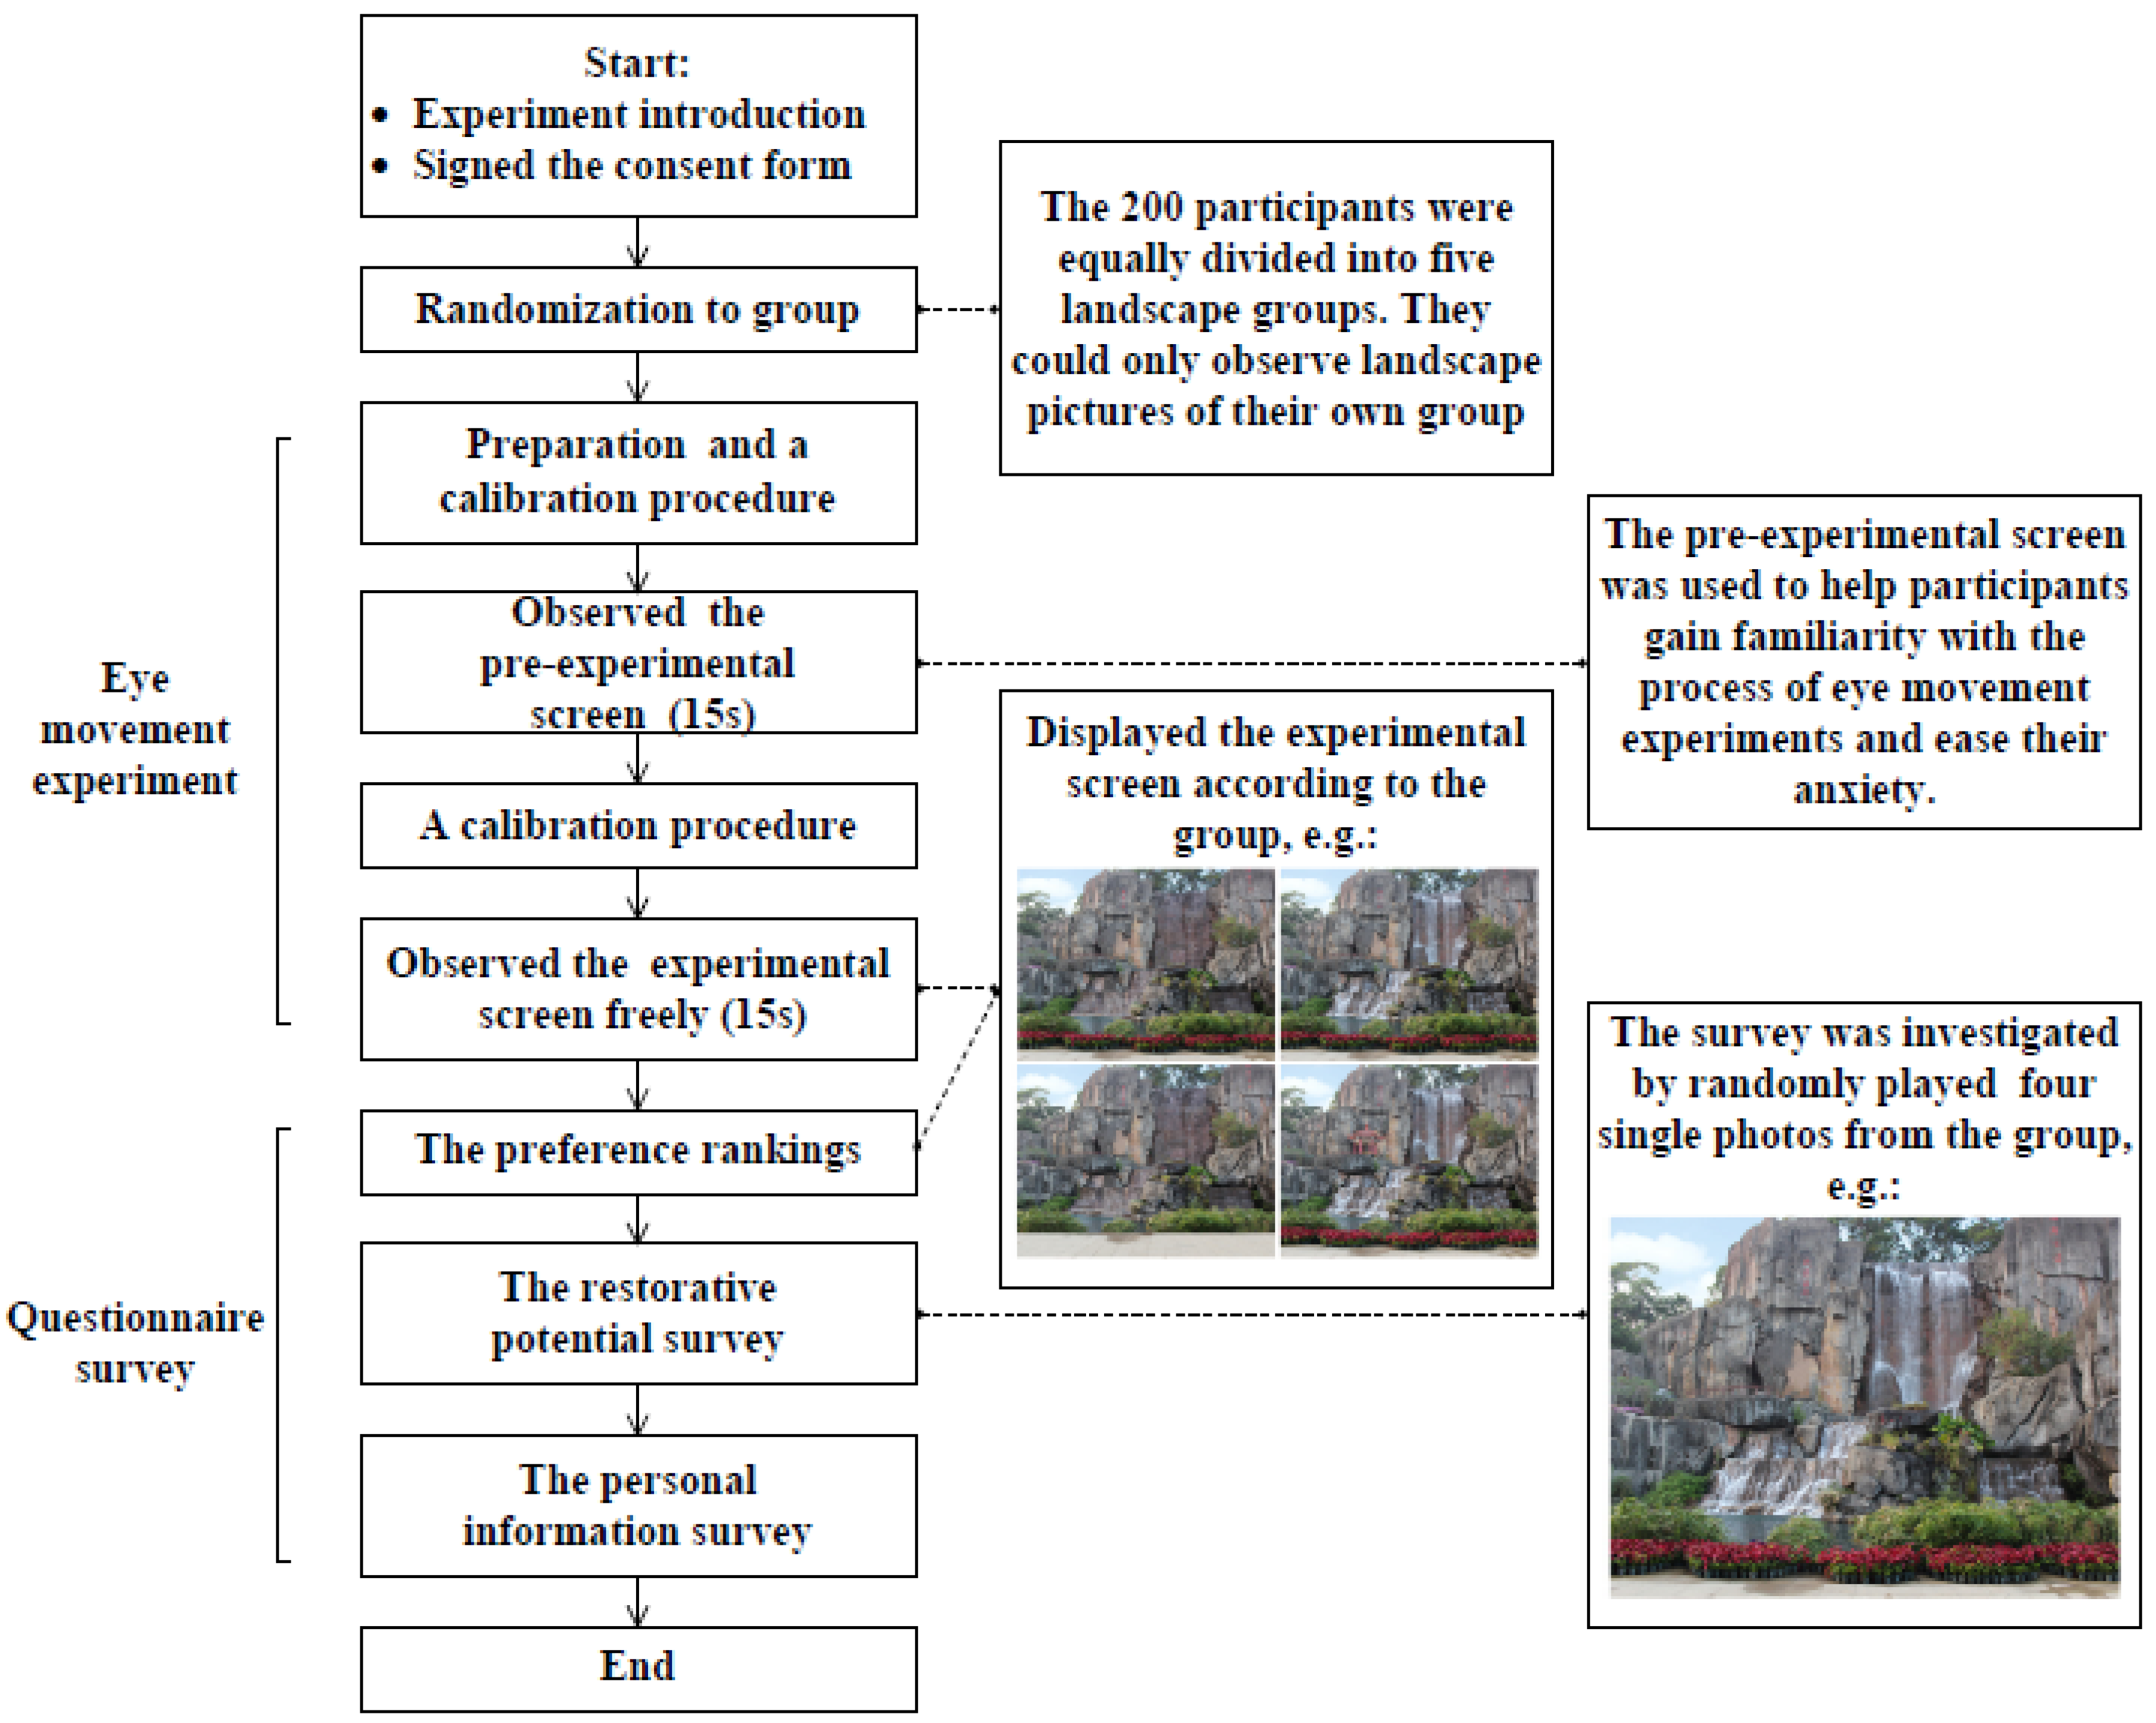
2.5. Procedure
2.6. Data Analysis
3. Results
3.1. Comparison of Eye-Tracking Metrics, Preference and Restorative Rating among Design Intensities
3.2. Correlation among Design Intensity, Preference, Restorative Rating, and Eye Movement Metrics
3.3. The Relationship between Design Intensity, Eye-Tracking Metrics, Preference, and Restorative Rating
4. Discussion
4.1. Design Intensities in Relation to Preference and Restorativeness
4.2. Eye-Tracking Data and Their Relation with Design Intensity, Preference, and Restorativeness
4.3. Implications for UGS Design
4.4. Limitations and Further Study
5. Conclusions
Author Contributions
Funding
Institutional Review Board Statement
Informed Consent Statement
Data Availability Statement
Acknowledgments
Conflicts of Interest
References
- Grimm, N.B.; Faeth, S.H.; Golubiewski, N.E.; Redman, C.L.; Wu, J.; Bai, X.; Briggs, J.M. Global change and the ecology of cities. Science 2008, 319, 756–760. [Google Scholar] [CrossRef] [Green Version]
- Wu, J. Making the Case for Landscape Ecology: An Effective Approach to Urban Sustainability. Landsc. J. 2008, 27, 41–50. [Google Scholar] [CrossRef] [Green Version]
- Wu, J. Urban sustainability: An inevitable goal of landscape research. Landsc. Ecol. 2010, 25, 1–4. [Google Scholar] [CrossRef] [Green Version]
- Anguluri, R.; Narayanan, P. Role of green space in urban planning: Outlook towards smart cities. Urban For. Urban Green. 2017, 25, 58–65. [Google Scholar] [CrossRef]
- Wolch, J.R.; Byrne, J.; Newell, J.P. Urban green space, public health, and environmental justice: The challenge of making cities ‘just green enough’. Landsc. Urban Plan. 2014, 125, 234–244. [Google Scholar] [CrossRef] [Green Version]
- Haq, S.M.A. Urban Green Spaces and an Integrative Approach to Sustainable Environment. J. Environ. Prot. 2011, 2, 601–608. [Google Scholar] [CrossRef] [Green Version]
- Georgi, J.N.; Dimitriou, D. The contribution of urban green spaces to the improvement of environment in cities: Case study of Chania, Greece. Build. Environ. 2010, 45, 1401–1414. [Google Scholar] [CrossRef] [Green Version]
- Van den Berg, A.E.; Maas, J.; Verheij, R.A.; Groenewegen, P.P. Green space as a buffer between stressful life events and health. Soc. Sci. Med. 2010, 70, 1203–1210. [Google Scholar] [CrossRef] [Green Version]
- Wang, X.; Wang, X.; Rodiek, S.; Wu, C.; Chen, Y.; Li, Y. Stress recovery and restorative effects of viewing different urban park scenes in Shanghai, China. Urban For. Urban Green. 2016, 15, 112–122. [Google Scholar] [CrossRef]
- Wang, R.; Zhao, J.; Meitner, M.J. Characteristics of urban green spaces in relation to aesthetic preference and stress recovery. Urban For. Urban Green. 2019, 41, 7–13. [Google Scholar] [CrossRef]
- Korpela, K.; Hartig, T.; Kaiser, F.; Fuhrer, U. Restorative Experience and Self-Regulation in Favorite Places. Environ. Behav. 2001, 33, 572–589. [Google Scholar] [CrossRef]
- Korpela, K.; Hartig, T. Restorative qualities of favorite places. J. Environ. Psychol. 1996, 16, 221–233. [Google Scholar] [CrossRef] [Green Version]
- Staats, H.; Kieviet, A.; Hartig, T. Where to recover from attentional fatigue: An expectancy-value analysis of environmental preference. J. Environ. Psychol. 2003, 23, 147–157. [Google Scholar] [CrossRef]
- van den Berg, A.E.; Koole, S.L.; van der Wulp, N.Y. Environmental preference and restoration: (How) are they related? J. Environ. Psychol. 2003, 23, 135–146. [Google Scholar] [CrossRef]
- Herzog, T.R.; Maguire, C.P.; Nebel, M.B. Assessing the restorative components of environments. J. Environ. Psychol. 2003, 23, 159–170. [Google Scholar] [CrossRef]
- Liu, Q.; Wu, Y.; Xiao, Y.; Huang, Q.; Lan, S. The Inherent Psychological Mechanism of Perceived Restoration of Urban Parks. Chin. Landsc. Archit. 2019, 37, 39–44. [Google Scholar]
- Lei, Y.; Jin, H.; Wang, J. The current status and prospect of healing garden. Chin. Landsc. Archit. 2011, 27, 31–36. [Google Scholar]
- Velarde, M.D.; Fry, G.; Tveit, M. Health Effects of Viewing Landscapes—Landscape Types in Environmental Psychology. Urban For. Urban Green. 2007, 6, 199–212. [Google Scholar] [CrossRef]
- Jiang, B.; Zhang, T.; Sullivan, W.C. Healthy Cities: Mechanisms and Research Questions Regarding the Impacts of Urban Green Landscapes on Public Health and Well-being. Landsc. Archit. Front. 2015, 3, 24–35. [Google Scholar]
- Franěk, M.; Šefara, D.; Petružálek, J.; Cabal, J.; Myška, K. Differences in eye movements while viewing images with various levels of restorativeness. J. Environ. Psychol. 2018, 57, 10–16. [Google Scholar] [CrossRef]
- Berto, R.; Massaccesi, S.; Pasini, M. Do eye movements measured across high and low fascination photographs differ? Addressing Kaplan\”s fascination hypothesis. J. Environ. Psychol. 2008, 28, 185–191. [Google Scholar] [CrossRef]
- Xu, W.; Xu, W.; Zhao, J.; Huang, Y.; Hu, B. Design intensities in relation to visual aesthetic preference. Urban For. Urban Green. 2018, 34, 305–310. [Google Scholar] [CrossRef]
- Lothian, A. Landscape and the philosophy of aesthetics: Is landscape quality inherent in the landscape or in the eye of the beholder? Landscape and Urban Planning. Landsc. Urban Plan. 1999, 44, 177–198. [Google Scholar] [CrossRef]
- Kurdoglu, O.; Kurdoglu, B.C. Determining recreational, scenic, and historical–cultural potentials of landscape features along a segment of the ancient Silk Road using factor analyzing. Environ. Monit. Assess. 2010, 170, 99–116. [Google Scholar] [CrossRef]
- Hauru, K.; Lehvävirta, S.; Korpela, K.; Kotze, J. Closure of view to the urban matrix has positive effects on perceived restorativeness in urban forests in Helsinki, Finland. Landsc. Urban Plan. 2012, 107, 361–369. [Google Scholar] [CrossRef]
- Van den Berg, A.E.; Jorgensen, A.; Wilson, E.R. Evaluating restoration in urban green spaces: Does setting type make a difference? —ScienceDirect. Landsc. Urban Plan. 2014, 127, 173–181. [Google Scholar] [CrossRef]
- Purcell, T.; Peron, E.; Berto, R. Why do Preferences Differ between Scene Types? Environ. Behav. 1998, 33, 93–106. [Google Scholar] [CrossRef]
- Tyrväinen, L.; Ojala, A.; Korpela, K.; Lanki, T.; Tsunetsugu, Y.; Kagawa, T. The influence of urban green environments on stress relief measures: A field experiment. J. Environ. Psychol. 2014, 38, 1–9. [Google Scholar] [CrossRef]
- Suppakittpaisarn, P.; Jiang, B.; Slavenas, M.; Sullivan, W.C. Does density of green infrastructure predict preference? Urban For. Urban Green. 2018, 40, 236–244. [Google Scholar] [CrossRef]
- Adevi, A.A.; Mårtensson, F. Stress rehabilitation through garden therapy: The garden as a place for recovery from stress. Urban For. Urban Green. 2013, 12, 230–237. [Google Scholar] [CrossRef]
- Kaplan, R.; Kaplan, S. The Experience of Nature: A Psychological Perspective; Cambridge University Press: Cambridge, UK, 1989. [Google Scholar]
- Kaplan, S. The restorative benefits of nature: Toward an integrative framework. J. Environ. Psychol. 1995, 15, 169–182. [Google Scholar] [CrossRef]
- Jo, H.; Rodiek, S.; Fujii, E.; Miyazaki, Y.; Park, B.J.; Ann, S.W. Physiological and psychological response to floral scent. Hortscience A Publ. Am. Soc. Hortic. Sci. 2013, 48, 82–88. [Google Scholar] [CrossRef]
- Ulrich, R.S.; Simons, R.F.; Losito, B.D.; Fiorito, E.; Miles, M.A.; Zelson, M. Stress recovery during exposure to natural and urban environments 1. J. Environ. Psychol. 1991, 11, 201–230. [Google Scholar] [CrossRef]
- Hartig, T.; Korpela, K.; Evans, G.W.; Gärling, T. Validation of the Measure of Perceived Environmental Restorativeness, Göteborg Psychological Reports; University of Göteborg, Department of Psychology: Göteborg, Sweden, 1996; pp. 1–64. [Google Scholar]
- Hartig, T.; Kaiser, F.G.; Bowler, P.A. Further Development of a Measure of Perceived Environmental Restorativeness; Uppsala University, Institute of Housing Research: Gävle, Sweden, 1997. [Google Scholar]
- Kaltenborn, B.P.; Bjerke, T. Associations between environmental value orientations and landscape preferences. Landsc. Urban Plan. 2002, 59, 1–11. [Google Scholar] [CrossRef]
- Menatti, L.; Subiza-Pérez, M.; Villalpando-Flores, A.; Vozmediano, L.; Juan, C.S. Place attachment and identification as predictors of expected landscape restorativeness. J. Environ. Psychol. 2019, 63, 36–43. [Google Scholar] [CrossRef]
- Wang, R.; Zhao, J.; Liu, Z. Consensus in visual preferences: The effects of aesthetic quality and landscape types. Urban For. Urban Green. 2016, 20, 210–217. [Google Scholar] [CrossRef]
- Howley, P. Landscape aesthetics: Assessing the general publics’ rural landscape preferences. Ecol. Econ. 2011, 72, 161–169. [Google Scholar] [CrossRef]
- Liu, Q.; Zhang, Y.; Lin, Y.; You, D.; Zhang, W.; Huang, Q.; Bosch, C.C.K.V.D.; Lan, S. The relationship between self-rated naturalness of university green space and students’ restoration and health. Urban For. Urban Green. 2018, 34, 259–268. [Google Scholar] [CrossRef]
- Hoyle, H.; Hitchmough, J.; Jorgensen, A. All about the ‘wow factor’? The relationships between aesthetics, restorative effect and perceived biodiversity in designed urban planting. Landsc. Urban Plan. 2017, 164, 109–123. [Google Scholar] [CrossRef]
- Collado, S.; Staats, H.; Sorrel, M.A. A relational model of perceived restorativeness: Intertwined effects of obligations, familiarity, security and parental supervision. J. Environ. Psychol. 2016, 48, 24–32. [Google Scholar] [CrossRef]
- Kang, Y.; Kim, E.J. Differences of Restorative Effects While Viewing Urban Landscapes and Green Landscapes. Sustainability 2019, 11, 2129. [Google Scholar] [CrossRef] [Green Version]
- Noland, R.B.; Weiner, M.D.; Gao, D.; Cook, M.P.; Nelessen, A. Eye-tracking technology, visual preference surveys, and urban design: Preliminary evidence of an effective methodology. J. Urban. Int. Res. Placemaking Urban Sustain. 2017, 10, 1–13. [Google Scholar] [CrossRef]
- Dupont, L.; Antrop, M.; Eetvelde, V.V. Eye-tracking Analysis in Landscape Perception Research: Influence of Photograph Properties and Landscape Characteristics. Landsc. Res. 2014, 39, 417–432. [Google Scholar] [CrossRef]
- Kim, M.; Kang, Y.; Bakar, S.A. A Nightscape Preference Study Using Eye Movement Analysis. Alam Cipta Int. J. Sustain. Trop. Des. Res. Pract. 2013, 6, 85–99. [Google Scholar]
- Bahman, A.S.; Niloofar, T.; Reza, D.M. Gender-based eye movement differences in passive indoor picture viewing: An eye-tracking study. Physiol. Behav. 2019, 206, 43–50. [Google Scholar]
- Liversedge, S.P.; Gilchrist, I.D.; Everling, S. The Oxford Handbook of Eye Movements; Oxford University Press: Oxford, UK, 2011. [Google Scholar]
- Valtchanov, D.; Ellard, C.G. Cognitive and affective responses to natural scenes: Effects of low level visual properties on preference, cognitive load and eye-movements. J. Environ. Psychol. 2015, 43, 184–195. [Google Scholar] [CrossRef]
- Conniff, A.; Craig, T. A methodological approach to understanding the wellbeing and restorative benefits associated with greenspace. Urban For. Urban Green. 2016, 19, 103–109. [Google Scholar] [CrossRef]
- Zhao, J.; Luo, P.; Wang, R.; Cai, Y. Correlations between aesthetic preferences of river and landscape characters. J. Environ. Eng. Landsc. 2013, 21, 123–132. [Google Scholar] [CrossRef]
- Palmer, J.F.; Hoffman, R.E. Rating reliability and representation validity in scenic landscape assessments. Landsc. Urban Plan. 2001, 54, 149–161. [Google Scholar] [CrossRef]
- Wang, R.; Zhao, J.; Meitner, M.J. Urban woodland understory characteristics in relation to aesthetic and recreational preference. Urban For. Urban Green. 2017, 24, 55–61. [Google Scholar] [CrossRef]
- Dupont, L.; Antrop, M.; Eetvelde, V.V. Does landscape related expertise influence the visual perception of landscape photographs? Implications for participatory landscape planning and management. Landsc. Urban Plan. 2015, 141, 68–77. [Google Scholar] [CrossRef] [Green Version]
- Dupont, L.; Ooms, K.; Antrop, M.; Van Eetvelde, V. Comparing saliency maps and eye-tracking focus maps: The potential use in visual impact assessment based on landscape photographs. Landsc. Urban Plan. 2016, 148, 17–26. [Google Scholar] [CrossRef]
- Joe, L.C.; Chi-Chan, C.; Yung-Hui, L. Evaluating camouflage design using eye movement data. Appl. Ergon. 2014, 45, 714–723. [Google Scholar]
- Kaplan, R. Employees’ reactions to nearby nature at their workplace: The wild and the tame. Landsc. Urban Plan. 2007, 82, 17–24. [Google Scholar] [CrossRef]
- Nordh, H.; Alalouch, C.; Hartig, T. Assessing restorative components of small urban parks using conjoint methodology. Urban For. Urban Green. 2011, 10, 95–103. [Google Scholar] [CrossRef]
- Wohlwill, J.F. Amount of stimulus exploration and preference as differential functions of stimulus complexity. Percept. Psychophys. 1968, 4, 307–312. [Google Scholar] [CrossRef] [Green Version]
- Day, H. Evaluations of subjective complexity, pleasingness and interestingness for a series of random polygons varying in complexity. Percept. Psychophys. 1967, 2, 281–286. [Google Scholar] [CrossRef]
- Dupont, L.; Ooms, K.; Duchowski, A.T.; Antrop, M.; Van Eetvelde, V. Investigating the visual exploration of the rural-urban gradient using eye-tracking. Spat. Cogn. Comput. 2017, 17, 65–88. [Google Scholar] [CrossRef]
- Wu, S. Applying Eye Tracking Technology to Explore Relationships among Landscape Preference, Attention Restoration, Image Features, and Fixation Numbers. Ph.D. Thesis, Feng Chia University, Taichung, Taiwan, 2015. [Google Scholar]
- Huang, S. The Effect of Landscape Properties on Viewing Behaviour. Ph.D. Thesis, Taiwan University, Taipei, Taiwan, 2016. [Google Scholar]
- Weidong, Z.; Qian, L.; Hailan, F. An Eye-movement Research on City Greening Landscape Appreciation. Psychol. Sci. 2009, 32, 801–803. [Google Scholar]
- Nordh, H.; Hagerhall, C.M.; Holmqvist, K. Tracking restorative components: Patterns in eye movements as a consequence of a restorative rating task. Landsc. Res. 2013, 38, 101–116. [Google Scholar] [CrossRef]
- Henderson, J.M. Human gaze control during real-world scene perception. Trends Cogn. 2003, 7, 498–504. [Google Scholar] [CrossRef] [PubMed]
- Strumse, E. Perceptual dimensions in the visual preferences for agrarian landscapes in western norway. J. Environ. Psychol. 1994, 14, 17–31. [Google Scholar] [CrossRef]
- Yu, K. Cultural variations in landscape preference: Comparisons among Chinese sub-groups and Western design experts. Landsc. Urban Plan. 1995, 32, 107–126. [Google Scholar] [CrossRef]

| Design Intensity | F/H | p | |||||
|---|---|---|---|---|---|---|---|
| Lowest(N = 39) | Low(N = 39) | Moderate(N = 39) | High(N = 39) | ||||
| Eye-tracking metrics | Dwell time percent | 18.99 ± 8.94 | 22.65 ± 8.50 | 25.27 ± 10.91 | 30.63 ± 14.11 | 40.554 ‡ | 0.000 |
| Fixation percent | 19.25 ± 8.74 | 22.97 ± 8.50 | 25.04 ± 9.85 | 30.01 ± 12.25 | 40.504 ‡ | 0.000 | |
| Fixation count | 9.40 ± 4.63 | 11.16 ± 4.53 | 12.17 ± 5.23 | 14.45 ± 5.99 | 33.711 ‡ | 0.000 | |
| Visited ranking * | 2.00(2.00) | 3.00(2.00) | 2.00(2.00) | 3.00(2.00) | 58.736 † | 0.000 | |
| Preference * | 1.00(1.00) | 2.00(1.00) | 3.00(2.00) | 3.00(2.00) | 192.123 † | 0.000 | |
| Restorative ratings * | 4.75(2.25) | 5.00(2.00) | 5.00(1.75) | 5.50(1.25) | 30.464 † | 0.000 | |
| Variable | 2 | 3 | 4 | 5 | 6 | 7 | |
|---|---|---|---|---|---|---|---|
| 1 | Design intensity | 0.475 *** | 0.193 *** | 0.340 *** | 0.341 *** | 0.321 *** | 0.141 *** |
| 2 | Preference | - | 0.116 *** | 0.147 *** | 0.148 *** | 0.142 *** | 0.002 |
| 3 | Restorative rating | 0.116 *** | - | 0.063 | 0.075 * | 0.045 | 0.026 |
| 4 | Dwell time percent | 0.475 *** | 0.063 | - | 0.942 *** | 0.885 *** | 0.255 *** |
| 5 | Fixation percent | 0.148 *** | 0.075 * | 0.942 *** | - | 0.936 *** | 0.275 *** |
| 6 | Fixation count | 0.142 *** | 0.045 | 0.885 *** | 0.936 *** | - | 0.248 *** |
| 7 | Visited ranking | 0.002 | 0.026 | 0.255 *** | 0.275 *** | 0.248 *** | - |
| Independent | Dependent | Model | Adj-R2 | F | p | Constant | b1 | b2 |
|---|---|---|---|---|---|---|---|---|
| Design intensity | Preference | Linear | 0.225 | 231.219 | 0.000 | 1.314 *** | 0.475 *** | |
| Quadratic | 0.238 | 123.591 | 0.000 | 0.698 *** | 1.091 *** | −0.123 *** | ||
| Restorative rating | Linear | 0.044 | 38.000 | 0.000 | 4.357 *** | 0.240 *** | ||
| Quadratic | 0.043 | 19.004 | 0.000 | 4.408 *** | 0.190 | 0.010 | ||
| Dwell time percent | Linear | 0.129 | 119.151 | 0.000 | 15.002 *** | 3.754 *** | ||
| Quadratic | 0.130 | 60.213 | 0.000 | 17.141 *** | 1.615 | 0.428 | ||
| Fixation percent | Linear | 0.129 | 118.508 | 0.000 | 15.726 *** | 3.435 *** | ||
| Quadratic | 0.129 | 56.629 | 0.000 | 17.287 *** | 1.874 | 0.312 | ||
| Fixation count | Linear | 0.110 | 99.044 | 0.000 | 7.749 *** | 1.618 *** | ||
| Quadratic | 0.109 | 49.756 | 0.000 | 8.408 *** | 0.958 | 0.132 | ||
| Visited Ranking | Linear | 0.019 | 16.037 | 0.000 | 2.148 *** | 0.141 *** | ||
| Quadratic | 0.029 | 12.868 | 0.000 | 1.545 *** | 0.744 *** | −0.121 ** | ||
| Preference | Restorative rating | Linear | 0.015 | 12.843 | 0.000 | 4.603 *** | 0.142 ** | |
| Quadratic | 0.014 | 6.440 | 0.002 | 4.553 *** | 0.192 | −0.010 |
Publisher’s Note: MDPI stays neutral with regard to jurisdictional claims in published maps and institutional affiliations. |
© 2021 by the authors. Licensee MDPI, Basel, Switzerland. This article is an open access article distributed under the terms and conditions of the Creative Commons Attribution (CC BY) license (https://creativecommons.org/licenses/by/4.0/).
Share and Cite
Wu, Y.; Zhuo, Z.; Liu, Q.; Yu, K.; Huang, Q.; Liu, J. The Relationships between Perceived Design Intensity, Preference, Restorativeness and Eye Movements in Designed Urban Green Space. Int. J. Environ. Res. Public Health 2021, 18, 10944. https://doi.org/10.3390/ijerph182010944
Wu Y, Zhuo Z, Liu Q, Yu K, Huang Q, Liu J. The Relationships between Perceived Design Intensity, Preference, Restorativeness and Eye Movements in Designed Urban Green Space. International Journal of Environmental Research and Public Health. 2021; 18(20):10944. https://doi.org/10.3390/ijerph182010944
Chicago/Turabian StyleWu, Yu, Zhixiong Zhuo, Qunyue Liu, Kunyong Yu, Qitang Huang, and Jian Liu. 2021. "The Relationships between Perceived Design Intensity, Preference, Restorativeness and Eye Movements in Designed Urban Green Space" International Journal of Environmental Research and Public Health 18, no. 20: 10944. https://doi.org/10.3390/ijerph182010944
APA StyleWu, Y., Zhuo, Z., Liu, Q., Yu, K., Huang, Q., & Liu, J. (2021). The Relationships between Perceived Design Intensity, Preference, Restorativeness and Eye Movements in Designed Urban Green Space. International Journal of Environmental Research and Public Health, 18(20), 10944. https://doi.org/10.3390/ijerph182010944