
People with Disabilities in the Workplace: Results of a Survey Conducted among Polish and Finnish Employers


Abstract
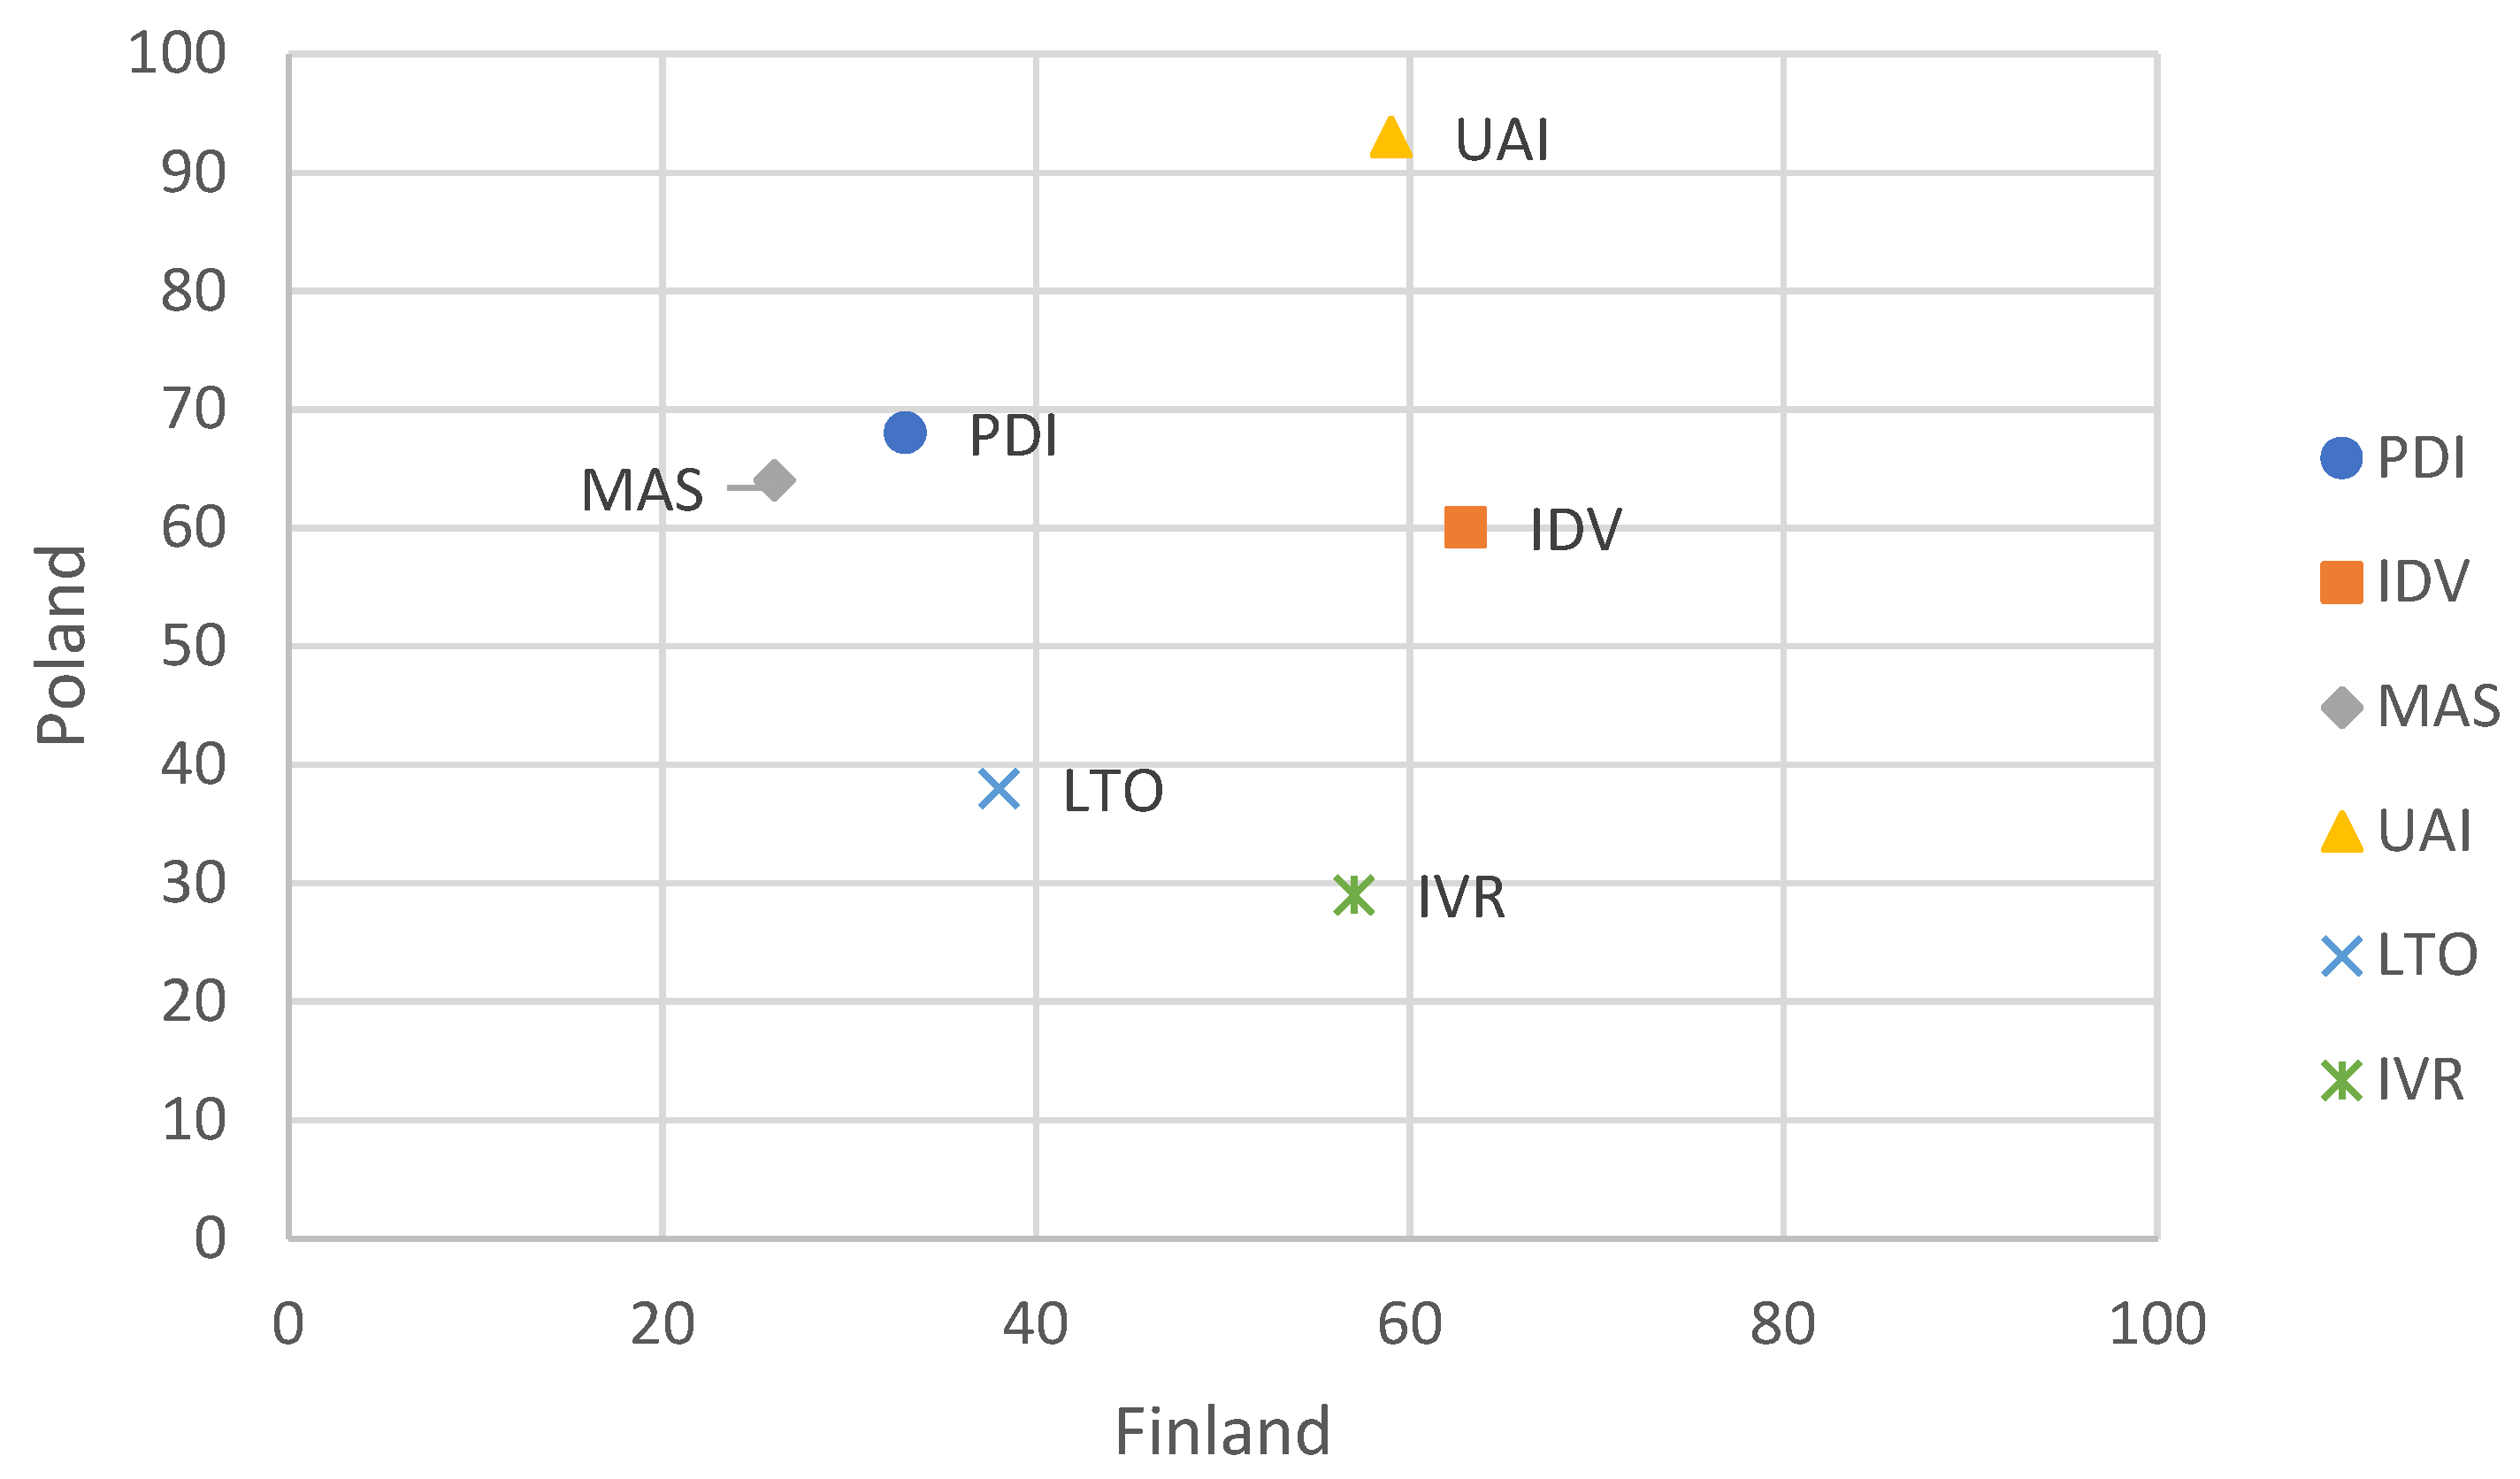
:1. Introduction
2. Materials and Methods
2.1. Data Collection Process
2.2. Analytical Methods
3. Results
3.1. Sample Characteristics
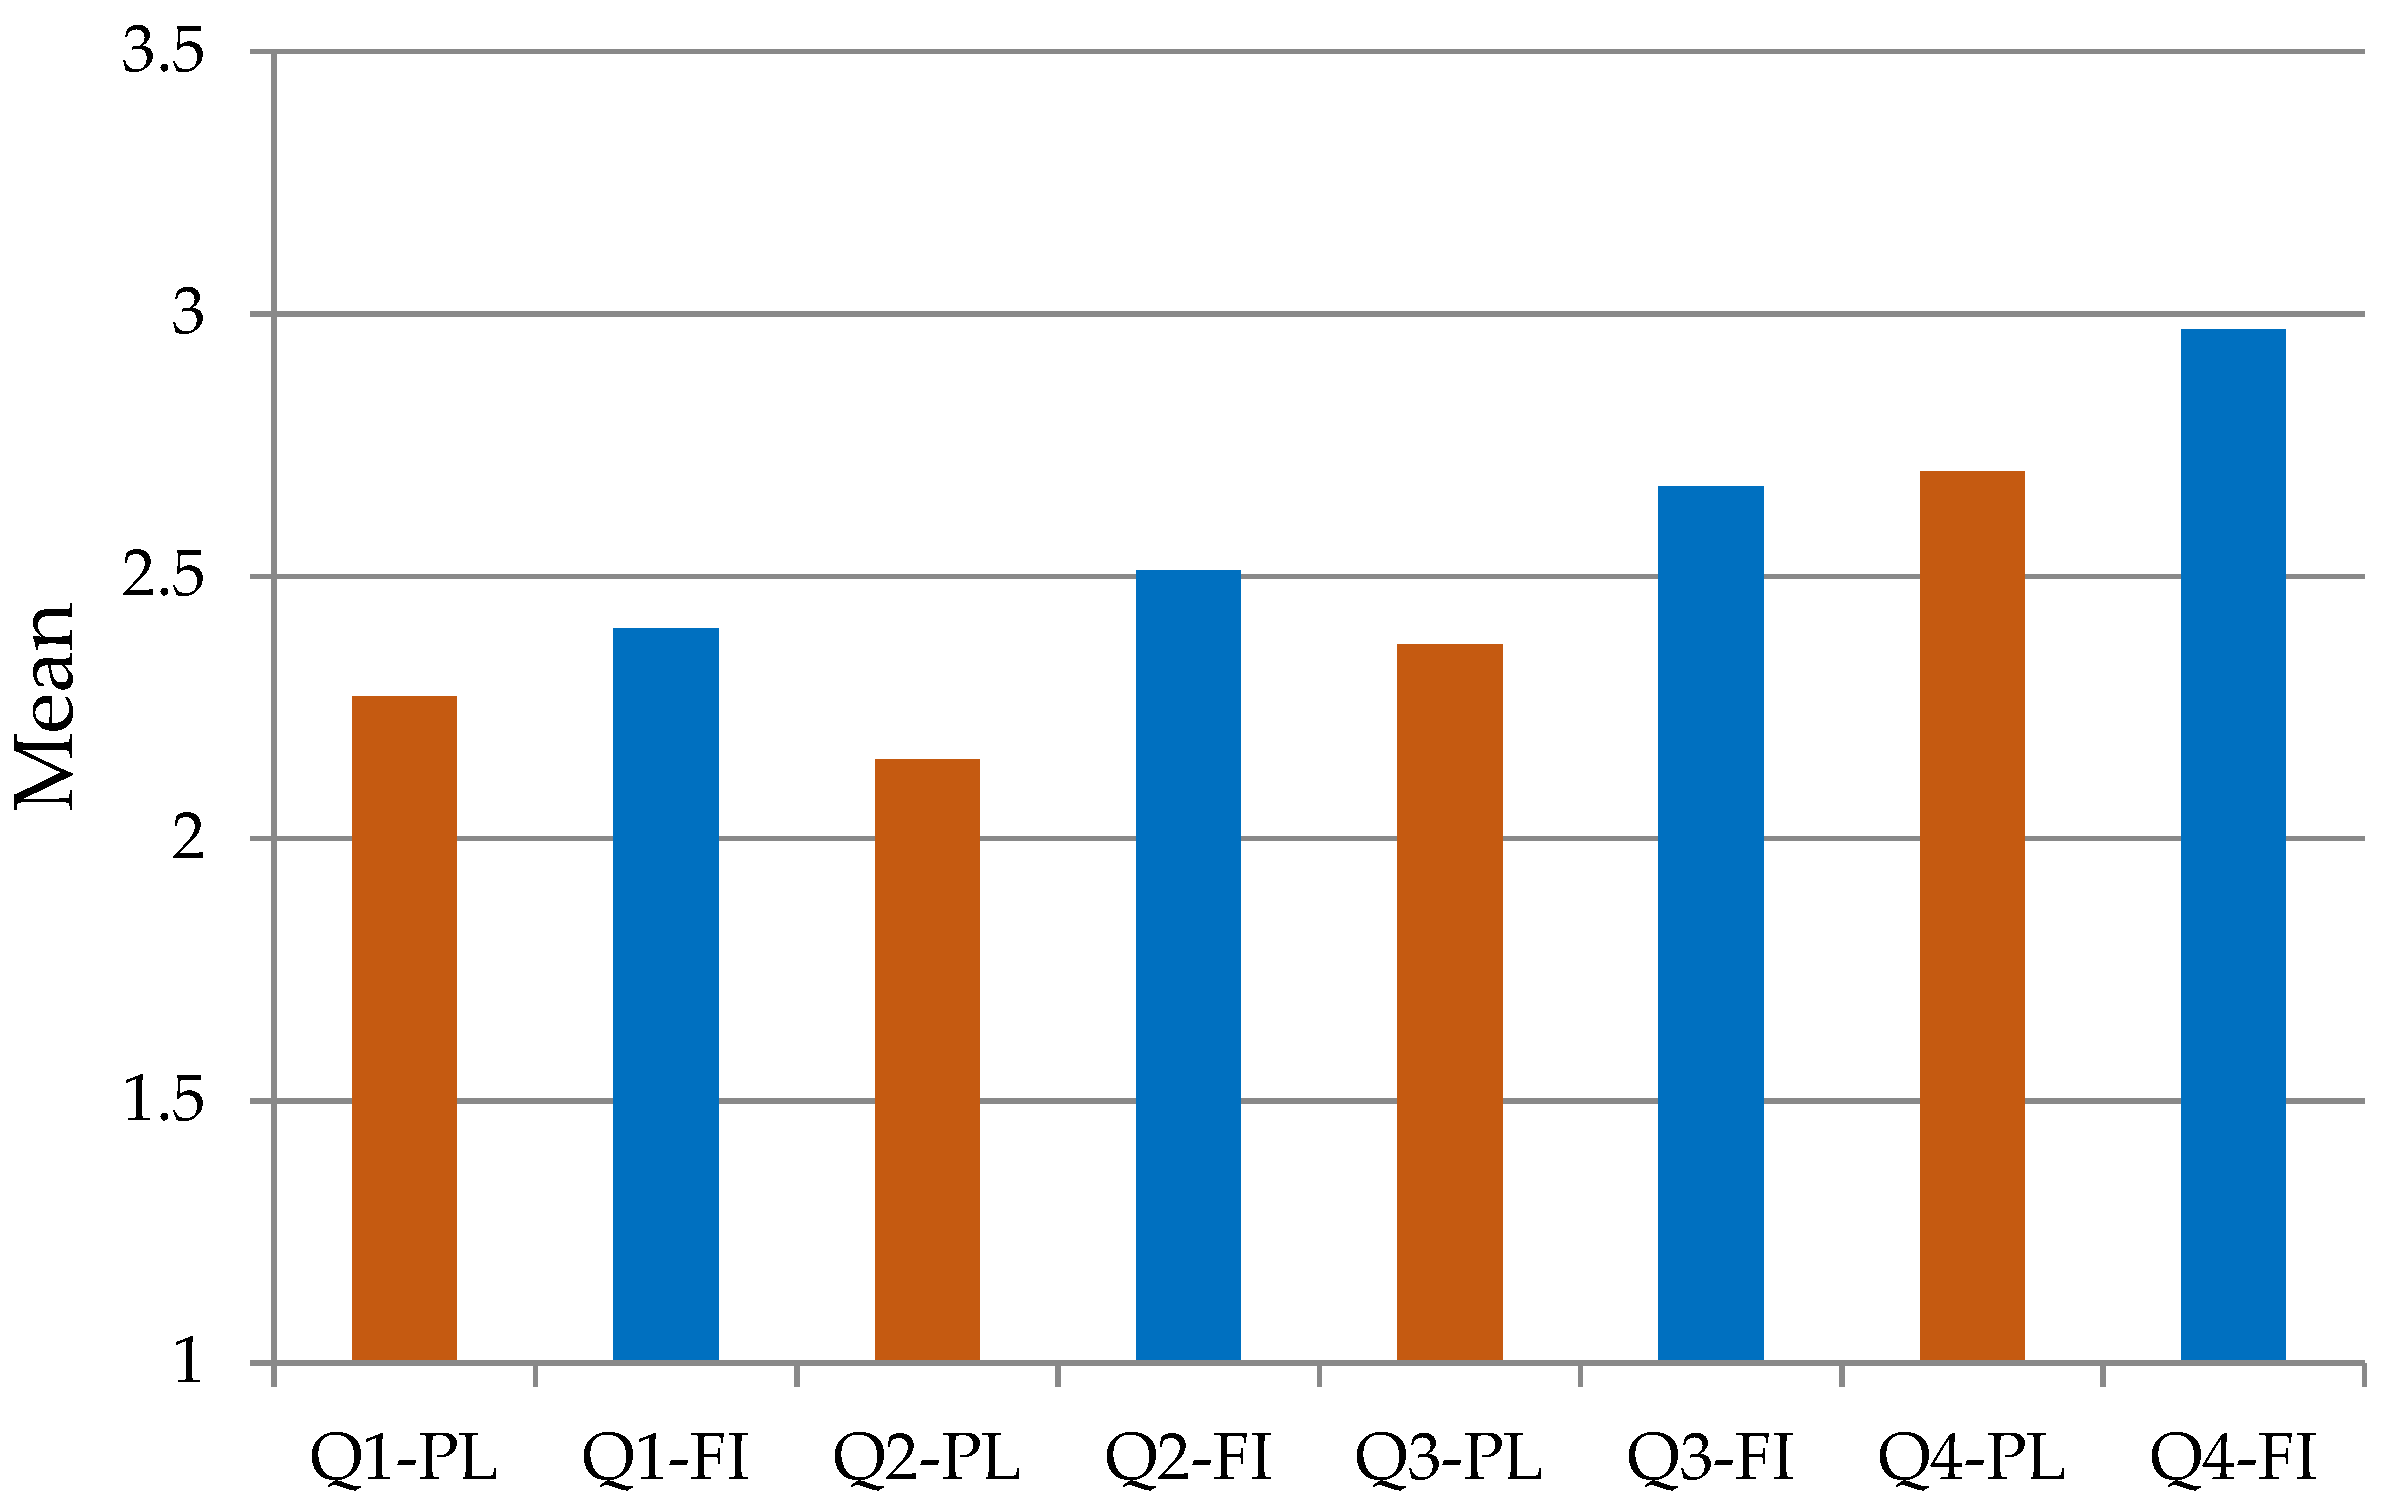
3.2. Evaluation of Differences in Opinions Expressed by Respondents in Finland and Poland
3.3. Evaluation of Differences in Opinions with Respect to Various Covariates
- −
- If significant differences were found in terms of gender, it meant a lower evaluation given by women than by men (Q1—Finland and Poland, Q2—Finland, Q3—Poland),
- −
- If the knowledge of disability was a significantly differentiating characteristic, the respondents familiar with the issues of PwD gave higher average assessments (Q1—Poland, Q2—Poland, Q3—Finland),
- −
- If employing PwD in the respondent’s company was a significantly differentiating characteristic, the affirmative answers were accompanied by averagely higher assessments (Q1—Finland, Q2—Finland and Poland, Q3—Finland),
- −
- Age was an important characteristic only in Poland for two questions and its significance varied—younger people evaluated the state policy better (Q2) but at the same time they were more often against privileges for PwD (Q4),
- −
- No average assessments in Q1–Q4 showed any significant differentiation in terms of company’s size,
- −
- No average assessments in Q1–Q4 showed any significant differentiation in terms of the importance of a competence defined as the ability to work in a varied team.
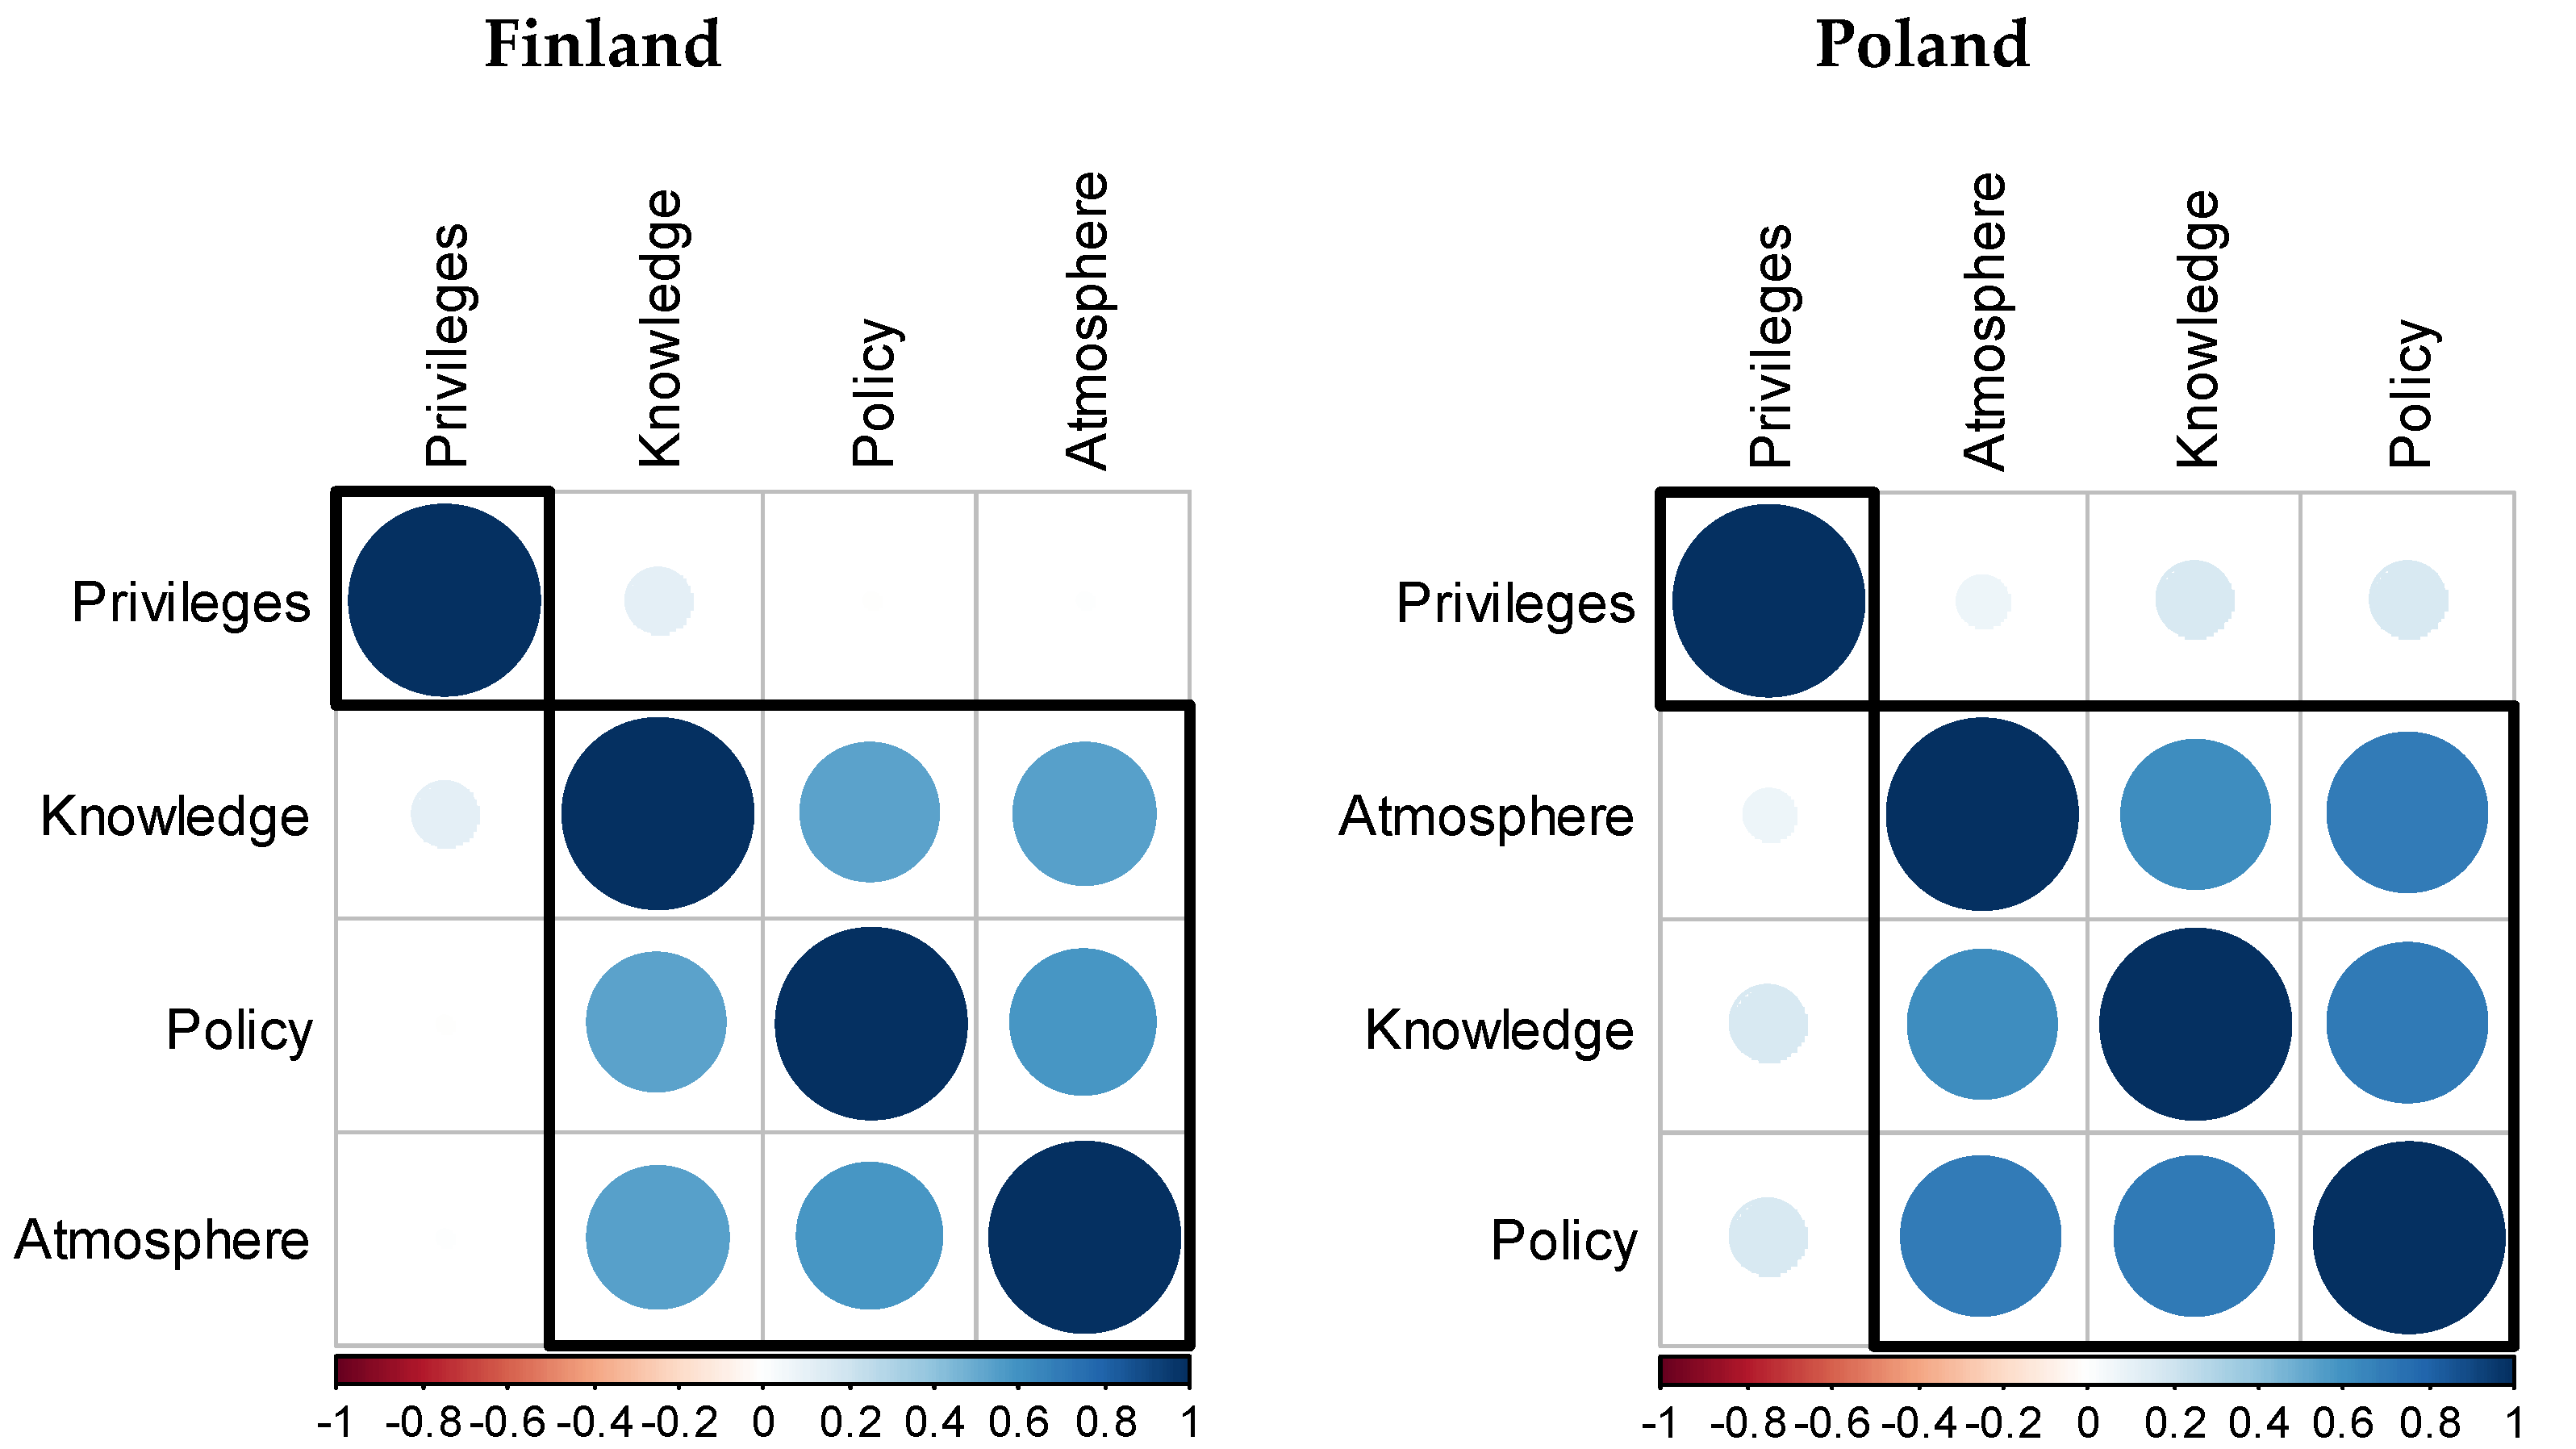
3.4. Correlations of Answers to Questions Q1–Q4
4. Discussion
5. Conclusions
Author Contributions
Funding
Institutional Review Board Statement
Informed Consent Statement
Data Availability Statement
Acknowledgments
Conflicts of Interest
References
- United Nations. Convention on the Rights of Persons with Disabilities; United Nations: New York, NY, USA, 2006. [Google Scholar]
- Eurostat. Employment of disabled people. Statistical analysis of the 2011 labour force survey ad hoc module. In Statistical Working Papers; Publications Office of the European Union: Luxembourg, 2015. [Google Scholar]
- European Disability Forum. European Human Rights Report 2020: Poverty and Social Exclusion of Persons with Disabilities, Issue 4–2020; European Disability Forum: Brussels, Belgium, 2020. [Google Scholar]
- Załuska, U.; Grześkowiak, A.; Kozyra, C.; Kwiatkowska-Ciotucha, D. Ambassador of people with disabilities in the workplace-conducive demographic and professional characteristics. Int. J. Environ. Res. Public Health 2020, 17, 7036. [Google Scholar] [CrossRef]
- United Nations Development Programme. Disability Inclusive Development in UNDP. Guidance and Entry Points; United Nations Development Programme: New York, NY, USA, 2018. [Google Scholar]
- Bonaccio, S.; Connelly, C.E.; Gellatly, I.R.; Jetha, A.; Martin Ginis, K.A. The participation of people with disabilities in the workplace across the employment cycle: Employer concerns and research evidence. J. Bus. Psychol. 2020, 35, 135–158. [Google Scholar] [CrossRef] [Green Version]
- Khan, N.; Korac-Kakabadse, N.; Skouloudis, A.; Dimopoulos, A. Diversity in the workplace: An overview of disability employment disclosures among UK firms. Corp. Soc. Responsib. Environ. Manag. 2019, 26, 170–185. [Google Scholar] [CrossRef] [Green Version]
- Wang, Z.; Xu, X.; Han, Q.; Chen, Y.; Jiang, J.; Ni, G.-X. Factors associated with public attitudes towards persons with disabilities: A systematic review. BMC Public Health 2021, 21, 1058. [Google Scholar] [CrossRef]
- Palad, Y.Y.; Barquia, R.B.; Domingo, H.C.; Flores, C.K.; Padilla, L.I.; Ramel, J.M.D. Scoping review of instruments measuring attitudes toward disability. Disabil. Health J. 2016, 9, 354–374. [Google Scholar] [CrossRef] [PubMed]
- Antonak, R.F.; Livneh, H. Measurement of attitudes towards persons with disabilities. Disabil. Rehabil. 2000, 22, 211–224. [Google Scholar] [CrossRef] [PubMed]
- Burke, J.; Bezyak, J.; Fraser, R.T.; Pete, J.; Ditchman, N.; Chan, F. Employers′ attitudes towards hiring and retaining people with disabilities: A review of the literature. Aust. J. Rehabil. Couns. 2013, 19, 21–38. [Google Scholar] [CrossRef]
- Chan, F.; Strauser, D.; Gervey, R.; Lee, E.-J. Introduction to demand-side factors related to employment of people with disabilities. J. Occup. Rehabil. 2010, 20, 407–411. [Google Scholar] [CrossRef] [Green Version]
- Dunstan, D.A.; Maceachen, E. A theoretical model of co-worker responses to work reintegration processes. J. Occup. Rehabil. 2014, 24, 189–198. [Google Scholar] [CrossRef]
- Hofstede, G. Culture and organizations. Int. Stud. Manag. Organ. 1980, 10, 15–41. [Google Scholar] [CrossRef]
- Hofstede, G. Dimensionalizing cultures. The Hofstede model in context. Online Read. Psychol. Cult. 2011, 2. [Google Scholar] [CrossRef]
- Hofstede, G.; Hofstede, G.J.; Minkov, M. Cultures and Organizations: Software of the Mind Intercultural Cooperation and Its Importance for Survival, 3rd ed.; McGraw-Hill: New York, NY, USA, 2010. [Google Scholar]
- Available online: https://www.hofstede-insights.com/product/compare-countries/ (accessed on 16 August 2021).
- Kirkman, B.L.; Lowe, K.B.; Gibson, C.B. A quarter century of culture′s consequences: A review of empirical research incorporating Hofstede′s cultural values framework. J. Int. Bus. Stud. 2006, 37, 285–320. [Google Scholar] [CrossRef]
- Witte, A.E. Making the case for a post-national cultural analysis of organizations. J. Manag. Inq. 2012, 21, 141–159. [Google Scholar] [CrossRef]
- McSweeney, B. Hofstede′s model of national cultural differences and their consequences: A triumph of faith–a failure of analysis. Hum. Relat. 2002, 55, 89–118. [Google Scholar] [CrossRef]
- Warner, R.M. Applied Statistics: From Bivariate through Multivariate Techniques; Sage Publications, Inc.: Southend Oaks, CA, USA, 2012. [Google Scholar]
- Wei, T.; Simko, V. R Package ‘Corrplot’: Visualization of a Correlation Matrix. (Version 0.90). 2021. Available online: https://github.com/taiyun/corrplot (accessed on 16 August 2021).
- Barr, J.J.; Bracchitta, K. Attitudes toward individuals with disabilities: The effects of age, gender, and relationship. J. Relat. Res. 2012, 3, 10–17. [Google Scholar] [CrossRef]
- Huskin, P.R.; Reiser-Robbins, C.; Kwon, S. Attitudes of undergraduate students toward persons with disabilities: Exploring effects of contact experience on social distance across ten disability types. Rehabil. Couns. Bull. 2017, 62, 53–63. [Google Scholar] [CrossRef] [Green Version]
- Unger, D.D. Employers′ attitudes toward persons with disabilities in the workforce. Focus Autism Other Dev. Disabl. 2016, 17, 2–10. [Google Scholar] [CrossRef]
- McDonnall, M.C.; Crudden, A.; O′Mally, J. Predictors of employer attitudes toward people who are blind or visually impaired as employees. JVR 2015, 42, 41–50. [Google Scholar] [CrossRef]
- Daruwalla, P.; Darcy, S. Personal and societal attitudes to disability. Ann. Tour. Res. 2005, 32, 549–570. [Google Scholar] [CrossRef] [Green Version]
- Kwiatkowska-Ciotucha, D.; Załuska, U.; Grześkowiak, A. Osoby z Niepełnosprawnością na Otwartym Rynku Pracy. Bariery Skutecznej Inkluzji w Miejscu Pracy; Publishing House of Wrocław University of Economics: Wrocław, Poland, 2020; ISBN 978-83-7695-806-4. [Google Scholar]
- Nelissen, P.T.J.H.; Hülsheger, U.R.; van Ruitenbeek, G.M.C.; Zijlstra, F.R.H. How and when stereotypes relate to inclusive behavior toward people with disabilities. Int. J. Hum. Resour. Manag. 2015, 27, 1610–1625. [Google Scholar] [CrossRef] [Green Version]
- Grześkowiak, A.; Załuska, U.; Kozyra, C.; Kwiatkowska-Ciotucha, D. Perception and acceptance of people with disabilities by employers and co-workers. Int. J. Environ. Res. Public Health 2021, 18, 5278. [Google Scholar] [CrossRef]
- Popovich, P.M.; Scherbaum, C.A.; Scherbaum, K.L.; Polinko, N. The assessment of attitudes toward individuals with disabilities in the workplace. J. Psychol. 2003, 137, 163–177. [Google Scholar] [CrossRef]
- Hergenrather, K.; Rhodes, S. Exploring undergraduate student attitudes toward persons with disabilities. Rehabil. Couns. Bull. 2016, 50, 66–75. [Google Scholar] [CrossRef]
- WHO; The World Bank. World Development Report 2011: Conflict, Security, and Development. 2011. Available online: https://openknowledge.worldbank.org/handle/10986/4389 (accessed on 16 August 2021).
- World Health Organization. The World Bank. World Report on Disability. 2011. Available online: https://documents1.worldbank.org/curated/en/665131468331271288/pdf/627830WP0World00PUBLIC00BOX361491B0.pdf (accessed on 16 August 2021).
- United Nations Department of Economic and Social Affairs. Disability and Development Report 2018. Realizing the Sustainable Development Goals by, for and with Persons with Disabilities. United Nations. New York. 2019. Available online: https://www.un.org/development/desa/disabilities/wp-content/uploads/sites/15/2019/07/disability-report-chapter2.pdf (accessed on 16 August 2021).
- Riches, V.C.; Green, V.A. Social integration in the workplace for people with disabilities: An Australian perspective. J. Vocat. Rehabil. 2003, 19, 127–142. [Google Scholar]
- Kulkarni, M.; Boehm, S.A.; Basu, S. Workplace inclusion of persons with a disability: Comparison of Indian and German multinationals. Equal. Divers. Incl. Int. J. 2016, 35, 397–414. [Google Scholar] [CrossRef]
- Bento, J.P.C.; Kuznetsova, Y. Workplace adaptations promoting the inclusion of persons with disabilities in mainstream employment: A case-study on employers′ responses in Norway. Soc. Incl. 2018, 6, 34–45. [Google Scholar]
- Kuznetsova, Y.; Yalcin, B. Inclusion of persons with disabilities in mainstream employment: Is it really all about the money? A case study of four large companies in Norway and Sweden. Disabil. Soc. 2017, 32, 233–253. [Google Scholar] [CrossRef]
- Bam, A.; Ronnie, L. Inclusion at the workplace: An exploratory study of people with disabilities in South Africa. Int. J. Disabil. Manag. 2020, 15, E6. [Google Scholar] [CrossRef]
- Wehman, P. Workplace inclusion: Persons with disabilities and coworkers working together. J. Vocat. Rehabil. 2003, 18, 131–141. [Google Scholar]
- Kirsh, B.; Krupa, T.; Cockburn, L.; Gewurtz, R. A Canadian model of work integration for persons with mental illnesses. Disabil. Rehabil. 2010, 32, 1833–1846. [Google Scholar] [CrossRef]

| No | Question |
|---|---|
| Q1 | How do you think employers in your country get sufficient knowledge on how to employ a person with disabilities and organize his/her work? |
| Q2 | In your opinion, does your country carry out an effective policy that allows for full integration of the people with disabilities? |
| Q3 | In your opinion, is there social atmosphere of understanding the needs and possibilities of people with disabilities in your country? |
| Q4 | Do you think that the people with disabilities who have a job should have special employee privileges, for example, a shorter working day, longer holidays, etc., in your country? |
| Characteristic | Categories | Percentage of Respondents (n = 414) | ||
|---|---|---|---|---|
| Whole Sample | Finland | Poland | ||
| Gender | Female | 49.3 | 36.5 | 61.2 |
| Male | 50.7 | 63.5 | 38.8 | |
| Age | Up to 35 years old | 49.8 | 50.5 | 49.1 |
| Over 35 years old | 50.2 | 49.5 | 50.9 | |
| Knowledge about | Good or very good | 35.7 | 31.8 | 39.3 |
| disability | Average or none | 64.3 | 68.2 | 60.7 |
| Company’s size | Up to 9 people | 39.4 | 40.5 | 38.3 |
| 10 and more people | 60.6 | 59.5 | 61.7 | |
| Employment of PwD | Employs | 33.6 | 38.8 | 28.8 |
| Does not employ | 66.4 | 61.2 | 71.2 | |
| Assessment of competence: working in a diverse team | Very important | 49 | 49.5 | 48.6 |
| Another assessment | 51 | 50.5 | 51.4 | |
| Assessment of competence: sensitivity to social issues | Very important | 39.1 | 40.5 | 37.9 |
| Another assessment | 60.9 | 59.5 | 62.1 | |
| Question | t-Test Score | p-Value |
|---|---|---|
| Q1—Knowledge | −1.590 | 0.113 |
| Q2—Policy | −4.608 | 0.000 |
| Q3—Atmosphere | −3.863 | 0.000 |
| Q4—Privileges | −3.749 | 0.000 |
| Covariate | Finland | Poland | ||
|---|---|---|---|---|
| t-Test Score | p-Value | t-Test Score | p-Value | |
| Gender | −1.975 | 0.050 | −2.720 | 0.007 |
| Age | 1.114 | 0.267 | 0.596 | 0.552 |
| Company’s size | 0.617 | 0.538 | −0.385 | 0.701 |
| Knowledge about disability | −1.927 | 0.057 | −2.224 | 0.028 |
| Employment of PwD | 3.052 | 0.003 | 0.709 | 0.479 |
| Work in a varied team | 1.797 | 0.074 | 0.031 | 0.975 |
| Sensitivity to social issues | 0.755 | 0.451 | −0.355 | 0.723 |
| Covariate | Finland | Poland | ||
|---|---|---|---|---|
| t-Test Score | p-Value | t-Test Score | p-Value | |
| Gender | −2.961 | 0.003 | −1.266 | 0.207 |
| Age | 1.565 | 0.119 | 2.744 | 0.007 |
| Company’s size | 0.689 | 0.491 | 0.062 | 0.950 |
| Knowledge about disability | −1.917 | 0.057 | −3.089 | 0.002 |
| Employment of PwD | 2.529 | 0.012 | 2.082 | 0.040 |
| Work in a varied team | 0.640 | 0.523 | 0.348 | 0.728 |
| Sensitivity to social issues | 0.806 | 0.421 | 0.086 | 0.931 |
| Covariate | Finland | Poland | ||
|---|---|---|---|---|
| t-Test Score | p-Value | t-Test Score | p-Value | |
| Gender | −1.612 | 0.109 | −2.278 | 0.024 |
| Age | 1.449 | 0.149 | 1.056 | 0.292 |
| Company’s size | 0.305 | 0.761 | −0.123 | 0.902 |
| Knowledge about disability | −2.319 | 0.022 | −1.127 | 0.261 |
| Employment of PwD | 2.468 | 0.015 | 0.974 | 0.333 |
| Work in a varied team | 0.230 | 0.818 | 1.637 | 0.103 |
| Sensitivity to social issues | 0.400 | 0.689 | 1.381 | 0.169 |
| Covariate | Finland | Poland | ||
|---|---|---|---|---|
| t-Test Score | p-Value | t-Test Score | p-Value | |
| Gender | −0.357 | 0.721 | −0.985 | 0.326 |
| Age | −0.946 | 0.345 | −2.441 | 0.015 |
| Company’s size | 0.083 | 0.934 | 1.503 | 0.134 |
| Knowledge about disability | 0.132 | 0.895 | −0.456 | 0.649 |
| Employment of PwD | 1.391 | 0.166 | −0.119 | 0.905 |
| Work in a varied team | −1.716 | 0.088 | −0.661 | 0.510 |
| Sensitivity to social issues | −3.222 | 0.001 | 0.455 | 0.650 |
| Finland | ||||
| Q1—Knowledge | Q2—Policy | Q3—Atmosphere | Q4—Privileges | |
| Q1—Knowledge | 1 | |||
| Q2—Policy | 0.538 ** | 1 | ||
| Q3—Atmosphere | 0.547 ** | 0.590 ** | 1 | |
| Q4—Privileges | 0.116 | −0.008 | 0.008 | 1 |
| Poland | ||||
| Q1—Knowledge | Q2—Policy | Q3—Atmosphere | Q4—Privileges | |
| Q1—Knowledge | 1 | |||
| Q2—Policy | 0.703 ** | 1 | ||
| Q3—Atmosphere | 0.624 ** | 0.700 ** | 1 | |
| Q4—Privileges | 0.169 * | 0.167 * | 0.071 | 1 |
| Covariate | Finland | Poland | ||||||
|---|---|---|---|---|---|---|---|---|
| Q1 | Q2 | Q3 | Q4 | Q1 | Q2 | Q3 | Q4 | |
| Gender | X | X | X | X | ||||
| Age | X | X | ||||||
| Company’s size | ||||||||
| Knowledge about disability | X | X | X | |||||
| Employment of PwD | X | X | X | X | ||||
| Work in a varied team | ||||||||
| Sensitivity to social issues | X | |||||||
Publisher’s Note: MDPI stays neutral with regard to jurisdictional claims in published maps and institutional affiliations. |
© 2021 by the authors. Licensee MDPI, Basel, Switzerland. This article is an open access article distributed under the terms and conditions of the Creative Commons Attribution (CC BY) license (https://creativecommons.org/licenses/by/4.0/).
Share and Cite
Grześkowiak, A.; Załuska, U.; Kwiatkowska-Ciotucha, D.; Kozyra, C. People with Disabilities in the Workplace: Results of a Survey Conducted among Polish and Finnish Employers. Int. J. Environ. Res. Public Health 2021, 18, 10934. https://doi.org/10.3390/ijerph182010934
Grześkowiak A, Załuska U, Kwiatkowska-Ciotucha D, Kozyra C. People with Disabilities in the Workplace: Results of a Survey Conducted among Polish and Finnish Employers. International Journal of Environmental Research and Public Health. 2021; 18(20):10934. https://doi.org/10.3390/ijerph182010934
Chicago/Turabian StyleGrześkowiak, Alicja, Urszula Załuska, Dorota Kwiatkowska-Ciotucha, and Cyprian Kozyra. 2021. "People with Disabilities in the Workplace: Results of a Survey Conducted among Polish and Finnish Employers" International Journal of Environmental Research and Public Health 18, no. 20: 10934. https://doi.org/10.3390/ijerph182010934
APA StyleGrześkowiak, A., Załuska, U., Kwiatkowska-Ciotucha, D., & Kozyra, C. (2021). People with Disabilities in the Workplace: Results of a Survey Conducted among Polish and Finnish Employers. International Journal of Environmental Research and Public Health, 18(20), 10934. https://doi.org/10.3390/ijerph182010934