
School-Level Economic Disparities in Police-Reported Crimes and Active Commuting to School


 ,
,
Abstract
:1. Introduction
2. Materials and Methods
2.1. Study Setting and Participants
2.2. Measurement of Active Commuting to School (ACS)
2.3. Measurement of School Demographics
2.4. Measurement of School Neighborhood
2.5. Measurement of Police-Reported Crime
2.6. Measurement of Population Density, Household Income, and Neighborhood Connectivity
2.7. Statistical Analysis
3. Results
3.1. School- and Neighborhood-Level Descriptive Characteristics
3.2. Associations with ACS
3.3. Associations with ACS
3.4. Associations with Police-Reported Crime
4. Discussion
5. Conclusions
Author Contributions
Funding
Institutional Review Board Statement
Informed Consent Statement
Data Availability Statement
Conflicts of Interest
Appendix A

| Dependent Variable: | |||||||||
|---|---|---|---|---|---|---|---|---|---|
| Active Commuting to School (%) | |||||||||
| (1) | (2) | (3) | (4) | (5) | (6) | (7) | (8) | (9) | |
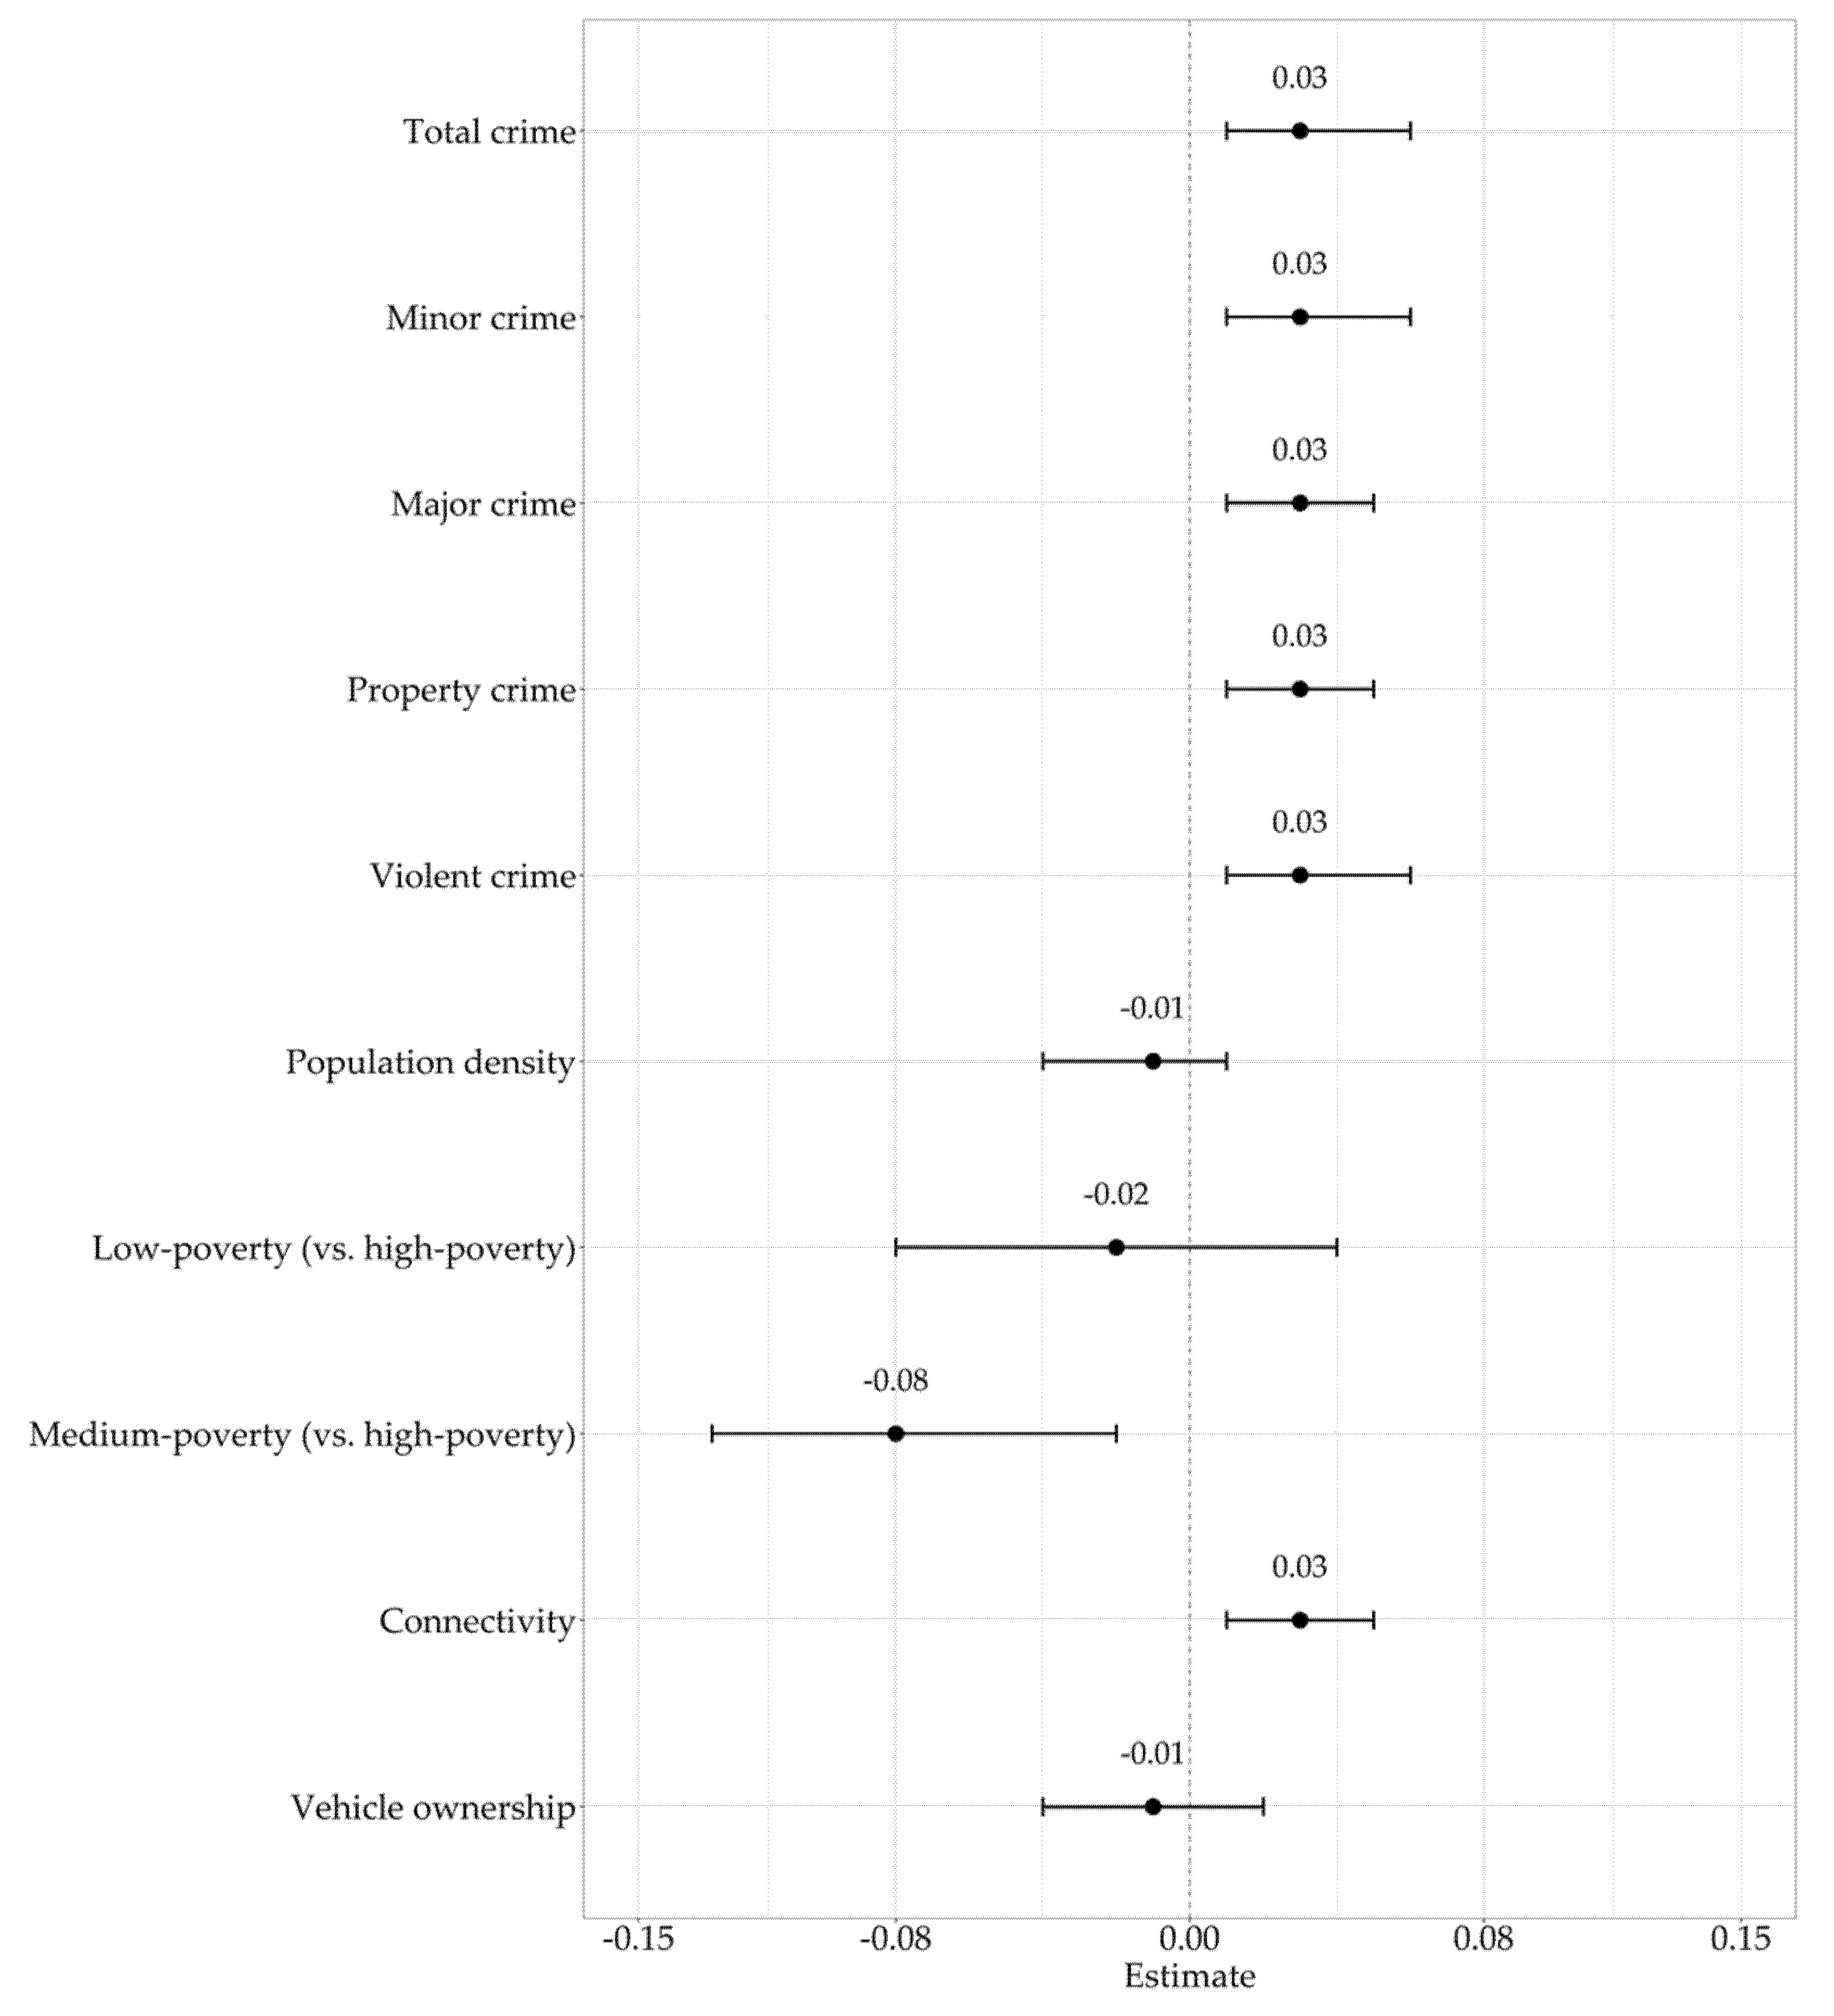
| Total crime | 0.03 * | ||||||||
| (0.01, 0.06) | |||||||||
| Minor crime | 0.03 * | ||||||||
| (0.01, 0.06) | |||||||||
| Major crime | 0.03 * | ||||||||
| (0.01, 0.05) | |||||||||
| Property crime | 0.03 * | ||||||||
| (0.01, 0.05) | |||||||||
| Violent crime | 0.03 * | ||||||||
| (0.01, 0.06) | |||||||||
| Population density | −0.01 | ||||||||
| (−0.04, 0.01) | |||||||||
| Low-poverty (ref = high-poverty) | −0.02 | ||||||||
| (−0.08, 0.04) | |||||||||
| Medium-poverty (ref = high-poverty) | −0.08 * | ||||||||
| (−0.13, −0.02) | |||||||||
| Connectivity | 0.03 * | ||||||||
| (0.01, 0.05) | |||||||||
| Vehicle ownership | −0.01 | ||||||||
| (−0.04, 0.02) | |||||||||
| Intercept | 0.13 * | 0.13 * | 0.13 * | 0.13 * | 0.13 * | 0.14 * | 0.17 * | 0.13 * | 0.14 * |
| (0.11, 0.15) | (0.11, 0.15) | (0.11, 0.15) | (0.11, 0.15) | (0.11, 0.16) | (0.11, 0.16) | (0.13, 0.20) | (0.11, 0.16) | (0.11, 0.16) | |
| Dependent Variable: | |||||
|---|---|---|---|---|---|
| Active Commuting to School (%) | |||||
| (1) | (2) | (3) | (4) | (5) | |
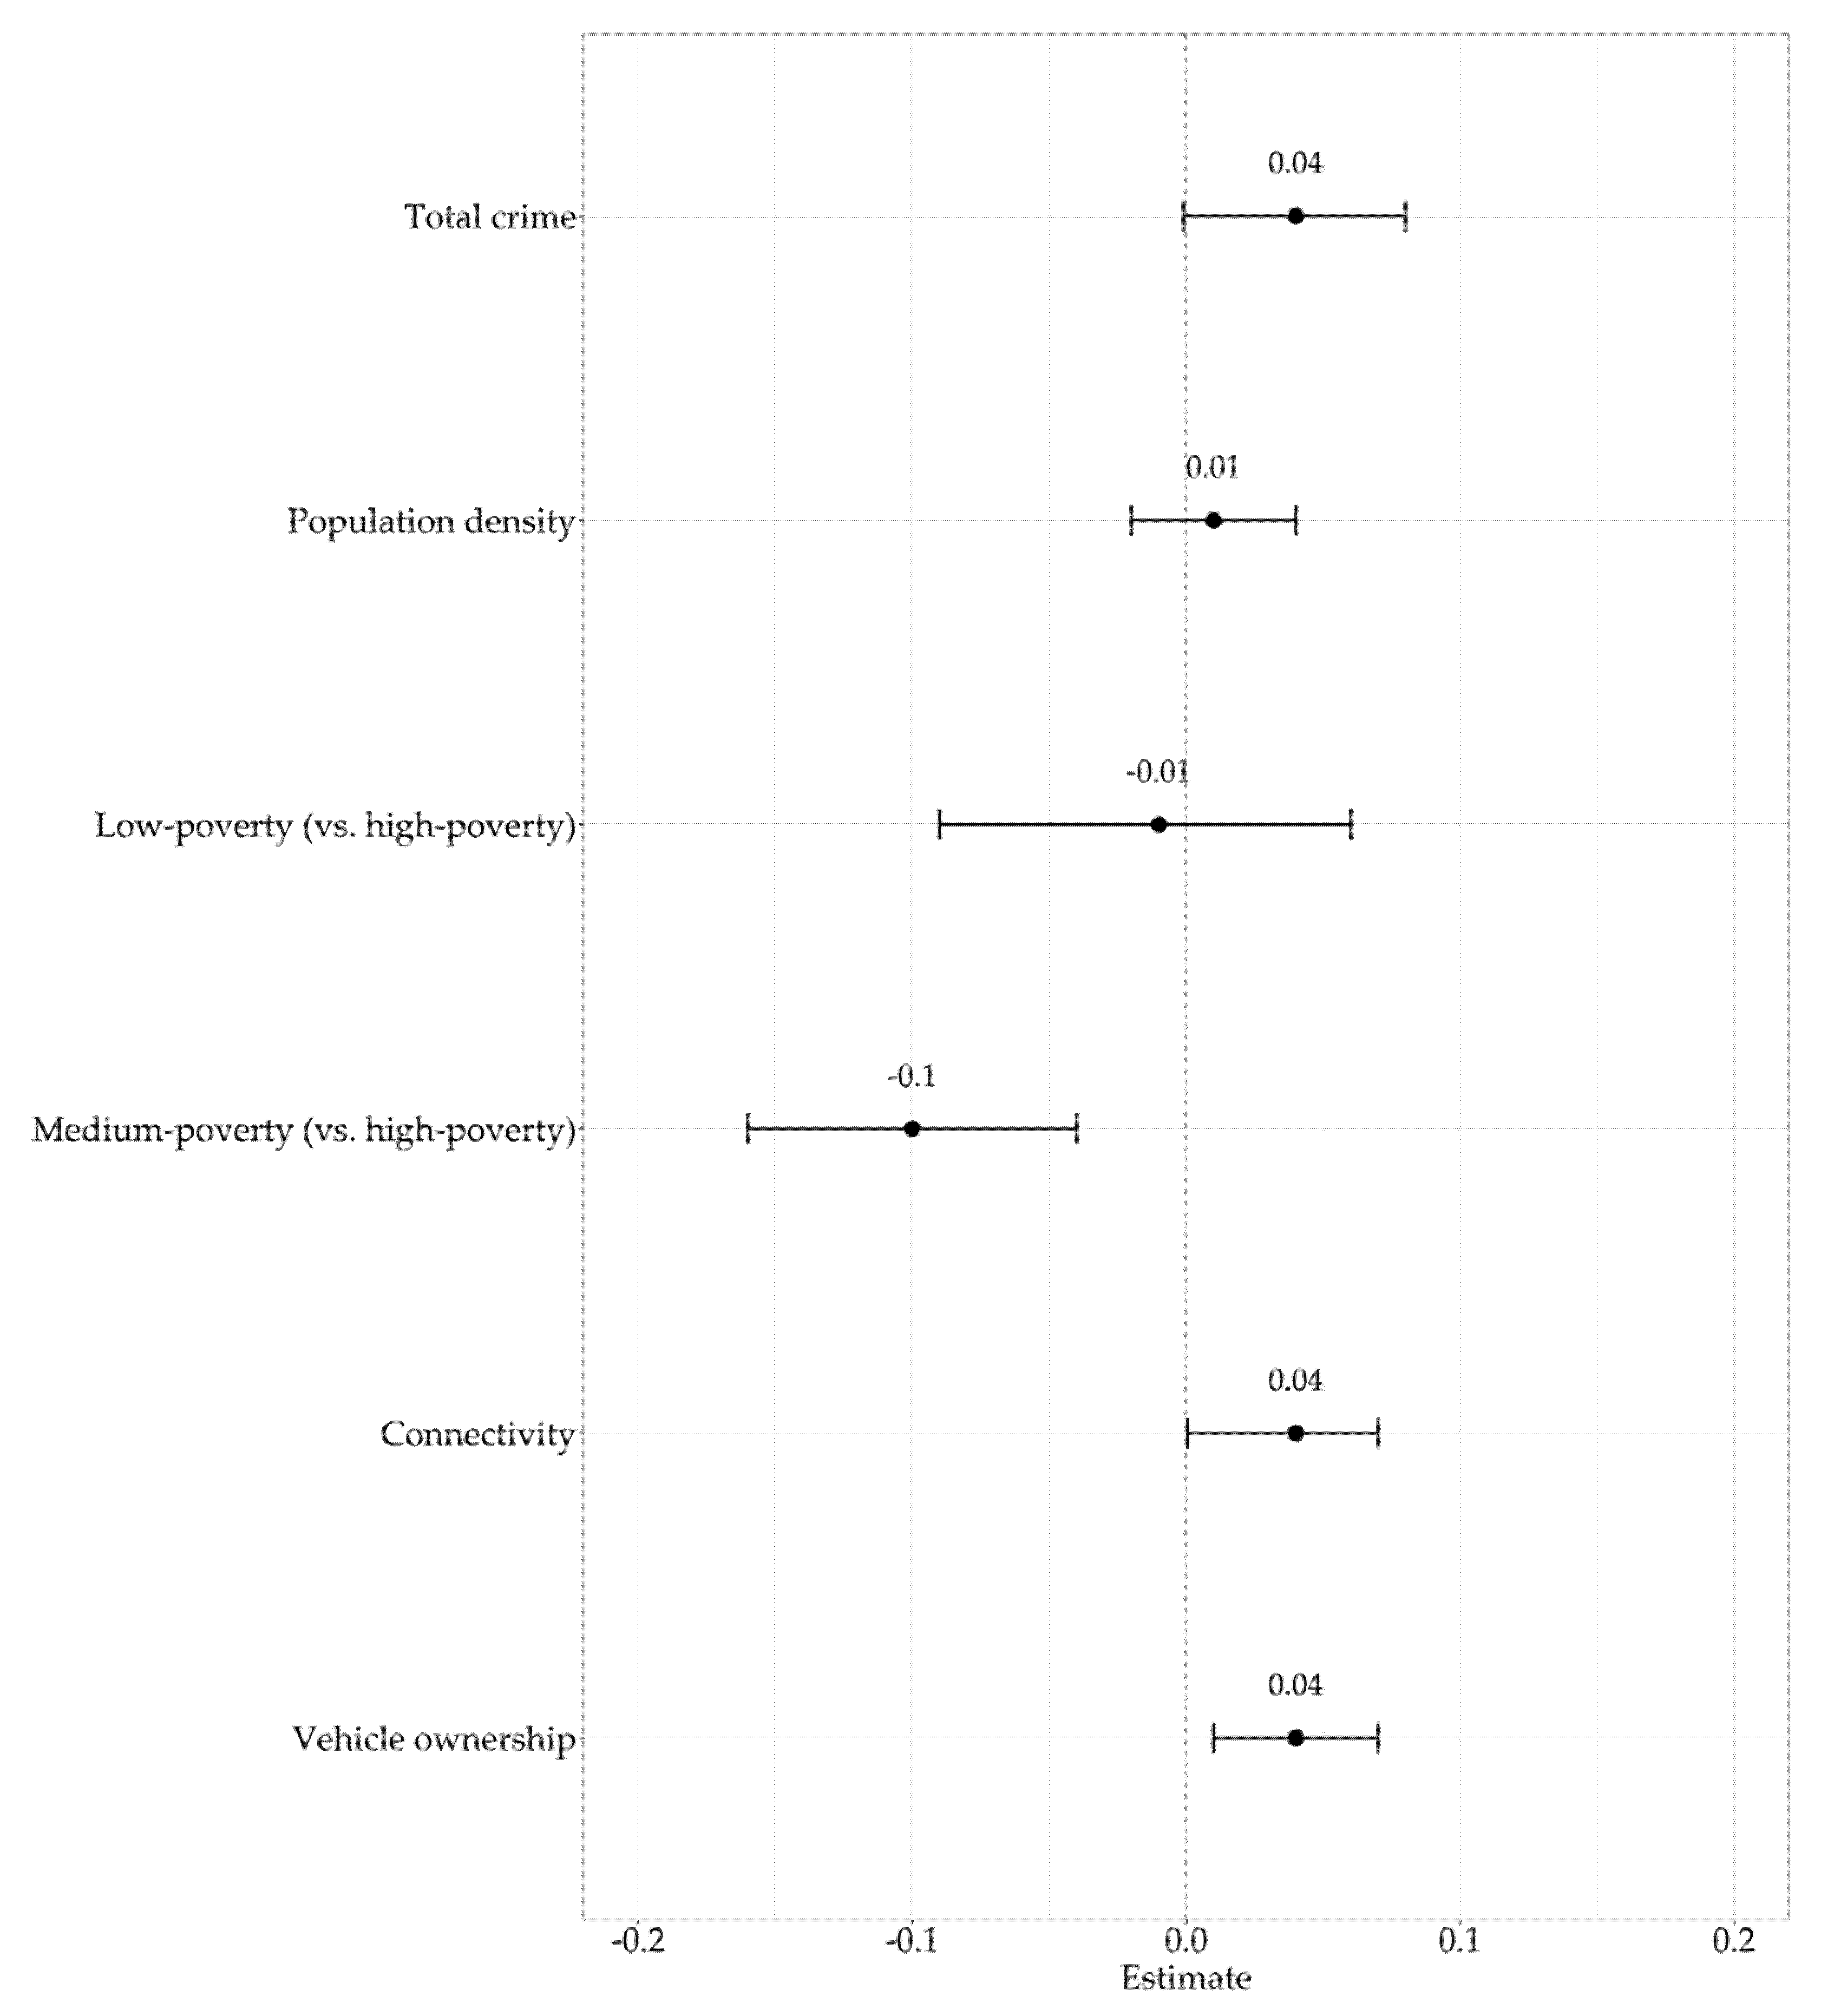
| Total crime | 0.04 | ||||
| (−0.001, 0.08) | |||||
| Minor crime | 0.04 | ||||
| (−0.001, 0.07) | |||||
| Major crime | 0.03 | ||||
| (−0.01, 0.07) | |||||
| Property crime | 0.03 | ||||
| (−0.01, 0.08) | |||||
| Violent crime | 0.02 | ||||
| (−0.01, 0.06) | |||||
| Population density | 0.01 | 0.01 | 0.01 | 0.01 | 0.01 |
| (−0.02, 0.04) | (−0.02, 0.04) | (−0.01, 0.04) | (−0.01, 0.04) | (−0.02, 0.04) | |
| Low-poverty (ref = high-poverty) | −0.01 | −0.01 | −0.03 | −0.03 | −0.02 |
| (−0.09, 0.06) | (−0.09, 0.07) | (−0.10, 0.04) | (−0.10, 0.04) | (−0.10, 0.05) | |
| Medium-poverty (ref = high-poverty) | −0.10 * | −0.10 * | −0.11 * | −0.11 * | −0.10 * |
| (−0.16, −0.04) | (−0.16, −0.04) | (−0.17, −0.05) | (−0.17, −0.06) | (−0.16, −0.04) | |
| Connectivity | 0.04 * | 0.04 * | 0.04 * | 0.04 | 0.05 * |
| (0.0004, 0.07) | (0.003, 0.07) | (0.001, 0.07) | (−0.001, 0.07) | (0.01, 0.08) | |
| Vehicle ownership | 0.04 * | 0.04 * | 0.04 * | 0.04 * | 0.04 * |
| (0.01, 0.07) | (0.01, 0.07) | (0.01, 0.07) | (0.01, 0.08) | (0.01, 0.07) | |
| Intercept | 0.17 * | 0.17 * | 0.18 * | 0.18 * | 0.17 * |
| (0.13, 0.21) | (0.13, 0.21) | (0.14, 0.22) | (0.14, 0.22) | (0.13, 0.22) | |
References
- Piercy, K.L.; Troiano, R.P.; Ballard, R.M.; Carlson, S.A.; Fulton, J.E.; Galuska, D.A.; George, S.M.; Olson, R.D. The Physical Activity Guidelines for Americans. JAMA 2018, 320, 2020. [Google Scholar] [CrossRef]
- Data Resource Center for Child and Adolescent Health. 2016 National Survey of Childrens Health Data; The Child & Adolescent Health Measurement Initiative (CAHMI): Baltimore, MD, USA, 2016. [Google Scholar]
- Alexander, L.M.; Inchley, J.; Todd, J.; Currie, D.; Cooper, A.R.; Currie, C. The Broader Impact of Walking to School among Adolescents: Seven Day Accelerometry Based Study. BMJ 2005, 331, 1061–1062. [Google Scholar] [CrossRef] [PubMed] [Green Version]
- Cooper, A.R.; Andersen, L.B.; Wedderkopp, N.; Page, A.S.; Froberg, K. Physical Activity Levels of Children Who Walk, Cycle, or Are Driven to School. Am. J. Prev. Med. 2005, 29, 179–184. [Google Scholar] [CrossRef] [PubMed]
- Rosenberg, D.E.; Sallis, J.F.; Conway, T.L.; Cain, K.L.; McKenzie, T.L. Active Transportation to School over 2 Years in Relation to Weight Status and Physical Activity. Obesity 2006, 14, 1771–1776. [Google Scholar] [CrossRef]
- Southward, E.F.; Page, A.S.; Wheeler, B.W.; Cooper, A.R. Contribution of the School Journey to Daily Physical Activity in Children Aged 11–12 Years. Am. J. Prev. Med. 2012, 43, 201–204. [Google Scholar] [CrossRef] [PubMed]
- McDonald, N.C.; Brown, A.L.; Marchetti, L.M.; Pedroso, M.S. US school travel, 2009: An assessment of trends. Am. J. Prev. Med. 2011, 41, 146–151. [Google Scholar] [CrossRef]
- Kontou, E.; McDonald, N.C.; Brookshire, K.; Pullen-Seufert, N.C.; LaJeunesse, S.U.S. Active School Travel in 2017: Prevalence and Correlates. Prev. Med. Rep. 2020, 17, 101024. [Google Scholar] [CrossRef]
- James, S.; Owen, N. Ecological models of health behavior. In Health Behavior and Health Education: Theory, Research and Practice; Jossey-Bass: San Francisco, CA, USA, 2002; pp. 462–482. [Google Scholar]
- Davison, K.K.; Werder, J.L.; Lawson, C.T. Children’s Active Commuting to School: Current Knowledge and Future Directions. Prev. Chronic. Dis. 2008, 5, 1–11. [Google Scholar]
- Lee, C.; Moudon, A.V. Physical Activity and Environment Research in the Health Field: Implications for Urban and Transportation Planning Practice and Research. J. Plan. Lit. 2004, 19, 147–181. [Google Scholar] [CrossRef]
- Orstad, S.L.; McDonough, M.H.; Stapleton, S.; Altincekic, C.; Troped, P.J. A Systematic Review of Agreement between Perceived and Objective Neighborhood Environment Measures and Associations with Physical Activity Outcomes. Environ. Behav. 2017, 49, 904–932. [Google Scholar] [CrossRef]
- Zougheibe, R.; Xia, J.; Dewan, A.; Gudes, O.; Norman, R. Children’s Outdoor Active Mobility Behaviour and Neighbourhood Safety: A Systematic Review in Measurement Methods and Future Research Directions. Int. J. Health Geogr. 2021, 20, 2. [Google Scholar] [CrossRef]
- Kerr, J.; Rosenberg, D.; Sallis, J.F.; Saelens, B.E.; Frank, L.D.; Conway, T.L. Active Commuting to School: Associations with Environment and Parental Concerns. Med. Sci. Sports Exerc. 2006, 38, 787–793. [Google Scholar] [CrossRef] [PubMed]
- Bosch, L.S.M.M.; Wells, J.C.K.; Lum, S.; Reid, A.M. Associations of the Objective Built Environment along the Route to School with Children’s Modes of Commuting: A Multilevel Modelling Analysis (the SLIC Study). PLoS ONE 2020, 15, e0231478. [Google Scholar] [CrossRef] [PubMed] [Green Version]
- Vonderwalde, M.; Cox, J.; Williams, G.C.; Borghese, M.M.; Janssen, I. Objectively Measured Crime and Active Transportation among 10–13 Year Olds. Prev. Med. Rep. 2019, 13, 48–51. [Google Scholar] [CrossRef] [PubMed]
- Appleyard, B.S.; Ferrell, C.E. The Influence of Crime on Active & Sustainable Travel: New Geo-Statistical Methods and Theories for Understanding Crime and Mode Choice. J. Transp. Health 2017, 6, 516–529. [Google Scholar] [CrossRef]
- Rothman, L.; Macpherson, A.K.; Ross, T.; Buliung, R.N. The Decline in Active School Transportation (AST): A Systematic Review of the Factors Related to AST and Changes in School Transport over Time in North America. Prev. Med. 2018, 111, 314–322. [Google Scholar] [CrossRef]
- Zhu, X.; Lee, C. Walkability and Safety around Elementary Schools. Am. J. Prev. Med. 2008, 34, 282–290. [Google Scholar] [CrossRef]
- U.S. Census Bureau. Quick Facts Austin City, Texas; U.S. Census Bureau: Austin, TX, USA, 2019.
- McDonald, N.C.; Dwelley, A.E.; Combs, T.S.; Evenson, K.R.; Winters, R.H. Reliability and Validity of the Safe Routes to School Parent and Student Surveys. Int. J. Behav. Nutr. Phys. Act. 2011, 8, 56. [Google Scholar] [CrossRef] [PubMed] [Green Version]
- Texas Education Agency. National School Lunch Program Eligiblity Data; Texas Education Agency: Austin, TX, USA, 2019. [Google Scholar]
- Texas Education Agency. Student Enrollment Reports; Texas Education Agency: Austin, TX, USA, 2019. [Google Scholar]
- U.S. Department of Education, National Center for Education Statistics. Concentration of Public School Students Eligible for Free or Reduced-Price Lunch; U.S. Department of Education: Washington, DC, USA, 2020.
- McMillan, T.E. The Relative Influence of Urban Form on a Child’s Travel Mode to School. Transp. Res. Part Policy Pract. 2007, 41, 69–79. [Google Scholar] [CrossRef]
- Transportation Policy. Available online: https://www.austinisd.org/transportation/policy (accessed on 21 June 2021).
- Crime Reports. 2018. Available online: https://data.austintexas.gov/Public-Safety/Crime-Reports-2018/vmn9-3bvu (accessed on 21 June 2021).
- Austin Police Department. Annual Crime and Traffic Report: 2018 Preliminary Report; Austin Police Department: Austin, TX, USA, 2019.
- United States Census Bureau Explore Census Data. 2014–2018 American Community Survey 5-Year Estimates. Table DP05 ACS Demographic and Housing Estimates. Available online: https://data.census.gov/cedsci/table?d=ACS%205-Year%20Estimates%20Data%20Profiles&table=DP05&tid=ACSDP5Y2018.DP05&g=0400000US22 (accessed on 26 June 2021).
- Wong, B.Y.-M.; Faulkner, G.; Buliung, R. GIS Measured Environmental Correlates of Active School Transport: A Systematic Review of 14 Studies. Int. J. Behav. Nutr. Phys. Act. 2011, 8, 39. [Google Scholar] [CrossRef] [Green Version]
- Mcdonald, N. Active Transportation to School Trends among U.S. Schoolchildren, 1969–2001. Am. J. Prev. Med. 2007, 32, 509–516. [Google Scholar] [CrossRef]
- Pont, K.; Ziviani, J.; Wadley, D.; Bennett, S.; Abbott, R. Environmental Correlates of Children’s Active Transportation: A Systematic Literature Review. Health Place 2009, 15, 849–862. [Google Scholar] [CrossRef] [PubMed]
- Siegel, A. Multiple Regression. In Practical Business Statistics; Academic Press: Cambridge, MA, USA, 2016. [Google Scholar]
- Su, J.G.; Jerrett, M.; McConnell, R.; Berhane, K.; Dunton, G.; Shankardass, K.; Reynolds, K.; Chang, R.; Wolch, J. Factors Influencing Whether Children Walk to School. Health Place 2013, 22, 153–161. [Google Scholar] [CrossRef] [Green Version]
- Molina-García, J.; Queralt, A. Neighborhood Built Environment and Socioeconomic Status in Relation to Active Commuting to School in Children. J. Phys. Act. Health 2017, 14, 761–765. [Google Scholar] [CrossRef]
- Brownson, R.C.; Baker, E.A.; Housemann, R.A.; Brennan, L.K.; Bacak, S.J. Environmental and Policy Determinants of Physical Activity in the United States. Am. J. Public Health 2001, 91, 1995–2003. [Google Scholar] [CrossRef]
- McDonald, N.C. Critical Factors for Active Transportation to School Among Low-Income and Minority Students. Am. J. Prev. Med. 2008, 34, 341–344. [Google Scholar] [CrossRef]
- Mazza, J.J.; Reynolds, W.M. Exposure to Violence in Young Inner-City Adolescents: Relationships with Suicidal Ideation, Depression, and PTSD Symptomatology. J. Abnorm. Child Psychol. 1999, 27, 203–213. [Google Scholar] [CrossRef] [PubMed]
- Liberman, M.; Zimmerman, S. Taking Back the Streets and Sidewalks; Safer Routes to School National Partnership: Oakland, CA, USA, 2015.
- Myers, S. Why Are Crimes Underreported? What Is the Crime Rate? Does It Really Matter? Univ. Tex. Press 1980, 61, 23–42. [Google Scholar]

| Low-Poverty (n = 14) | Medium-Poverty (n = 22) | High-Poverty (n = 27) | Total (n = 63) | |
|---|---|---|---|---|
| School Characteristics | ||||
| Race/Ethnicity (%, Median (IQR)) | ||||
| White | 93 (22.1) | 12.2 (25.6) | 3.5 (3) | 9.6 (46.9) |
| Black | 1.2 (1.1) | 3.5 (2.6) | 2.8 (1.0) | 2.8 (1.4) |
| Hispanic/Latino | 5.2 (21.6) | 69.1 (26.0) | 93.4 (4.2) | 84.3 (55.4) |
| Trips to/from school by active travel modes (%, Median (IQR)) | 16.0 (8.6) | 6.1 (9.5) | 14.7 (14.3) | 12.21 (14.6) |
| Neighborhood Characteristics | ||||
| Total Crime (Median (IQR)) | 434 (834.2) | 1375 (1468) | 2325 (1452.5) | 1564 (1872.5) |
| Minor Crime (Median (IQR)) | 191 (471.3) | 920.5 (824.7) | 1662 (996) | 1016 (1361) |
| Major Crime (Median (IQR)) | 197.5 (346.2) | 464 (513.8) | 737 (591.5) | 522 (704) |
| Property Crime (Median (IQR)) | 177.5 (349.8) | 429.5 (433) | 612 (539.5) | 426 (602.5) |
| Violent Crime (Median (IQR)) | 7.5 (14.8) | 32 (45) | 77 (92.5) | 40 (66.5) |
| Population Density (Median (IQR)) | 2241.3 (2808.5) | 2281.1 (1667.0) | 2203.8 (742.6) | 2227.1 (1230.5) |
| Household Income ($, Median (IQR)) | 121,036.4 (169,044.5) | 77,780.87 (124,473.1) | 52,108.8 (11,452.1) | 64,720.8 (25,027.6) |
| Vehicle Ownership (%, Median (IQR)) | 98.1 (4.3) | 95.5 (5.1) | 91.8 (4.0) | 94.1 (6.4) |
| Connectivity (n, Mean (SD)) | 248 (126.6) | 270.2 (131.5) | 258 (75.2) | 260 (108) |
| Dependent Variable: | |||||
|---|---|---|---|---|---|
| Total Crime | Minor Crime | Major Crime | Property Crime | Violent Crime | |
| Low-poverty (ref = high-poverty) | 0.24 * | 0.20 * | 0.32 * | 0.36 * | 0.10 * |
| (0.21, 0.27) | (0.18, 0.23) | (0.29, 0.37) | (0.32, 0.41) | (0.09, 0.12) | |
| Medium-poverty (ref = high-poverty) | 0.68 * | 0.62 * | 0.80 * | 0.86 * | 0.49 * |
| (0.60, 0.76) | (0.55, 0.70) | (0.71, 0.91) | (0.76, 0.98) | (0.42, 0.57) | |
| Population density | 0.52 * | 0.53 * | 0.49* | 0.48 * | 0.51 * |
| (0.49, 0.54) | (0.51, 0.56) | (0.46, 0.51) | (0.46, 0.98) | (0.48, 0.55) | |
| Intercept | 7.54 * | 7.19 * | 6.33 * | 6.14 * | 4.33 * |
| (7.46, 7.62) | (7.11, 7.27) | (6.24, 6.41) | (6.05, 6.23) | (4.23, 4.43) | |
Publisher’s Note: MDPI stays neutral with regard to jurisdictional claims in published maps and institutional affiliations. |
© 2021 by the authors. Licensee MDPI, Basel, Switzerland. This article is an open access article distributed under the terms and conditions of the Creative Commons Attribution (CC BY) license (https://creativecommons.org/licenses/by/4.0/).
Share and Cite
Burford, K.; Ganzar, L.A.; Lanza, K.; Kohl, H.W., III; Hoelscher, D.M. School-Level Economic Disparities in Police-Reported Crimes and Active Commuting to School. Int. J. Environ. Res. Public Health 2021, 18, 10885. https://doi.org/10.3390/ijerph182010885
Burford K, Ganzar LA, Lanza K, Kohl HW III, Hoelscher DM. School-Level Economic Disparities in Police-Reported Crimes and Active Commuting to School. International Journal of Environmental Research and Public Health. 2021; 18(20):10885. https://doi.org/10.3390/ijerph182010885
Chicago/Turabian StyleBurford, Katie, Leigh Ann Ganzar, Kevin Lanza, Harold W. Kohl, III, and Deanna M. Hoelscher. 2021. "School-Level Economic Disparities in Police-Reported Crimes and Active Commuting to School" International Journal of Environmental Research and Public Health 18, no. 20: 10885. https://doi.org/10.3390/ijerph182010885
APA StyleBurford, K., Ganzar, L. A., Lanza, K., Kohl, H. W., III, & Hoelscher, D. M. (2021). School-Level Economic Disparities in Police-Reported Crimes and Active Commuting to School. International Journal of Environmental Research and Public Health, 18(20), 10885. https://doi.org/10.3390/ijerph182010885