Article

Marine Debris in the Beilun Estuary Mangrove Forest: Monitoring, Assessment and Implications

1
South China Sea Environment Monitoring Center, State Oceanic Administration (SOA), Guangzhou 510300, China
2
South China Sea Testing and Appraisal Center, State Oceanic Administration (SOA), Guangzhou 510300, China
3
Nansha Islands Coral Reef Ecosystem National Observation and Research Station, Guangzhou 510300, China
4
Key Laboratory of Marine Environmental Survey Technology and Application, Ministry of Natural Resources (MNR), Guangzhou 510300, China
5
Guangzhou Institute of Energy Conversion, Chinese Academy of Sciences, Guangzhou 510640, China
*
Authors to whom correspondence should be addressed.
These authors contributed equally.
Int. J. Environ. Res. Public Health 2021, 18(20), 10826; https://doi.org/10.3390/ijerph182010826
Submission received: 22 August 2021 / Revised: 9 October 2021 / Accepted: 11 October 2021 / Published: 15 October 2021
(This article belongs to the Section Environmental Science and Engineering)

Abstract

:
A modified approach for marine debris investigation in mangrove forests is developed, including some practical programs, viz., sampling location, time, area, materials, size and sources data processing. The marine debris method was practiced in the Beilun Estuary mangrove forest region in Fangchenggang in 2019, viz., the debris items were classified, counted, weighed and recorded, and the marine debris pollution was assessed to understand the impact of human activities. The results show that the mass density is 21.123 (2.355~51.760) g/m2, and more than 90% came from the land-based and human activities. More than 60% of the total debris weights are plastics, followed by fabrics (17.91%) and Styrofoam (10.07%); the big-size and oversize debris account for 76.41% and 13.33%, respectively. The quantity density is 0.163 (0.013~0.420) item/m2, and ~95% came from land-based human activities. More than 75% of the total debris items were plastics, followed by Styrofoam (14.36%), fabrics (4.10%) and glass (3.59%); the big-size, medium-size and oversize debris are 76.41%, 13.33% and 10.26%, respectively. The results suggest that mangrove forests are barriers for the medium-/big-size marine debris, acting as traps for marine debris. Our study provides recommendations and practical guidance for establishing programs to monitor and assess the distribution and abundance of marine debris. The results show that mangrove areas in the Beilun Estuary are filled with some plastic debris (plastics plus Styrofoam) and that the density and type at Zhushan and Rongshutou near the China-Vietnam border are more than those at Shijiao and Jiaodong. The results of this study are also expected to not only provide baseline data for the future assessment of Beilun Estuary mangroves but also to help China and Vietnam strengthen marine land-based pollution control and promote coastal wetland and mangrove conservation, marine species conservation and sustainable use.

1. Introduction

A mangrove is one of the distinctive woody plants in the coastal wetland ecosystem with both terrestrial and marine properties, which can provide a variety of important goods and services to humanity [1,2,3,4,5,6], e.g., absorbing the waves/tides, protecting the shore, maintaining the biodiversity, accelerating the water purification and pollutants degradation, reducing the eutrophication and red tide, developing ecological tourism and popular science education. Mangroves are highly susceptible to marine debris (litter) exposure due to their coastal habitats [7]. Marine debris (litter) was defined by UNEP in 1995 as: ‘any persistent, manufactured or processed solid material discarded, disposed of or abandoned in the marine and coastal environment’ [8]. Marine debris (including plastics) is introduced into the marine environment by its improper disposal, accidental loss and natural disasters. Martin et al. (2019) [9] demonstrated that mangrove forests act as sinks for anthropogenic debris before they are dispersed into the marine environment. In the last few decades, marine debris has been recognized as an indicator of pollution forms, causing risks to marine organisms [8,10]. Marine debris pollution has been a focal point of public concern and a visible expression of the human impact on the marine environment [11,12]. Similarly, the mangrove ecosystem is threatened by marine debris pollution at present, including visual pollution and toxic substances (heavy metals, organic pollutants, pathogenic organisms, etc.) carried by the debris itself as well as via ingestion by marine organisms. It is urgent to monitor marine debris and to assess the debris coverage and their impact on mangroves.
For the marine debris survey, some methods have been successfully established for marine debris monitoring and assessment in the marine environment (surface seawater, seabed and beaches) [8,13,14,15,16,17]. The approaches/methods comprise the visual method, net method (trawl) and diving method [12,15]. Moreover, some innovative approaches here include satellite remote sensing [18,19,20], the aerial photography method [20,21,22] using coupled balloon-assisted photos with in situ mass measurements [23], ortho-photograph from planes [19] and several initiatives using drones [24]. These innovative approaches are particularly useful for detecting larger litter items in dense vegetation (e.g., reed beds), for non- destructive observations in sensitive habitats (e.g., salt marshes) and for remote or inaccessible coastlines [8]. Ongoing monitoring activities can be used to assess the effectiveness of the management strategies and provide insight when strategies need to be modified for changing conditions. There was a lack of harmonization of the sampling methods and attention to natural environmental variability, so this made the collation and comparison of the data problematic [8,13]. The implementation of effective control measures is currently hampered by a lack of the consistent monitoring and identification of the sources of the debris [12].
No appropriate and special approach is used for monitoring and assessing marine debris in mangrove forests. Mangroves are usually located in the wetland and marsh areas of estuaries and are subjected to tidal influences, so the debris investigation in mangrove forests (especially in different inter-tidal zones) is much more difficult than in seawater, seabed and beaches. The satellite and photography methods are not applicable because of the canopy of the mangrove branches, so the visual and weight methods are still simple and practical. Although the marine debris survey in mangrove forests is similar to those in sea water, beach and seabed [8,12,13,14,15], there are some differences. Up to now, there are a few studies on the marine debris monitoring and assessment in mangroves [9,25], but there is no appropriate and special method. The marine debris pollution (including plastics and microplastics) in mangrove forest regions is actually affected by both natural factors (i.e., hydrodynamics, mangrove height and density, etc.) and human activities (mariculture, tourism and coastal dumping) [26,27,28,29]. Thus, it is essential to develop an appropriate method of marine debris monitoring in mangroves to provide effective recommendations and practical guidance, and to conduct surveys to assess the impact of human activities on coastal zones.
The Beilun Estuary mangrove forest reserve region is located at the southern offshore areas of Gangkou District and the city of Dongxing of the city of Fangchenggang, China, bordered by the Beibu Gulf in the southeast and Vietnam in the southwest, and spanning Pearl Bay, Jiangping Estuary, and Beilun Estuary, with a coastline of 105 km and a tidal flat area of 53 km2 [29,30,31,32,33]. Here, we provide a modified approach for marine debris investigation in mangrove forests, including some practical programs, viz., sampling location, time, area, materials, size and sources data processing. The marine debris method was applied and practiced in the Beilun Estuary mangrove forest region in 2019, viz., the debris items were classified, counted, weighted, recorded and assessed for the distribution and abundance of the marine debris pollution. It is hoped that our study is useful for providing recommendations and practical guidance for monitoring and assessing marine debris in mangrove forests, and for understanding the basic information of the mangrove ecological threat factors and to assess the influence of human activities. This study is also expected to not only provide baseline data for the future assessment of the marine debris pollution in Beilun Estuary mangroves but also help China and Vietnam strengthen marine land-based pollution control and promote coastal wetland and mangrove conservation, marine species conservation and sustainable use.

2. Methodology

2.1. Method Establishment

One approach to make best use of limited resources is to take advantage of other studies and programs where litter monitoring can be integrated [8]. By referring to the current methods or guidelines for marine debris (in sea water, seabed and beach) monitoring and assessment [8,13,14,15], a special approach for marine debris in mangrove forests is developed using the visual and weight methods. For a specific procedure, some practical programs are established in brief. Firstly, sampling location (transect and station) and time are drawn up according to the survey purpose. Secondly, sampling area should be determined according to the actual surrounding conditions (debris density, mangrove density, sludge hazard degree, tidal time, etc.). Thirdly, the debris items are in situ collected and categorized by material types. Some information of each debris item, such as weight, sizes and sources, should be recorded. It is necessary to take photos or video on site and record the other information. Finally, all debris should be collected and removed as far as possible in order to protect the mangrove living environment. More details of marine debris investigation are as follows:
(1)
Sampling location, time and area
Sampling location (transect and station) and time setting can refer to the general specifications or guidelines of mangrove survey or marine inter-tidal zone. Moreover, sampling location and time setting must consider the surrounding environment conditions and the flood and ebb tides. Sampling should not always take place at a constant location/transect. Each transect includes three stations, viz., the high-tide station, the medium-tide station and the low-tide station. Random sampling location can also be used. Sampling time must comply with the safety regulations and the tide time because of the complex environment (mud everywhere, twining branches). If the tide rises fast, sampling time duration must be controlled to ensure the personnel security before the rising tide. Additionally, personal protection (to prevent mosquitoes and snake bites) must be prepared; monitoring work must stop when it rains and lightning strikes.
The selection of sampling area (m2) in each station generally follows the following principles: the larger sampling area is, the more representative and reliable the results are. Moreover, the densities of the debris and mangrove must be considered, as well as the surrounding environment conditions and duration between the flood and ebb tides. Debris coverage was estimated in 10 m × 10 m block, which is divided into 1 m2 quadrats, and 20 quadrats from the 100 m2 block were sampled in each site [34]. For ease of operation, if a comprehensive mangrove ecological investigation is carried out, the location, time and area are same as or close to those of debris in the mangrove forests. Here, the area in each station is often 100 m2. If the density is too small, the area can be appropriately increased. If the density is very high or the environment is unfavorable for the investigation, the area can be reduced but should not be less than 5 m × 5 m.
(2)
Materials, size and sources
Table 1 provides marine debris classification based on the size, materials and sources. Here, one difference from other methods is that the disposable paper cups (beverage cartons) coated with single-sided PE plastic film or double-sided PE plastic film are regarded as plastic debris because the remaining plastic film after paper fiber being damaged easily will disperse lots of serious secondary microplastics into the environment. Papers refer to paper products without plastic coating that are big, degradable and endanger the organisms in the mangrove forests. So, the papers that are very easy to degrade in the slush are not considered. Moreover, wood products refer to mainly those old furniture and ships that are large, hinder the landscape and may endanger the mangrove forest growth. Here, the wood sticks and furniture fragments that are small and do not endanger the mangrove growth are not considered.
The details of the materials/compositions (e.g., plastic, glass, metal, etc.), the overall form/shape (e.g., bottle, film, rope, net, bag, etc.) and the size should be recorded as possible during the investigation. These details are very useful because the properties of the debris can affect the behavior of the debris in the environment, including the further degradation, transport and the extent and nature of any impacts. Moreover, they can be very useful, especially for providing information about the relative importance and potential sources or other specific policy concern, including the effectiveness of targeted reduction measures [8,35]. Usually, macro-litter items will offer more clues as to their origins since they can be more easily associated with their original use [8]. The ocean-borne waste disposed at sea and terrestrial waste originating from coastal users and urban centers are two main sources [36,37,38,39,40].
(3)
The density estimation and assessment
The density is calculated for the number (items) or mass (weights, g) of debris in each category per the area (A) as:
D = N umber   ( items )   or   Mass   ( g ) A rea
where D is the quantity density in items per 1.0 square meters (items/m2) or mass density in terms of grams per 1.0 square meters (g/m2), respectively. Additionally, for the entire mangrove region, the total quantity (items) and mass (kg) in each type of debris, e.g., plastics, are estimated based on the total area of mangrove region.
Our approach is suitable for all visual debris items encountered in mangrove ecosystem, deposited on the seabed and/or associated with encrusted/entangled on the branches/roots. This approach can also provide effective assurance for harmonization of sampling/monitoring methods, identification of sources, attention to natural environmental variability, collation and comparison of data. It can not only be used alone for the special marine debris survey but also be used in conjunction with the comprehensive mangrove ecosystem investigation. However, there are still some disadvantages, e.g., large personnel workload and high manpower consumption (compared with remote sensing method).

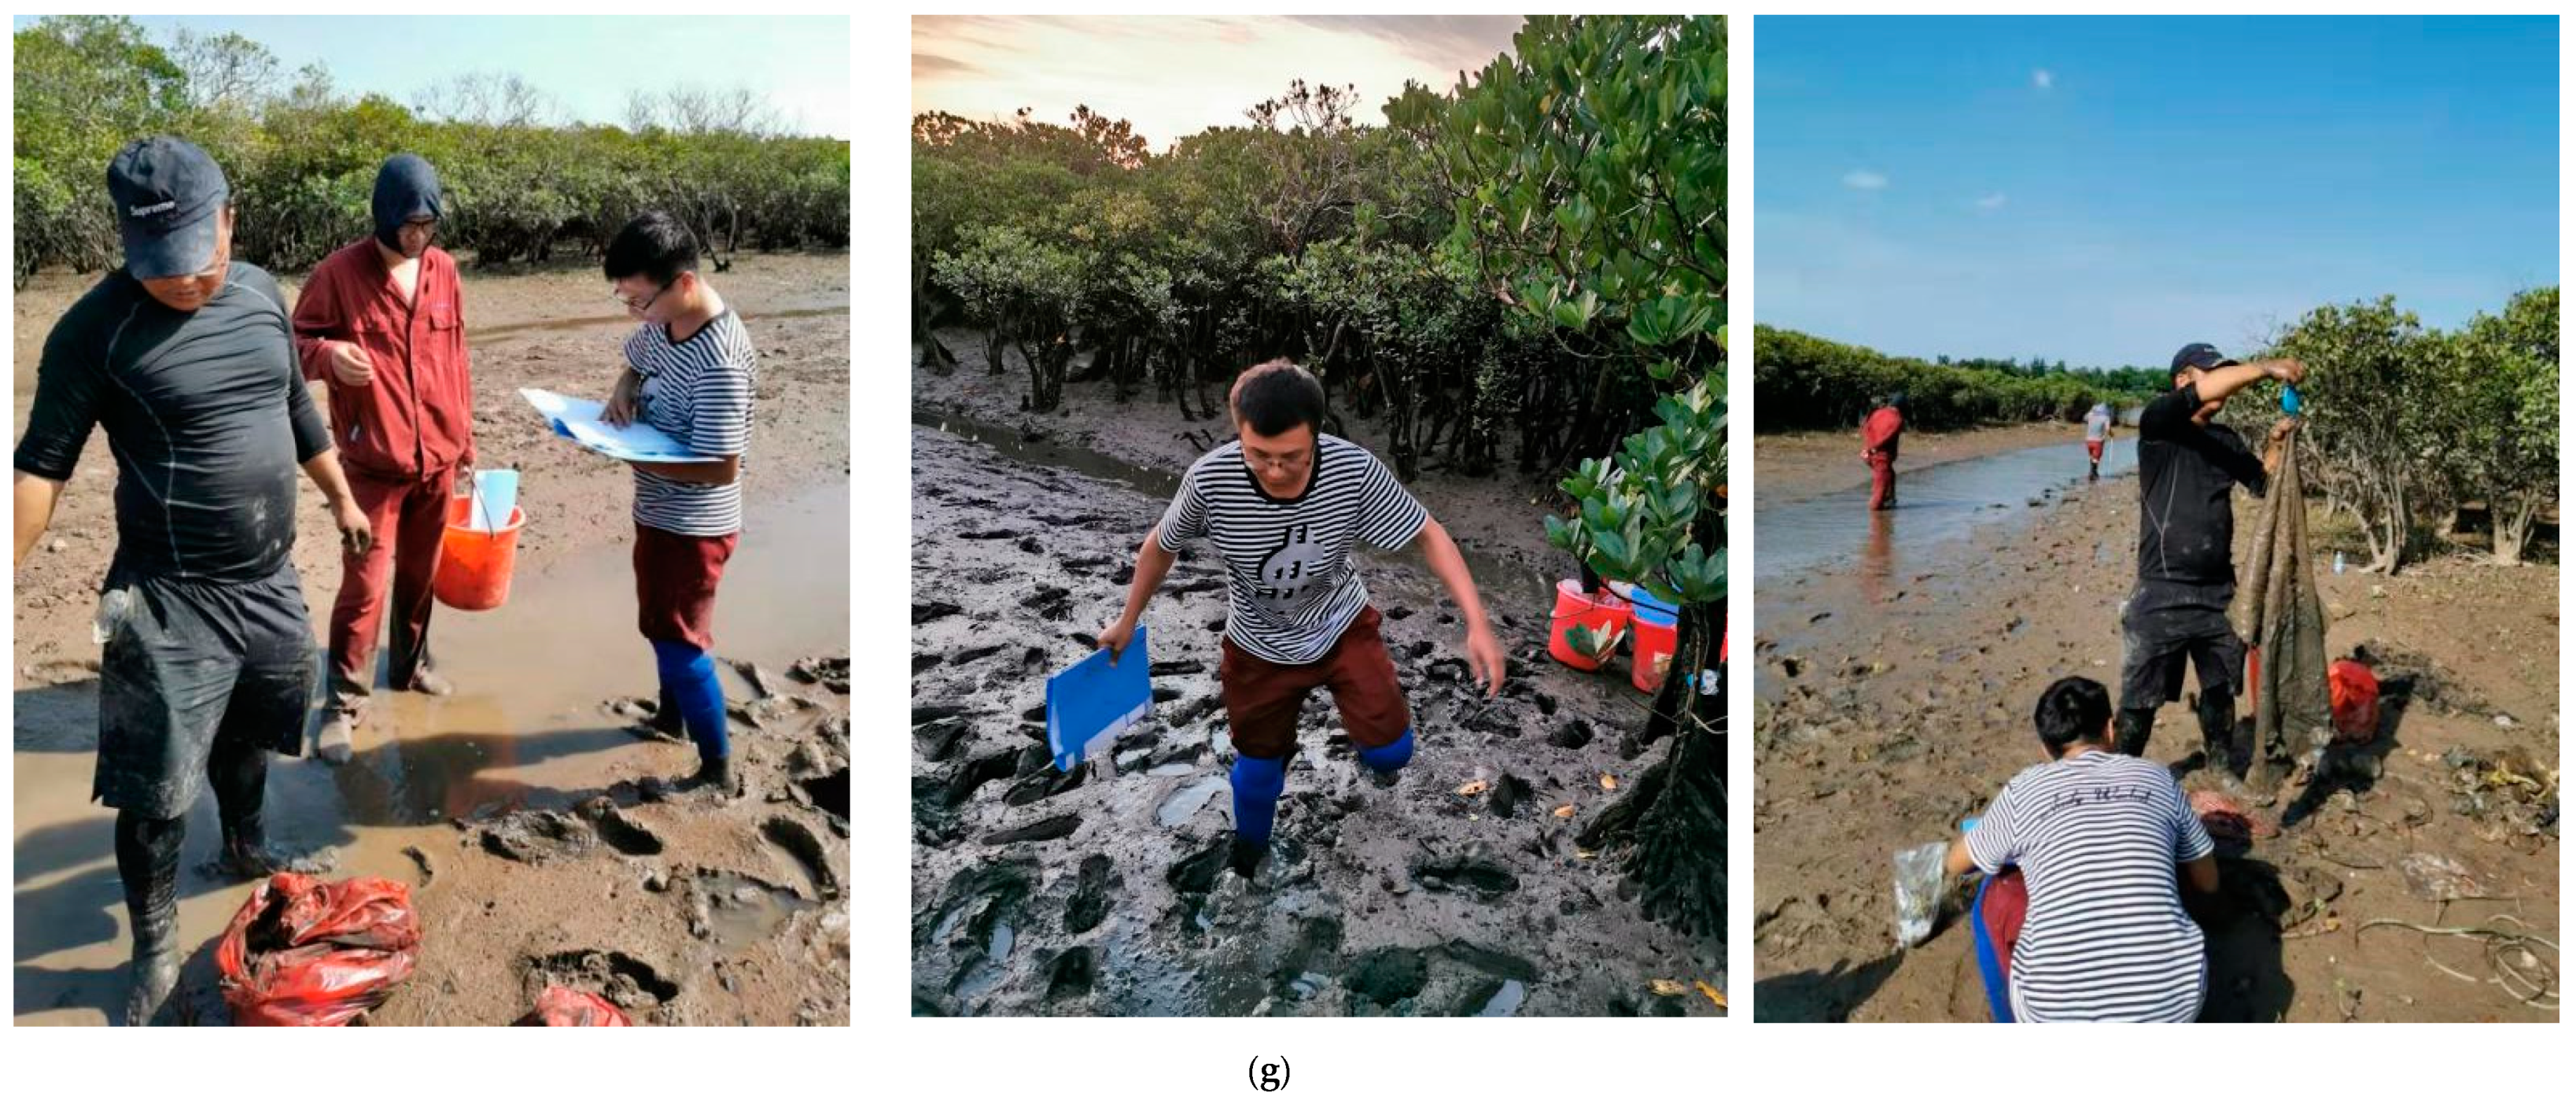
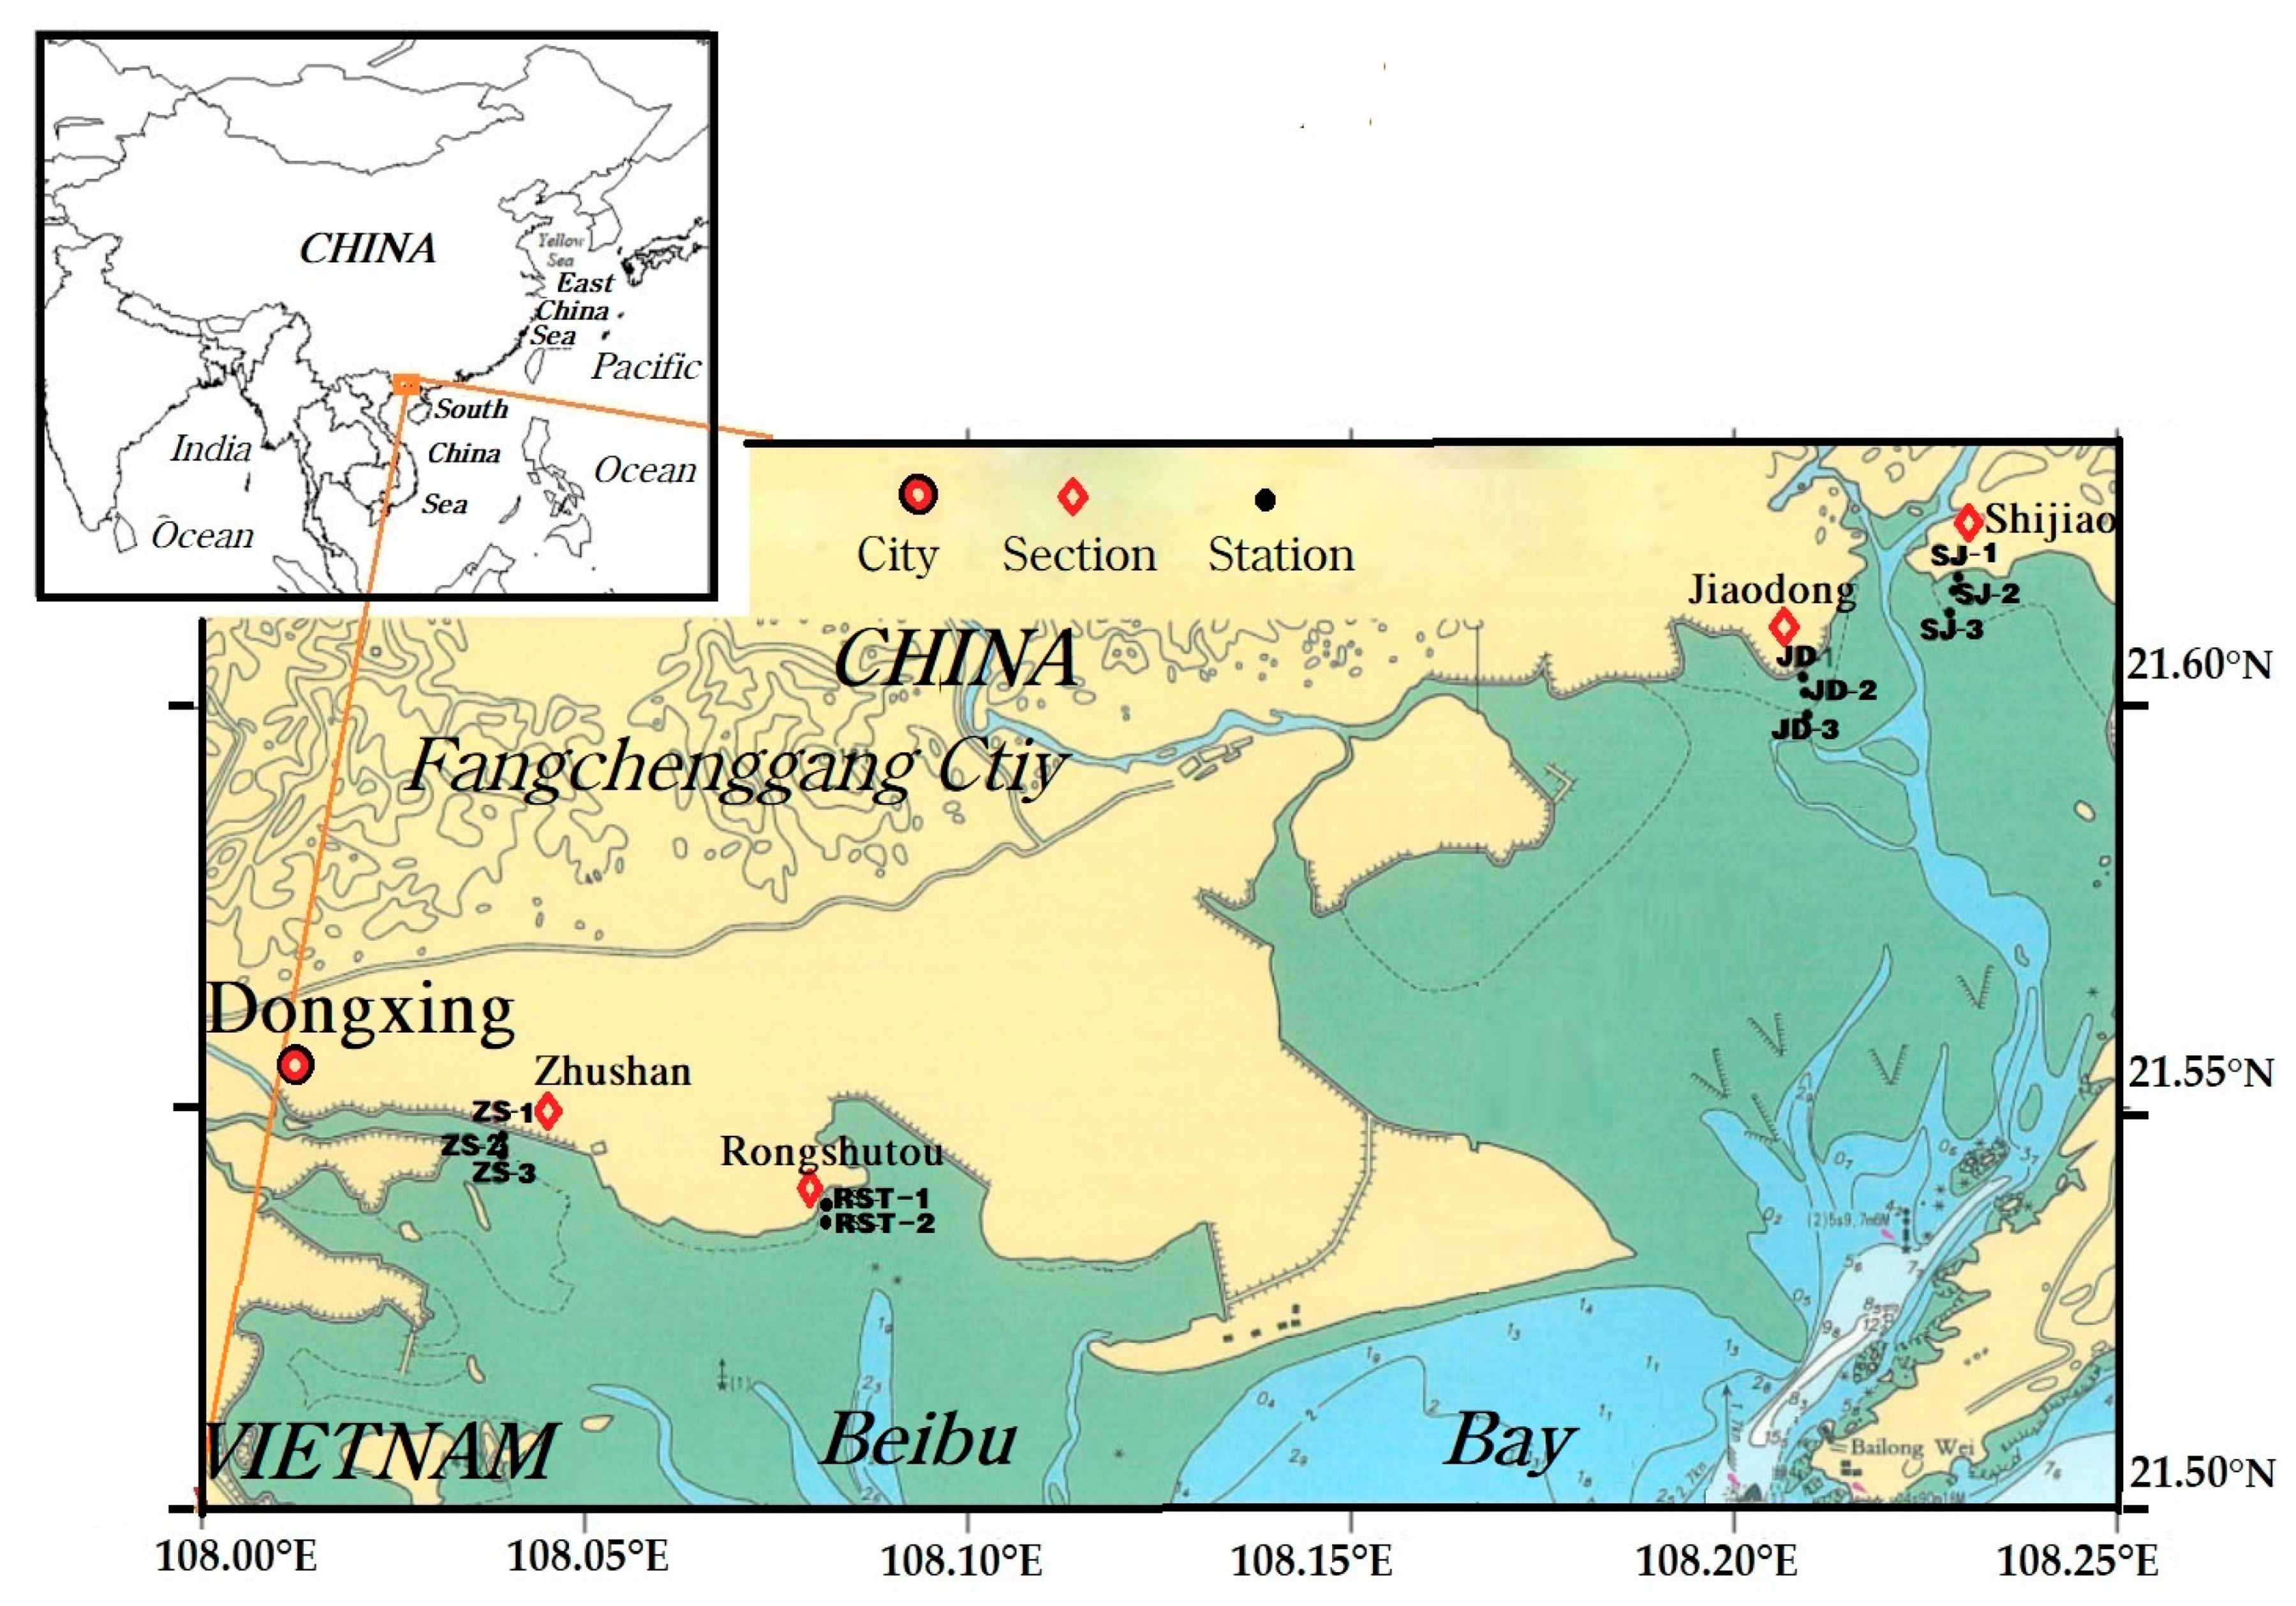
2.2. Application and Practice in Beilun Estuary Mangrove Region

In Fangchenggang, Guangxi Zhuang Autonomous Region, there are 580-km coastline and ~7500-hectares coastal wetland, including 3300 hectares of mangrove reserve: Beilun Estuary national mangrove forest reserve region [30,31]. As one of the largest mangrove forests in the world, Beilun Estuary mangrove forest has ~1300 hectares, referred to as green lungs by the Fangchenggang citizens. However, with the aggravation of human disturbance in the coastal zone and global climate change, the green lungs face both natural and anthropogenic threats [41], viz., introduction of pollutants (e.g., oils, metals and sewage) [42,43,44], over-fishing and harvesting, habitat loss and fragmentation (reclamation, urban infrastructure and construction) [41,45], invasion of alien species [31,33,46], pests and diseases [41], microplastic pollution [29,47,48] and man-made debris.
Marine debris in four transects of mangrove forest (Shijiao, Jiaodong, Zhushan and Rongshutou) was investigated in September 2019 (Figure 1). Only the high tide and low tide stations were investigated in Rongshutou because of its short transect. Three stations (the high-tide, the medium-tide and the low-tide stations) were investigated in Shijiao, Jiaodong and Zhushan transects (Table 2). Figure 2 provides some photos in mangrove forest.

3. Results and Discussion

Table 3, Figure 3 and Figure 4 provide the mass and quantity densities and percentages of the debris in the Shijiao, Jiaodong, Zhushan and Rongshutou transects, respectively. The debris in the Shijiao transect consisted of plastics, Styrofoam and glasses. Only two types (both plastics and Styrofoam) were found in the Jiaodong transect. In the Zhushan transect, four types of debris were found, viz., plastics, Styrofoam, fabrics and glasses, and one electronic debris (a mobile phone) was also found. In the Rongshutou transect, six types of debris (including plastics, Styrofoam, fabrics, glasses, metals and rubbers) were found. In the Beilun Estuary mangrove forest region, the mass densities of the debris ranged from 2.355 to 51.760 g/m2, with the mean value of 21.123 g/m2. The quantity densities of the debris ranged from 0.013 to 0.420 item/m2, with the mean value of 0.163 item/m2, which was relatively lower than that in the estuary of Mandonga and Lahundap [25].
Table 4 provides the source of the marine debris in the Beilun Estuary mangrove forest region. For the marine debris, the mass percentage of 9.19% and the quantity percentage of 5.64% came from marine activities, viz., navigation/fishing activity. In the land-based debris, the mass percentage of 0.12% and the quantity percentage of 1.54% came from the medical or sanitary activity. More than 90% (both mass and quantity percentages) came from the coastal/recreational activity. More than 50% of the land-based debris were plastics, followed by Styrofoam (more than 10%).

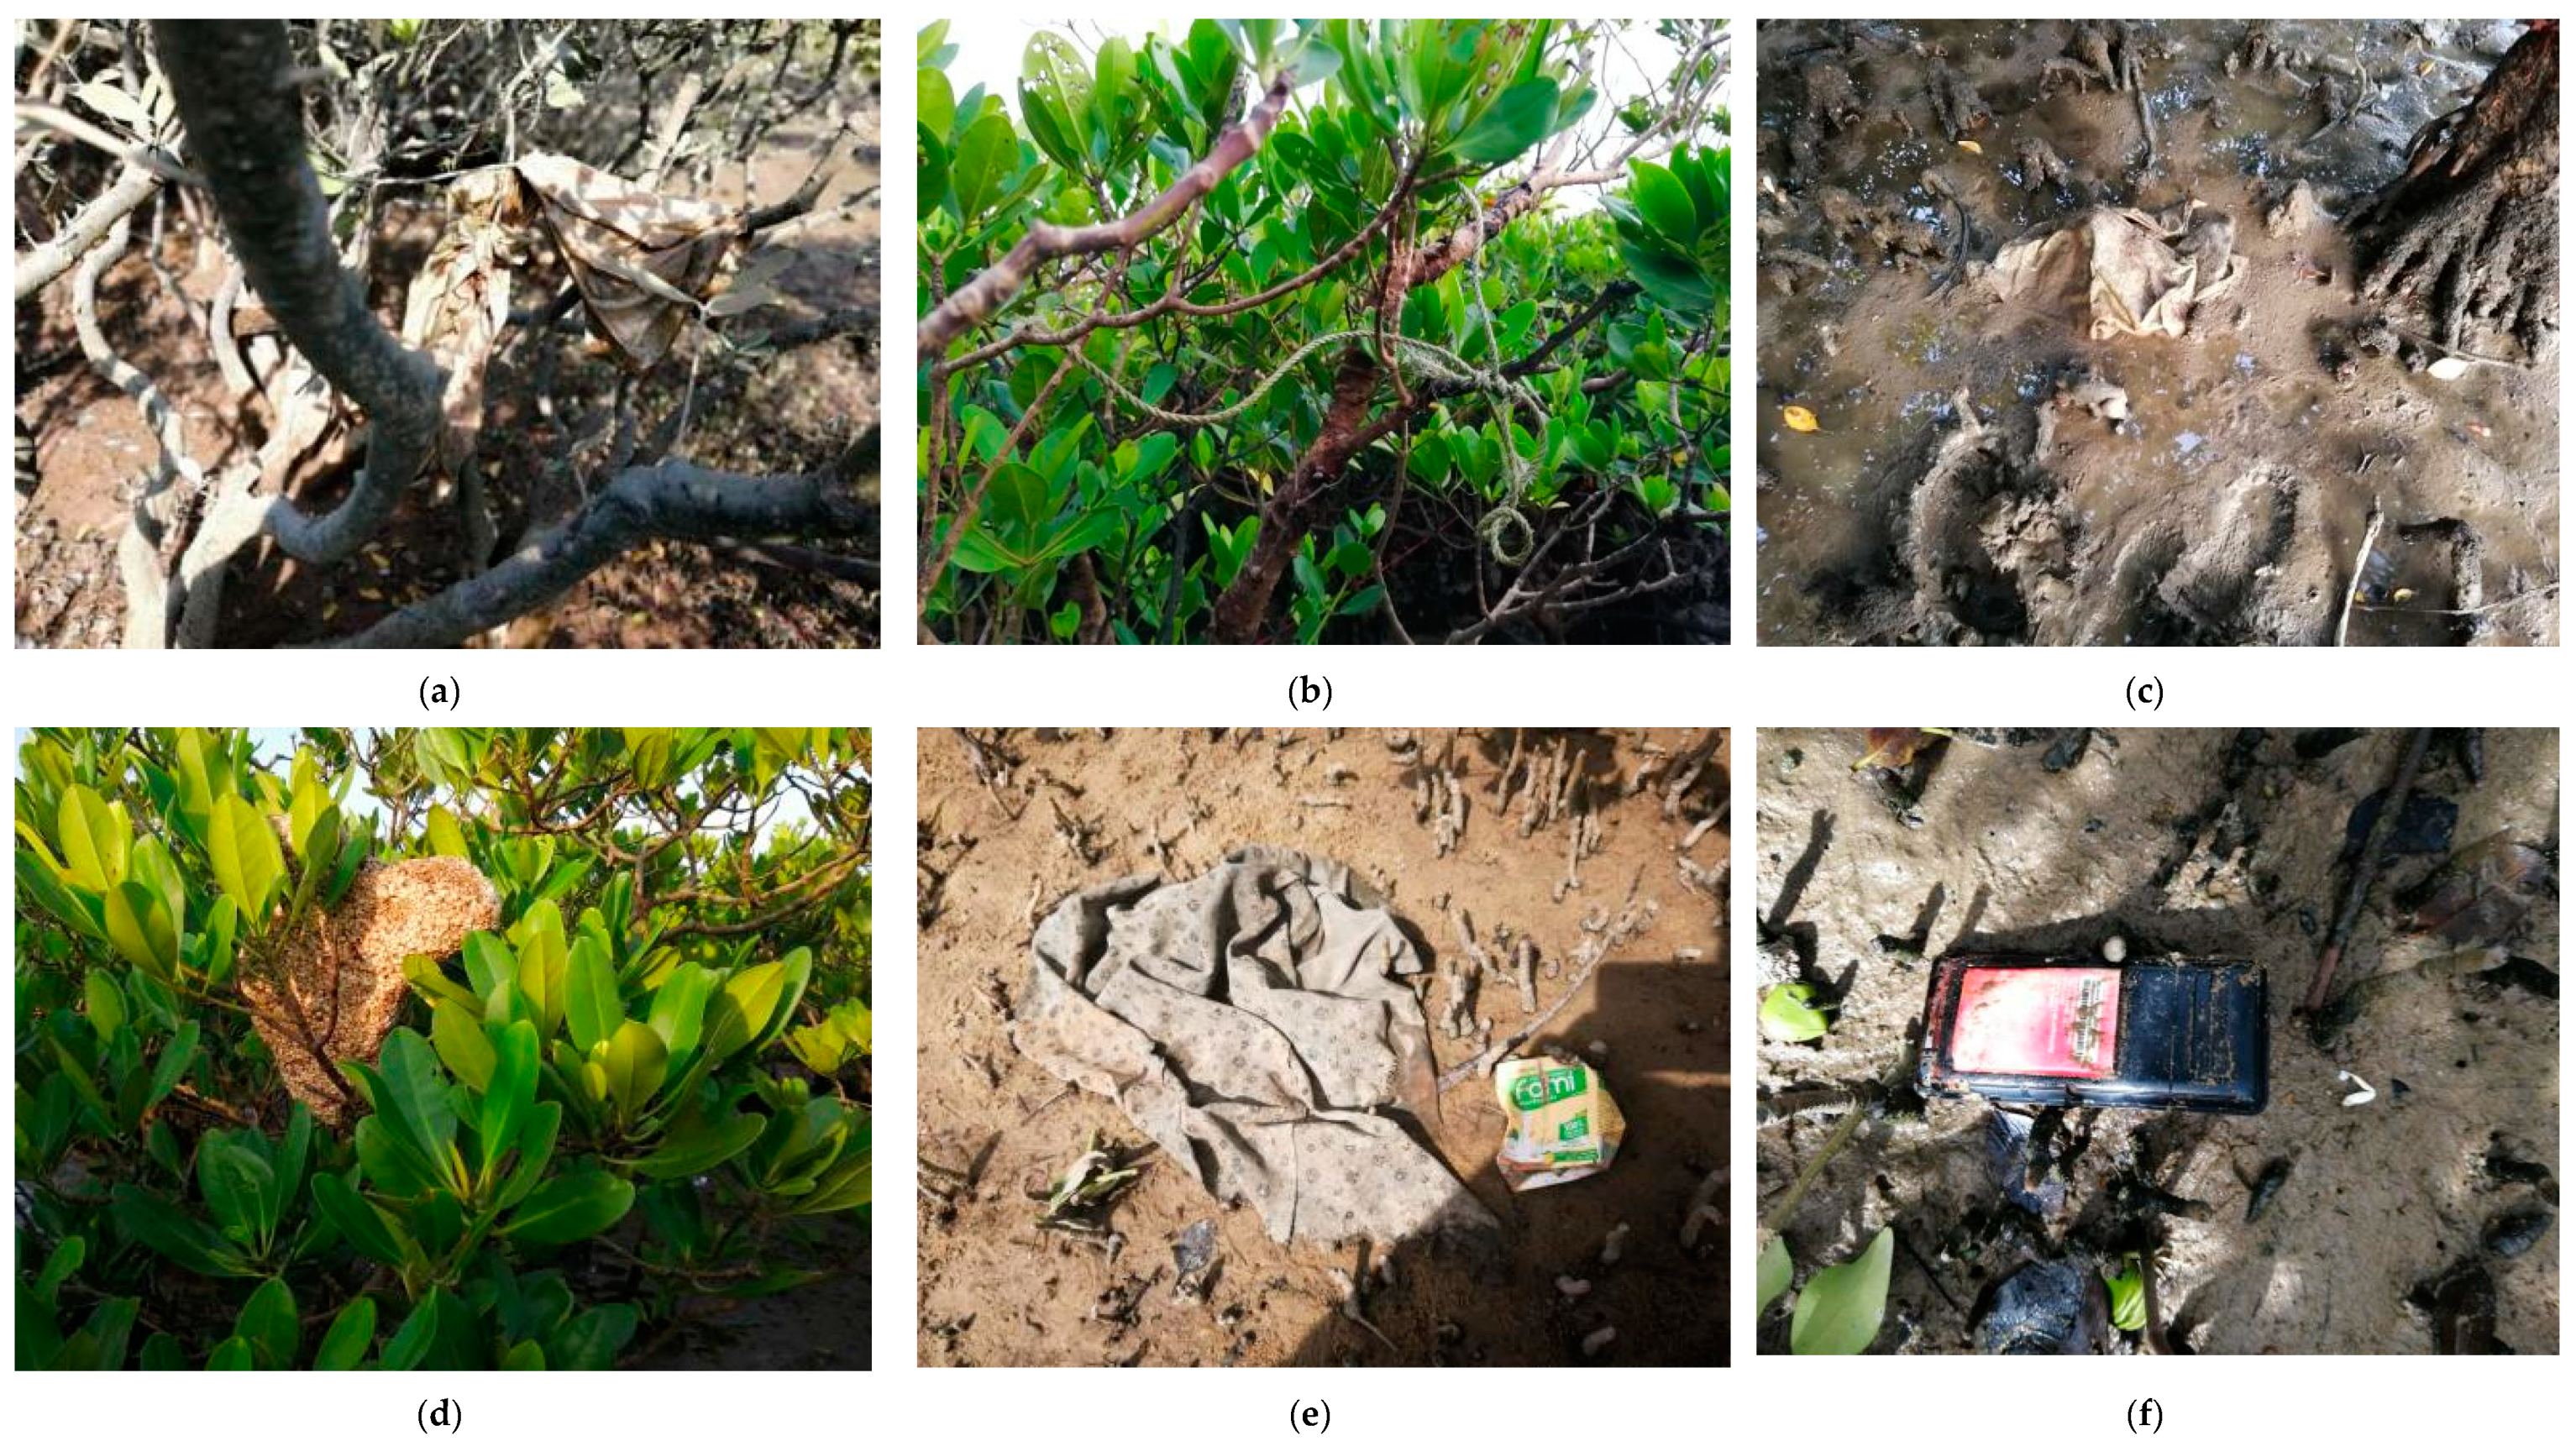
3.1. Space Distribution of Marine Debris

The mass density of the debris in Zhushan is the highest (51.760 g/m2), followed by in Rongshutou (29.200 g/m2), Shijiao (10.617 g/m2) and Jiaodong (2.355 g/m2). The mass density in Zhushan is ~25 times as high as that in Jiaodong. The quantity density of the debris in Zhushan is the highest (0.420 item/m2), followed by in Rongshutou (0.197 item/m2), Shijiao (0.024 item/m2) and Jiaodong (0.013 item/m2), with a difference of about 50 times between the maximum and minimum values. In four transects, the order of the debris mass/quantity densities is as follows: Zhushan > Rongshutou > Shijiao > Jiaodong. The types of debris in the Rongshutou and Zhushan transects are more than those in the Shijiao and Jiaodong transects. Some used clothes were also found in both Rongshutou and Zhushan. Therefore, a great deal of marine debris comes from human activities.
The two sections of Rongshutou and Zhushan are very close to China’s Dongxing and Vietnam’s Mangjie urban areas. They have a large population and have especially developed tourism. Due to poor management or other reasons, a large amount of garbage enters the mangrove forest along the Beilun River. At the Zhushan and Rongshutou transects near the China-Vietnam border, the mass and quantity densities and types of debris were much more than those at other transects. It shows the importance of two countries jointly controlling the garbage discharge and reducing the marine debris pollution. The marine debris management and control should be the responsibility of both China and Vietnam. In Figure 2, the debris in situ collected indicated manufacturers’ marks and addresses on labels from either China or Vietnam. The labels indicate the place of manufacture but not necessarily where an item entered an environmental compartment. For example, litter from ships may originate far from where it is discarded and be transported before reaching the sampling location (UNEP, 2016) [35]. The labels are enough to prove that marine debris management is actually an international problem.
In order to protect the mangrove forests and reduce the debris, more efforts had been made in Fangchenggang, China. The production, sale and use of ultra-thin bags (<0.025 mm) was banned in China on 1 June 2008. The Household Garbage Classification Plan has been implemented since 2017 [49]. Moreover, China implemented a new policy banning the importation of most plastic waste in 2018 [50]. Meanwhile, a specific plan of household garbage classification work has been formulated and implemented in the city of Fangchenggang [51]. In another recent document [52], the ban of the production and sale of ultra-thin plastic bags and agricultural films (<0.01 mm) will remain strictly enforced; at the same time, our government will ban the importation of plastic waste, as well as the production and sale of single-use foam plastic tableware and plastic swabs by the end of 2020; for daily chemicals containing plastic microbeads, production will be banned this year, while sales must stop by 2022. Although some policies and measures have been formulated, this is still not enough. Both China and Vietnam need to make greater efforts to strengthen waste management and reduce waste emissions.

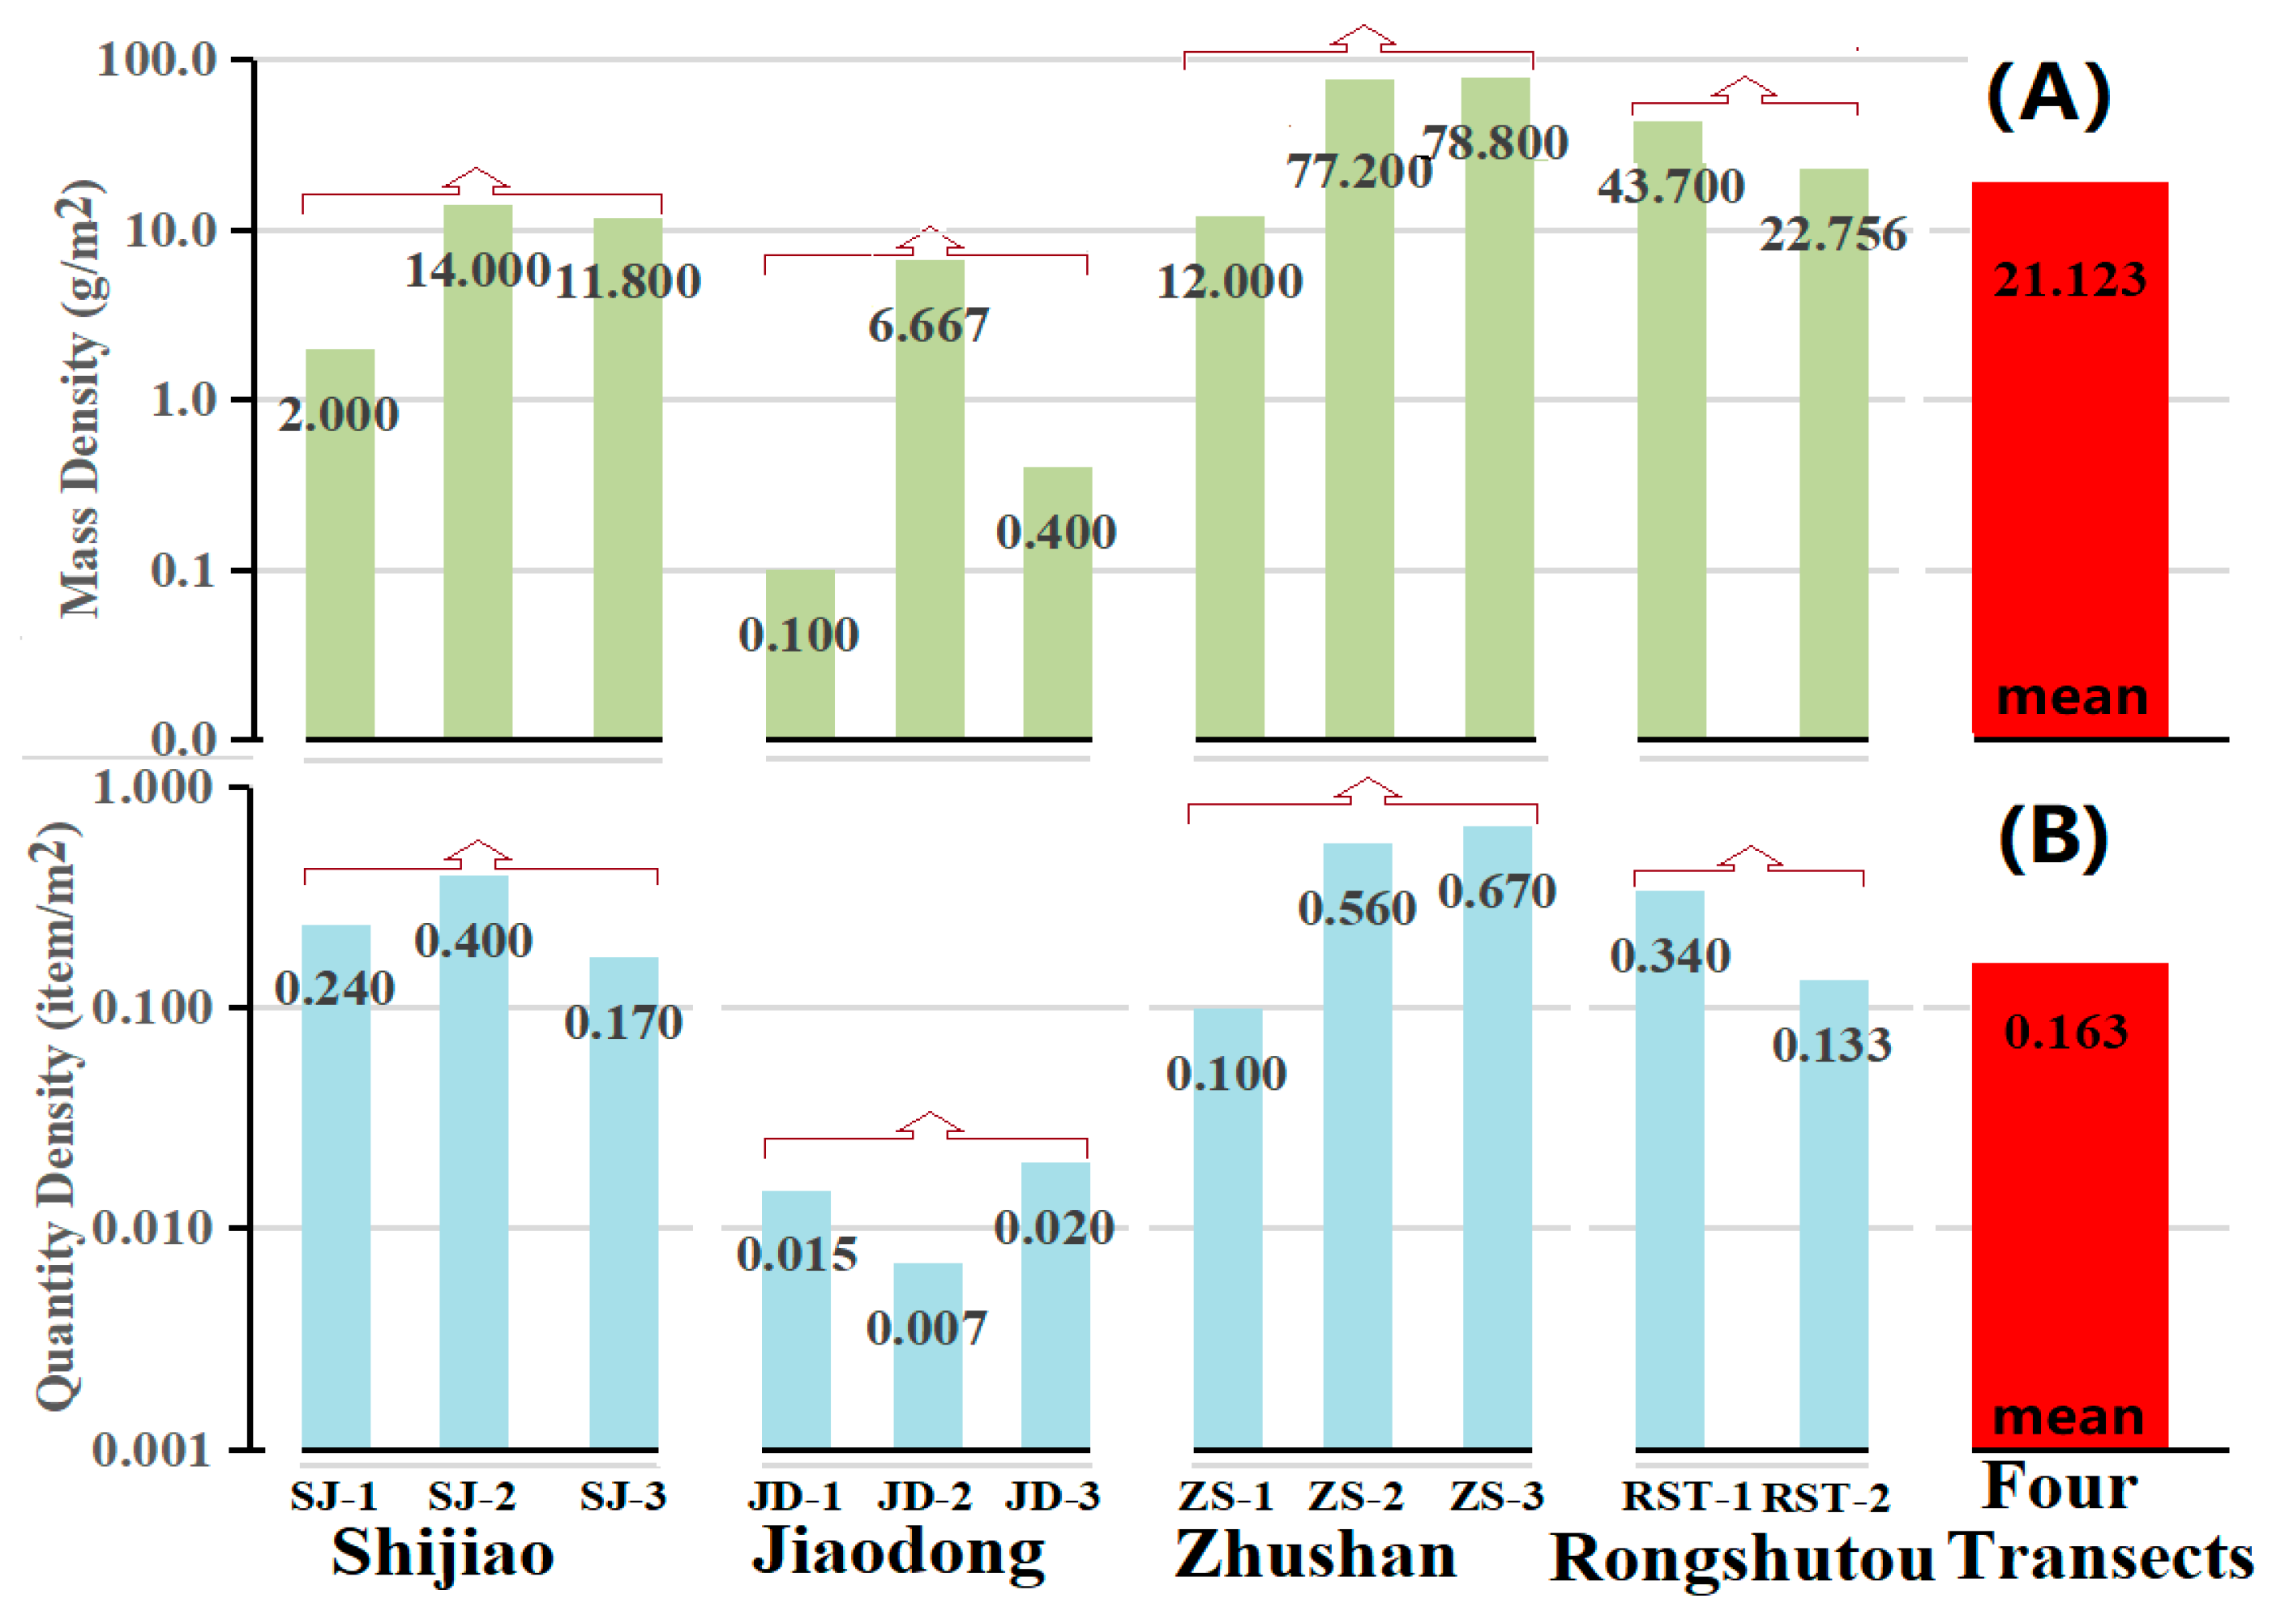
3.2. Density and Total Debris Weight in Beilun Estuary Mangrove Forest Region

In the Beilun Estuary mangrove forest region, the mean mass and quantity densities are 21.123 g/m2 (2.355~51.760) and 0.163 item/m2. The total estimated weights of the debris range from ~30.6 to ~672.9 tons, with a mean value of ~274.6 tons (Table 5). Such a large amount of debris should not be ignored because the debris of plastics, foam, glass, tires and electronic waste in situ may contaminate the mangrove environment inevitably. The mass percentage of plastics in all the debris is the highest (63.10%), followed by fabrics (17.91%) and Styrofoam (10.07%). The quantity percentage of plastics is the highest (75.90%), followed by Styrofoam (14.36%), fabrics (4.10%) and glasses (3.59%). The marine debris may potentially threaten the health and safety of marine life (birds, dolphins, sea turtles, etc.) by being ingested, entangling and suffocating. Additionally, the debris may affect the coastal landscape and have adverse effects on human health and the marine economy.

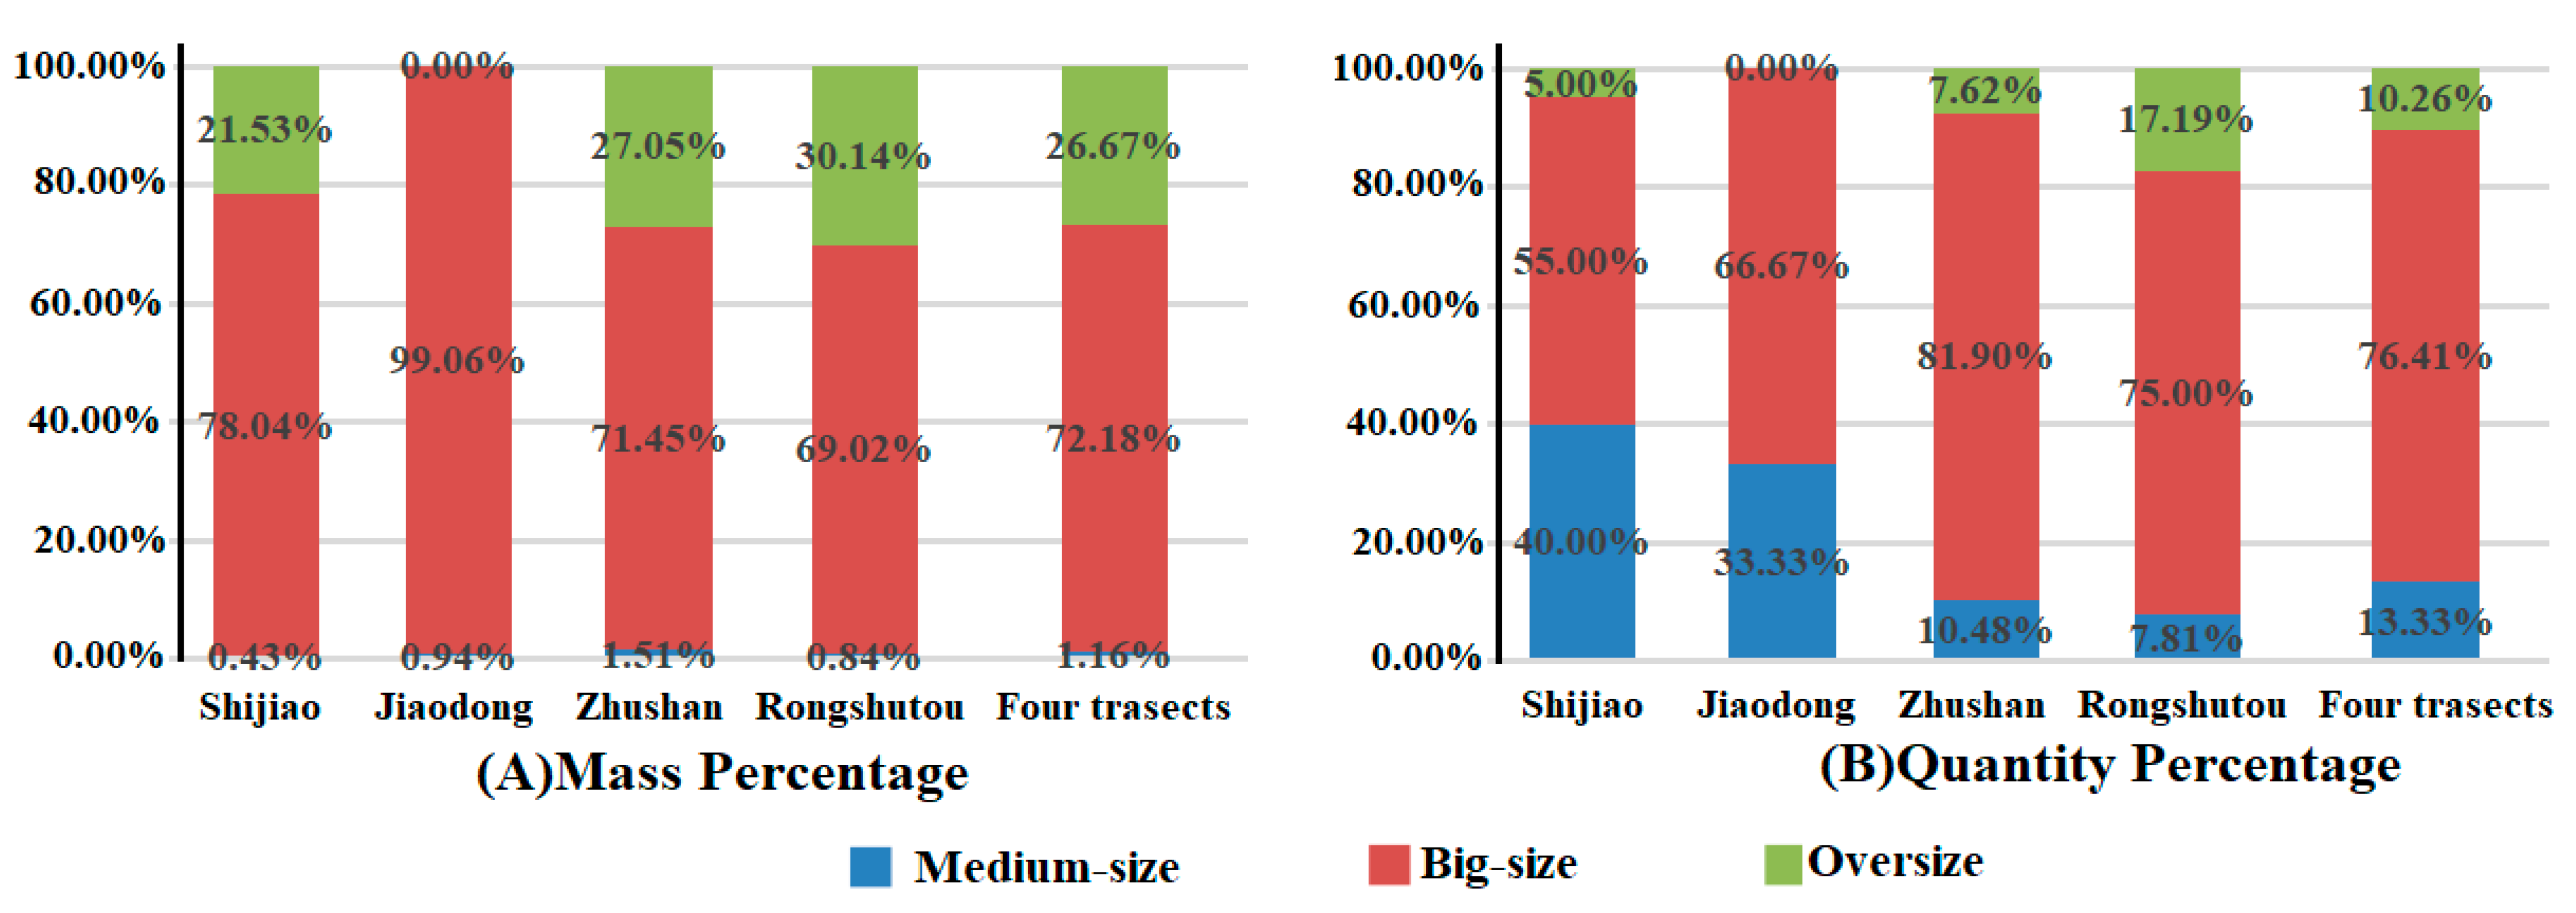
3.3. Size of the Debris in Beilun Estuary Mangrove Forest Region

Figure 4 provides the mass and quantity percentages of the debris by size in the mangrove forest (Table 6 and Figure 5). The mass percentages of the big-size, oversize and medium-size debris are 72.18%, 26.67% and 1.16%, respectively, while the quantity percentages are 76.41%, 10.26% and 13.33%, respectively. The small-size debris is negligible in the Beilun Estuary mangrove forest region. Additionally, more than 98% of the debris are harmful, or could be harmful (including plastics, foam, textile materials and some rubber), which is another source of microplastic debris. The medium-/big-size debris (plastics, fabrics and rubber) may ultimately degrade into millions of microplastic particles because of the mechanical stress, sun exposure and weathering conditions. Microplastics are of environmental concern because their size (millimeters or smaller) renders them accessible to a wide range of organisms at least as small as zooplankton, with the potential for physical and toxicological harm [53]. Microplastic pollution in the mangrove sediments was investigated in Qinzhou and Fangchenggang, Guangxi [29,47,48]. If conditions permit, it will be necessary to investigate microplastics in seawater and sediments in mangroves as much as possible in the future.

3.4. Debris Distribution Influenced by Flood-Ebb Fluctuations

The debris distribution in mangrove forests may be related to the flood-ebb tidal current. The debris can enter a mangrove forest during the rising or falling tide and may be lodged by branches or roots. The maximum mass density of the marine debris is at the low-tide or medium-tide station of the Jiaodong, Shijiao and Zhushan transects, while it is at the high-medium-tide station of the Rongshutou transect; the minimum mass density is at the high-tide station in the Shijiao, Jiaodong and Zhushan transects, while it is at the low-tide station in the Rongshutou transect. Additionally, the maximum quantity density of the marine debris is at the low-tide station in the Zhushan transect; the maximum quantity density is at the medium-tide station in the Shijiao transect, while it is at the high- or medium-tide station in the Rongshutou transect. In the Jiaodong, Zhushan and Rongshutou transects, the minimum quantity density is at the low- or medium-tide station.
No small-size debris were found, but large debris (the medium-/big-size/oversize) were found in the mangrove forest region. These debris are mainly light-weighted, floating plastic debris (plastic bags and Styrofoam). Our results support that mangrove forests are traps [9] for the medium-/big-size, land-/ocean-based floating debris. Additionally, our results suggest that the pneumatophores of a mangrove forest act as a filter, which can not only prevent the land-based debris from entering the marine environment through the river but also prevent the sea-based debris from being dispersed into the terrestrial environment again by tidal currents and waves [9,26]. We agree with the viewpoint that mangroves are akin to sinks for marine debris. Figuratively speaking, mangroves act as a barrier, blocking the land-/ocean-based debris from dispersing.

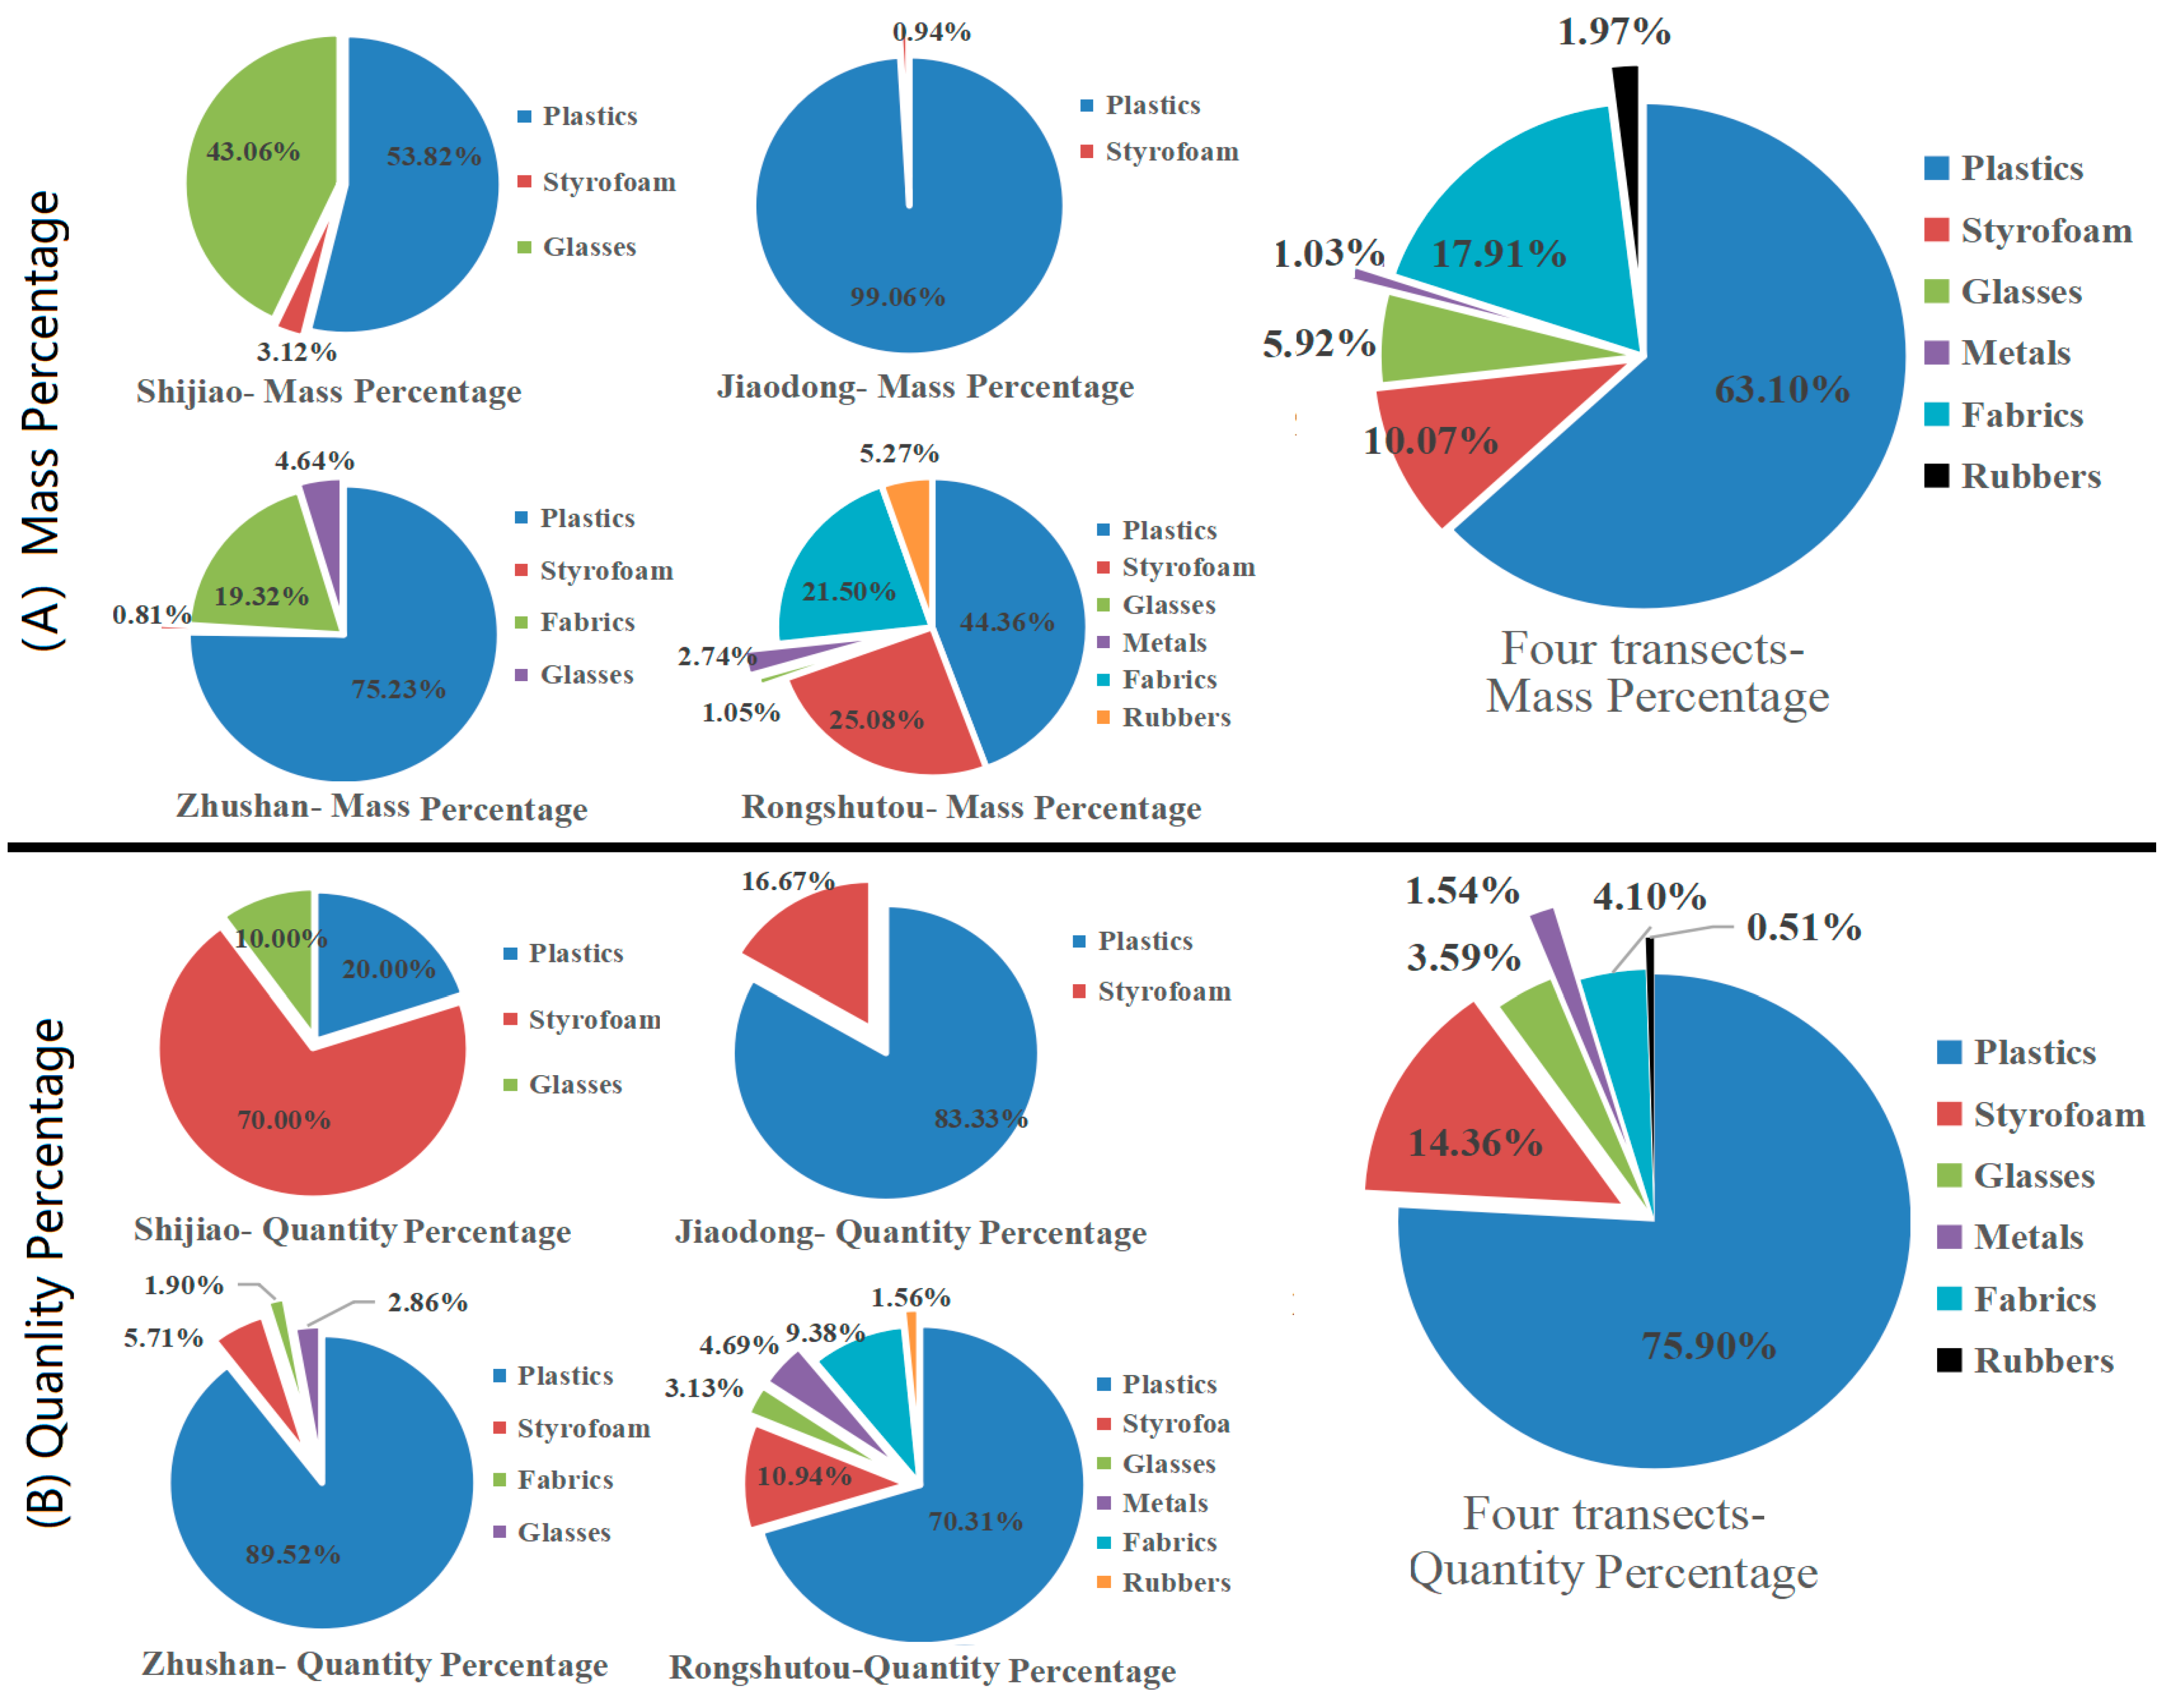
3.5. Plastic Debris Pollution and Assessment

Plastic, as an important basic material, is widely used in production and life. Although modern life would be unrecognizable without plastics, the dark side of the convenience they bring must not be ignored [54], including the entanglement of marine fauna, ingestion by seabirds and organisms ranging in size from plankton to marine mammals, dispersal of microbial and colonizing species to potentially non-native waters and concentration and transport of organic contaminants to marine organisms at multiple trophic levels [55]. The magnitude and fate of plastic debris pollution are still open questions [56,57,58] because of their persistence at sea (their durability, low recycling rates) and adverse consequences to marine life and potentially human health [16,37,59]. Mangroves have been recognized for their importance in confining plastic waste due to their pneumatophores. The spatial complexity characteristic of mangrove ecosystems provides many opportunities for debris to become entangled, which enhances their role as traps and/or barriers for plastic pollution dispersing [7,9,60].
If Styrofoam is also considered as plastic debris in this study, the percentage of the total plastic debris is more than 70% (the mass percentage of 73.17% and the quantity percentage of 90.25%). The mass densities of plastics and Styrofoam are 13.329 and 2.128 g/m2, respectively; the quantity densities are 0.123 and 0.023 item/m2, respectively. The total input weights of plastics and Styrofoam debris are 30.3~506.2 tons and 0.2~95.2 tons, with the mean values of ~173.3 tons and ~27.7 tons, respectively. Such a large amount of plastic debris not only pollutes the environment but may also transform into microplastics in the future, which will inevitably harm marine life in the mangrove environment. Thus, plastic (plastics and Styrofoam) products should not be used excessively, and, at the same time, plastic waste should not be discharged but reused as much as possible. Only curbing plastic use and reducing waste can save our planet. More mandatory policies should be formulated and implemented to prompt market players to reduce packaging materials and increase the rates of recycling and reuse, as well as establishing a green certification system for the industry [52].

4. Conclusions

The magnitude and fate of this pollution are still open questions. An appropriate modified approach of the marine debris in mangroves was established and practiced in the Beilun Estuary mangrove region. Our results show that mangroves act mostly as a barrier for the big-size debris because it can prevent both the land-based debris from dispersing into the sea and the ocean-based debris from invading the terrestrial environment. It is hoped that our methodology may be generalized for other regions in the world, and that it is helpful to promote the standardized monitoring of marine debris in the mangrove ecosystem to assess the impact of human activities on mangroves. This study is also expected to help promote biodiversity-friendly practices and approaches for the conservation and sustainable use of threatened ecosystems and species in the mangrove ecosystem.
The vast mangrove ecosystem in the Beilun Estuary provides the food and habitat for a variety of benthos and birds. We must clearly recognize that the mangrove areas in the Beilun Estuary are filled with some plastic debris (plastics plus Styrofoam: more than 70% Ms-p.c and 90% Qt-p.c.) due to human activities. In the Beilun Estuary mangrove region, marine debris pollution is actually an international problem as the Beilun Estuary region is a land connection for economic cooperation and logistics between China and ASEAN. Dongxi in Fangchenggang (China) is only separated from Mong Cai (Vietnam) by the Beilun River. With the acceleration of industrialization and urbanization and the rapid development of the economy and society, the mangroves are facing serious threats due to urban expansion, coastal development, high-intensity human interference and other factors. Our results are helpful to promote the supervision and control of marine debris, especially plastics, in the mangrove region of the Beilun Estuary of China and Vietnam. The findings of this study provide the baseline data for marine debris, including plastic pollution, and assist in prioritizing future plastic debris monitoring and mitigation strategies.

Author Contributions

D.L.: Analysis, Data processing, and Writing. L.Z.: Diagram, Writing and Editing. Z.G., X.Y. and W.D.: Sampling: Sampling and Data processing. H.Z.: Data processing, Writing—Reviewing and Editing. P.Z.: Conceptualization, Sampling and Data processing, Methodology, Writing—Reviewing and Editing. All authors have read and agreed to the published version of the manuscript.

Funding

This research was funded by the South China Sea Scheme from Marine Early-warning and Monitoring Division of Ministry of Natural Resources of P. R. China (MNRMEWM-SCS2019), and by National Natural Science Fund Projects of P. R. China (41776091).

Institutional Review Board Statement

Not applicable.

Informed Consent Statement

Not applicable.

Data Availability Statement

The data presented in this study are available in insert article here.

Acknowledgments

This work was financially supported by the South China Sea Scheme from Marine Early-warning and Monitoring Division of Ministry of Natural Resources of P. R. China (MNRMEWM-SCS2019), and by National Natural Science Fund Projects of P. R. China (41776091). We are extremely grateful for the sampling help from Beihai Marine Environment Monitoring Center Station of State Oceanic Administration of Ministry of Natural Resources of P. R. China (Guiwen ZHU and Guoqing LIU), Fangchenggang Ocean Bureau (Wanci LUO and Xiong LIU) and Guangxi Beilun Estuary National Nature Reserve Administration (Zhihe WU) of Guangxi Zhuang Autonomous Region.

Conflicts of Interest

The authors declare no conflict of interest.

References

  1. Zhang, Q.; Sui, S. The Mangrove wetland resources and their conservation in China. J. Nat. Resour. 2001, 16, 28–36, (In Chinese with Abstract). [Google Scholar]
  2. Duan, S.; Xu, J. Functions of mangrove wetlands in the conservation of the coastal ecosystems. Ecol. Sci. 2004, 23, 351–355, (In Chinese with Abstract). [Google Scholar]
  3. Li, X.L. A Study on The Mixed-Species Flock in Mangrove Reserve of Beilun Estuary. Master’s Thesis, Guangxi University, Nanning, China, 2007; pp. 1–49, (In Chinese with English Abstract). [Google Scholar]
  4. Yessoufou, K.; Stoffberg, G.H. Biogeography, threats and phylogenetic structure of mangrove forest globally and in South Africa: A review. S. Afr. J. Bot. 2016, 107, 114–120. [Google Scholar] [CrossRef]
  5. Rovai, A.S.; Twilley, R.R.; Castañeda-Moya, E.; Riul, P.; Cifuentes-Jara, M.; Manrow-Villalobos, M.; Horta, P.A.; Simonassi, J.C.; Fonseca, A.L.; Pagliosa, P.R. Controls on carbon storage in mangrove soils. Nat. Clim. Chang. 2018, 8, 534–538. [Google Scholar] [CrossRef]
  6. Huang, Q.S. Evaluation on the Value of Mangrove Ecosystem Services at Beilun Estuary of Guangxi. Nanning. Master’s Thesis, Guangxi Normal University, Nanning, China, 2018; pp. 1–60, (In Chinese with English Abstract). [Google Scholar]
  7. Not, C.; Lui, C.Y.I.; Cannicci, S. Feeding behavior is the main driver for microparticle intake in mangrove crabs. Limnol. Oceanogr. Lett. 2020, 5, 84–91. [Google Scholar] [CrossRef] [Green Version]
  8. GESAMP. Guidelines for the Monitoring and Assessment of Plastic Litter and Microplastics in the Ocean; Kershaw, P.J., Turra, A., Galgani, F., Eds.; United Nations Environment Programme (UNEP): Nairobi, Kenya, 2019; p. 130. [Google Scholar]
  9. Martin, C.; Almahasheer, H.; Duarte, C.M. Mangrove forests as traps for marine litter. Environ. Pollut. 2019, 247, 499–508. [Google Scholar] [CrossRef]
  10. Roman, L.; Bell, E.; Wilcox, C.; Hardesty, B.D.; Hindell, M. Ecological drivers of marine debris ingestion in Procellariiform Seabirds. Sci. Rep. 2019, 9, 916. [Google Scholar] [CrossRef]
  11. Watters, D.L.; Yoklavich, M.M.; Love, M.S.; Schroeder, D.M. Assessing marine debris in deep seafloor habitats off California. Mar. Pollut. Bull. 2010, 60, 131–138. [Google Scholar] [CrossRef]
  12. Zhou, P.; Huang, C.; Fang, H.; Cai, X.; Li, D.; Li h Yu, H. The abundance, composition and sources of marine debris in coastal seawaters or beaches around the northern South China Sea (China). Mar. Pollut. Bull. 2011, 62, 1998–2007. [Google Scholar] [CrossRef] [PubMed]
  13. NOWRAP MERRAC. Northwest Pacific Action Plan, Marine Environmental Emergency Preparedness and Response Regional Activity Centre. Guidelines for Monitoring Marine Litter on the Seabed in the Northwest Pacific Region. 2007. Available online: http://merrac.nowpap.org/merrac/publication/select_marineLitter_list/page/20?search_key=all&search_word=&conts_sn=EE0104&conts_sn_full=EE010401&gnb=publication&snb=Marine+Litter+Report&bbs_no=&page_url= (accessed on 14 June 2021).
  14. NOWRAP CEARAC. Coastal Environmental Assessment of Regional Activity Centre, Northwest Pacific Action Plan. Guidelines for Monitoring Marine Litter on the Beaches and Shorelines of the Northwest Pacific Region. 2007. Available online: https://www.doc88.com/p-189619384974.html?s=rel&id=1 (accessed on 14 June 2021).
  15. SOA of China. State Oceanic Administration China. Guideline for Marine Debris Monitoring and Assessment (Provisional) (First Edition). 2011. Available online: http://f.mnr.gov.cn/201806/t20180628_1960651.html (accessed on 18 December 2015). (In Chinese)
  16. Brander, S.M.; Fontana, R.E.; Mata, T.M.; Gravem, S.A.; Hettinger, A.; Bean, J.R.; Szoboszlzai, A.; Keiper, C.A.; Marrero, M.E. The Ecotoxicology of Plastic Marine Debris. Am. Biol. Teach. 2011, 73, 474–478. [Google Scholar] [CrossRef]
  17. Guo, F.; Zhou, P.; Li, Z.; Qin, Y. The abundance, composition and sources of marine debris in the coastal East China Sea in 2011. Trans. Oceanol. Limnol. 2014, 3, 193–200. [Google Scholar]
  18. Mace, T. At-sea detection of marine debris: Overview of technologies, processes, issues, and options. Mar. Pollut. Bull. 2012, 65, 23–27. [Google Scholar] [CrossRef] [PubMed]
  19. Moy, K.; Neilson, B.; Chung, A.; Meadows, A.; Castrence, M.; Ambagis, S.; Davidson, K. Mapping coastal marine debris using aerial imagery and spatial analysis. Mar. Pollut. Bull. 2018, 132, 52–59. [Google Scholar] [CrossRef] [PubMed]
  20. Lebreton, L.; Slat, B.; Ferrari, F.; Sainte-Rose, B.; Aitken, J.; Marthouse, R.; Hajbane, S.; Cunsolo, S.; Schwarz, A.; Levivier, A.; et al. Evidence that the Great Pacific Garbage Patch is rapidly expanding. Sci. Rep. 2018, 8, 4666. [Google Scholar] [CrossRef] [PubMed] [Green Version]
  21. Fallati, L.; Polidori, A.; Salvatore, C.; Saponari, L.; Savinia, A.; Gall, P. Anthropogenic Marine Debris assessment with Unmanned Aerial Vehicle imagery and deep learning: A case study along the beaches of the Republic of Maldives. Science 2019, 693, 133581. [Google Scholar] [CrossRef] [PubMed]
  22. Andriolo, U.; Gonçalves, G.; Sobral, P.; Fontán-Bouzas, Á.; Bessaf, F. Beach-dune morphodynamics and marine macro-litter abundance: An integrated approach with unmanned aerial system. Sci. Total. Environ. 2020, 749, 141474. [Google Scholar] [CrossRef]
  23. Nakashima, E.; Isobe, A.; Magome, S.; Kako, S.I.; Deki, N. Using aerial photography and in situ measurements to estimate the quantity of macro-litter on beaches. Mar. Pollut. Bull. 2011, 62, 762–769. [Google Scholar] [CrossRef] [PubMed]
  24. Ivar do Sul, J.A.; Costa, M.F.; Silva-Cavalcanti, J.S.; Araújo, M.C.B. Plastic debris retention and exportation by a mangrove forest patch. Mar. Pollut. Bull. 2014, 78, 252–257. [Google Scholar] [CrossRef]
  25. Nor, N.H.M.; Obbard, J.P. Microplastics in Singapore’s coastal mangrove ecosystems. Mar. Pollut. Bull. 2014, 79, 278–283. [Google Scholar] [CrossRef]
  26. Rahim, S.; Widayati, W.; Analuddin, K.; Saleh, F.A.; Sahar, S. Spatial Distribution of Marine Debris Pollution in Mangrove-Estuaries Ecosystem of Kendari Bay. IOP Conf. Ser. Earth Environ. Sci. 2020, 412, 12006. [Google Scholar] [CrossRef] [Green Version]
  27. Lima, A.R.A.; Barletta, M.; Costa, M.F.; Ramos, J.A.A.; Dantas, D.V.; Melo, P.A.M.C.; Justio, A.K.S.; Ferreira, G.V.B. Changes in the composition of ichthyoplankton assemblage and plastic debris in mangrove creeks relative to moon phases. J. Fish. Biol. 2016, 89, 619–640. [Google Scholar] [CrossRef] [PubMed]
  28. Zhou, Q.; Tu, C.; Fu, C.; Li, Y.; Zhang, H.; Xiong, K.; Zhao, X.; Li, L.; Waniek, J.J.; Luo, Y. Characteristics and distribution of microplastics in the coastal mangrove sediments of China. Sci. Total. Environ. 2020, 703, 134807. [Google Scholar] [CrossRef] [PubMed]
  29. Fan, H.; Wang, X.; He, B.; Pan, L. Artificial Habitat Establishment and Mangrove Rehabilitation; Forestry Publishing House: Beijing, China, 2014. (In Chinese) [Google Scholar]
  30. Hu, G.; Li, J.; Qin, Y.; Hu, B.; Liu, X.; Zhang, Z. Population structure and dynamics of mangrove species in Beilun Estuary, Guangxi, southern China. Acta Ecol. Sin. 2018, 38, 3022–3034. [Google Scholar] [CrossRef]
  31. Xiong, X.; Wang, X.; Zhou, H.; Wu, P. The distribution of mangrove bacteria in intertidal surface sediments of the Beilun estuary. Mar. Environ. Sci. 2008, 3, 101–106. [Google Scholar] [CrossRef]
  32. Dan, X.; Liao, B.; Wu, Z.; Wu, H.; Bao, D.; Dan, W.; Liu, S. Resources, protection status and major threats of Chinese mangrove wetland (in Chinese). Ecol. Environ. Sci. 2016, 25, 1237–1243. [Google Scholar] [CrossRef]
  33. Deidun, A.; Gauci, A.; Lagorio, S.; Galgani, F. Optimising beached litter monitoring protocols through aerial imagery. Mar. Pollut. Bull. 2018, 13, 212–217. [Google Scholar] [CrossRef]
  34. Jayapala, H.P.S.; Jayasiri, H.B.; Ranatunga, R.R.M.P.K.; Amarasiri, C. Marine debris and its potential impacts on mangrove ecosystem in Negombo Lagoon. National Aquatic Resources Research and Development Agency (NARA). In Proceedings of the International Scientific Sessions, Crow Island, Sri Lanka, 25 July 2018; p. 33. [Google Scholar]
  35. UNEP (United Nations Environment Programme). Marine Plastic Debris and Microplastics-Global Lessons and Research to Inspire Action and Guide Policy Change; United Nations Environment Programme (UNEP): Nairobi, Kenya, 2016; p. 252. [Google Scholar]
  36. Rees, G.; Pond, K. Marine litter monitoring programmes-A review of methods with special reference to national surveys. Mar. Pollut. Bull. 1995, 30, 1113–1118. [Google Scholar] [CrossRef]
  37. Lebreton, L.C.M.; van der Zwet, J.; Damsteeg, J.W.; Slat, B.; Andrady, A.; Reisser, J. River plastic emissions to the world’s oceans. Nat. Commun. 2017, 8, 15611. [Google Scholar] [CrossRef]
  38. Stefatos, A.; Charalampakis, M.; Papatheodorou, G.; Ferentinos, G. Marine debris on the seafloor of the Mediterranean Sea: Examples from two enclosed gulfs in western Greece. Mar. Pollut. Bull. 1999, 38, 389–393. [Google Scholar] [CrossRef]
  39. Spengler, A.; Costa, M.F. Methods applied in studies of benthic marine debris. Mar. Pollut. Bull. 2008, 56, 226–230. [Google Scholar] [CrossRef]
  40. Liebezeit, G. Marine litter on the Kachelotplate, Lower Saxonian Wadden Sea. Senckenbergiana Marit. 2008, 38, 147–151. [Google Scholar] [CrossRef]
  41. Gong, Y. Analysis on the Ecological Changes and Protection of Mangroves in the Beilun Estuary Jings’ Residence; Nanning: Guangxi University for Nationalities, Guangxi, China, 2019; pp. 1–93, (In Chinese with English Abstract). [Google Scholar]
  42. Lai, J.; Xu, M.; Jiang, F.; Ke, K.; Zhang, R.; Lei, F. Marine Ecosystem Environmental Health Assessment in the Coastal Waters of Beilun Estuary. Guangxi Sci. 2014, 21, 77–83. [Google Scholar] [CrossRef]
  43. Liu, X.; Cheng, D.; Ye, C.; Su, B.; Luo, W.; Zeng, X.; Xu, L.; Luo, Z. Changes of Water Quality Parameters Along the Coastal Area of National Nature Reserve of Guangxi Beilun Estuary, 2012–2014. J. Guangxi Acad. Sci. 2015, 31, 89–93. [Google Scholar] [CrossRef]
  44. Li, B.; Pang, B.; Tan, Q.; Wu, L. Distribution, influence and risk assessment of polycyclic aromatic hydrocarbons (PAHs) in the mangrove underground in situ pipe eco-farming system in Beilun Estuary. Mar. Fish. 2019, 41, 520–535. [Google Scholar] [CrossRef]
  45. He, X.; Su, B.; Xu, T.; Nong, L.; Ye, C.; Li, X. Macrobenthic Biodiversity in Mangrove Wetland at the Estuary of Beilun River in Guangxi. Wetl. Sci. Manag. 2012, 8, 45–48. [Google Scholar]
  46. Fan, H.; Mo, Z. The History, achievements and lessons learned for mangrove Restoration in Guangxi, China. Guangxi Sci. 2018, 25, 363–371, 387. [Google Scholar] [CrossRef]
  47. Li, J.; Zhang, H.; Zhang, K.; Yang, R.; Li, R.; Li, Y. Characterization, source, and retention of microplastic in sandy beaches and mangrove wetlands of the Qinzhou Bay, China. Mar. Pollut. Bull. 2018, 136, 401–406. [Google Scholar] [CrossRef]
  48. Zhu, J.; Zhang, Q.; Li, Y.; Tan, S.; Kang, Z.; Yu, X.; Lan, W.; Cai, L.; Wang, J.; Shi, H. Microplastic pollution in the Maowei Sea, a typical mariculture bay of China. Sci. Total. Environ. 2019, 658, 62–68. [Google Scholar] [CrossRef]
  49. NDRC (National Development and Reform Commission); MHUD (Ministry of Housing and Urban-Rural Development). Household Garbage Classification Plan. 2017. Available online: http://www.gov.cn/zhengce/content/2017-03/30/content_5182124.htm (accessed on 24 June 2021). (In Chinese)
  50. Brooks, A.L.; Wang, S.; Jambeck, J.R. The Chinese import ban and its impact on global plastic waste trade. Sci. Adv. 2018, 4, eaat0131. [Google Scholar] [CrossRef] [Green Version]
  51. PGGZAR (People’s Government of Guangxi Zhuang Autonomous Region). Household Garbage Classification Work Plan in Guangxi Zhuang Autonomous Region. In Notice on Forwarding “Household Garbage Classification Work Plan in Guangxi Zhuang Autonomous Region” issued by Housing and Urban-Rural Development Department of Development and Reform Commission of Guangxi Zhuang Autonomous Region. 2017. Available online: http://www.gxzf.gov.cn/html/zfwj/zzqrmzfbgtwj_34828/2017ngzbwj_34829/t1506627.shtml (accessed on 24 June 2021). (In Chinese)
  52. NRC (National Development and Reform Commission, P.R. China); MEE (Ministry of Ecology and Environment, China). Opinions on Further Strengthening the Control of Plastic Pollution. 2020. Available online: https://www.ndrc.gov.cn/xxgk/zcfb/tz/202001/t20200119_1219275_ext.html (accessed on 8 June 2021). (In Chinese)
  53. Law, K.L.; Thompson, R.C. Microplastics in the seas. Science 2014, 345, 144–145. [Google Scholar] [CrossRef]
  54. Zhen, L.; Pan, Y. Bans on Plastic Must Be Enforced: China Daily Editorial. 2020. Available online: https://www.chinadaily.com.cn/a/202001/22/WS5e2790efa3101282172729eb (accessed on 22 January 2020).
  55. Law, K.; Morét-Ferguson, S.; Maximenko, N.A.; Proskurowski, G.; Peacock, E.E.; Hafner, J.; Reddy, C.M. Plastic Accumulation in the North Atlantic Subtropical Gyre. Science 2010, 329, 1185–1188. [Google Scholar] [CrossRef] [Green Version]
  56. Cózar, A.; Echevarría, F.; González-Gordillo, J.I.; Irigoien, X.; Úbeda, B.; Hernández-León, S.; Palma, Á.T.; Navarro, S.; García-de-Lomas, J.; Ruiz, A.; et al. Plastic Debris in the Open Ocean. PNAS 2014, 111, 10239–10244. [Google Scholar] [CrossRef] [Green Version]
  57. Thompso, R.C.; Ylva, O.; Mitchell, R.P.; Davis, A.; Rowland, S.J.; John, A.W.G.; McGonigle, D.; Russell, A.E. Lost at Sea: Where Is All the Plastic? Science 2004, 304, 838. [Google Scholar] [CrossRef]
  58. Jambeck, J.R.; Geyer, R.; Wilcox, C.; Siegler, T.R.; Perryman, M.; Andrady, A.; Narayan, R.; Law, K.L. Plastic waste inputs from land into the ocean. Science 2015, 6223, 768–771. [Google Scholar] [CrossRef]
  59. Barnes, K.A.; Galgani, F.; Thompson, R.C.; Barlaz, M. Accumulation and fragmentation of plastic debris in global environments. Philos. Trans. R. Soc. B Biol. Sci. 2009, 364, 1985–1998. [Google Scholar] [CrossRef] [Green Version]
  60. Garcés-Ordóñez, O.; Castillo-Olaya, V.A.; Granados-Briceño, A.F.; Blandón García, L.M.; Espinosa Díaz, L.F. Marine litter and microplastic pollution on mangrove soils of the Ciénaga Grande de Santa Marta, Colombian Caribbean. Mar. Pollut. Bull. 2019, 145, 455–462. [Google Scholar] [CrossRef]
Figure 1. Transects and stations of the debris monitoring in Beilun Estuary mangrove forest region.
Ijerph 18 10826 g001
Figure 2. The in situ monitoring and collection of the debris in mangrove forest. (a) Plastic bag hung by the branch in Jiaodong; (b) Rope hung by branches in Jiaodong; (c) Plastic bag in the mud at Jiaodong; (d) Beverage boxes and used clothes at Rongshutou; (e) Styrofoam hung by the branch in Zhushan; (f) Electronic debris in Zhushan; (g) In situ collection of the debris.
Ijerph 18 10826 g002aIjerph 18 10826 g002b
Figure 3. The mass (A) and quantity (B) densities of the debris.
Ijerph 18 10826 g003
Figure 4. The mass (A) and quantity (B) percentages of the debris.
Ijerph 18 10826 g004
Figure 5. The percentages of medium-size, big-size and oversize debris.
Ijerph 18 10826 g005
Table 1. List and classification of the debris based on the size, materials and sources.
ClassificationSpecific Examples
Materials/
Composition
(plastics, Styrofoam, wood, paper, metal, rubber, fabric/fiber, glass, other material) *
PlasticsBags, bottles, cigarette filters, lighters, buckets, lid, spoons, knives and forks, straws, hats, diapers, syringes, fishing lines, nets, floats, safety helmets, feeding bottles, ropes, toys, rings, old plastic boat, etc.;
StyrofoamBuoys, cups, foam boxes, fast food boxes (plates), etc.;
GlassesBottles, fluorescent tubes, bulbs, glass fragments, etc.;
Metalsmetal barrels, beverage cans, metal plates, metal fragments, iron wires, etc.;
Rubbersballoons, rubber gloves, tires, condoms, etc.;
FabricsClothes, rags and textile materials, etc.;
Wood products #Furniture, crates, chopsticks, wooden cases, old wooden boat, etc.;
Papers $Paper bags, cardboards, cups, newspapers, etc.;
OthersOther artificial articles and unrecognizable materials
SizeSmall-size (<2.5 cm), Medium-size (≥2.5 cm and ≤10 cm), Large-size (>10 cm and ≤1 m) or Oversize (>1 m) debris
SourcesSea sourcescoastal/recreational activity, navigation/fishing activity, medical or sanitary activity and other disposal source (e.g., wood, ceramics, plastic pieces, glass slices)
Land sources
Note: * The relative persistency: food waste < paper < wood < iron < plastic. # Wood products are mainly those furniture and ships that are large, hinder the landscape and may endanger the mangrove forest growth. $ Papers refer to paper products without plastic coating that are big, degradable and endanger the organisms in the mangrove forests. The disposable paper cups (or beverage cartons) are considered as plastics because the paper surface is coated with single- or double-sided PE or plastic film.
Table 2. The debris monitoring stations in Beilun Estuary mangrove forest region.
TransectDateStationArea
(m2)
DebrisStation of Rising
and Falling Tide
Shijiao28 August
2019
SJ-1108.2282° E, 21.6169° N5 × 5Foam particlesHigh-tide station
SJ-2108.2284° E, 21.6152° N10 × 5Beer bottle, plastic woven bagMedium-tide station
SJ-3108.2283° E, 21.6142° N10 × 10Beer bottle, broken buoy, plastic reticule, mineral water bottle, foam particlesLow-tide station
Jiaodong28 August
2019
JD-1108.2042° E, 21.6028° N15 × 10Foam, plastic cupHigh-tide station
JD-2108.2053° E, 21.6016° N15 × 10Plastic woven bagMedium-tide station
JD-3108.2053° E, 21.6000° N10 × 10Plastic bag, ropeLow-tide station
Zhushan29 August
2019
ZS-1108.0399° E, 21.5469° N10 × 10Small/big plastic bagHigh-tide station
ZS-2108.0396° E, 21.5469° N10 × 5Plastic packing bag, woven bag, big plastic bag, mineral water bottle, plastic disposal cup, foamMedium-tide station
ZS-3108.0382° E, 21.5468° N10 × 10Canvas, pants, beer bottle, woven bag, small/big plastic bag, plastic bag, fruits packing net, plastic cup/drink bottle/food box, foam fast food box, packing rope, pipeLow-tide station
Rongshu
tou
30 August 2019RST-1108.0806° E, 21.5388° N10 × 10Foam, small plastic bag, glass bottle, ring-pull can, motorbike pedal (metal), plastic drug board, used clothes, shoes, rubber tyre, rope, cellphoneHigh-medium-tide station
RST-2108.0878° E, 21.5375° N15 × 15fishing nets, plastic film, foam, metal food bottle, woven bag, used clothes, cotton glovesLow-tide station
Table 3. Mass weights and quantities of debris in Shijiao, Jiaodong, Zhushan and Rongshutou transects in Beilun Estuary mangrove forest.
TypesD-Mass
(g/m2)
Ms-p.c. (%)D-Qt
(item/m2)
Qt-p.c. (%)StationsTypesArea (m2)Weights (g)D-Ms
(g/m2)
Ms-p.c. (%)ItemD-Qt
(item/m2)
Qt-p.c. (%)
Shijiao transect
(Station of SJ-1, SJ-2, and SJ-3 )Area = 175 m2
SJ-1Styrofoam25502.00010060.240100
SJ-2Plastics503008.00057.1410.02050.00
Styrofoam0.3313.120.08070.00Glasses4006.00042.8610.02050.00
Plastics5.71453.820.02320.00D-Mean-14.000--0.040-
Glasses4.57143.060.01110.00SJ-3Styrofoam10080.0800.7280.08066.67
D-Mean10.617-0.024-Plastics6006.00054.1530.03025.00
Glasses5005.00045.1310.0108.33
D-Mean-11.800--0.120-
Jiaodong transect
(Station JD-1, JD-2, and JD-3), Area = 450 m2
JD-1Styrofoam200100.05050.0010.00533.33
Plastics100.05050.0020.01066.67
Styrofoam0.0220.940.00216.67D-Mean-0.100--0.015-
Plastics2.33399.060.01183.33JD-2Plastics15010006.667100.0010.007100.00
D-Mean2.355-0.013-JD-3Plastics100400.400100.0020.020100.00
Zhushan transect
(Station ZS-1, ZS-2, and ZS-3), Area = 250 m2
ZS-1Plastics100120012.000100.00100.100100.00
ZS-2Styrofoam50801.60050.0040.08050.00
Styrofoam0.4200.810.0245.71Plastics378075.60050.00240.48050.00
Plastics38.94075.230.37689.52D-Mean-77.200--0.560-
Fabrics10.00019.320.0081.90ZS-3Styrofoam100250.2500.3220.0202.99
Glasses2.4004.640.0122.86Plastics475547.55060.34600.60089.55
D-Mean51.760-0.420-Fabrics250025.00031.7320.0202.99
Glasses6006.0007.6130.0304.48
D-Mean-78.800--0.670-
Rongshutou transect
(Station RST-1 and RST-2), Area = 425 m2
RST-1Styrofoam100230023.00052.6320.0205.88
Plastics101010.10023.11240.24070.59
Styrofoam7.32325.080.02210.94Glasses1001.0002.2920.0205.88
Plastics12.95444.360.13870.31Metals1601.6003.6620.0205.88
Glasses0.3081.050.0063.13Fabrics3003.0006.8630.0308.82
Metals0.8002.740.0094.69Rubbers5005.00011.4410.0102.94
Fabrics6.27721.500.0189.38D-Mean-43.700--0.340-
Rubbers1.5385.270.0031.56RST-2Plastics225320014.22262.50210.09370.00
D-Mean29.200-0.197-Styrofoam800.3561.5650.02216.67
Metals1000.4441.9510.0043.33
Fabrics17407.73333.9830.01310.00
D-Mean-22.756--0.133-
Four transects
(Shijiao, Jiaodong, Zhushan, and Rongshutou),
Area = 1200 m2
TotalStyrofoam120025532.12810.07280.12314.36
Plastics15,99513.32963.101480.02375.90
Glasses15001.2505.9270.0063.59
Metals2600.2171.0330.0031.54
Fabrics45403.78317.9180.0074.10
Rubbers5000.4171.9710.0010.51
D-Mean25,34821.123-1950.163-
Note: D-Ms and D-Qt represent mass density (g/m2) and quantity density (item/m2), respectively. Ms-p.c (%) and Qt-p.c (%) represent the percentage of mass and quantity, respectively. D-Mean represents mean density (g/m2) of (item/m2).
Table 4. Source of marine debris in Beilun Estuary mangrove forest region.
SourcesTypesMs-p.c. (%)Qt-p.c.
(%)
Debris Items
Land-basedCoastal/RecreationalactivityStyrofoam10.07%14.36%Particles, foam fast food box, etc.
Plastics53.79%68.72%Plastic film, plastic bag (woven bag, plastic reticule, packing bag), plastic bottle/box/cup (mineral water bottle, drink bottle/food box, disposal cup), fruits packing net, packing rope, pipe, cellphone, etc.
Glasses5.92%3.59%Beer bottle, glass bottle/cup
Metals1.03%1.54%ring-pull can, metal food bottle, motorbike pedal
Rubbers17.91%4.10%Rubber tire
Fabrics1.97%0.51%Used clothes, shoes, pants, cotton gloves
Total90.69%92.82%-
Land-basedMedical or sanitary activityPlastics0.12%1.54%Plastic drug board
Sea-basedNavigation/fishing activityPlastics9.19%5.64%Fishing nets, broken buoy, rope
Table 5. The debris weights estimated in Beilun Estuary mangrove forest region.
Area1200 m2 of Survey Area~1.3 × 10⁷ m2 of Mangrove Area
ClassificationD-Ms (g/m2)Debris Weights (ton)
MeanRangeMeanRange
Plastics13.3292.333~38.940173.330.3~506.2
Styrofoam2.1280.022~7.32327.70.3~95.2
Fabrics3.7830~10.0049.20~130.0
Rubbers0.4170~1.5385.40~20.0
Metals0.2170~0.8002.80~10.4
Glasses1.2500~2.40016.20~31.2
All debrs21.1232.355~51.760274.630.65~672.9
Table 6. Mass weights and quantity of marine debris items by sizes.
TransectMass Weights (g)Quantity (Item)
Medium-SizeBig-SizeOversizeMedium-SizeBig-SizeOversize
ShijiaoWeight/Quantity814504008111
p.c (%)0.4378.0421.5340.0055.005.00
JiaodongWeight/Quantity1010500240
p.c (%)0.9499.060.0033.3366.670.00
ZhushanWeight/Quantity1959245350011868
p.c (%)1.5171.4527.0510.4881.907.62
RongshutouWeight/Quantity806550286054811
p.c (%)0.8469.0230.147.8175.0017.19
Four transectsWeight/Quantity29318,29567602614920
p.c (%)1.1672.1826.6713.3376.4110.26
Publisher’s Note: MDPI stays neutral with regard to jurisdictional claims in published maps and institutional affiliations.

