
Coordination Study on Ecological and Economic Coupling of the Yellow River Basin


Abstract
:1. Introduction
2. Research Methods and Data Sources
2.1. Study Area
2.2. Data Sources
2.2.1. Economic and Energy Consumption Data
2.2.2. Ecological Data
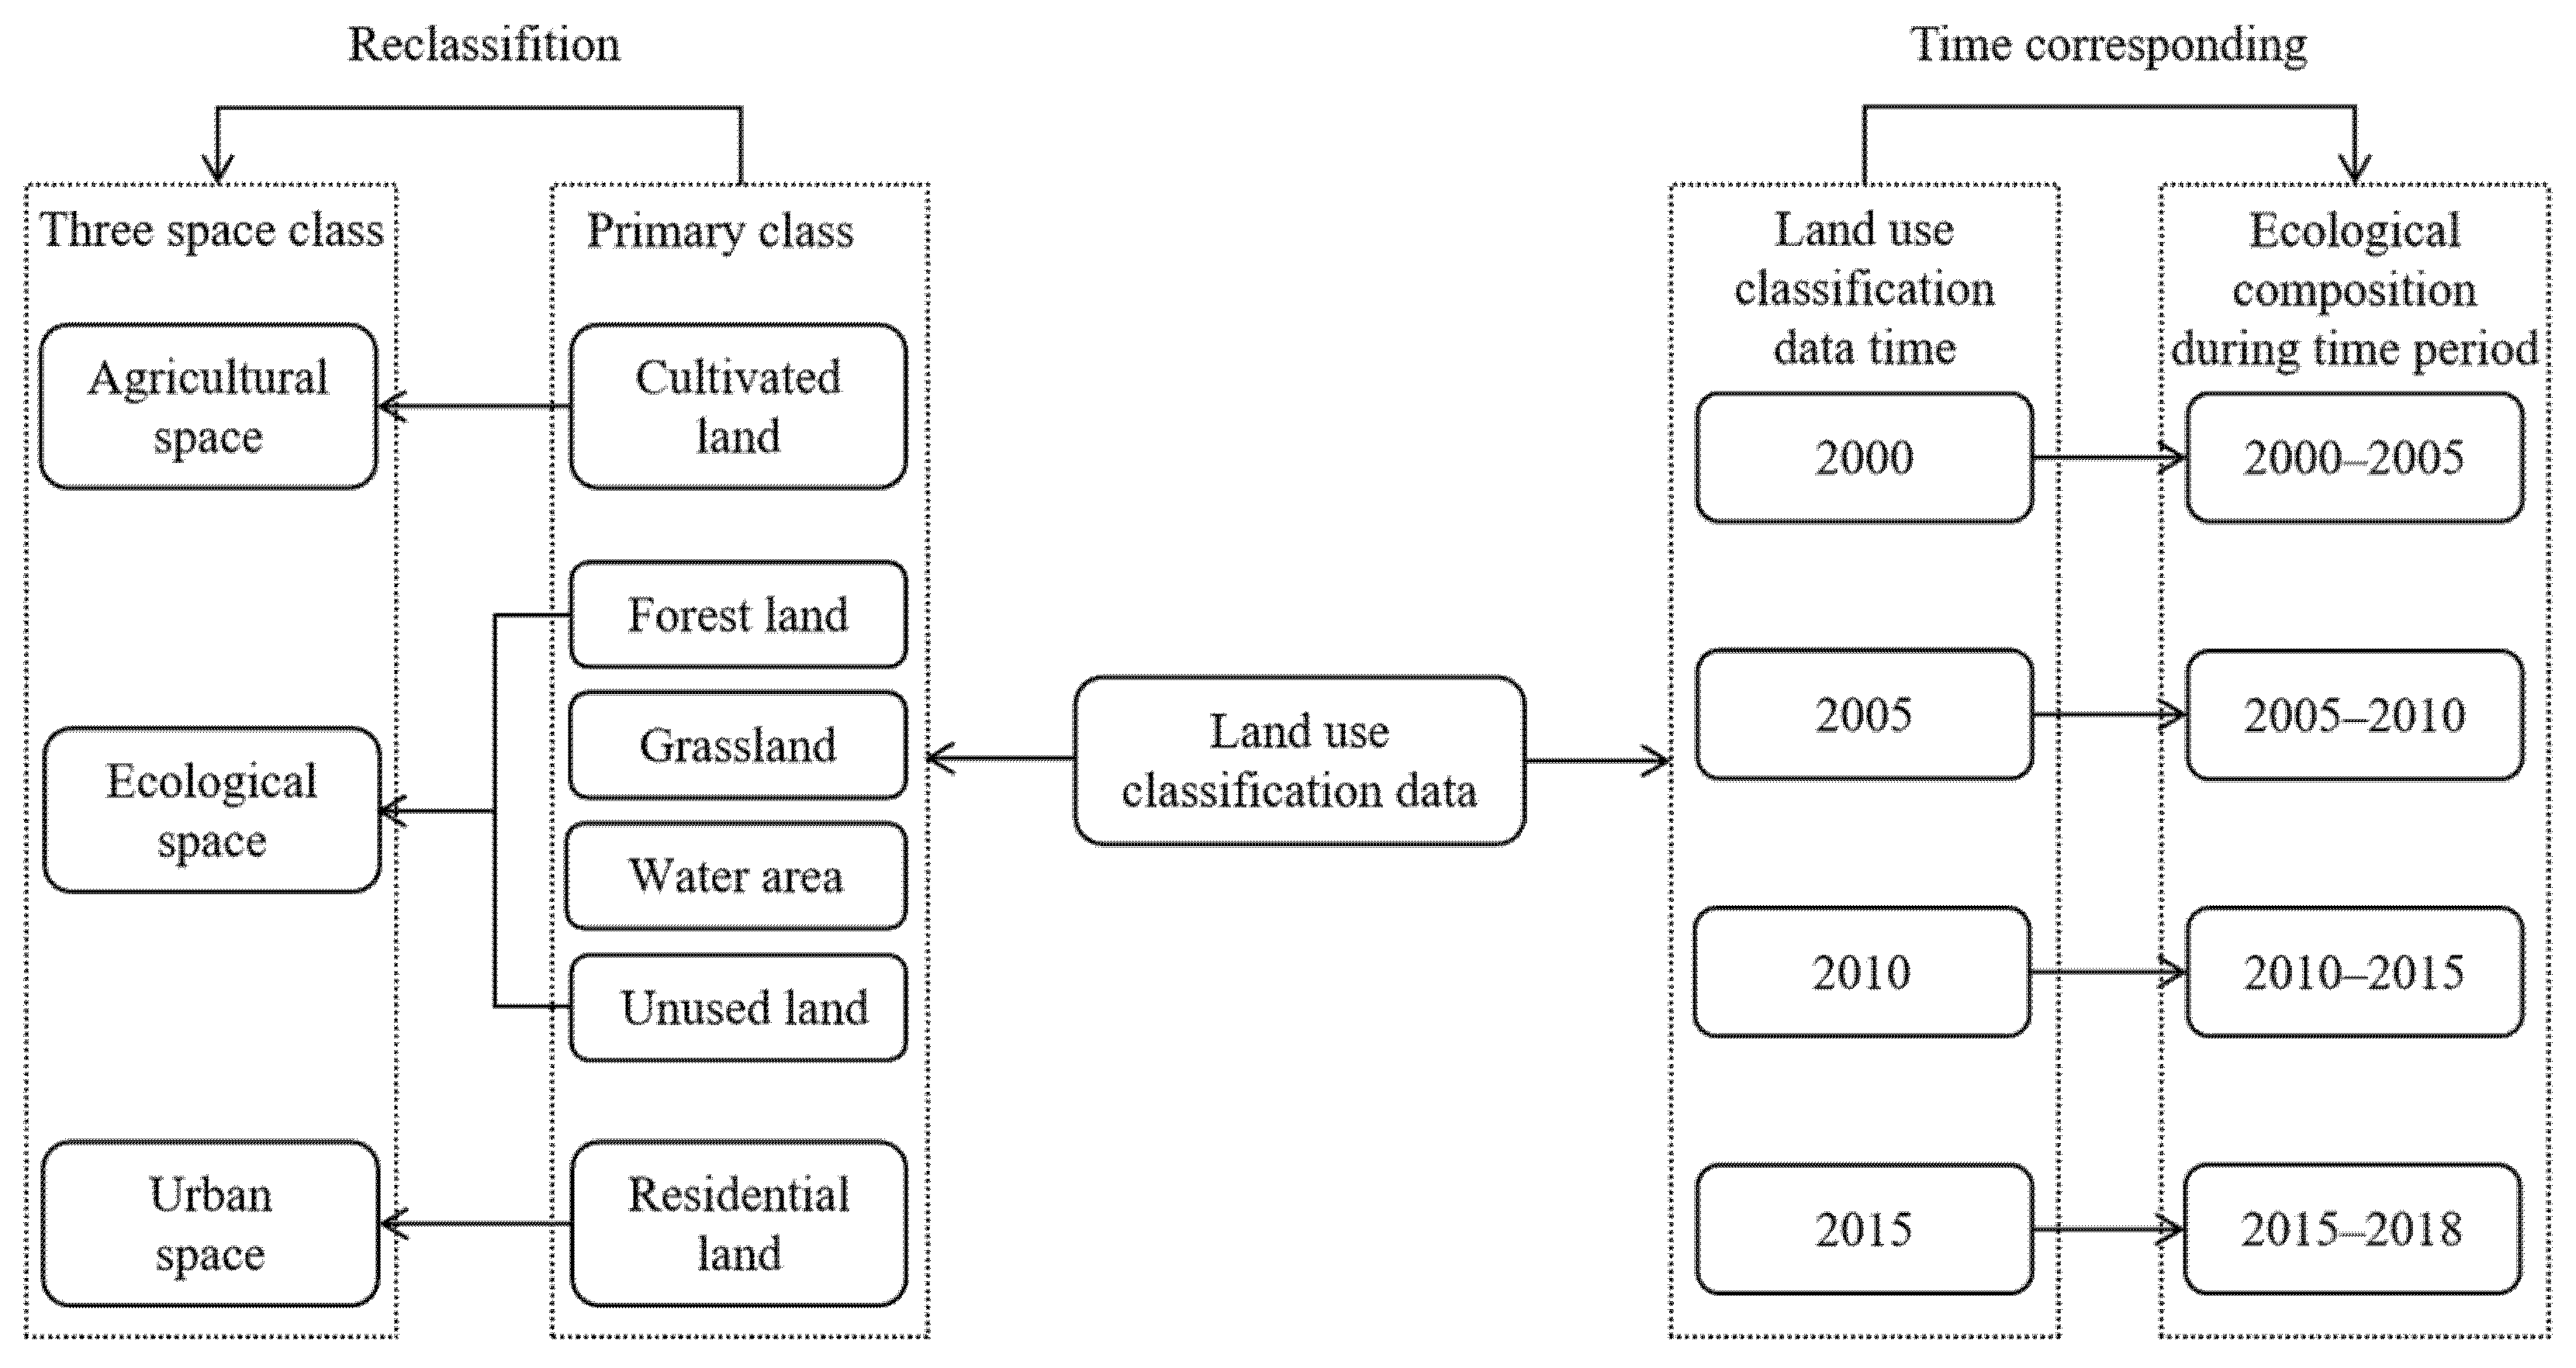
Ecological Composition Data
Vegetation Ecological Quality Data
2.2.3. Water Resources Data
2.3. Method
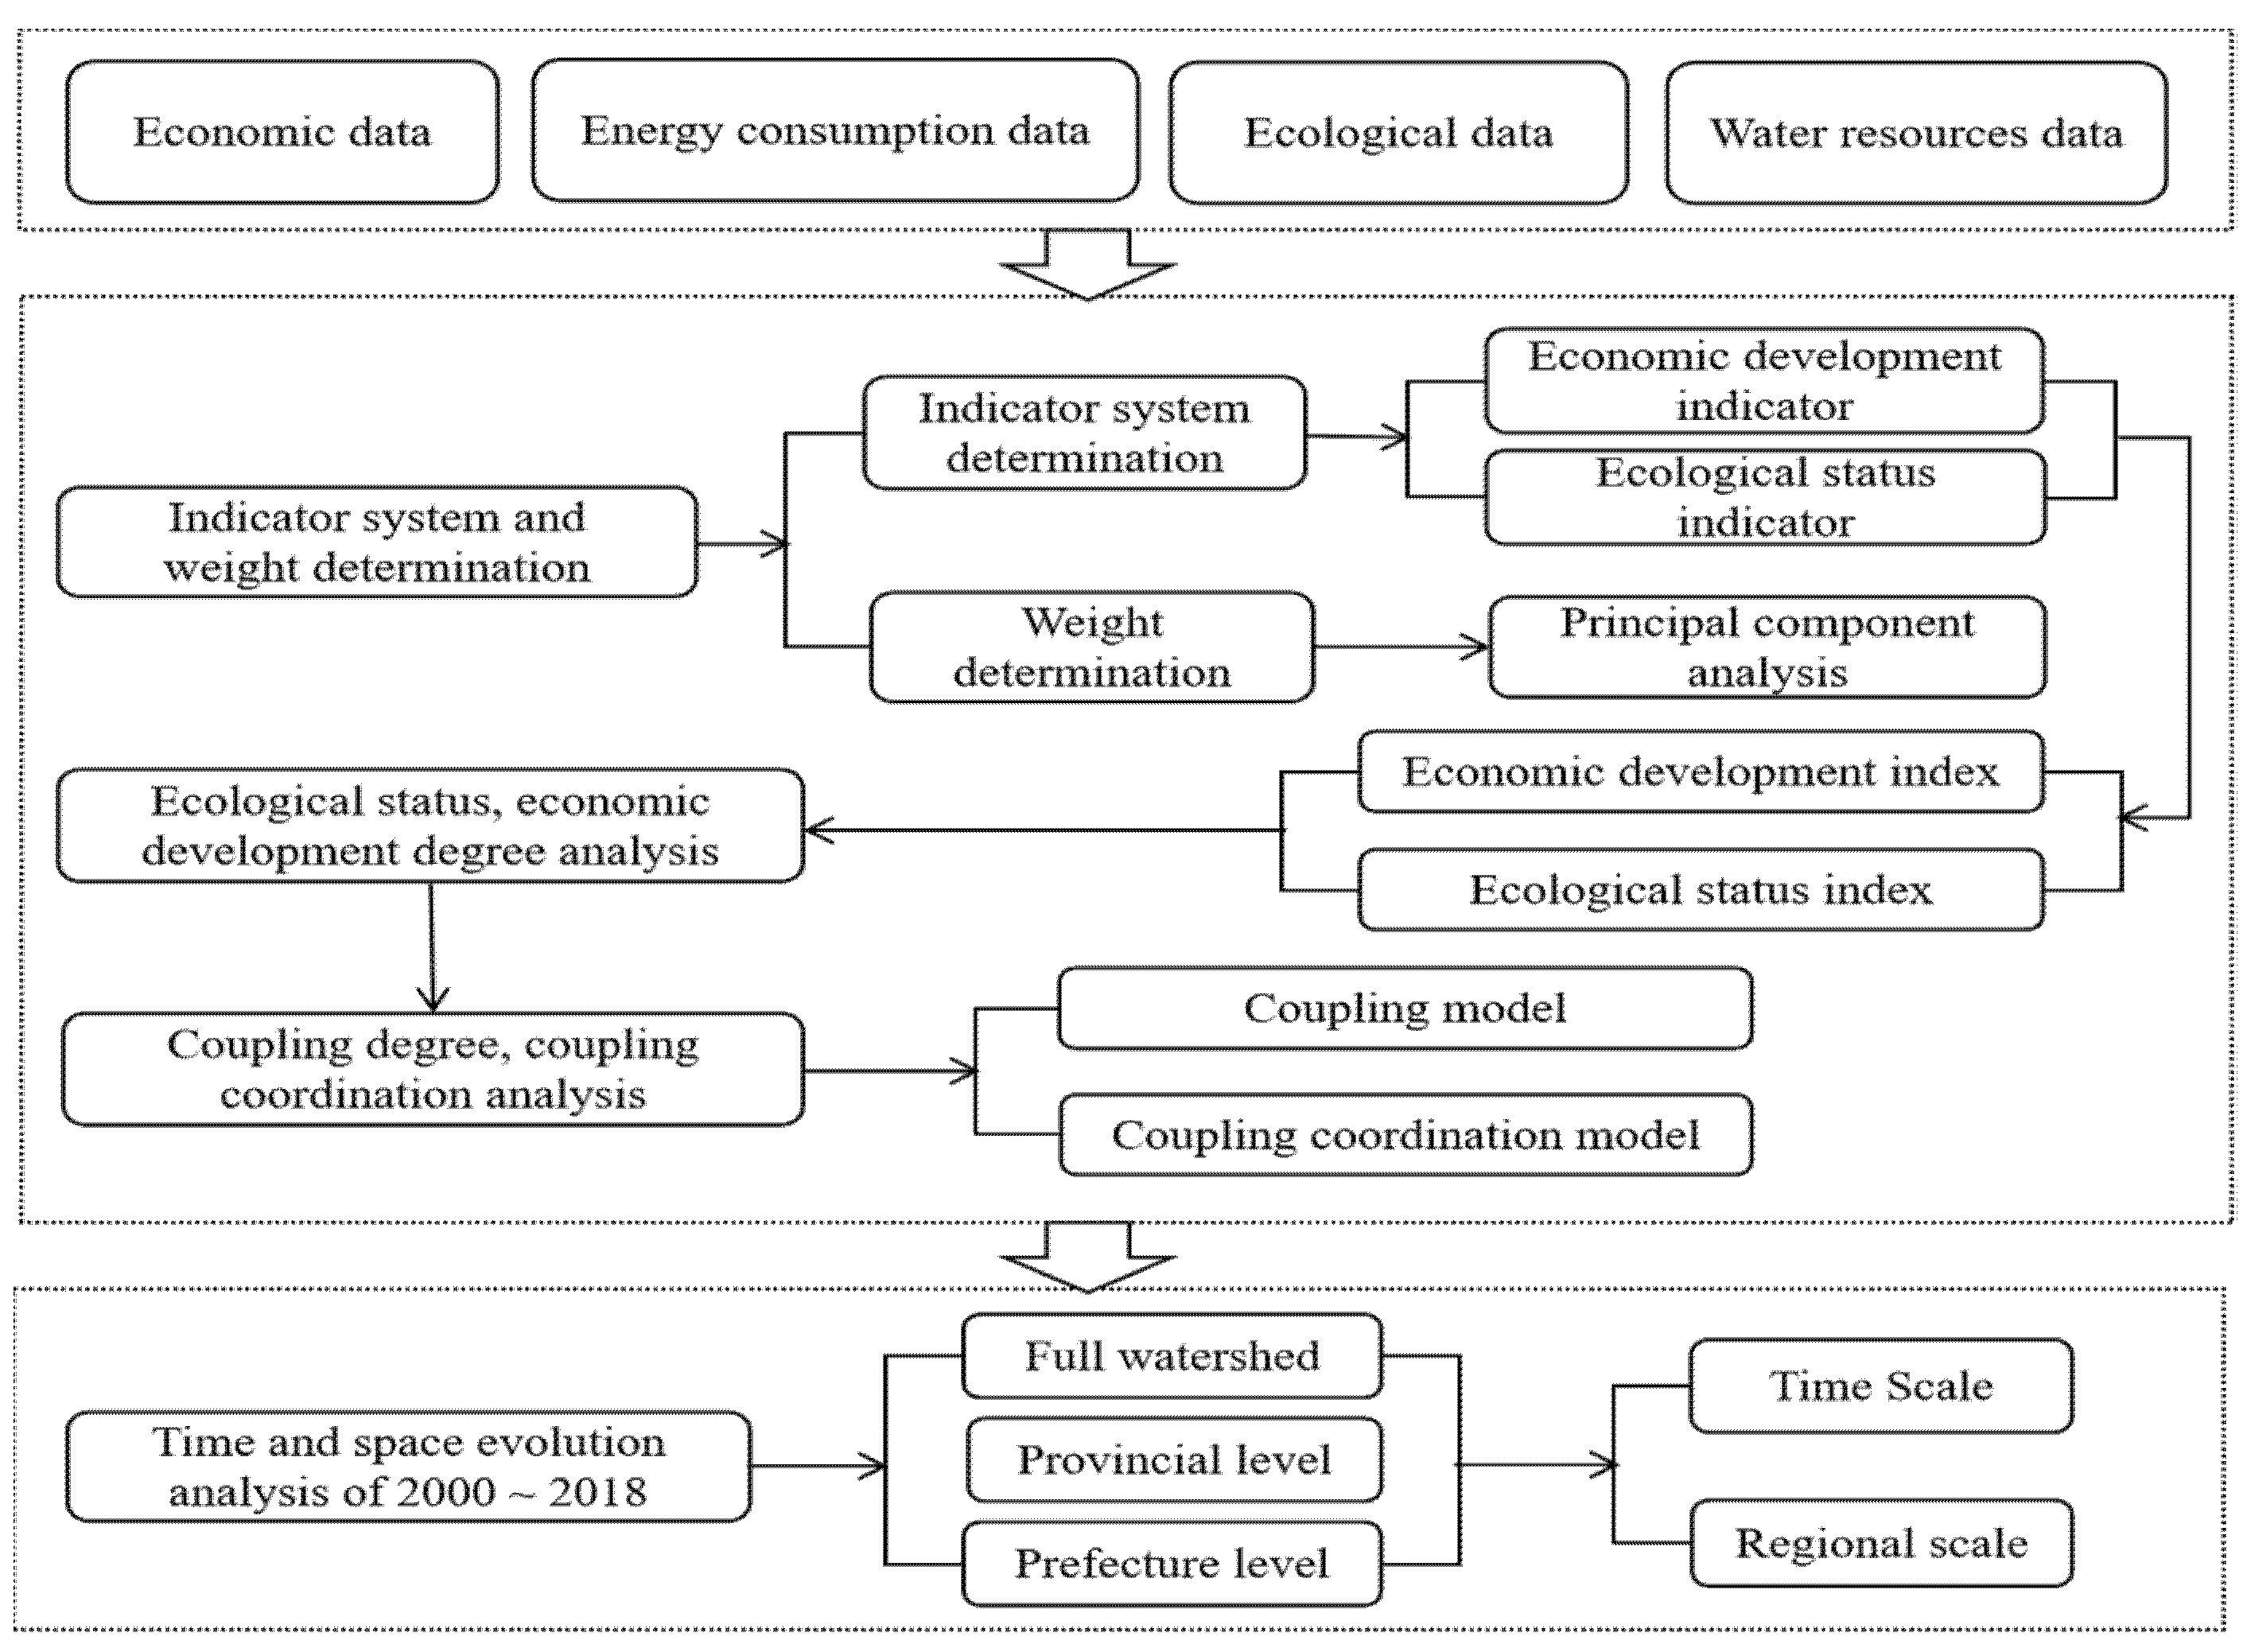
2.3.1. Economic and Ecological Status Coupling Assessment Ideas
2.3.2. Index Selection and Weight Calculation
Indicator Selection
Index Weight Calculation
- (1)
- Data standardization
- (2)
- Weight calculation
2.3.3. Evaluation of Economic Development and Ecological Conditions
2.3.4. Evaluation Method of Coupling Coordination Degree
- (1)
- Economic Development Index:
- (2)
- Ecological Status Index:
- (3)
- Coupling degree calculation
- (4)
- Coupling coordination degree calculation
3. Result
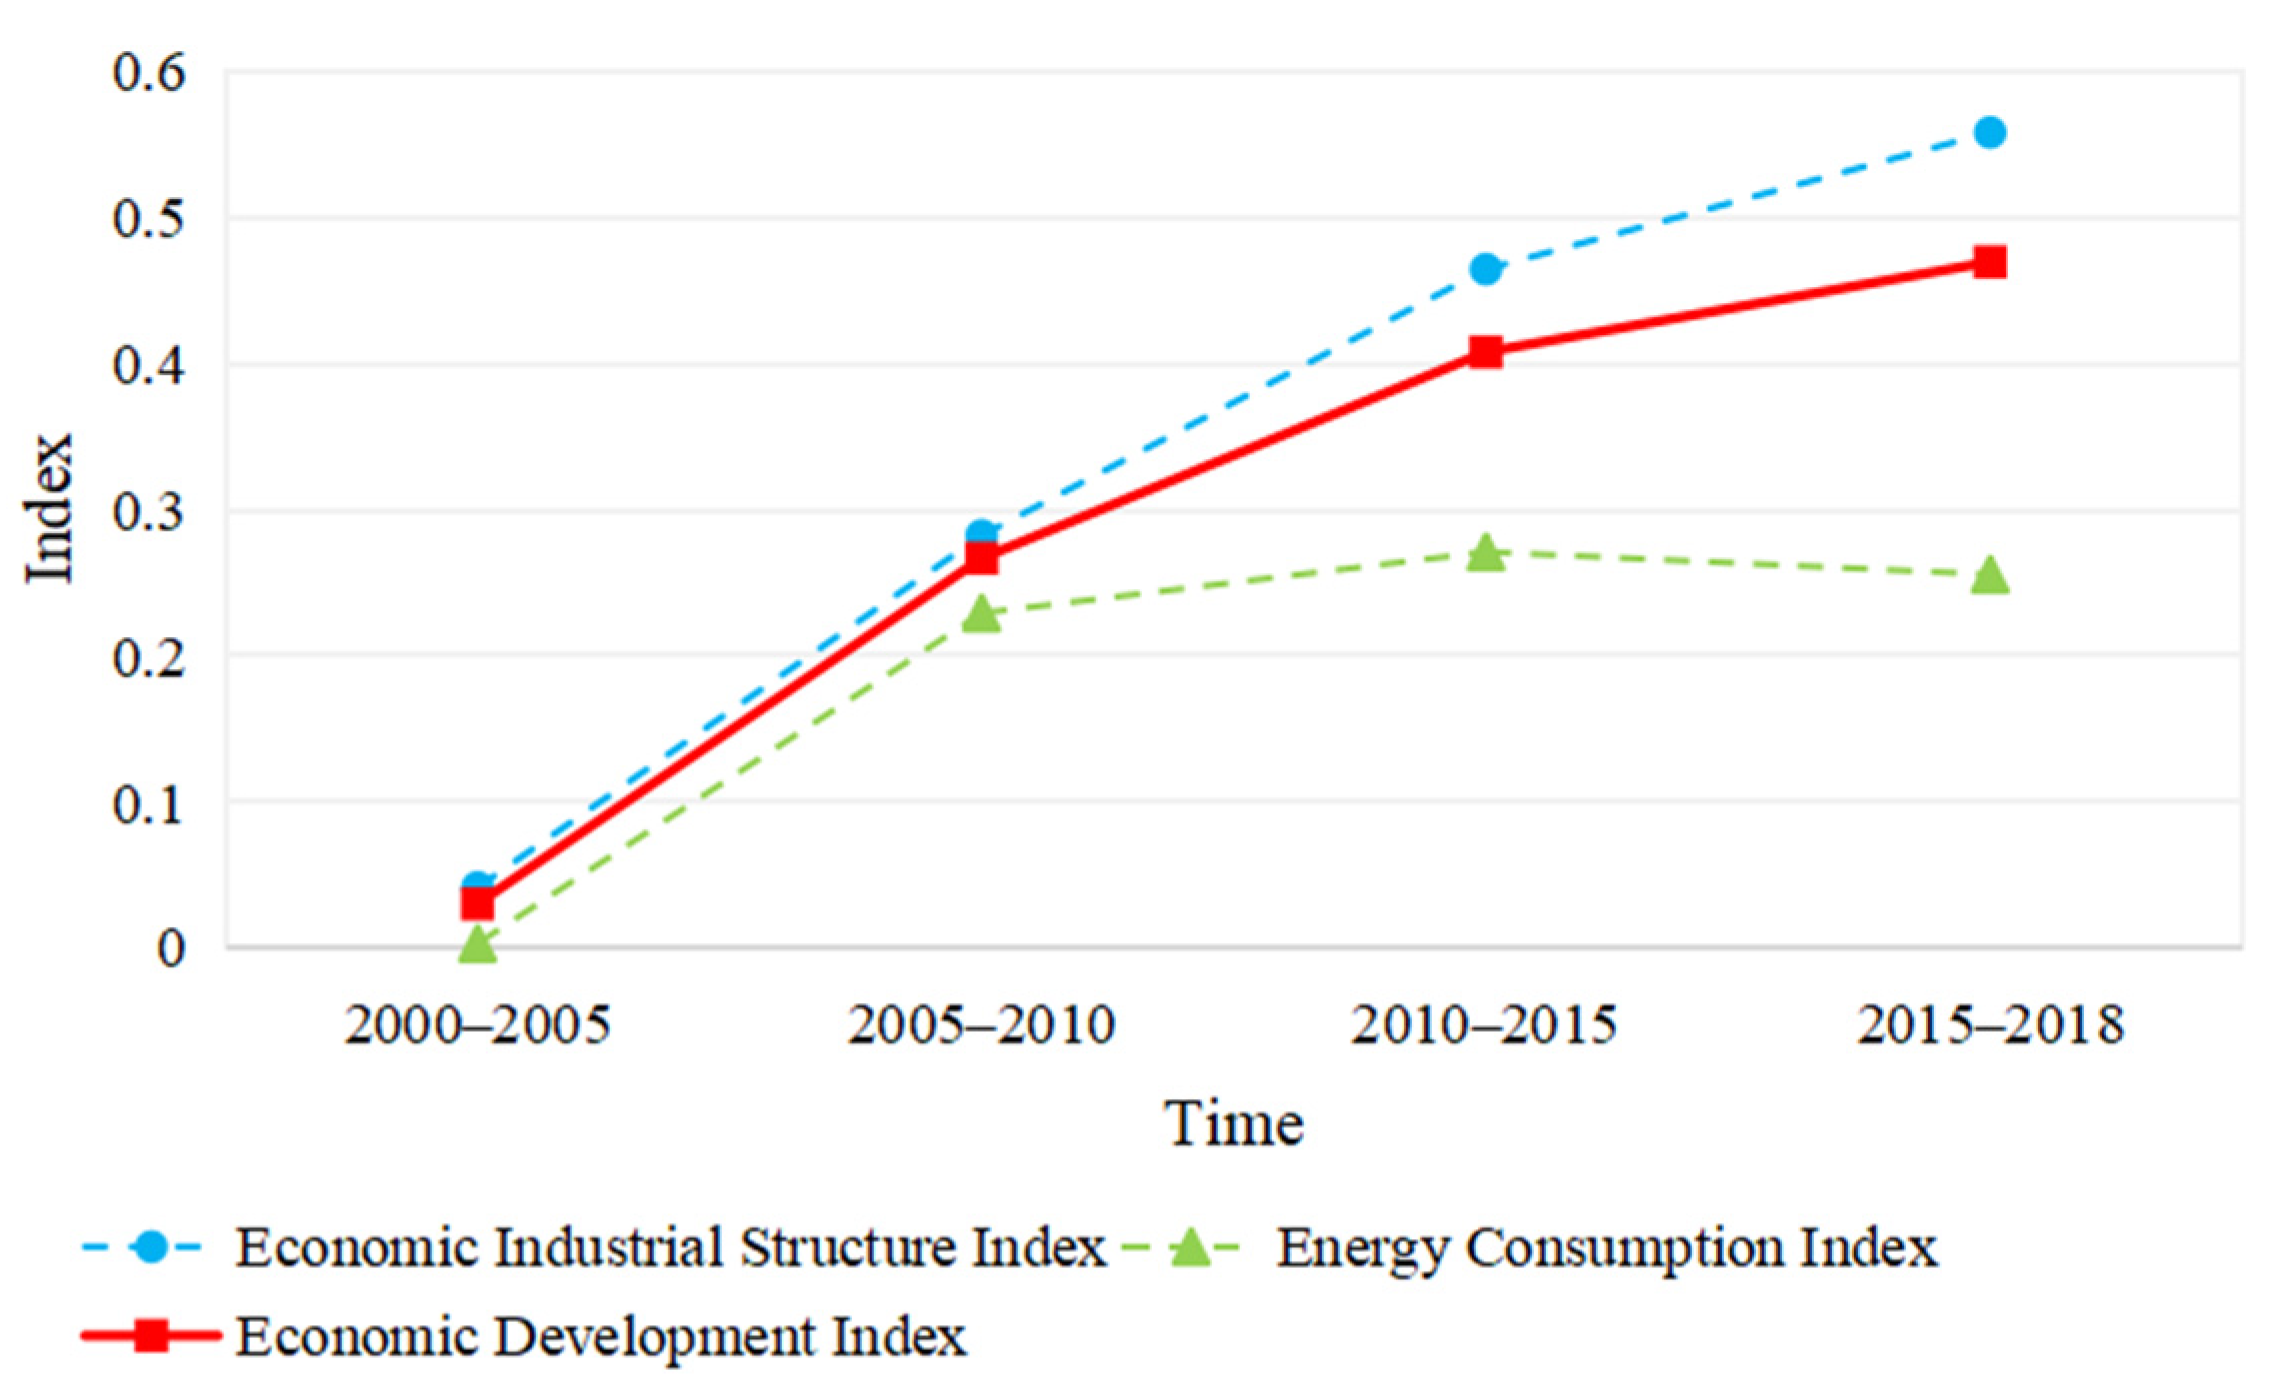
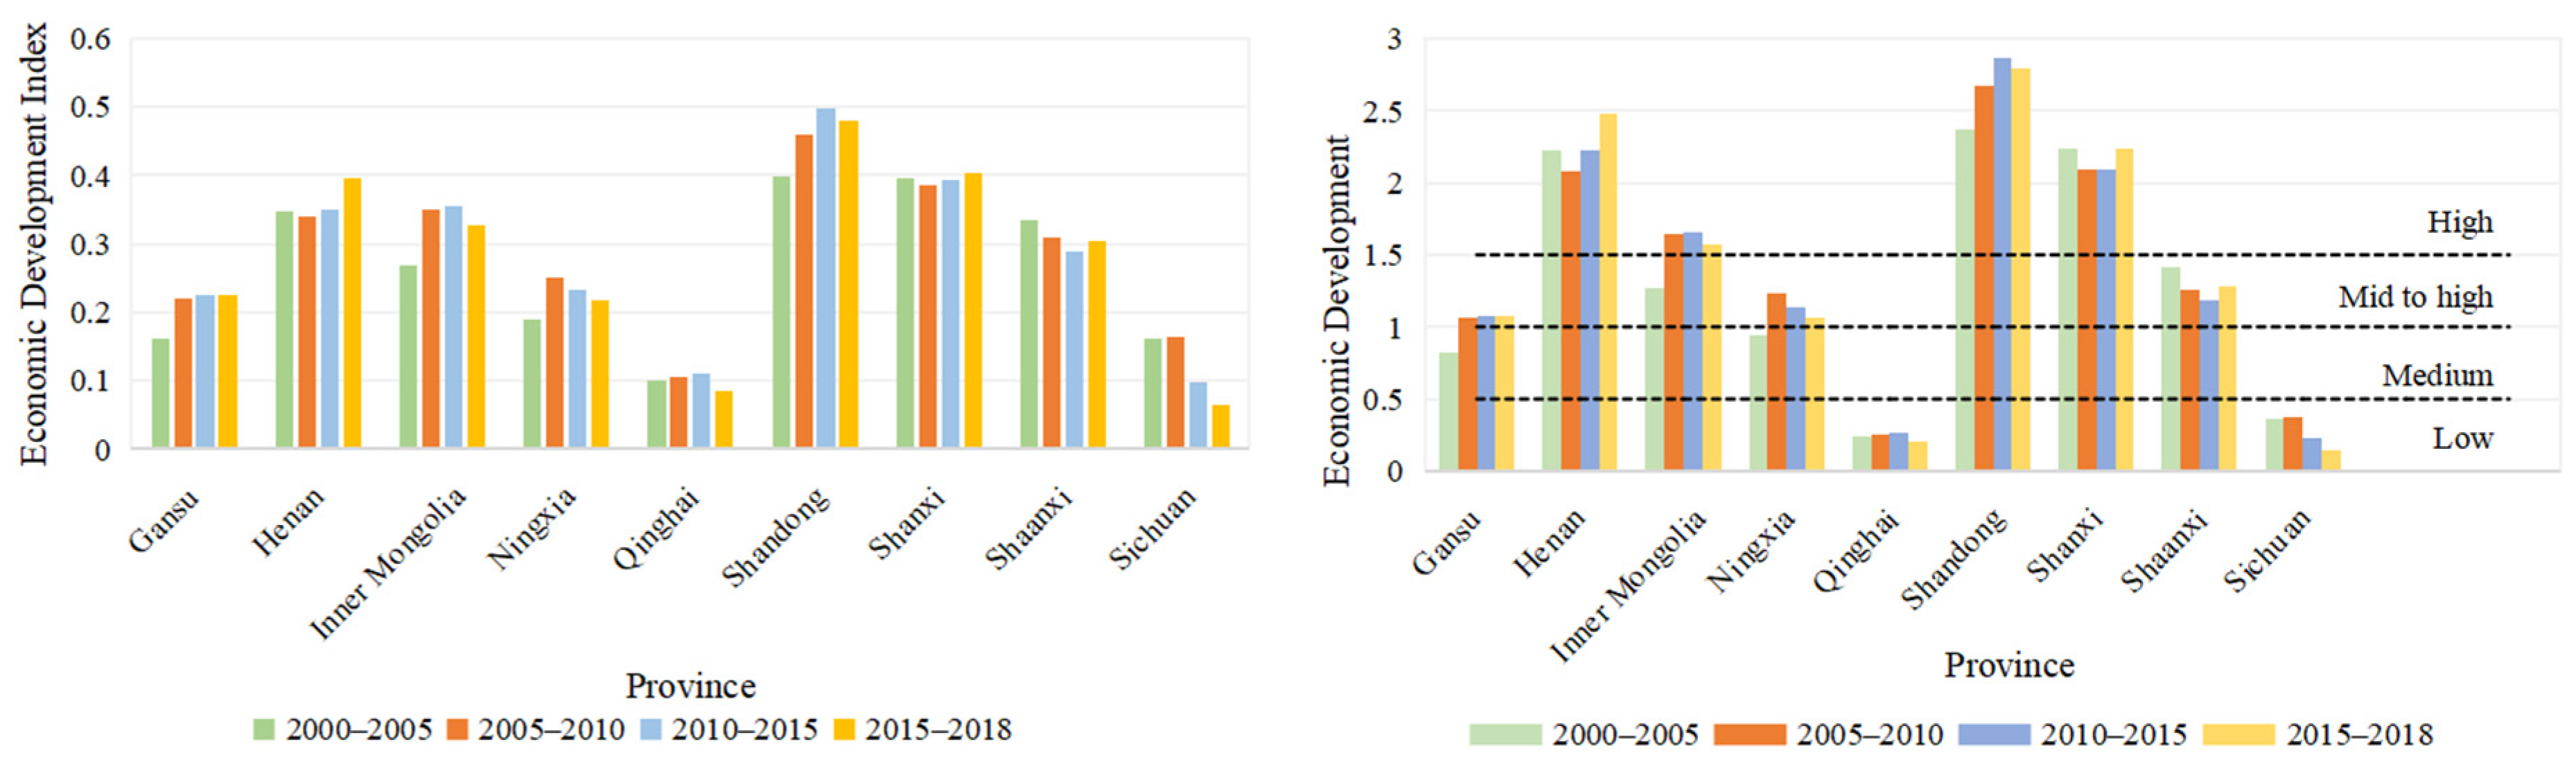
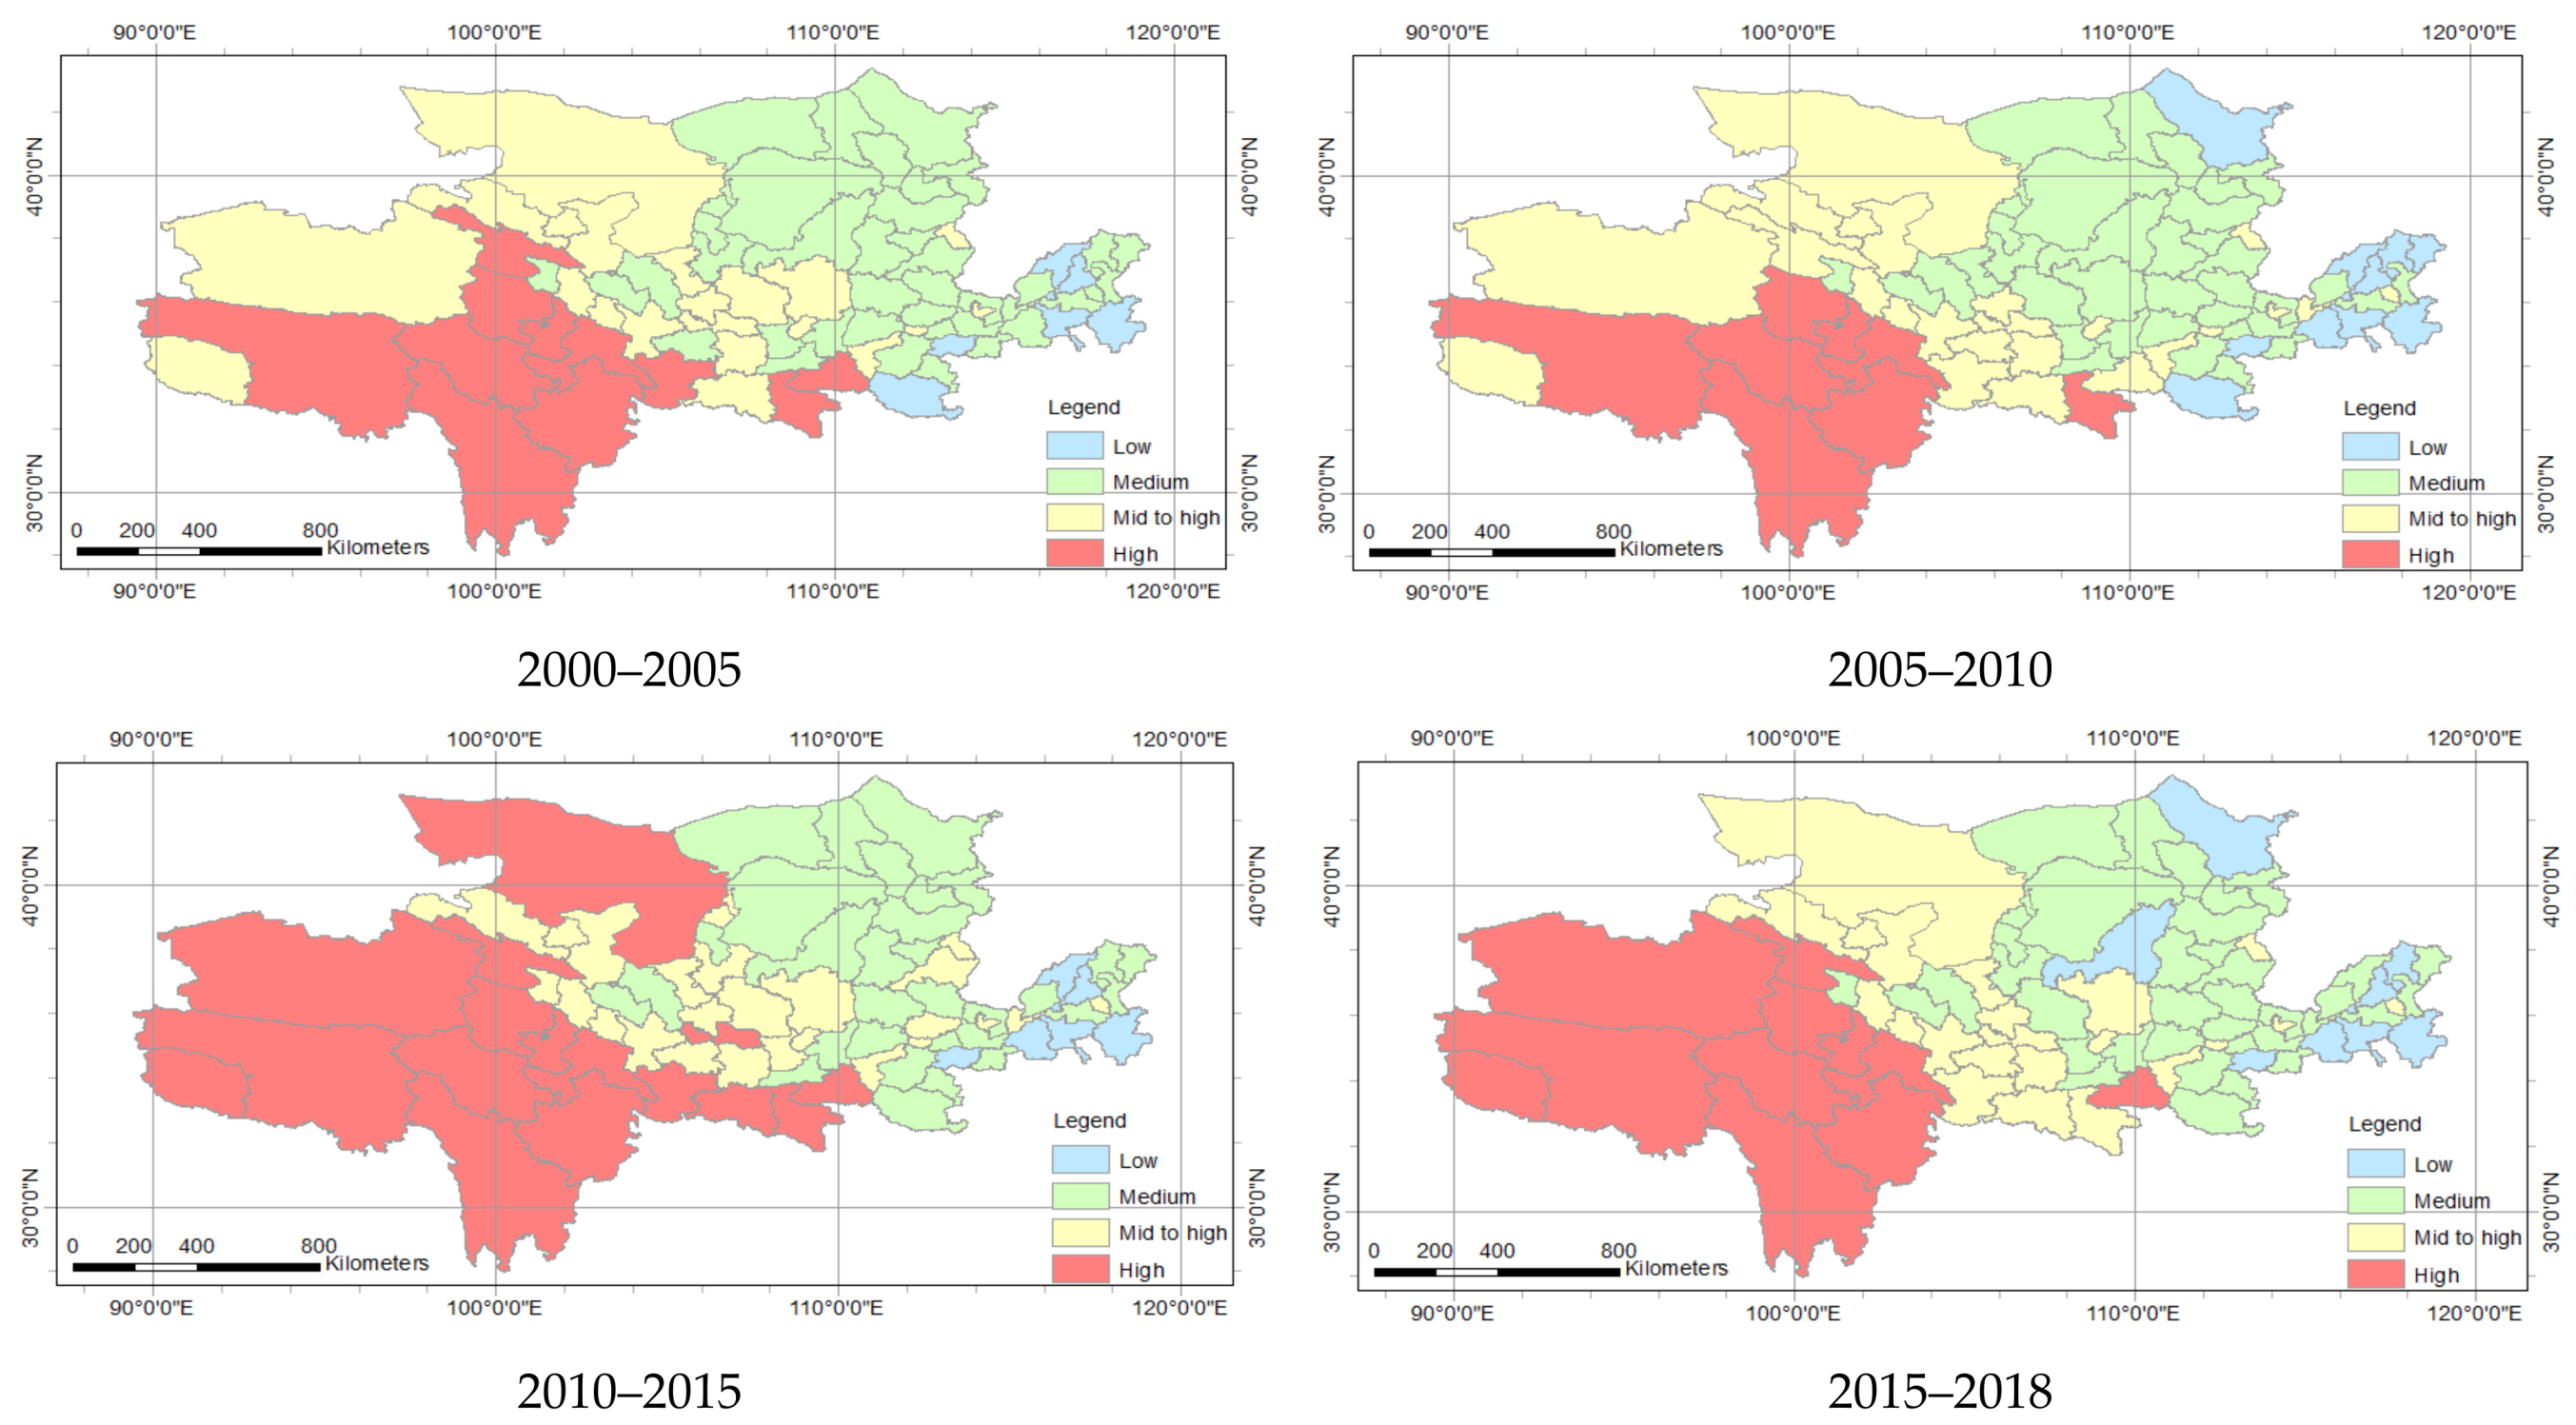
3.1. Temporal and Spatial Changes in the Economic Development of the Yellow River Basin
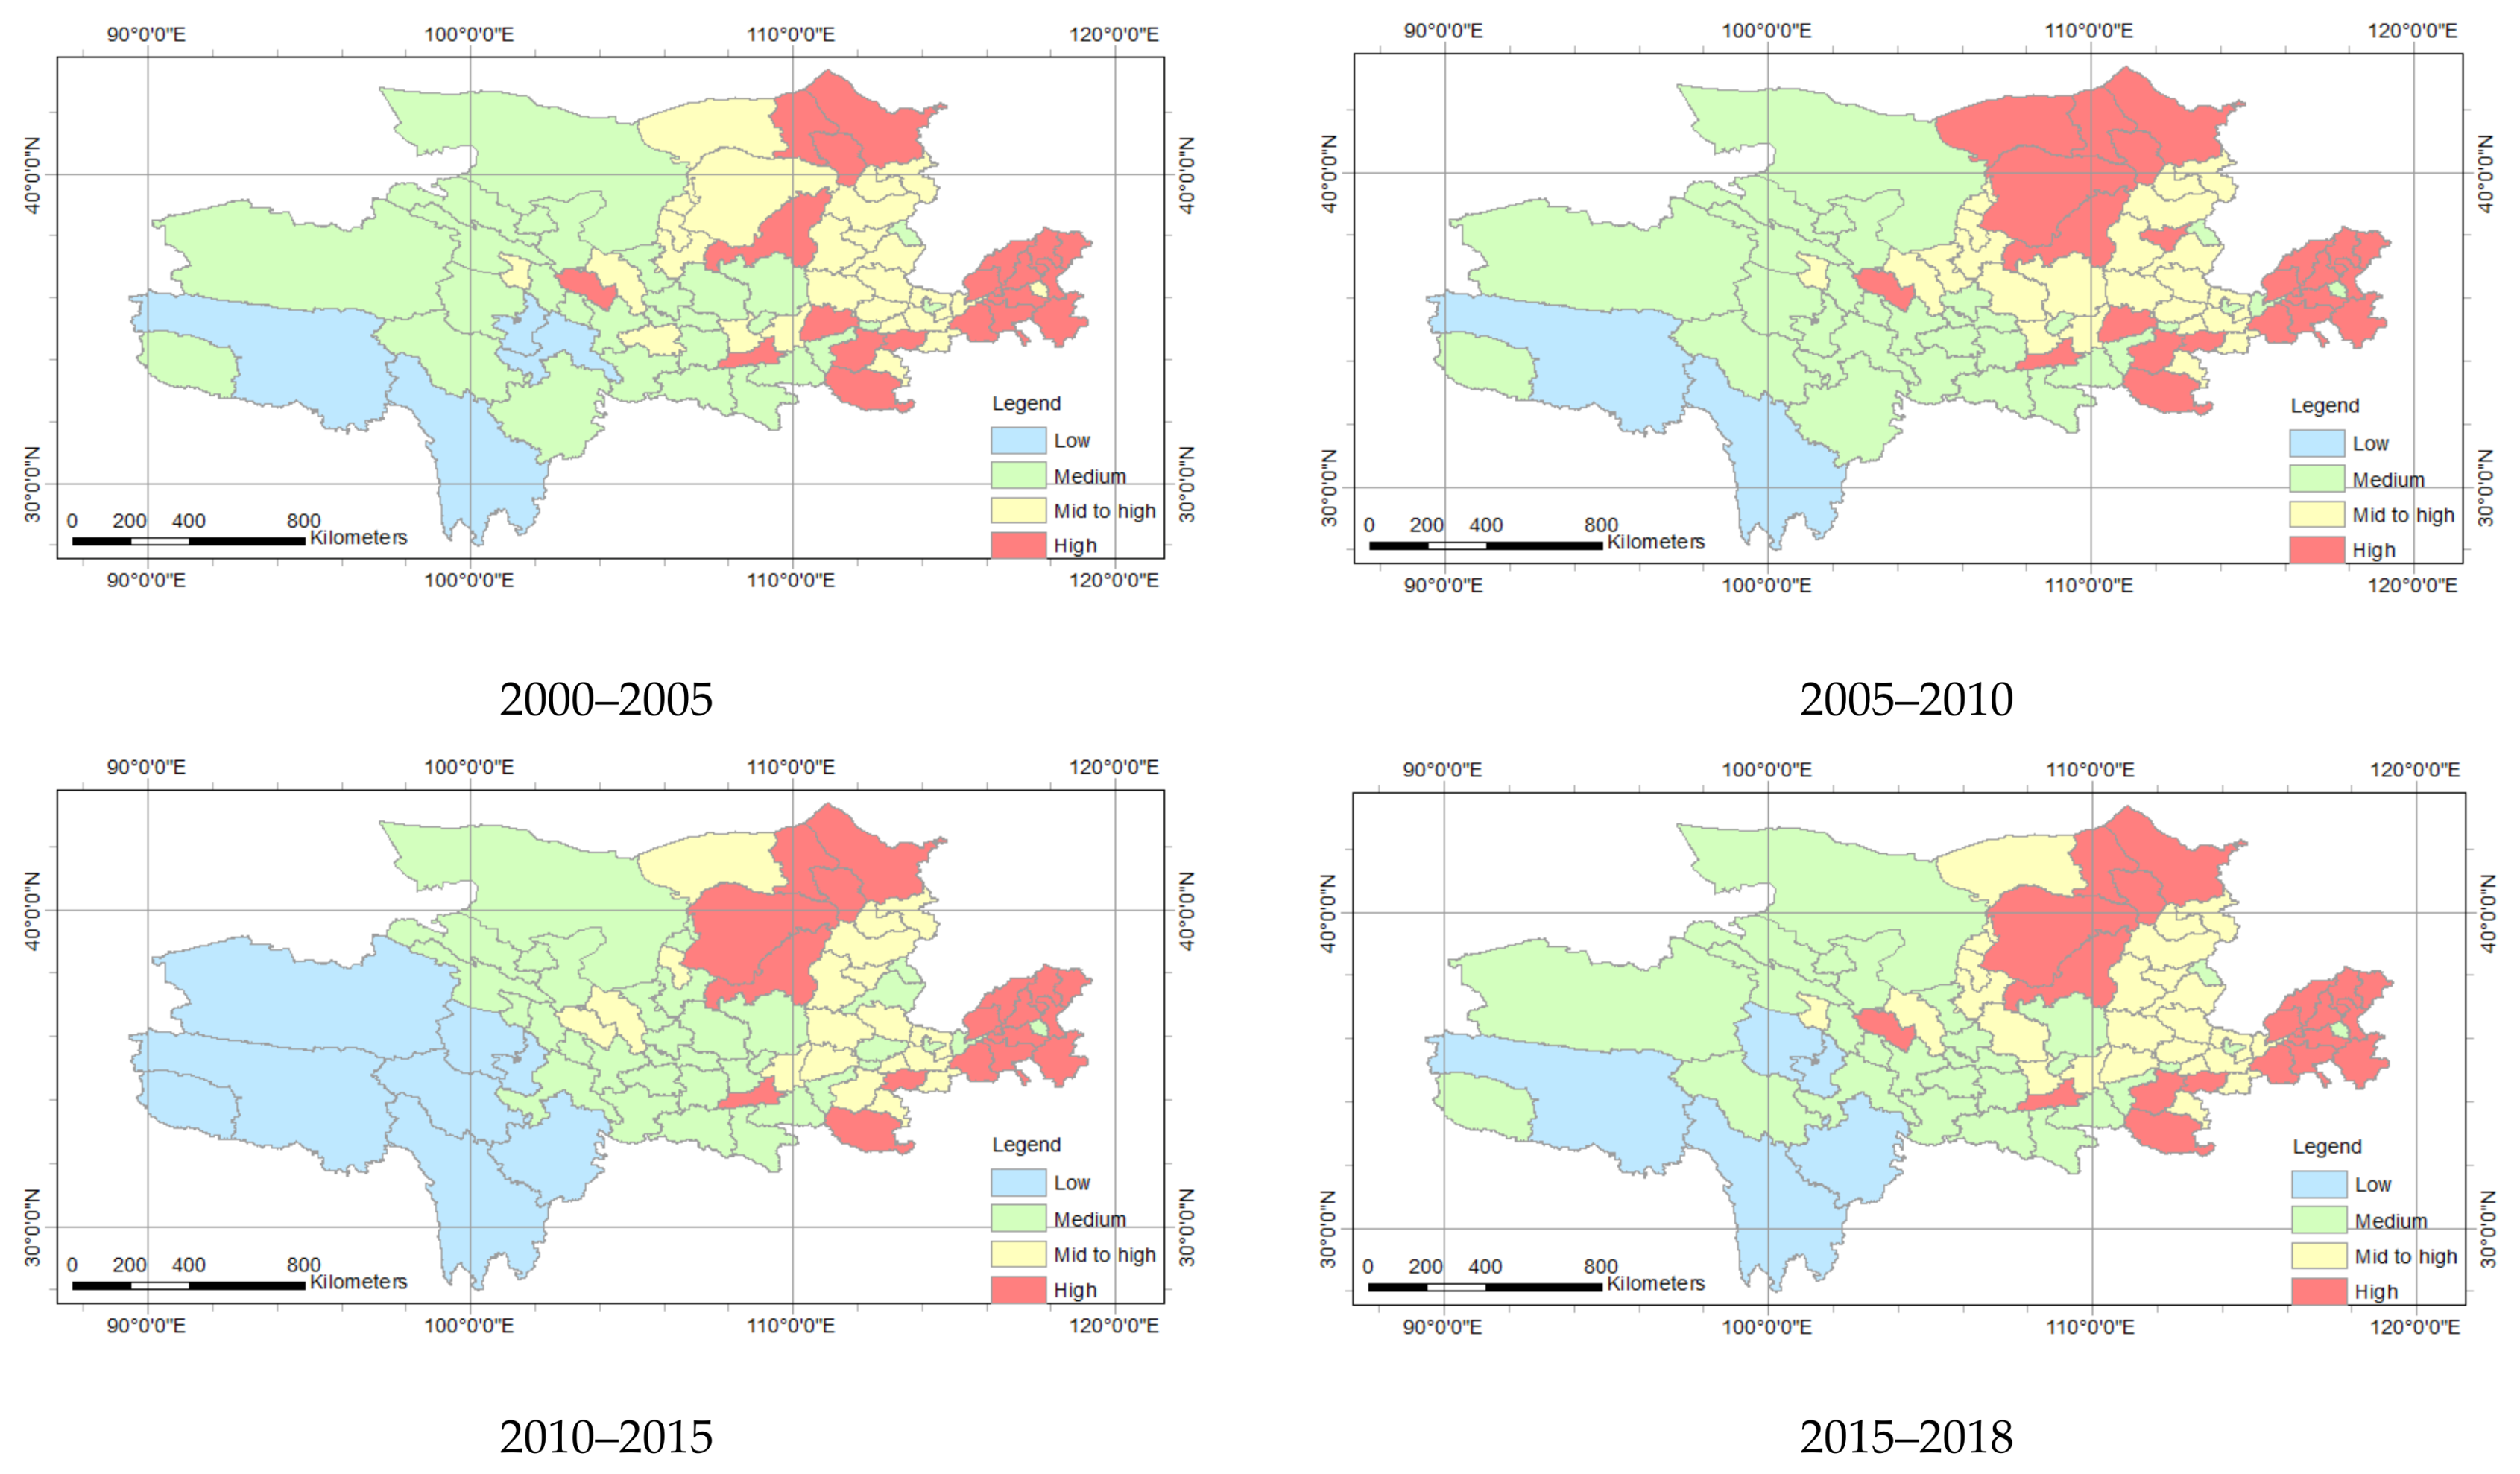
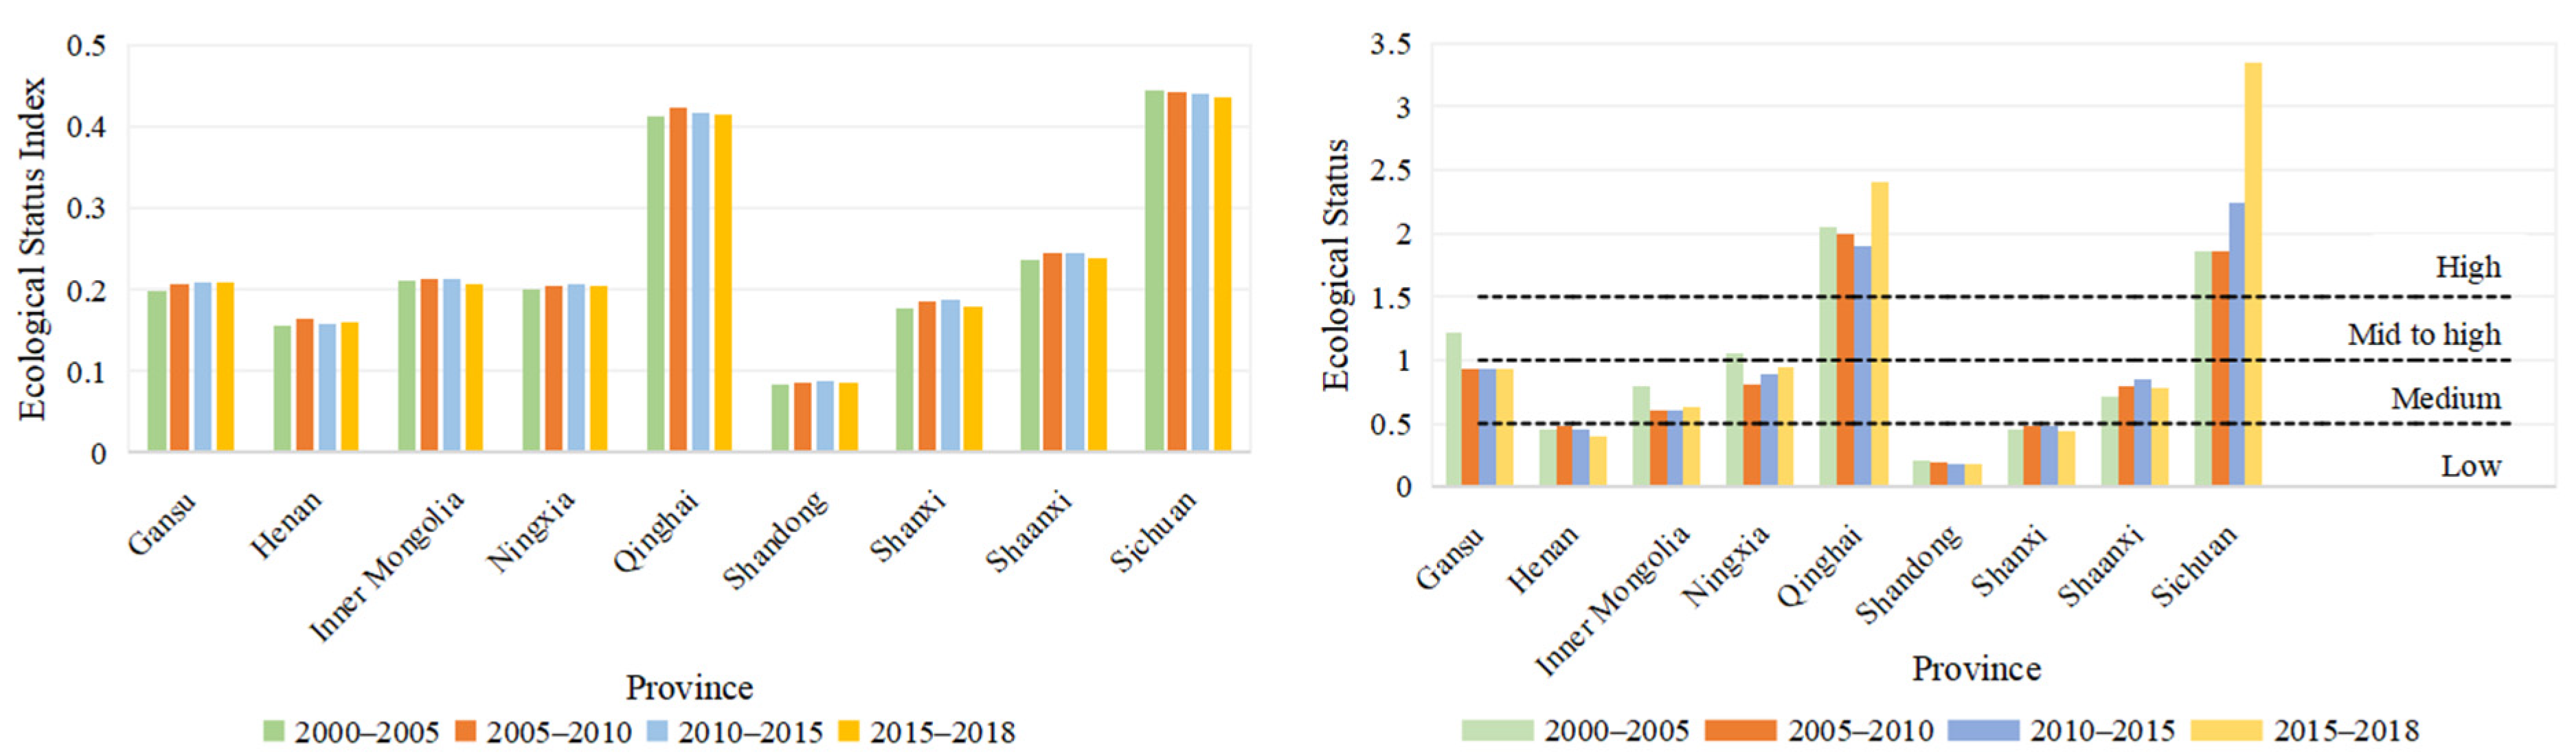
3.2. Temporal and Spatial Changes in the Yellow River Basin’s Ecological Status
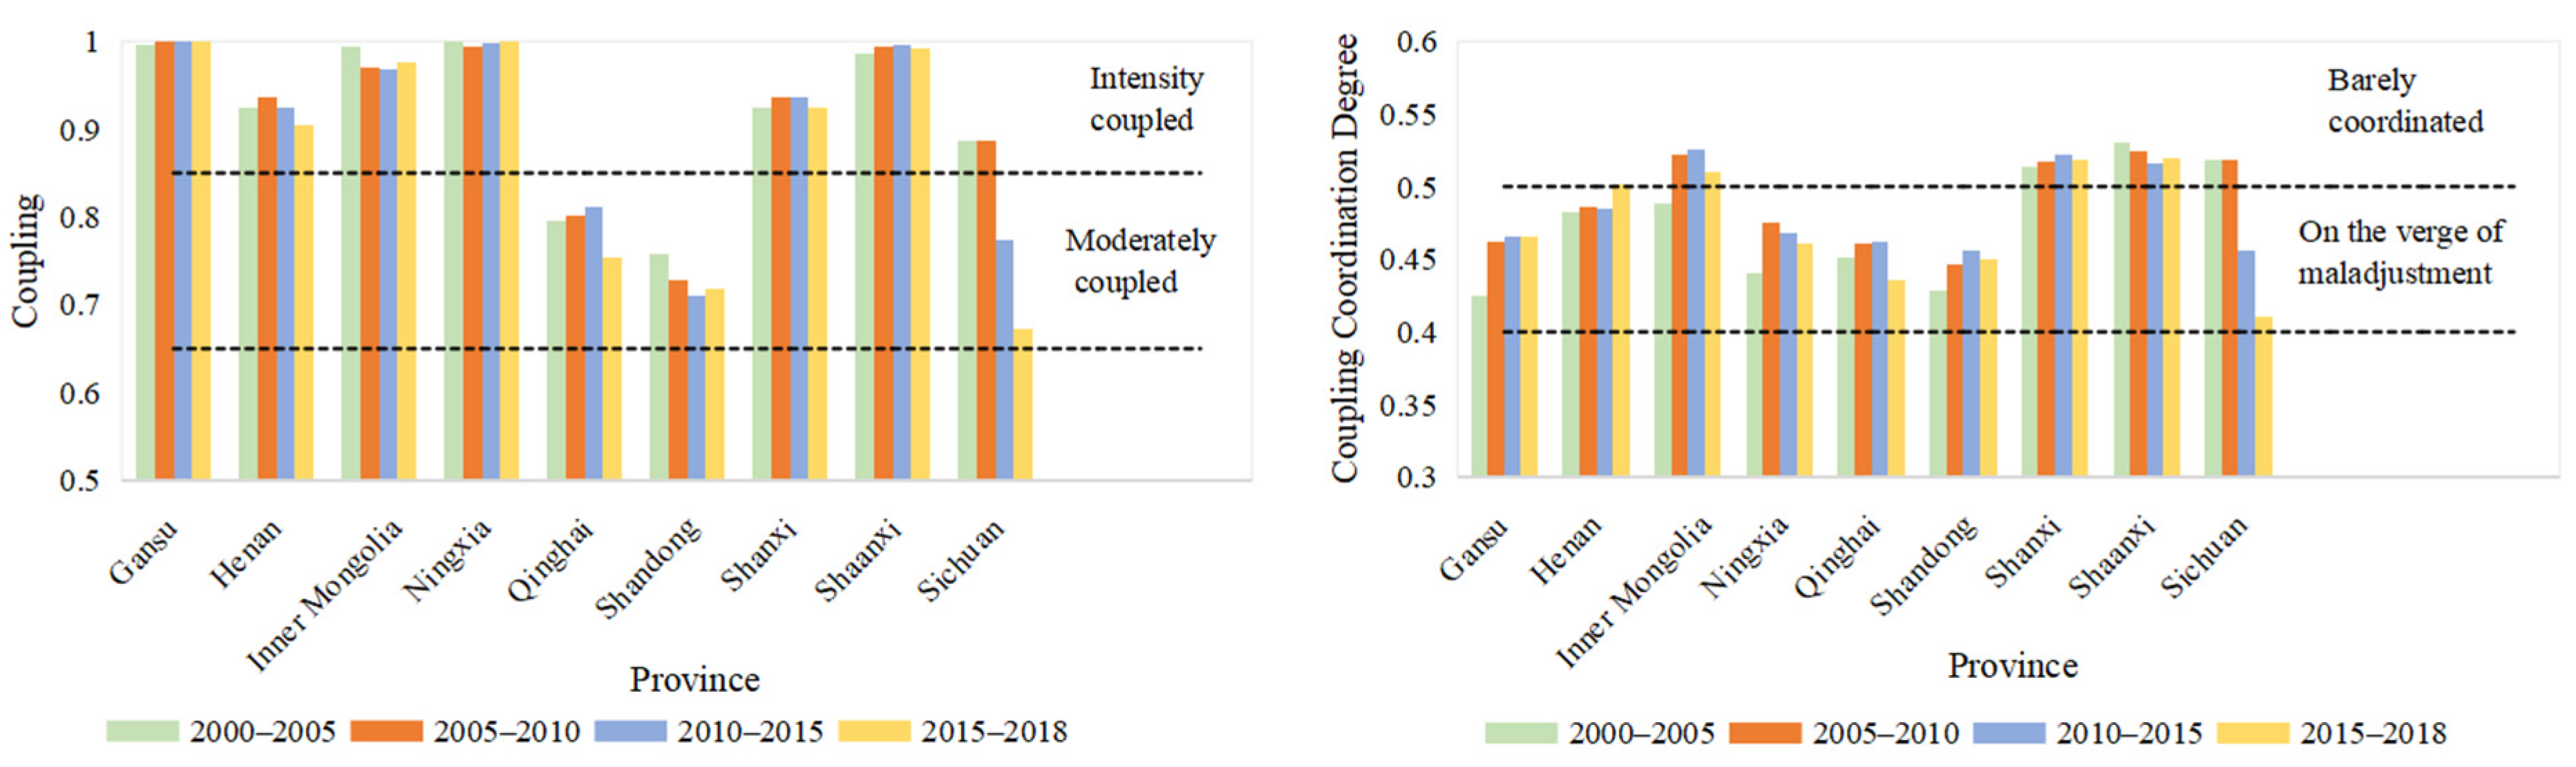
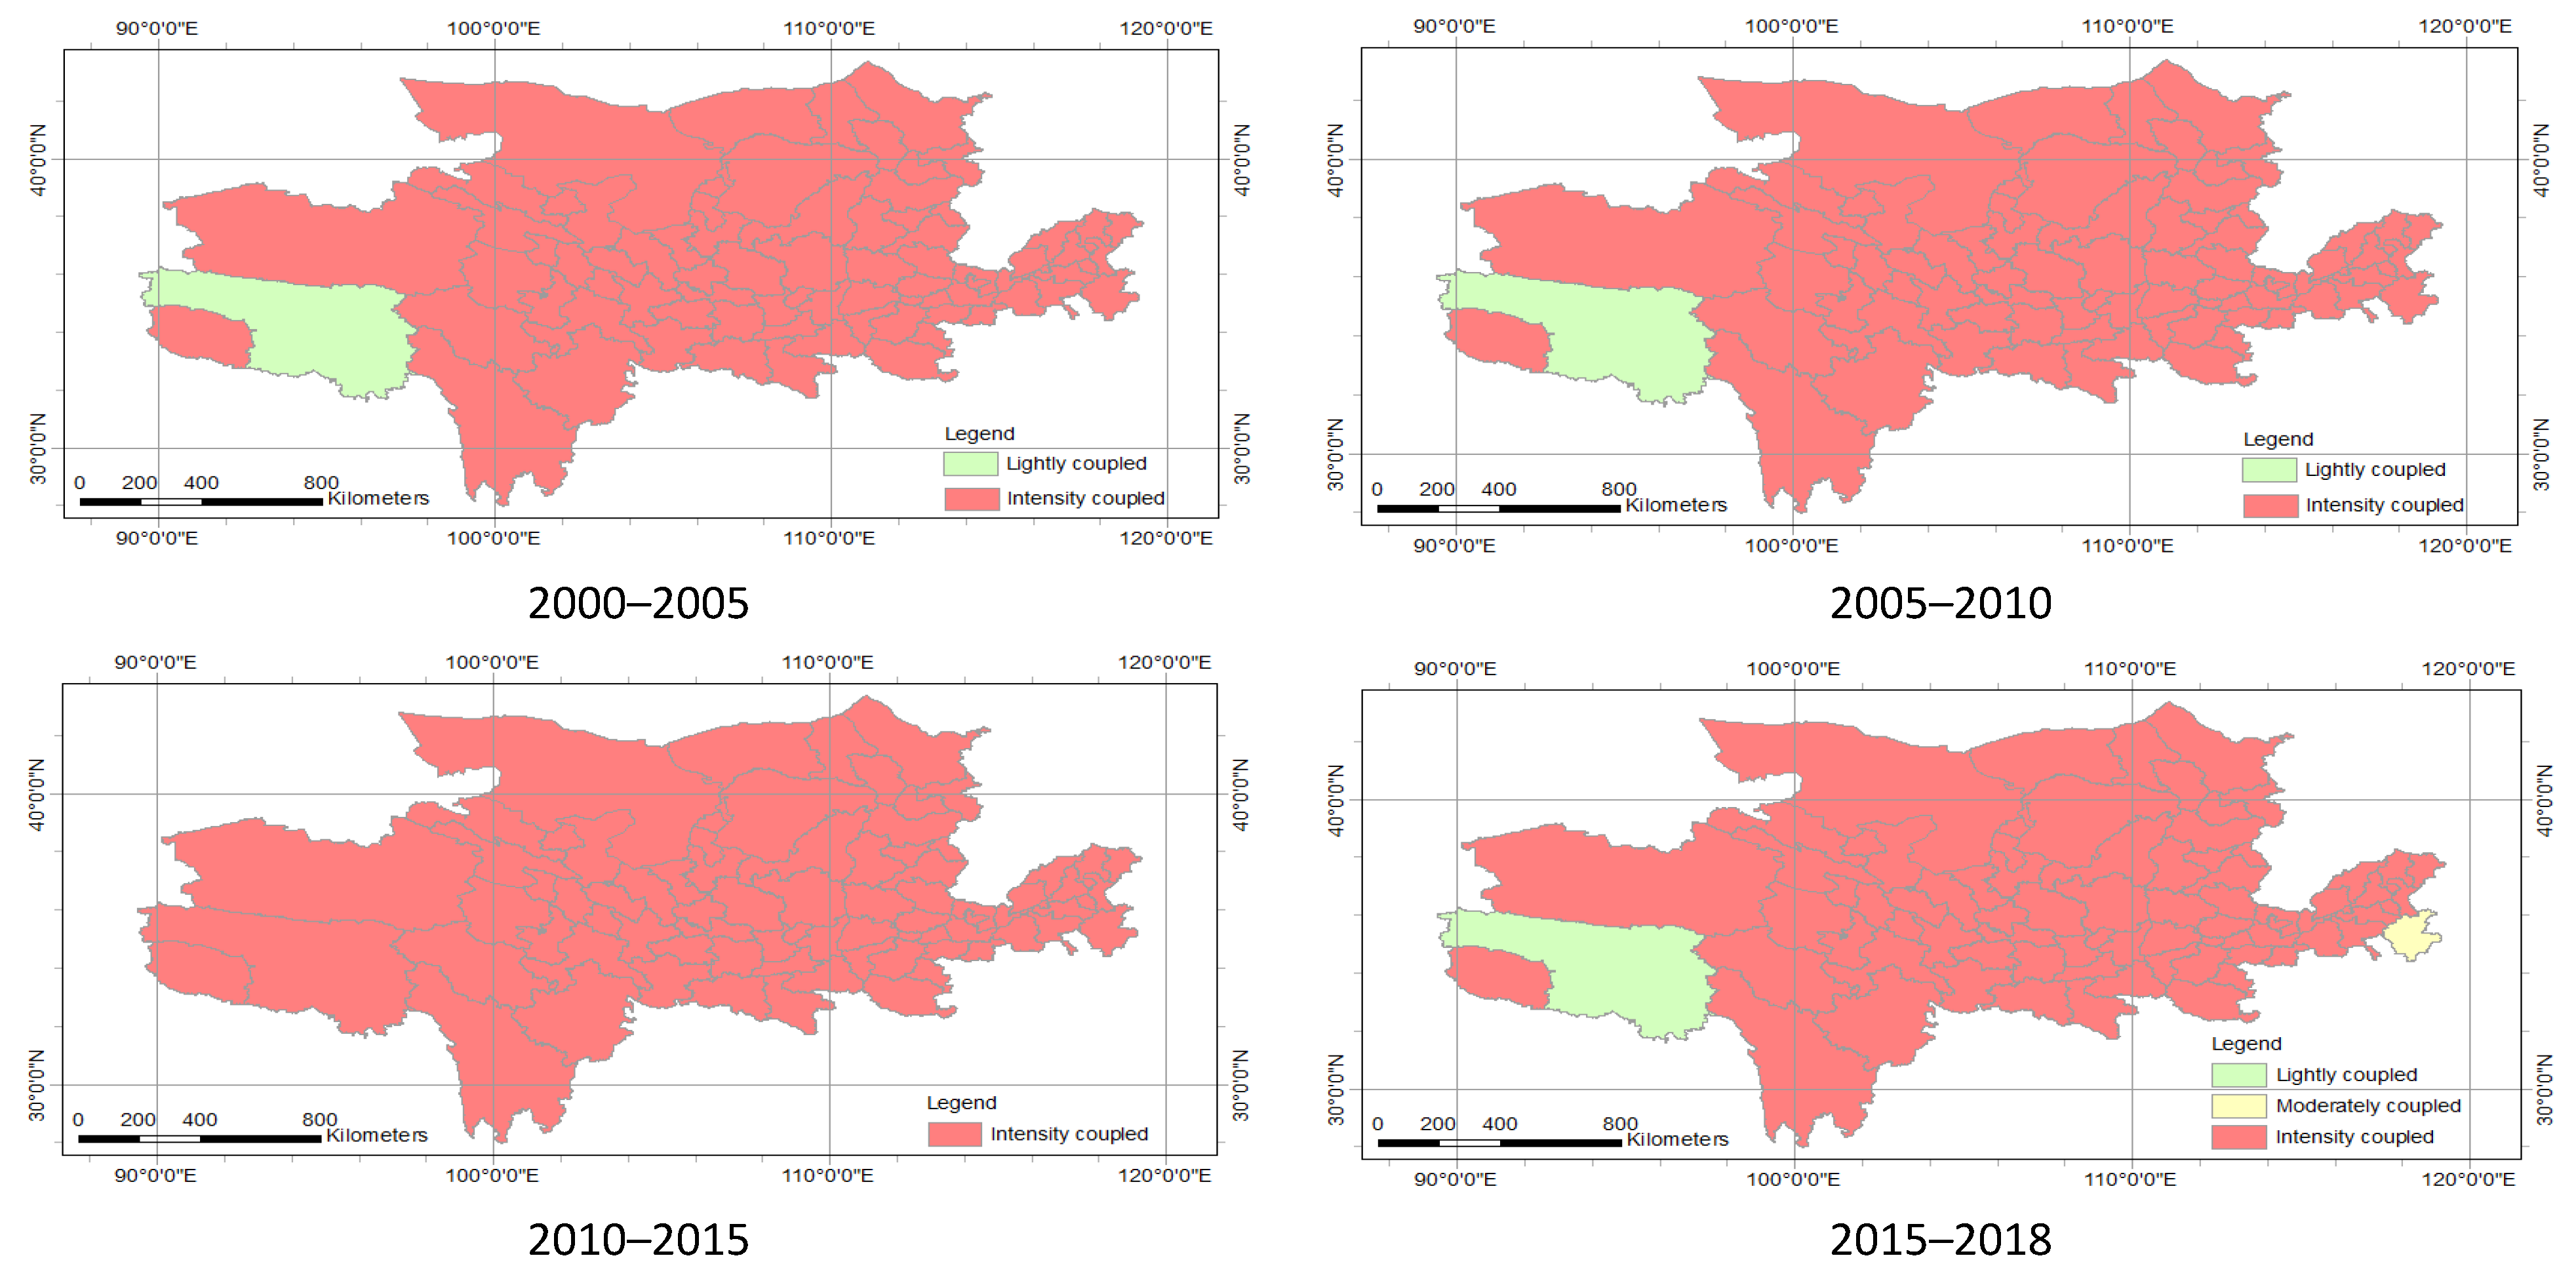
3.3. Economic Development and Ecological Status Coupling Time and Space Change
4. Discussion
4.1. Differences at Various Scales
4.2. Economic and Ecological Development
4.3. Experimental Design-Related Issues and Defects
5. Conclusions
- (1)
- The economic composition index and the economic development index have showed an upward trend, but the energy consumption index showed a slight downward trend in 2015–2018. This shows that the dependence of future economic development on basic energy consumption is gradually reduced. The economic index rose at an accelerated rate, indicating that the level of economic development and constant improvements, which further promoted the coupling of the economy and ecology.
- (2)
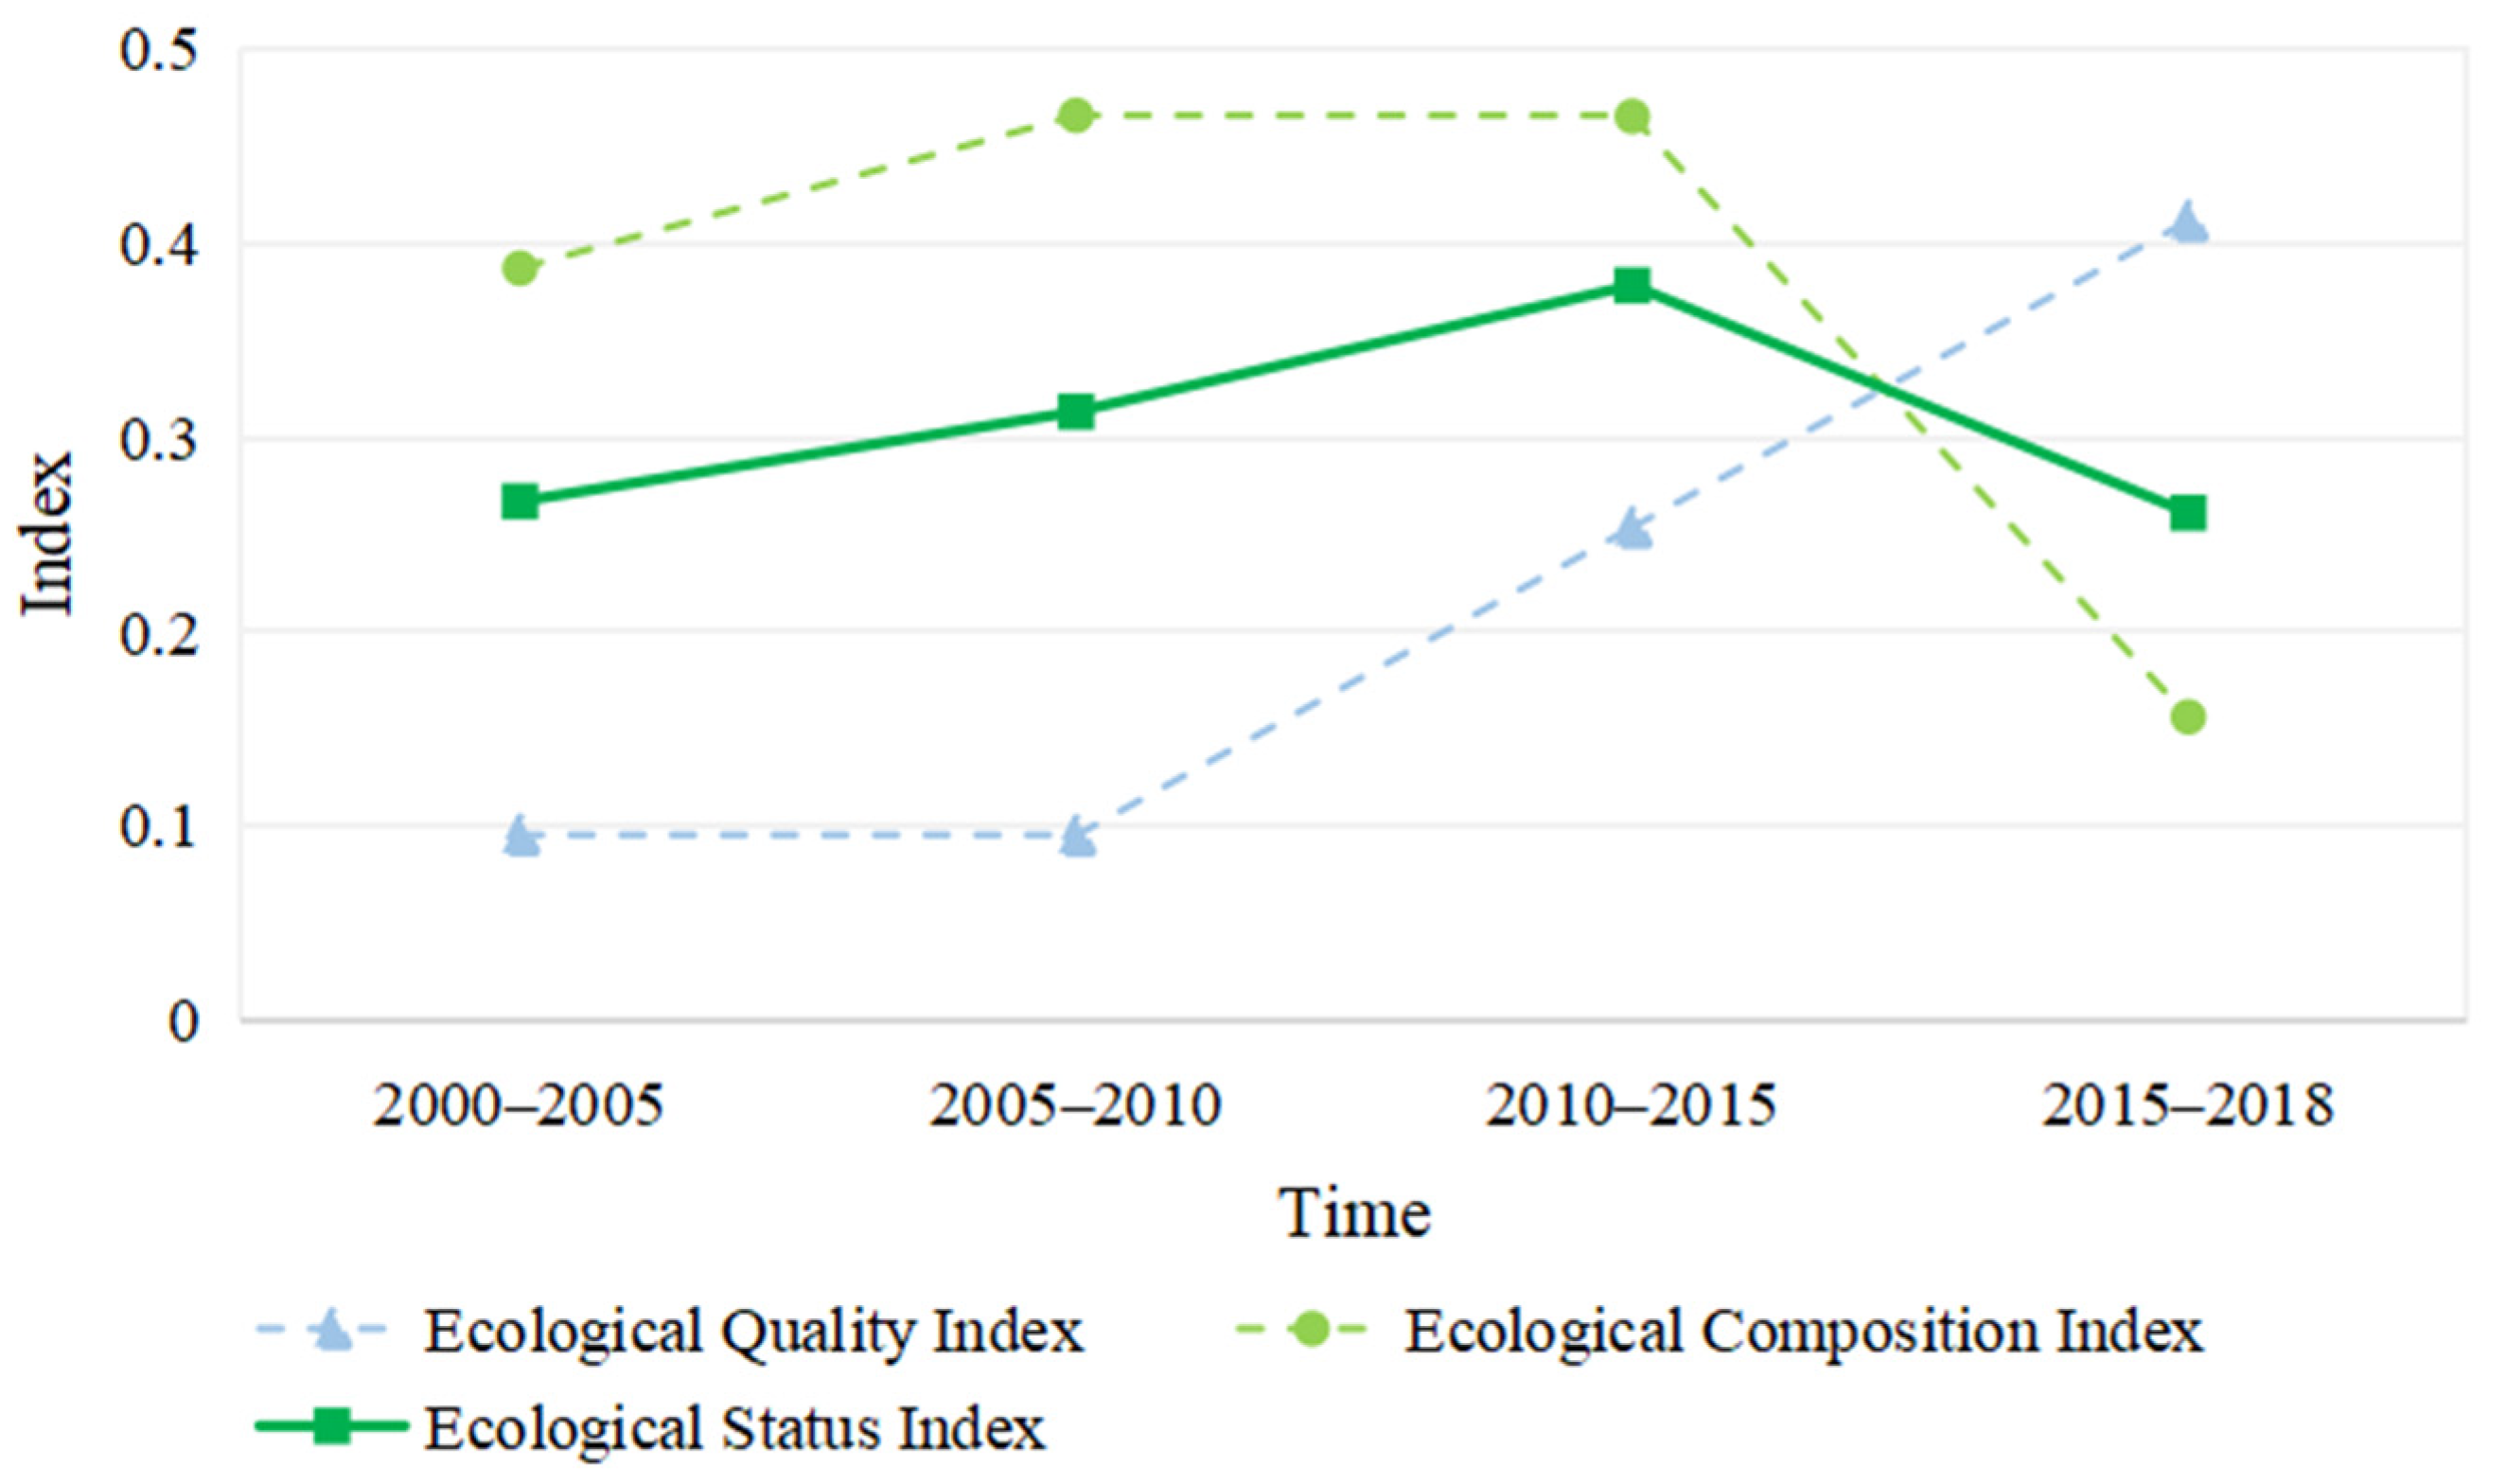
- The ecological quality index has continued to rise since 2010, while the ecological state index and ecological composition index showed a downward trend in 2010–2018. It is indicated that ecological quality has continued to improve, but ecological composition still plays a leading role in evaluating the ecological state.
- (3)
- As far as the evaluation of the level of economic development and ecological conditions is concerned, the level of economic development is low in the west and high in the east; the level of ecological conditions is high in the west and low in the east. This shows that there are significant regional differences in economic development and ecological status grading.
- (4)
- During 2000 to 2018, the economic and ecological coupling state in the Yellow River Basin showed a strong interaction that subsequently slightly weakened. The system of economic development and ecological state have mutually promoted each other.
- (5)
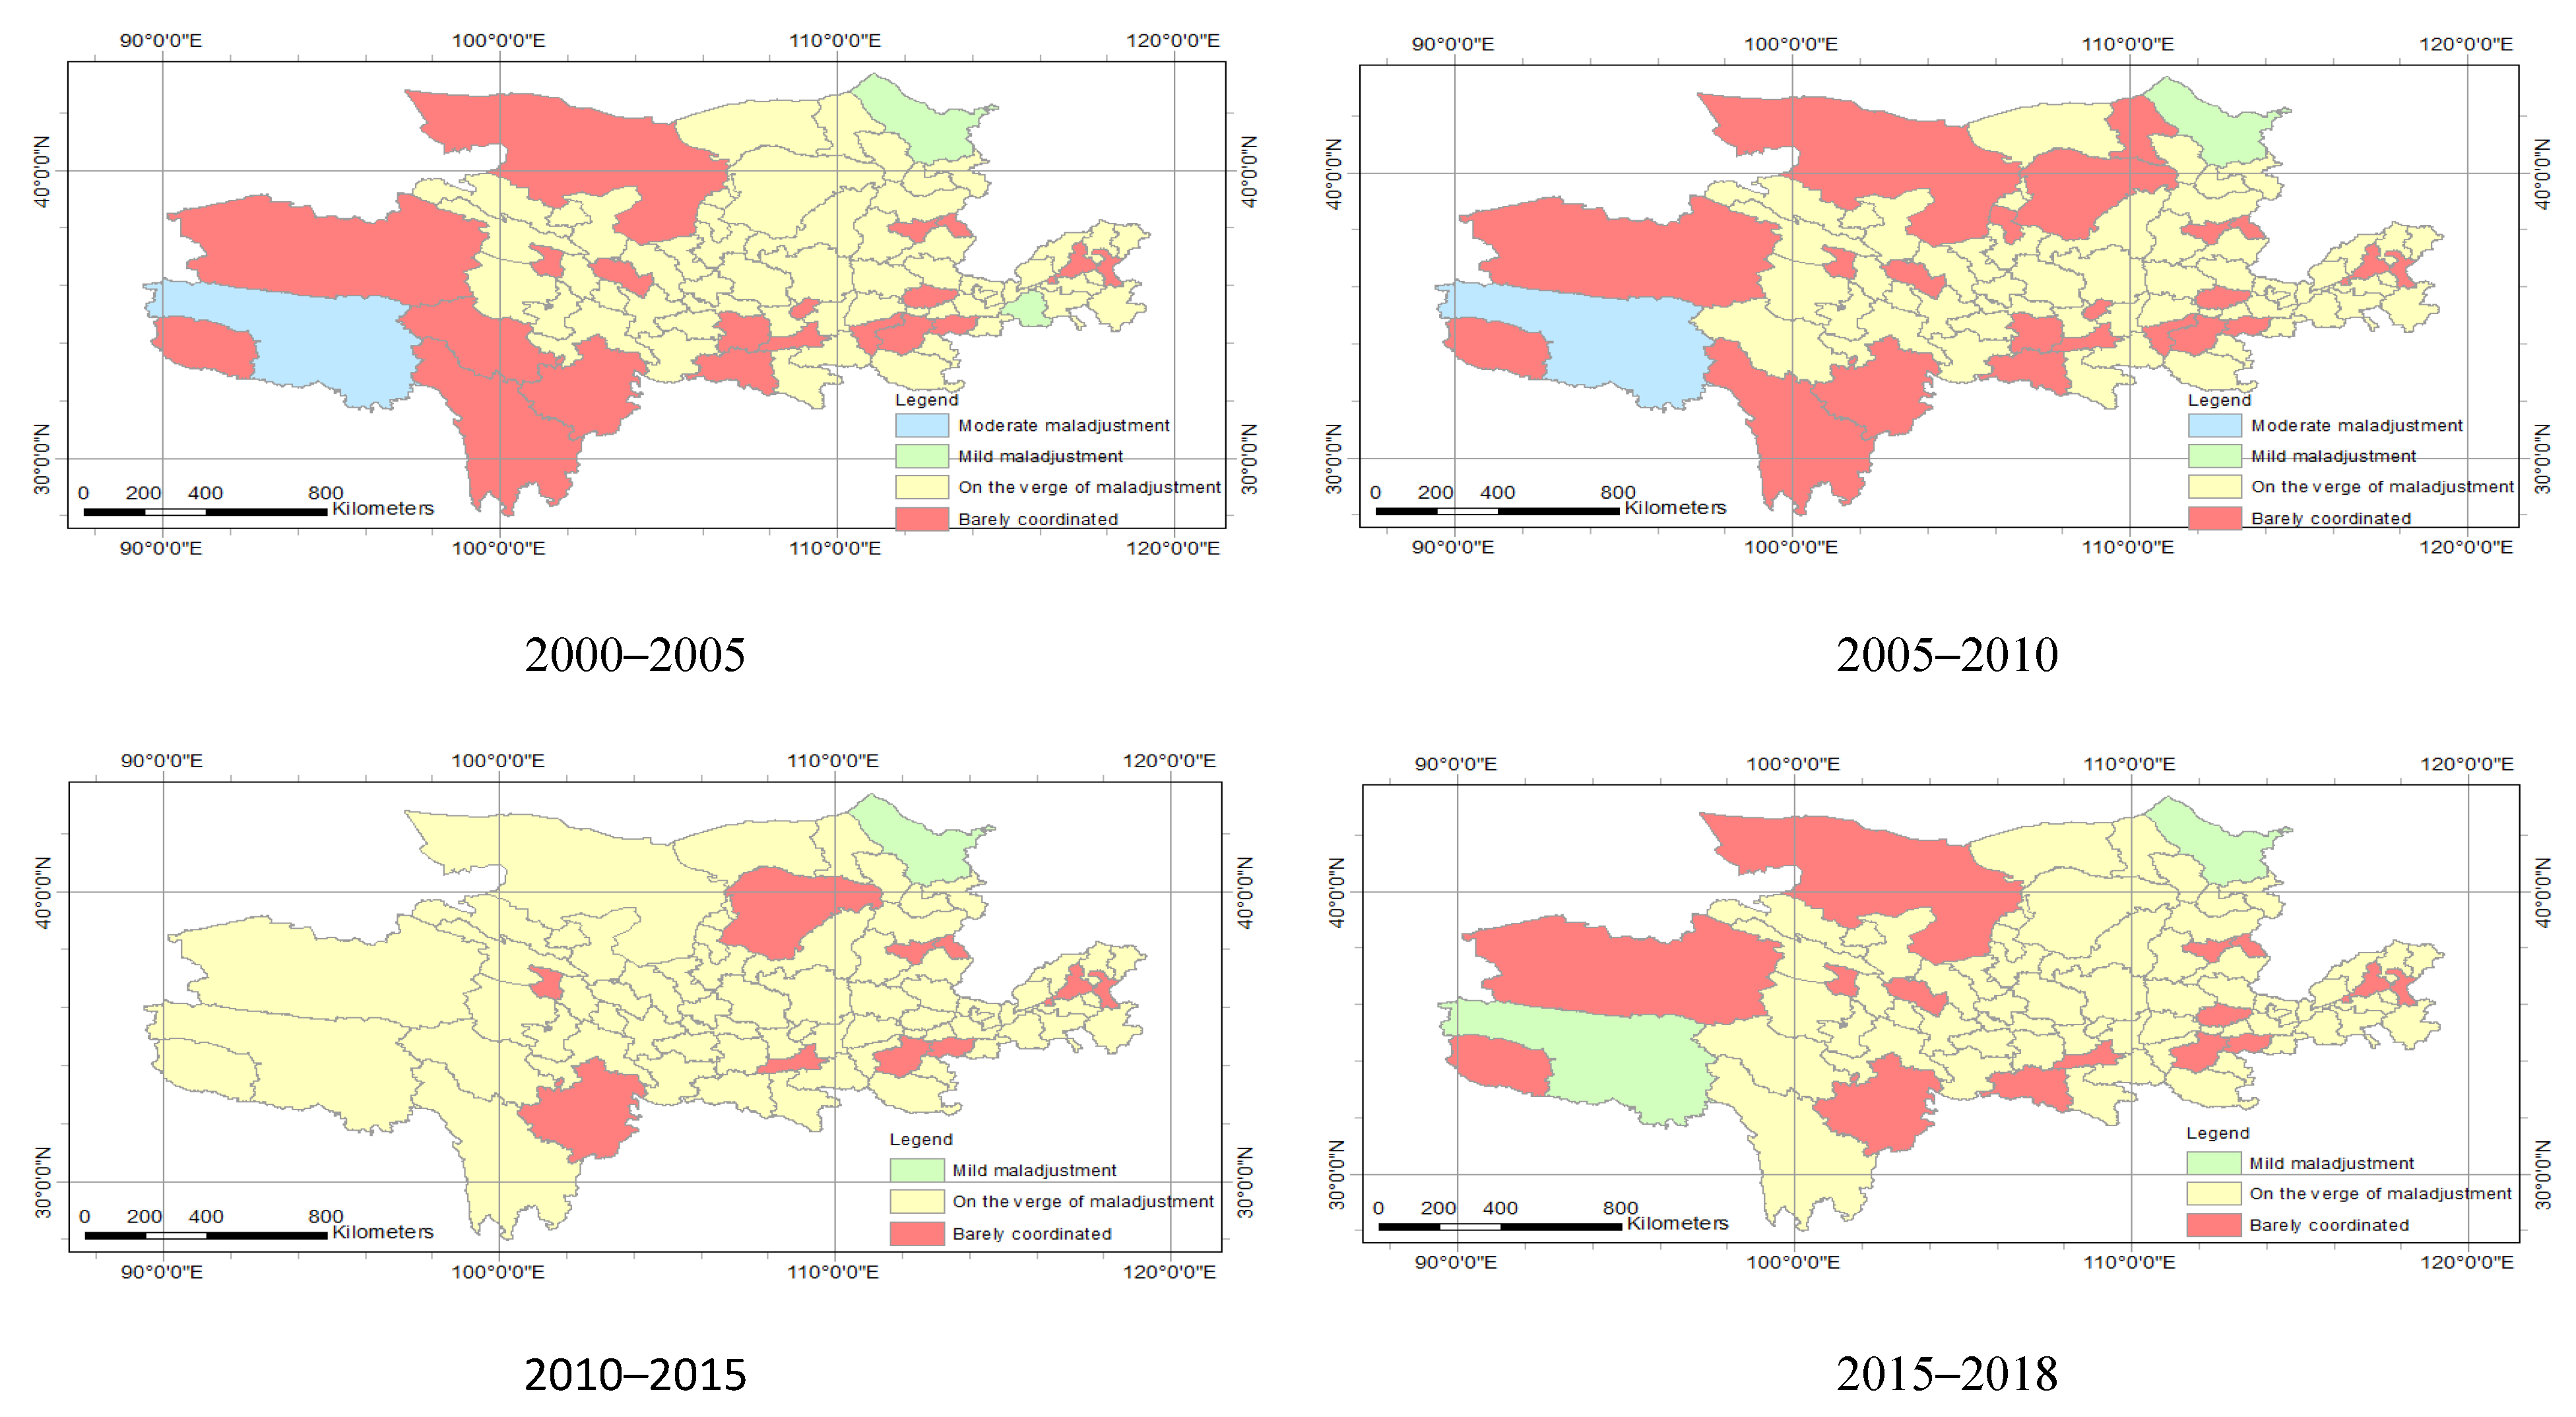
- During 2000 to 2015, the coupling coordination degree of the economy and ecology of the Yellow River Basin continuously improved during the study period, but it was reduced in 2015 to 2018. The coupling coordination level experienced moderate maladjustment, mild maladjustment, endangered maladjustment, slight coordination and primary coordination. The decrease in the degree of coupling coordination is due to the uncoordinated development of economic and ecological conditions.
- (6)
- The coupling degree and coupling coordination degree of economic and ecological conditions differ between large-scale and small-scale regions, which shows that the coupling degree and coupling coordination degree of different spatial scales present spatial heterogeneity.
Author Contributions
Funding
Institutional Review Board Statement
Informed Consent Statement
Data Availability Statement
Conflicts of Interest
References
- Huang, H.P. Research on the Scale Problem in Object-Oriented Image Analysis (D); Graduate School of Chinese Academy of Sciences: Beijing, China, 2003. [Google Scholar]
- Wang, S.; Song, J.; Wang, X.; Yang, W. The Spatial and Temporal Research on the Coupling and Coordinated Relationship between Social Economy and Energy Environment in the Belt and Road Initiatives. Sustainability 2019, 11, 407. [Google Scholar] [CrossRef] [Green Version]
- Tran, L. An interactive method to select a set of sustainable urban development indicators. Ecol. Indic. 2016, 61, 418–427. [Google Scholar] [CrossRef]
- Dang, V.T.; Wang, J.M.; Wilson, V.D. An Integrated Fuzzy AHP and Fuzzy TOPSIS Approach to Assess Sustainable Urban Development in an Emerging Economy. Int. J. Environ. Res. Public Health 2019, 16, 2902. [Google Scholar] [CrossRef] [Green Version]
- Li, W.; Yi, P. Assessment of city sustainability—Coupling coordinated development among economy, society and environment. J. Clean. Prod. 2020, 256, 120453. [Google Scholar] [CrossRef]
- Grossman, G.; Krueger, A. Economic growth and the environment. Q. J. Econ. 1995, 110, 353–377. [Google Scholar] [CrossRef] [Green Version]
- Samuel, A.S.; Vladimir, S. A review on Environmental Kuznets Curve hypothesis using bibliometric and meta-analysis. Sci. Total. Environ. 2019, 649, 128–145. [Google Scholar]
- Brock, W.A.; Taylor, M.S. Economic Growth and The Environment: A Review of Theory and Empirics. Handb. Econ. Growth 2005, 1, 1749–1821. [Google Scholar]
- Yu, S.; Lu, H.W. Relationship between urbanisation and pollutant emissions in transboundary river basins under the strategy of the Belt and Road Initiative. Chemosphere 2018, 203, 11–20. [Google Scholar] [CrossRef]
- He, J.; Wang, S.; Liu, Y.; Ma, H.; Liu, Q. Examining the relationship between urbanization and the eco-environment using a coupling analysis: Case study of Shanghai, China. Ecol. Indicat. 2017, 77, 185–193. [Google Scholar] [CrossRef]
- Neri, A.C.; Dupin, P.; Sanchez, L.E. A pressure–state–response approach to cumulative impact assessment. J. Clean. Prod. 2016, 126, 288–298. [Google Scholar] [CrossRef]
- Chen, M.; Chen, H.Q. Study on the coupling relationship between economic system and water environmental system in beijing based on structural equation model. Appl. Ecol. Environ. Res. 2019, 17, 617–632. [Google Scholar] [CrossRef]
- Cui, D.; Chen, X.; Xue, Y.; Li, R.; Zeng, W. An integrated approach to investigate the relationship of coupling coordination between social economy and water environment on urban scale—A case study of Kunming. J. Environ. Manag. 2019, 234, 189–199. [Google Scholar] [CrossRef] [PubMed]
- Fang, C.L.; Liu, H.M.; Li, G.D. International progress and evaluation on interactive coupling effects between urbanization and the eco-environment. J. Geogr. 2016, 26, 1081–1116. [Google Scholar] [CrossRef]
- Solymar, L.; Webb, D.J.; Grunnet-Jepsen, A.; Ducharme, S. The Physics and Applications of Photorefractive Materials. Phys. Today 1997, 50, 75–76. [Google Scholar] [CrossRef] [Green Version]
- Dong, G.; Ge, Y.; Zhu, W.; Qu, Y.; Zhang, W. Coupling Coordination and Spatiotemporal Dynamic Evolution Between Green Urbanization and Green Finance: A Case Study in China. Front. Environ. Sci. 2021, 8, 621846. [Google Scholar] [CrossRef]
- Fan, Y.P.; Fang, C.L.; Zhang, Q. Coupling coordinated development between social economy and ecological environment in Chinese provincial capital cities-assessment and policy implications. J. Clean. Prod. 2019, 229, 289–298. [Google Scholar] [CrossRef]
- Huang, J.; Shen, J.; Miao, L. Carbon Emissions Trading and Sustainable Development in China: Empirical Analysis Based on the Coupling Coordination Degree Model. Int. J. Environ. Res. Public Health 2020, 18, 89. [Google Scholar] [CrossRef]
- Zhou, D.; Zhang, X.; Wang, X. Research on coupling degree and coupling path between China’s carbon emission efficiency and industrial structure upgrading. Environ. Sci. Pollut. Res. 2020, 27, 25149–25162. [Google Scholar] [CrossRef] [PubMed]
- Liu, L.; Zhang, Y.; Zhang, J.; Zhang, S. Coupling Coordination Degree of Government Support, Financial Support and Innovation and its Impact on Economic Development. IEEE Access 2020, 8, 104039–104051. [Google Scholar] [CrossRef]
- Zhao, L.; Li, L.; Wu, Y. Research on the Coupling Coordination of a Sea–Land System Based on an Integrated Approach and New Evaluation Index System: A Case Study in Hainan Province, China. Sustainability 2017, 9, 859. [Google Scholar] [CrossRef] [Green Version]
- Kai, Y.; Shuran, L.; Jiancun, G.; Lei, P. Research on the coupling degree measurement model of urban gas pipeline leakage disaster system. Int. J. Disaster Risk Reduct. 2017, 22, 238–245. [Google Scholar] [CrossRef]
- Xu, X.; Chen, Z.; Feng, Z. From natural driving to artificial intervention: Changes of the Yellow River estuary and delta development. Ocean Coast. Manag. 2019, 174, 63–70. [Google Scholar] [CrossRef]
- Ministry of Water Resources of the People’s Republic of China. Bulletin of China Water Resources in 2012; Bulletin of the Ministry of Water Resources, PRC, 000(002): pp. 49–53; Ministry of Water Resources of the People’s Republic of China: Beijing, China, 2014.
- Ma, Y.Y.; Liu, G.B.; Zhang, C.; Wang, J. Coupling and coordinated development of ecological and economic systems in Ansai County, northern Shaanxi. Acta Ecol. Sin. 2019, 39, 6840–6849. [Google Scholar]
- Wang, R.; Tan, J. Exploring the coupling and forecasting of financial development, technological innovation, and economic growth. Technol. Forecast. Soc. Chang. 2020, 163, 120466. [Google Scholar] [CrossRef]
- Wang, W.; Zhang, T.; Wang, X.; Wen, C. Spatial and temporal pattern of urban ecological carrying capacity in Yangtze river economic zone. Resour. Env. Yangtze Basin 2017, 26, 1963–1971. [Google Scholar]
- Abramson, D.B. Urban Planning in China: Continuity and Change: What the future holds may surprise you. J. Am. Plan. Assoc. 2006, 72, 197–215. [Google Scholar] [CrossRef]
- Wang, J.; Zhang, G.; Zheng, Y.; Xu, D. Research on the Coupling Mechanism of Technical Innovation and Economic Growth in China ’s Iron and Steel Industry. Econ. Issues 2019, 11, 61–70. [Google Scholar]
- Cheng, X.; Long, R.; Chen, H. Obstacle diagnosis of green competition promotion: A case study of provinces in China based on catastrophe progression and fuzzy rough set methods. Environ. Sci. Pollut. Res. 2017, 25, 4344–4360. [Google Scholar] [CrossRef]
- Ren, Q.; Yu, E. Coupling analysis on coordinated development of ecological environment and social economic system in Gansu Province. Acta Ecol. Sin. 2021, 41, 2944–2953. [Google Scholar] [CrossRef]


| Evaluation System of the Yellow River Basin | First-Level Indicators | Weights | Second-Level Indicators | Indicator Attributes | Weights |
|---|---|---|---|---|---|
| Economic development system | Economic industrial structure | 0.7070 | Gross domestic product (x1) | + | 0.2317 |
| Proportion of first output value (x2) | − | 0.1184 | |||
| Percentage of second output value (x3) | + | 0.1505 | |||
| Proportion of third output value (x4) | + | 0.2064 | |||
| Resource consumption | 0.2930 | Energy consumption (x5) | + | 0.1350 | |
| Total water consumption (x6) | + | 0.1579 | |||
| Ecological status system | Ecological quality | 0.4114 | Vegetation coverage (x7) | + | 0.2237 |
| Total water resources (x8) | + | 0.1877 | |||
| Ecological composition | 0.5886 | Agricultural space area (x9) | − | 0.1518 | |
| Urban space area (x10) | − | 0.1698 | |||
| Ecological space area (x11) | + | 0.1774 | |||
| Percentage of ecological space area (x12) | + | 0.0895 |
| Economic Development System | Ecological Status System | ||||||
|---|---|---|---|---|---|---|---|
| Element | Eigenvalues | Contribution Rate (%) | Cumulative Contribution Rate (%) | Element | Eigenvalues | Contribution Rate (%) | Cumulative Contribution Rate (%) |
| 1 | 2.251 | 37.519 | 37.519 | 1 | 2.604 | 43.398 | 43.398 |
| 2 | 1.405 | 23.422 | 60.941 | 2 | 1.233 | 20.557 | 63.955 |
| 3 | 1.205 | 20.081 | 81.022 | 3 | 1.076 | 17.938 | 81.893 |
| 4 | 0.725 | 12.081 | 93.103 | 4 | 0.590 | 9.831 | 91.723 |
| 5 | 0.406 | 6.774 | 99.877 | 5 | 0.287 | 4.777 | 96.501 |
| 6 | 0.007 | 0.123 | 100 | 6 | 0.210 | 3.499 | 100 |
| The Ratio of Economic and Ecological | Economic Development | Ecological Status |
|---|---|---|
| (0, 0.5) | Low | Low |
| (0.5, 1) | Medium | Medium |
| (1, 1.5) | Mid to high | Mid to high |
| (1.5, +∞) | High | High |
| Coupling Interval | Coupling Level | Coupling Coordination Interval | Coupled Coordination Level |
|---|---|---|---|
| (0, 0.35) | Slightly coupled | (0.2, 0.3) | Moderate maladjustment |
| (0.35, 0.65) | Lightly coupled | (0.3, 0.4) | Mild maladjustment |
| (0.65, 0.85) | Moderately coupled | (0.4, 0,5) | On the verge of maladjustment |
| (0.85, 1) | Intensity coupled | (0.5, 0.6) | Barely coordinated |
| (0.6, 0.7) | Primary coordinated |
| Level | 2000–2005 | 2005–2010 | 2010–2015 | 2015–2018 | |
|---|---|---|---|---|---|
| Economic development | Low | 4 | 2 | 7 | 5 |
| Medium | 27 | 29 | 34 | 27 | |
| Mid to high | 27 | 23 | 18 | 20 | |
| High | 20 | 24 | 19 | 26 | |
| Ecological status | Low | 6 | 10 | 6 | 8 |
| Medium | 41 | 37 | 31 | 38 | |
| Mid to high | 11 | 8 | 15 | 10 | |
| High | 20 | 23 | 26 | 22 | |
| Coupling level | Sightly coupled | 0 | 0 | 0 | 0 |
| Lightly coupled | 1 | 1 | 0 | 1 | |
| Moderately coupled | 0 | 0 | 0 | 1 | |
| Intensity coupled | 77 | 77 | 78 | 76 | |
| Coupled coordination level | Moderate maladjustment | 1 | 1 | 0 | 0 |
| Mild maladjustment | 2 | 1 | 1 | 2 | |
| On the verge of maladjustment | 56 | 55 | 67 | 62 | |
| Barely coordinated | 19 | 21 | 10 | 14 | |
| Area Proportion (%) | 2000–2005 | 2005–2010 | 2010–2015 | 2015–2018 |
|---|---|---|---|---|
| Agricultural spatial area proportion | 17.12 | 16.90 | 16.84 | 16.51 |
| Urban space area proportion | 1.76 | 1.89 | 1.96 | 2.64 |
| Ecological space area proportion | 81.12 | 81.21 | 81.21 | 80.85 |
| Time | Economic Development Index | Ecological Status Index | Integrated Development Index | Coupling | Coupling Coordination Degree |
|---|---|---|---|---|---|
| 2000–2005 | 0.0301 | 0.2671 | 0.1486 | 0.6033 | 0.2994 |
| 2005–2010 | 0.2667 | 0.3132 | 0.2899 | 0.9968 | 0.5376 |
| 2010–2015 | 0.4078 | 0.3781 | 0.3930 | 0.9993 | 0.6266 |
| 2015–2018 | 0.4694 | 0.2612 | 0.3653 | 0.9585 | 0.5917 |
| The Level of Coupling and Coupled Coordination | 2000–2005 | 2005–2010 | 2010–2015 | 2015–2018 |
|---|---|---|---|---|
| Coupling level | Lightly coupled | Intensity coupled | Intensity coupled | Intensity coupled |
| Coupled coordination level | Moderate maladjustment | Barely coordinated | Primary coordination | Barely coordinated |
Publisher’s Note: MDPI stays neutral with regard to jurisdictional claims in published maps and institutional affiliations. |
© 2021 by the authors. Licensee MDPI, Basel, Switzerland. This article is an open access article distributed under the terms and conditions of the Creative Commons Attribution (CC BY) license (https://creativecommons.org/licenses/by/4.0/).
Share and Cite
Zhao, Y.; Hou, P.; Jiang, J.; Zhai, J.; Chen, Y.; Wang, Y.; Bai, J.; Zhang, B.; Xu, H. Coordination Study on Ecological and Economic Coupling of the Yellow River Basin. Int. J. Environ. Res. Public Health 2021, 18, 10664. https://doi.org/10.3390/ijerph182010664
Zhao Y, Hou P, Jiang J, Zhai J, Chen Y, Wang Y, Bai J, Zhang B, Xu H. Coordination Study on Ecological and Economic Coupling of the Yellow River Basin. International Journal of Environmental Research and Public Health. 2021; 18(20):10664. https://doi.org/10.3390/ijerph182010664
Chicago/Turabian StyleZhao, Yanhong, Peng Hou, Jinbao Jiang, Jun Zhai, Yan Chen, Yongcai Wang, Junjun Bai, Bing Zhang, and Haitao Xu. 2021. "Coordination Study on Ecological and Economic Coupling of the Yellow River Basin" International Journal of Environmental Research and Public Health 18, no. 20: 10664. https://doi.org/10.3390/ijerph182010664
APA StyleZhao, Y., Hou, P., Jiang, J., Zhai, J., Chen, Y., Wang, Y., Bai, J., Zhang, B., & Xu, H. (2021). Coordination Study on Ecological and Economic Coupling of the Yellow River Basin. International Journal of Environmental Research and Public Health, 18(20), 10664. https://doi.org/10.3390/ijerph182010664