Article

Assessment of Significant Factors Affecting Frequent Lane-Changing Related to Road Safety: An Integrated Approach of the AHP–BWM Model

1
Department of Civil Engineering, Comsats University Islamabad, Wah Campus, Wah 47040, Pakistan
2
Department of Transport Technology and Economics, Budapest University of Technology and Economics, 1111 Budapest, Hungary
3
Department of Civil and Environmental Engineering, College of Design and Built Environment, King Fahd University of Petroleum & Minerals, KFUPM Box 5055, Dhahran 31261, Saudi Arabia
4
Interdisciplinary Research Center of Smart Mobility and Logistics (IRC-SML), King Fahd University of Petroleum & Minerals, Dhahran 31261, Saudi Arabia
5
Transportation and Traffic Engineering Department, College of Engineering, Imam Abdulrahman Bin Faisal University, P.O. Box 1982, Dammam 31451, Saudi Arabia
6
Center of Excellence in Trauma and Accidents, King Abdulaziz University, Jeddah 21589, Saudi Arabia
7
Department of Surgery, Faculty of Medicine, King Abdulaziz University, Jeddah 21589, Saudi Arabia
8
Department of Civil Engineering, College of Engineering, Qassim University, Buraydah 51452, Saudi Arabia
*
Author to whom correspondence should be addressed.
Int. J. Environ. Res. Public Health 2021, 18(20), 10628; https://doi.org/10.3390/ijerph182010628
Submission received: 25 August 2021 / Revised: 1 October 2021 / Accepted: 1 October 2021 / Published: 11 October 2021

Abstract

:
Frequent lane changes cause serious traffic safety concerns for road users. The detection and categorization of significant factors affecting frequent lane changing could help to reduce frequent lane-changing risk. The main objective of this research study is to assess and prioritize the significant factors and sub-factors affecting frequent lane changing designed in a three-level hierarchical structure. As a multi-criteria decision-making methodology (MCDM), this study utilizes the analytic hierarchy process (AHP) combined with the best–worst method (BWM) to compare and quantify the specified factors. To illustrate the applicability of the proposed model, a real-life decision-making problem is considered, prioritizing the most significant factors affecting lane changing based on the driver’s responses on a designated questionnaire survey. The proposed model observed fewer pairwise comparisons (PCs) with more consistent and reliable results than the conventional AHP. For level 1 of the three-level hierarchical structure, the AHP–BWM model results show “traffic characteristics” (0.5148) as the most significant factor affecting frequent lane changing, followed by “human” (0.2134), as second-ranked factor. For level 2, “traffic volume” (0.1771) was observed as the most significant factor, followed by “speed” (0.1521). For level 3, the model results show “average speed” (0.0783) as first-rank factor, followed by the factor “rural” (0.0764), as compared to other specified factors. The proposed integrated approach could help decision-makers to focus on highlighted significant factors affecting frequent lane-changing to improve road safety.

1. Introduction

The Global status report on road safety estimated that the number of fatalities in annual road traffic accidents have reached over 1.35 million [1]. European roads have been declared as the safest worldwide, with a decline of 19% in road fatalities over the previous six years. While attaining the strategic goal of halving the number of road crashes fatalities between 2010 and 2020 is an acute task, it is worth aiming to protect every single life [2]. In addition, the performance of Hungary’s road safety is below the EU average. On Hungarian roads, 64 people per million inhabitants died in 2018, indicating a 1% rise compared to the previous year [3]. The situation analysis of the Road Safety Action Program examines that human-related issues cause most of the road accidents; thus, controlling them becomes the extremely dynamic goal of road safety actions [4,5,6]. Previous findings detected the human factors to be a primary or leading contributing cause in approximately 90% of road traffic crashes [7,8,9,10,11,12]. In addition, the study observed that driving behavior is one of the basic driver-related components that directly affect road safety [13,14,15].
Frequent lane-changing actions have a negative impact on traffic performance, particularly, when performed during high traffic exposure periods [16]. A study report [17] stated that the action of changing lanes is one of the highly frequent sources of crashes in the United States. Accordingly, the official statistics estimated that at least 33% of all road crashes happen as vehicles alter lanes or turn off the road. Furthermore, crash data recorded from 2010 to 2017 in Middle East countries indicate that sudden lane changes produced about 17.0% of the total serious accidents, followed by speeding (12.8%) [18,19].
In recent years, many researchers studied the lane-changing phenomenon using different statistical and dynamic techniques. Accordingly, some researchers implemented game theory to examine lane-changing behavior [20,21,22,23]. In addition, the good reputation of artificial intelligence (AI) has preceded some AI-based lane-changing behavior investigations. The neural network model can estimate lane-changing behavior more precisely than the multinomial logit model [24]. Probabilistic methods were utilized to analyze lane-changing behavior [25]. Researchers further developed an exponential probability model to examine the relationship between lane-changing probability and relative gap, as well as relative velocity. Furthermore, a recent study utilized a simulation model to evaluate the influence of significant factors on lane-changing [26].
Studying the unpredictability of the lane-changing period, a previous study [27] investigates that the least possible safety layout alters with the dynamic lane-changing period and explains how the accelerating space of the actual vehicle alters with the nearby vehicles’ running positions. On this basis, a decision-making model of discretionary lane-changing based on dynamic reference spots was created using cumulative prospect theory (CPT). This CPT-based model can depict discretionary lane-changing behavior in a more precise way, which reflect drivers’ risk abhorrence during decision-making. Furthermore, another study [28] suggested a new technique to formalize the lane-changing model in urban driving situations. They describe human incentives from different angles, route-change incentives, speed incentive, courtesy incentive and comfort incentive, etc. Furthermore, a decisional theoretical tool was employed, called multi-criteria decision-making (MCDM), to consider these incentive strategies. The strategy of grouping is in accordance with different driving styles, which differ for each driver. Therefore, a lane-changing decision selection algorithm was suggested. The proposed model could identify more abundant and unexpected lane-changing behaviors with different preferences of inducements.
A previous study depicted that many experts applied the analytic hierarchy process (AHP) to compare the decisions by utilizing their proficiencies and intellectual resources; however, this may not entirely replicate the approach of human behavior. In addition, the inconsistency in pairwise comparison matrices (PCMs) is the basic shortcoming of AHP and can yield biased results. However, it is generally evident that, if the PCM is 5 × 5 or greater in the decision arrangement, the comparatively reliable filling of a matrix of this size by non-expert assessors needs substantial endeavor [29,30,31]. After the development of the best–worst method (BWM), the investigators have commenced to utilize that instead of the AHP because of its advantages. The BWM/F-BWM is employed to allocate weights to risk factors similar to the AHP [32]. In several studies, it is often integrated with the failure mode and effects analysis (FMEA) [33,34,35,36]. For the BWM, the inconsistency-improving actions and the suitable consistency ratio value can be tackled through input- and output-based consistency techniques. In addition, the BWM, within other situations, could examine the ambiguity. In addition, in the BWM, the model’s multiple optimality result can be estimated from other perspectives [37,38]. Recently, a study provided a perfect and clear approach for evaluating and ranking suppliers based on a consistent, consensus-derived model for multi-criteria group decision-making (MCGDM) in a partial AHP condition [39]. Sometimes experts may not be capable of selecting the most appropriate criterion weight vector in the logic of intuitionist 2-tuple linguistic (I2TL) sets for multicriteria decision-making (MCDM). To elude this condition, the decision-makers (DMs) can utilize the best–worst method (BWM), in which DMs select the best (most important) criterion and the worst (least important) criterion and then give two preference vectors by relating the best criterion to one vector and the worst criterion to the other [40]. Pythagorean fuzzy sets (PFSs) were observed to be a superior technique introduced for multi-criteria decision-making, facilitating both membership and non-membership functions in a big domain region [41]. Furthermore, another study [28] suggested a new technique to formalize the lane-changing model in urban driving situations. They describe human incentives from different angles, route-change incentive, speed incentive, courtesy incentive and comfort incentive, etc. A decisional theoretical tool was employed, called multi-criteria decision making (MCDM), to consider these incentive strategies. Mainly, the strategy of grouping was undertaken according to different driving styles, which differ for each driver. Therefore, a lane-changing decision selection algorithm was suggested. The proposed model identified more abundant and unexpected lane-changing behaviors with different preferences of inducements [28].
In recent crash reports, it is generally recorded that the crash has happened because of the frequent-lane-changing behavior of the at-fault drivers (in the crash reason item), without considering the factors underlying such behavior [42,43]. Most of the previous findings concentrated on significant driver behavior factors that could affect road safety [13,44,45], but these papers lack specific estimation of the most significant factors and sub-factors that could affect frequent lane-changing. Therefore, this study considers those factors that could affect the occurrence of frequent lane-changing while investigating the drivers’ perception towards lane change maneuvering.
The main goal of the present study is to identify and rank the significant factors affecting lane-changing by utilizing an integrated model of AHP and BWM. For this research study, we designed a lane-change model consisting of important factors and their sub-factors in a three-level hierarchical arrangement for evaluation purposes. In addition, the proposed model requires a smaller number of PCs with more reliable outcomes than the classical AHP in real-life decision-making problems. The research work is structured as follows: The exhaustive steps of the questionnaire survey with the focus on the AHP and BWM design are presented in Section 1. Afterward, the real-life case study on the application of the proposed model is presented; we evaluate the main factors and sub-factors affecting frequent lane-changing in the designed three-level hierarchical arrangement related to road safety. Then, in the next section, we present a detailed description of the AHP–BWM model and the methodological principles and characteristics of our created AHP–BWM model. In the results section, the study prioritized the specified lane-change factors by assigning weights to each factor. Finally, we draw some conclusions and make some recommendations to the users of the proposed methodology, along with remarks for further research.

2. Materials and Methods

2.1. Questionnaire Survey

There has been considerable work undertaken to identify and solve the actions that reduce driving safety. The Driver Behavior Questionnaire (DBQ) stands out for its longevity and leading use among the several tools [46]. To estimate problematic driving behavior, the Driver Behavior Questionnaire (DBQ) was first utilized as a means in the relevant studies in the 1990s [47]. The current study applied the questionnaire survey designed on a Saaty scale to evaluate the effect of significant factors on frequent lane-changing based on drivers’ responses. Accordingly, the questionnaire was designed into two parts. The first part consists of important socio-demographic information related to participants, such as age, gender, duration of driving license, education level and working status, as shown in Table 1. These characteristics affect the driver’s perception towards lane-changing maneuvers [42,48]. The second part of questionnaire survey consists of questions about significant factors affecting frequent lane-changing designed for the AHP model and the BWM model, as shown in Table 2 and Table 3. To collect questionnaire data, the survey was distributed among seventy participants from the department of transport technology and economics (Budapest University of Technology and Economics) who had a driving license; the respondents were asked to fill the survey through Google online forms, etc. The response rate was 70%. The evaluator number of the questionnaire survey was not statistically representative, while Solomon [49] highlighted, in his phenomenon “Wisdom of crowds,” that 20 evaluators can provide an extreme opinion.

2.2. Lane-Change Model

The lane-changing trend is defined as “an act of driving practice that changes a vehicle from one lane to another as both lanes get the same way of travel” [50]. In this research study, we designed a lane-change model consisting of important factors and their sub-factors in a three-level hierarchical arrangement for evaluation purposes, as presented in Figure 1. The first level consists of four primary factors related to road safety, such as traffic characteristics, human, road characteristics and light conditions. A descriptive–analytic study observed three similar main categories of factors that contribute to crashes caused by fatigue and sleepiness, such as human, road and light conditions and vehicle-related factors [51]. For level 2, these main factors were further distributed into fourteen sub-factors and, for level 3, these were further distributed into eight sub-factors. Many researchers considered these specified factors significant in related studies, such as lane-change crashes [42,52], lane-change risks [53], lane-changing simulation [26], discretionary lane-changing [27,54] and road-safety evaluation [44].

2.3. Analytic Hierarchy Process (AHP)

AHP is one of the most widely applied MCDM methodologies in engineering, technology, science, and management and business [55,56,57,58]. AHP helps decision-makers estimating complex problems with several differing and biased measures. In the AHP domain, several combined strategies are proposed [42]. The evaluator in the survey sometimes ought not to give a numerical judgment; as an alternative, a relative verbal comprehension, more typical in our everyday lives, is enough [57]. However, the 1–9 fundamental scale proposed by Saaty et al. [59] is commonly applied to evaluate the factors by considering PCs. The main steps of the AHP are:
Step 1: Determining the hierarchical structure of the evaluation factors.
Step 2: Constructing the survey based on PCs in the hierarchical structure by using a (1–9) scale.
Step 3: Checking the consistency of PCs.
Step 4: Aggregating the weight scores.
Step 5: Deriving weight vectors and computing the final weight scores considering branch connections.
Step 6: Performing the sensitivity analysis.
In the AHP domain, several combination strategies are proposed. The evaluator in the survey sometimes does not require to give a numerical judgment; instead of relative verbal gratitude, more typical in our daily life, is enough. However, a 1–9 fundamental scale was proposed by Saaty (1977) to evaluate the PCs numerically or verbally (Table 4). The conducted comparisons are estimated in a positive reciprocal matrix (1).
X = x i j x 12 x 21 1 x 1 n : : x n 1 1 : 1  
where x i j is the comparison between factor i and factor j and n is the dimension of the PCM and, at the same time, it is the number of evaluated factors in the matrix; the total number of comparisons is n n 1 / 2 .
If the matrix is perfectly consistent, then x i j = x i n . x n j , for checking matrix consistency. The matrix consistency is entirely consistent and acceptable when CR is smaller than 10%, else the evaluator has to re-evaluate the PCM. Saaty (1977) adopted the consistency index (CI), which is related to the maximum eigenvalue λ m a x :
C I = λ m a x n n 1
The consistency ratio is computed by
C R = C I / R I
where RI is the random index, as given in Table 5.

2.4. Best–Worst Method (BWM)

The developed BWM considers an efficient MCDM method to deal with complex problems. In this approach, the decision-maker picks the most important criterion and the least important one from all considered criteria. Then, the criterion selected as the best or the most important is compared with all the other criteria and allocated a number in the range between 1 and 9, where “1” characterizes that the criterion is as significant as the best or most significant criterion and “9” characterizes that the finest criterion is nine times more significant than the worst criterion [29]. Similarly, the comparison is performed among the criterion selected as the worst or the least important and all the other criteria. These values are then managed for an optimization process [38]. The main aim of these comparisons is to obtain the maximum consistency by reducing the maximum difference between the best-criterion-to-any-criterion comparison value and the proportion of the weight scores of the best criterion and that criterion. This process is performed by certain new value constraints, such as the maximum potential value of the sum of the weight scores. For evaluating the factors’ weight scores, a 2 n 3 comparison number is required. The efficiency of the method made the scholars adopt it in several studies in a short period [32,60,61]. The main steps of the method are as follows:
Step 1: Setting up the problem structure of factors.
Step 2: Selecting the most critical factor and the least critical factor based on the evaluator’s point of view.
Step 3: Comparing the most critical factor with other factors employing a 1–9 scale; the result would be the most important to other factors: X b = x b 1 ,   x b 2 ,   , x b n ,   where x b j is the preference of the most critical factor b over factor j and x b b = 1 .
Step 4: Comparing the least important factor with other factors employing a 1–9 scale; the result would be the least important factor to other factors: X w = x 1 w ,   x 2 w ,   , x n w T ,   where x j w is the preference of factor j over the least important factor w and x w w = 1 .
Step 5: Calculating the optimal weight scores ( W 1 * ,   W 2 * ,   ,   W n * ) by minimizing the maximum between the W b x b j . W j   and W j x j w . W w as follows:
m i n . m a x .   W b x b j . W j , W j x j w . W w , s . t .   j = 1 n W j = 1 W j   0 ,     j
To measure the PC consistency in the BWM, the input-based consistency ratio ( C R I ) by [62] was adopted. The new measurement technique can provide the results immediately by using the evaluator’ preferences without calculating the entire optimization and it could be calculated as follows:
C R I = max j C R j I  
where
C R j I = x b j × x j w x b w x b w × x b w x b w 0                 x b w > 1 x b w = 1 .
The proposed measurement illustrates how much an evaluator disregards the ordinal consistency and it gives an appropriate process to highlight and fix the included conflicts. The threshold of the input-based consistency is obtained from Table 6.
Step 7: Aggregating the weight scores.
Step 8: Deriving weight vectors.
Step 9: Performing the sensitivity analysis.

2.5. The Proposed AHP–BWM Model

The main intention of the proposed model’s application is to obtain more reliable outcomes than those derived by the traditional model in multi-level complex decision problems. The model efficiency comes from providing consistent PCs and minimizing the comparison number in the conducted surveys. In the AHP approach, the consistency would be very weak if the factor number in the PCM leaped 7 ± 2 Saaty (1977). However, Rezaei [38] created the BWM approach to secure this gap and provide comparisons that are more consistently efficient. Moreover, the BMW requires a smaller number of comparisons (2n − 3) than the AHP (n(n − 1)/2) when factor numbers are 4 or greater.
These matters show that the BWM approach is an effective method to conserve time and energy for both assessors and decision-makers. For example, if we have only 20 factors, that means the evaluator needs to make just 37 comparisons with the BWM. On the other hand, the evaluator needs to make 190 comparisons with the conventional AHP approach.
The main steps of the AHP–BWM model are as follows:
Step 1: Creating the hierarchical structure of the complex problem.
Step 2: Determining factor numbers for each cluster in the hierarchical structure.
Step 3: Adopting the AHP method for all clusters with four factors and smaller to compute the factors’ weight scores and checking the consistency.
Step 4: Adopting the BWM method for all clusters with five factors and bigger to compute the factors’ weight scores and checking the consistency.
Step 5: Aggregating the weight scores.
Step 6: Conducting the final weight scores considering branch connections.
Step 7: Performing the sensitivity analysis.

3. Results and Discussion

The AHP–BWM model was adopted based on the number of factors in each cluster to estimate factors significance affecting frequent lane-changing based on drivers’ responses. The total number of evaluated comparisons for the conventional AHP was 20 (12 comparisons for 2 (4 × 4) matrices + 5 comparisons for 5 (2 × 2) matrices + 3 comparisons for one (3 × 3) matrix), and 7 comparisons were evaluated for the BWM. Following that, the total number of the evaluated comparisons for the proposed model was 27 comparisons. However, if the conventional AHP was applied for all structures, the evaluator needed to evaluate 30 comparisons. The results were achieved based on the following steps:
Step 1: The hierarchical structure of the factor influencing frequent lane-changing was constructed based on the literature and driving experts’ point of view (Figure 1). The hierarchical structure of the problem consists of four main factors located in level 1, 14 sub-factors located in the second level and gathered into four groups, and eight sub-factors located in the third level and gathered into four groups.
Step 2: Determining factor numbers for each cluster in the hierarchical structure. The first level consists of one cluster with four factors. The second level consists of four clusters (1. Cluster contains five factors; 2. Cluster contains four factors; 3. Cluster contains three factors and 4. The cluster contains two factors) and the third level consists of four clusters, each containing two factors.
Step 3: The AHP method is adopted for all clusters with four factors and smaller to compute the factors’ weight scores; CR was smaller than 0.1 for all PCs.
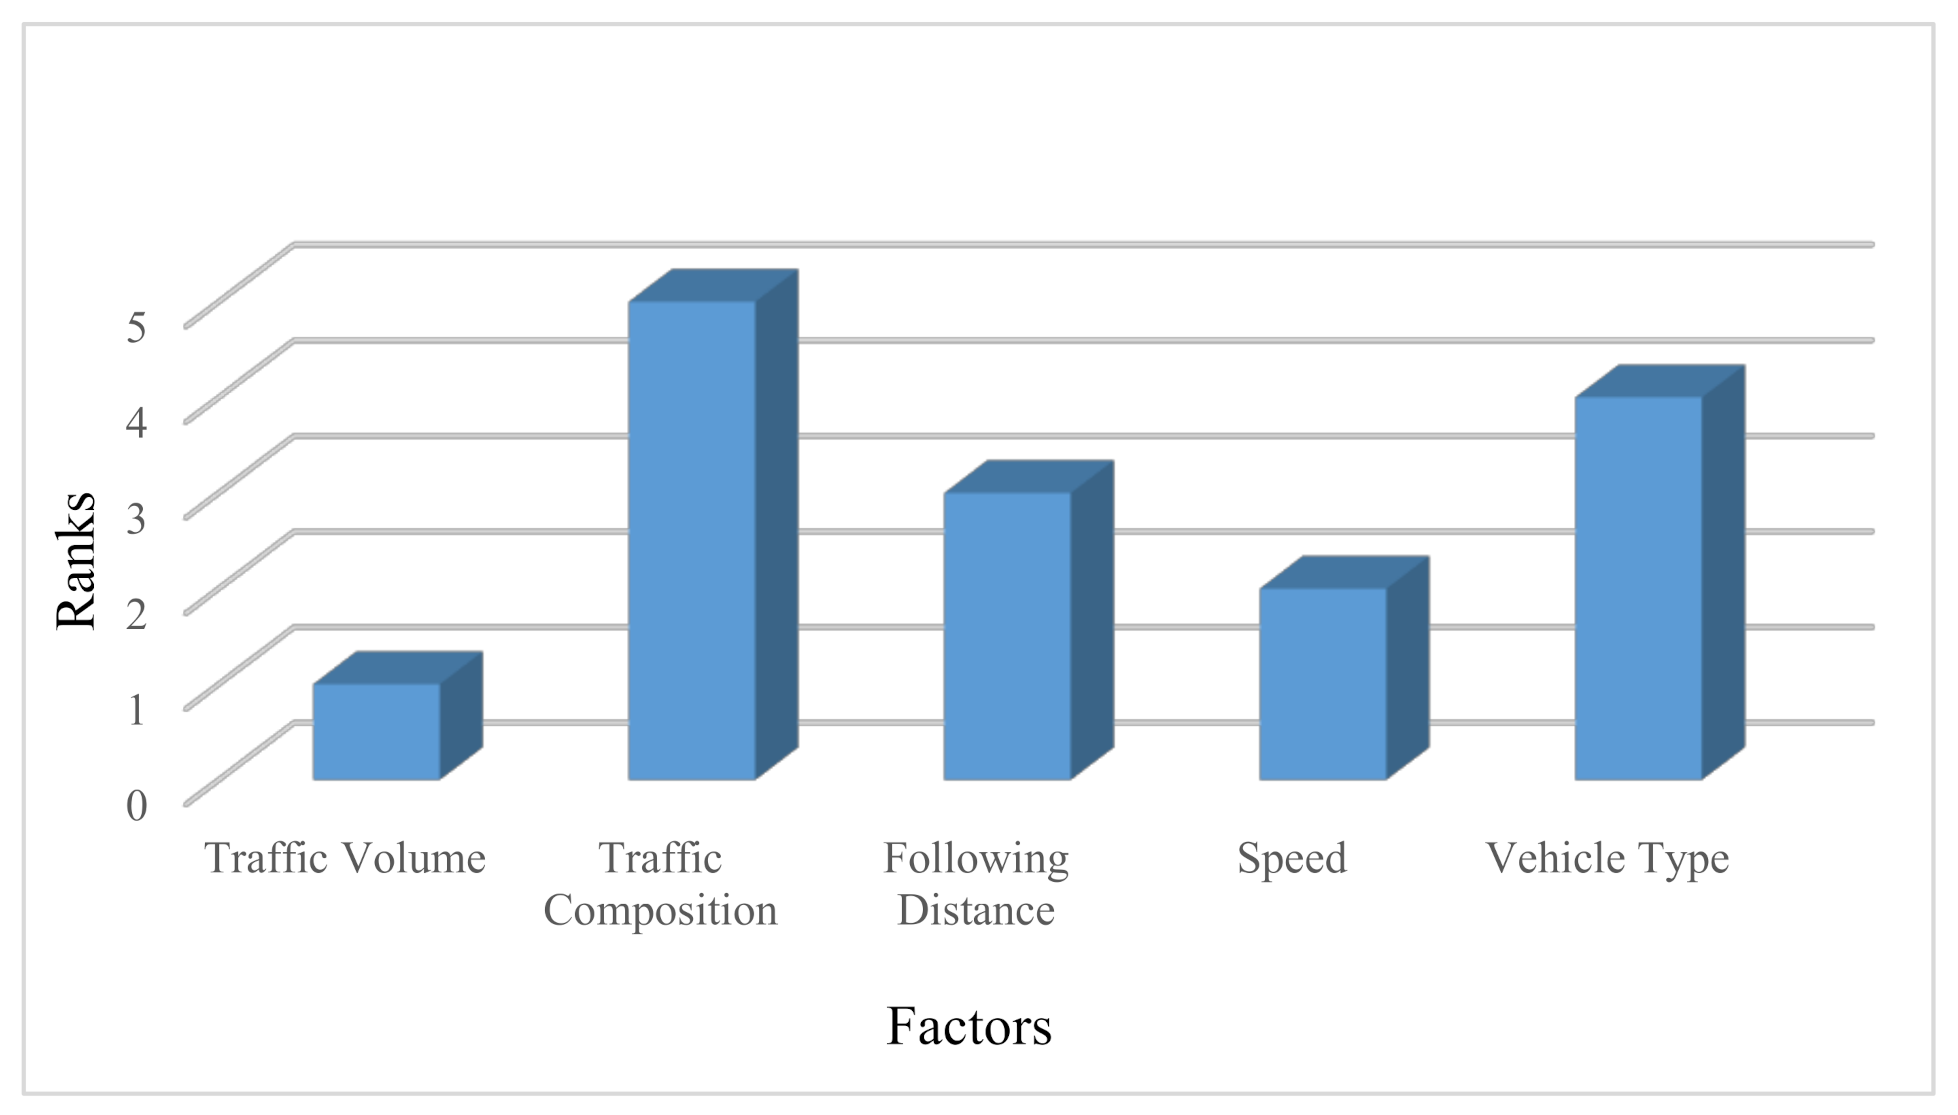
Step 4: The BWM method was conducted for only one cluster with five factors (traffic volume, traffic composition, following distance, speed and vehicle type), which is located in the second level and the C R I was accepted for all PCs. The final aggregated weight vector was (0.3440, 0.1075, 0.1381, 0.2954, 0.1150) and the consistency of all comparisons was smaller than the input-based threshold (0.3337). The ranks of specified factors based on final aggregated weights obtained using the BWM are shown in Figure 2.
Step 5: The aggregated weight scores for all factors obtained using the geometric mean are depicted in Table 7.
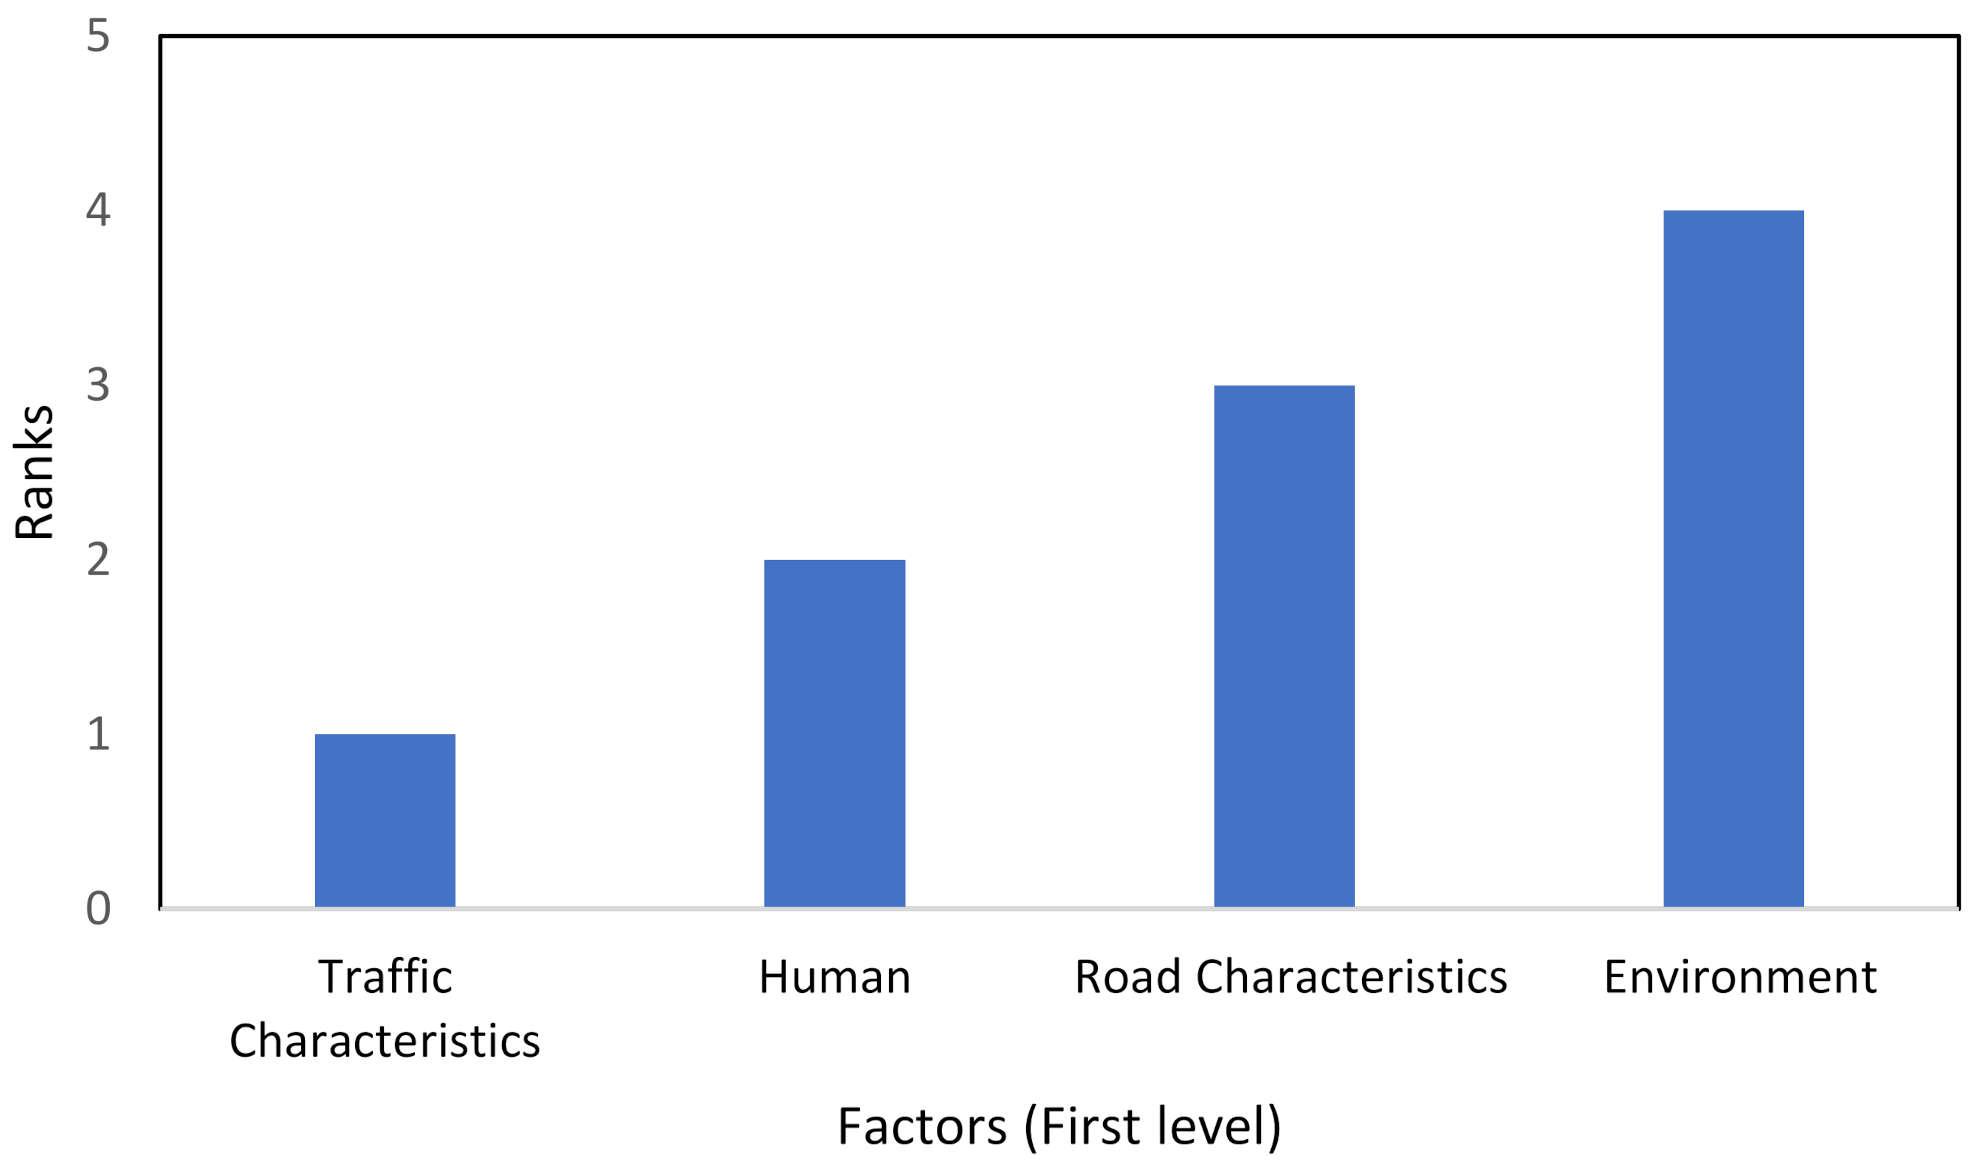
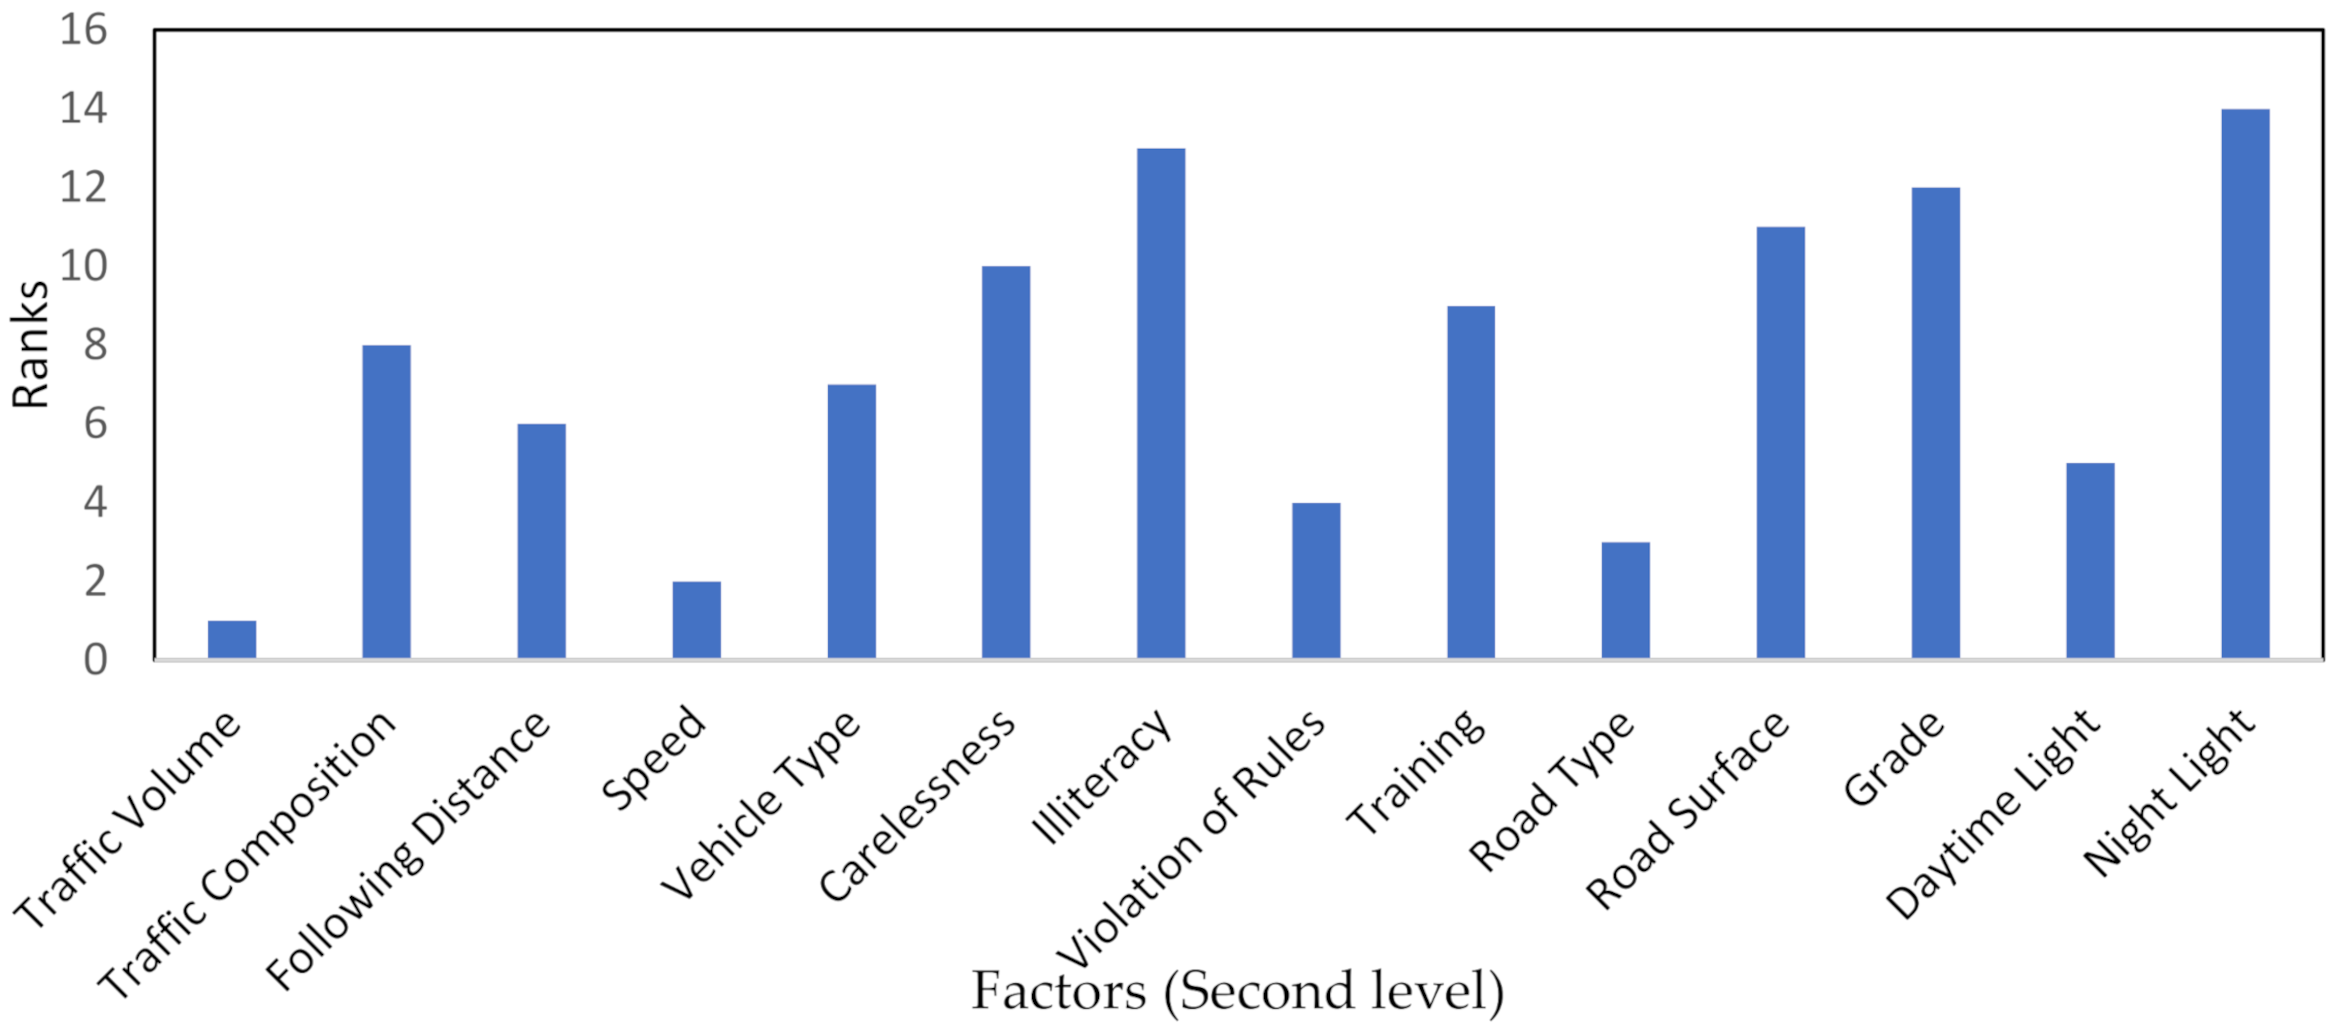
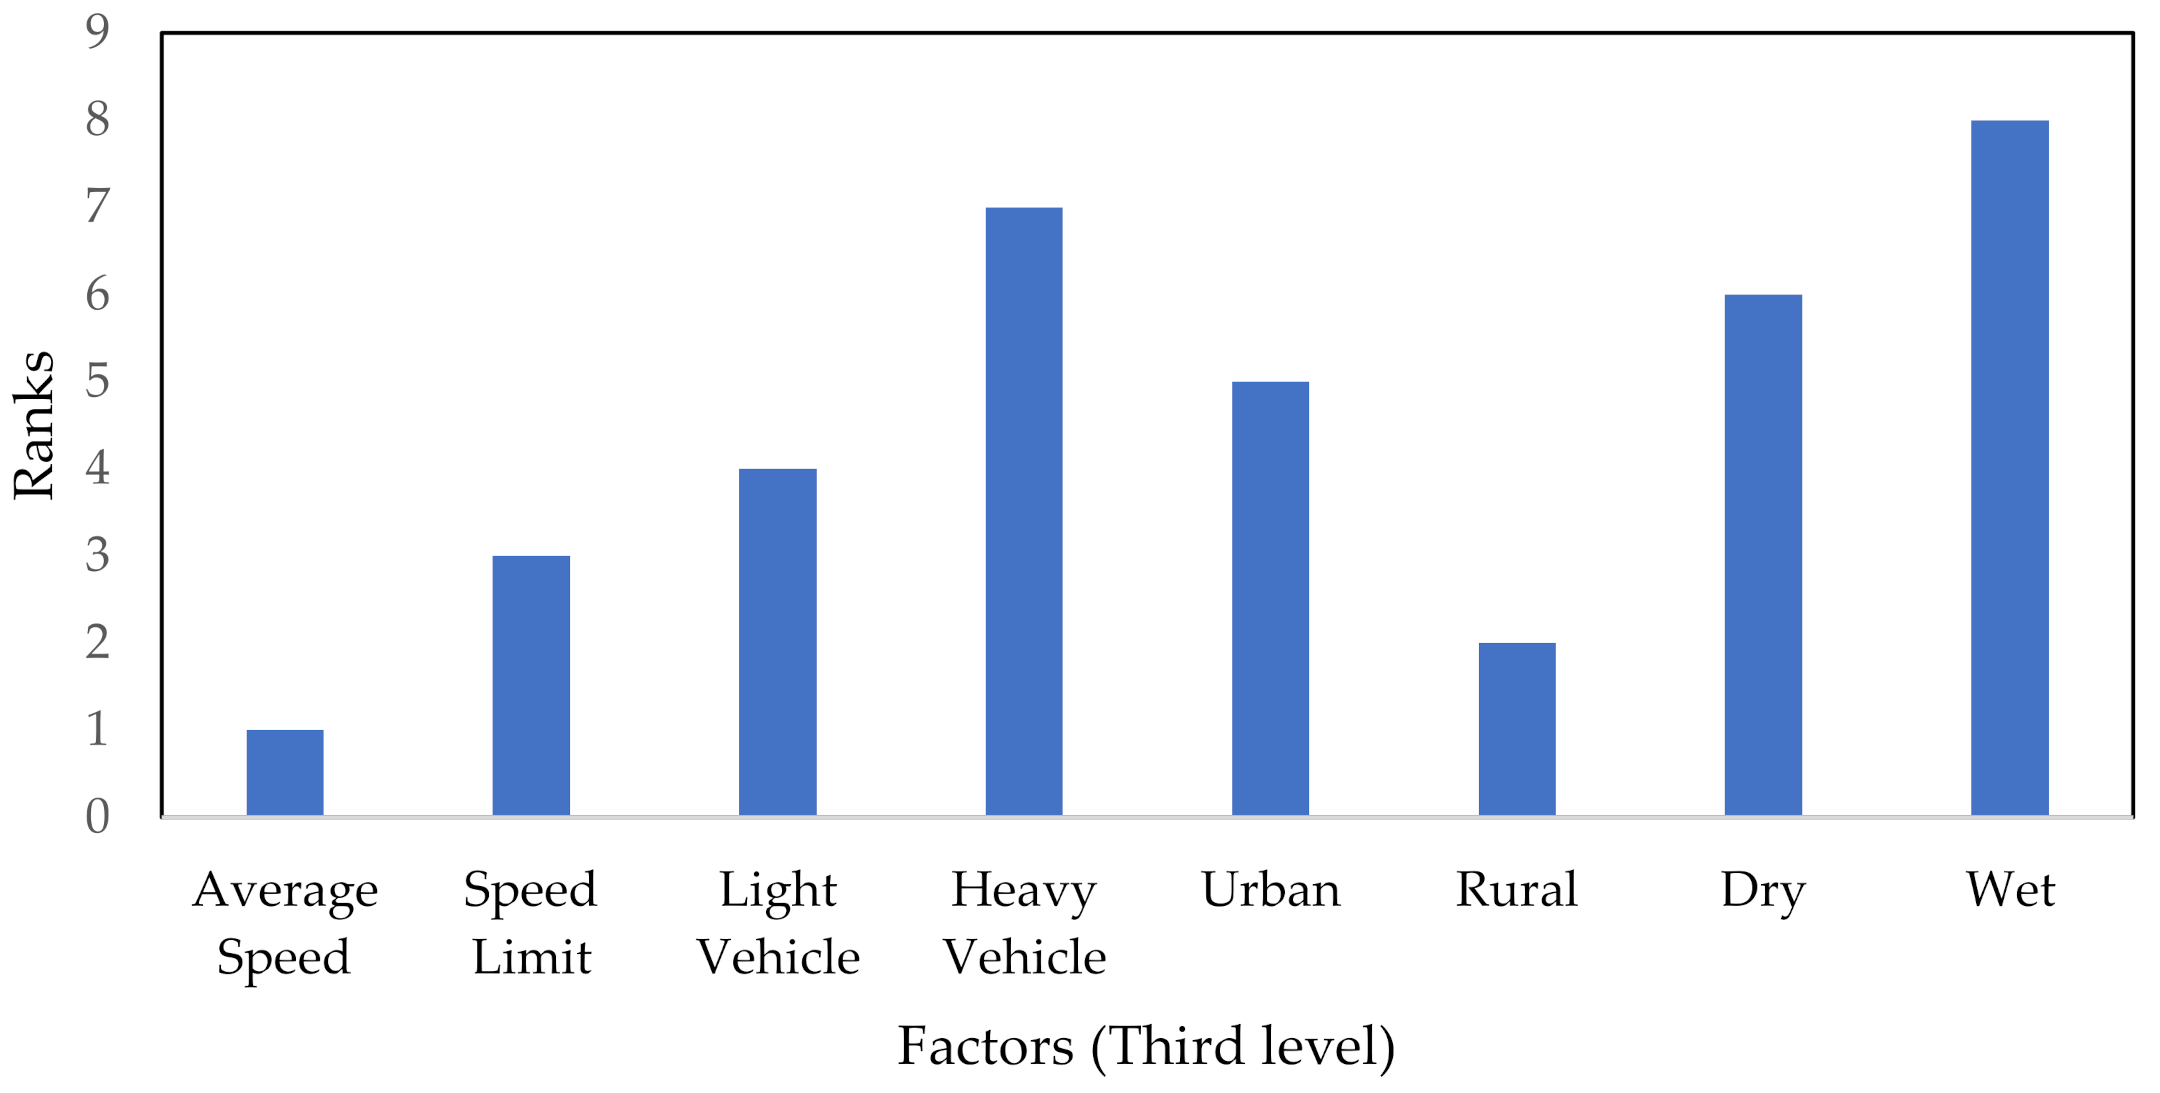
Step 6: The final weight scores considering branch connections are depicted in Figure 3, Figure 4 and Figure 5.
Step 7: The sensitivity analysis was also conducted.
The AHP–BWM procedure prioritized the specified factors affecting frequent lane-changing based on measured weight scores, as presented in Table 7. It is important to notice that the weights achieved using this model are comparable and the differences between the specific values are slight. For level 1, the highest weight score observed is “0.5148” for the factor “traffic characteristics” and the lowest weight score observed is “0.0884” for the factor “light conditions”. For level 2, the highest weight score observed is “0.8396” for the factor “daytime light” and the lowest weight score observed is “0.1075” for the factor “traffic composition”. For level 3, the highest weight score observed is “0.7199” for the factor “dry” and the lowest weight score observed is “0.2801” for the factor “wet”.
For level 1, the AHP procedure was applied to prioritize the specified factors affecting frequent lane-changing based on measured weight scores, as shown in Figure 3. The ranking results found “traffic characteristics” as the most significant factor, followed by “human” as a second-rank factor. A previous study observed the significant influence of stated traffic characteristics on lane-changing [63]. In comparison, the ranking results found “light conditions” as the least important factor based on evaluators’ response data. A recent study connected elevated traffic competence and safety with the least light conditional effect [64].
For level 2, the model was implemented to prioritize the observed factors affecting frequent lane-changing based on final weight scores. The model results evaluated “traffic volume” as first-rank factor, followed by “speed” as second-rank factor, as compared to other specified factors. Previous studies analyzed that traffic volume has a significant impact on the following gap and overtaking frequency [65,66], which are inherently related to lane-changing. Recent simulation-based studies found that speed has a major effect on lane-changing related to road safety, such as average speed variation, speed distribution [26], and driving speed exceeding speed limits [67]. In addition, the model results indicate “night light” as the least important factor, followed by “illiteracy” as the second least important factor. The previous study depicted that drivers are less likely to get involved in risky attitudes on multi-lane roads under bad-light situations [68]. Other factors have their ranking based on weight scores, as shown in Figure 4.
For level 3, the AHP–BWM model was also applied for prioritization of specified factors based on measured weight scores, as presented in Figure 5. The model results showed “average speed” as first-rank factor affecting frequent lane-changing. Average speed was extracted as one of the key variables of lane-change maneuvers based on the driving simulation data [69]. The factor “rural” was observed as second-rank factor, as compared to other nominated factors. In addition, a study based on crash data revealed that the proportion of lane-change crashes is higher on rural roads [11]. Furthermore, the model results indicate “wet” as the least important factor affecting frequent lane-changing, followed by “heavy vehicle” as second least important factor. A previous study found that, in light wet surface conditions, the traffic flows are smaller and the distance between vehicles (gap) is larger [70].
The study further compared the ranks of factors for the adopted AHP–BWM model and conventional AHP approach based on final measured weights. For level 2, the comparison results show the same ranks based on final weight scores for all observed factors based on specified applications, as shown in Table 8. For level 3, the comparison results for the adopted AHP–BWM model and conventional AHP approach show different ranks based on final measured weights for factors such as “average speed” and “rural” based on measured weight scores, as presented in Table 9.
In order to measure the similarity of two ratings in the MCDM methodologies, the following formula was adopted [71]:
W S = 1 i = 1 n 2 R x i .   R x i R y i m a x 1 R x i , N R x i
where WS is a value of similarity coefficient, N is a length of ranking and Rxi and Ryi indicate the place in the ranking for ith element in, respectively, ranking x and ranking y.
For the second level (Table 8), the ranking is same for both applied methods; however, there is a difference in the third level (Table 9), where WS = 0.8869. This means that the similarity is significantly different which explains the superiority of the proposed approach.

4. Discussion

Frequent lane changes by road users can cause serious traffic issues. It has been considered very important to identify and prioritize the critical factors which could affect the frequency of lane changes. For evaluation purposes, the study utilized the combined AHP–BWM model to analyze the specified factors in a three-level hierarchical arrangement. This proposed model performs a better evaluation with a lower number of PCs than the conventional AHP. The final weights obtained from the conducted model are highly consistent as the adopted model gives more reliable results than the conventional AHP approach. In the conventional AHP, the consistency ratio for clusters consists of five elements or more as a measure to examine if the comparisons are consistent or not. While, in the BWM, the consistency ratio is used to check the degree of reliability. The current study adopted the input-based consistency threshold to measure the consistency of comparisons. Furthermore, the adopted model facilitates specialists in understanding the entire evaluation procedure. This consideration was justified by our survey results. The proposed combined AHP–BWM approach could help decision-makers to focus on highlighted significant factors affecting frequent lane-changing to improve road safety. Previous studies recommended the application of lane-change assisting systems to improve active safety and reduce traffic accidents due to frequent lane-changing [72].
Achieving sustainable traffic safety in the real world is a complicated issue that includes a large number of criteria and the interdependent characteristics of which can vary for all significant traffic engineering elements (e.g., the human, road and vehicles). Another fact to reflect upon is that decision-making concerning traffic safety should be approached by decision-makers via different routes. Hence, while the optimum solution to a problem is very challenging to find out, finding a solution for target levels or objectives is a better decision. These facts make it difficult to resolve the problem of attaining a sustainable traffic safety using traditional MCDM approaches. Thus, decision-making should consider the complexity of the real world. Some authors [73,74,75,76] utilized a new hybrid MCDM system (DEMATEL-based ANP with VIKOR) in an effort to resolve the limits of traditional MCDM approaches and attain sustainable development tactics in other fields. In the study [77], a new hybrid model which integrates the fuzzy step-wise weight assessment ratio analysis (FSWARA) and the fuzzy best–worst method (FBWM) was created for the selection of equipment in a container terminal. Furthermore, the authors in [78] utilized a fuzzy pivot pairwise relative criteria importance assessment (Fuzzy PIPRECIA) technique to evaluate and rank the road transportation risk elements in the Giresun province.

5. Conclusions

The assessment of transportation and traffic risk is a very common and important procedure that can aid participants in avoiding conflicts and risk conditions. The findings of this research highlighted the most significant factors which could cause frequent lane-change behavior and further contribute to a negative impact on road safety. Therefore, this categorization of factors will help stakeholders to decide the strategic policy for safe lane-changing to improve road safety. Considering the high-level significance of traffic volume and average speed for lane-changing, the study results depict that there is a need for the advancement of more efficient countermeasures to be adopted by traffic administration departments. Therefore, it is essential to promote safety policies, which can reduce the high traffic volume and speed variation. In addition, the study recommends the use of developed vehicle technologies such as vehicle-to-vehicle communication and automatic vehicles (AVs) to concentrate on the collaborative contact between vehicles which may mitigate these frequent lane-changing issues. This study considers the factors affecting lane-changing based on their significance found in previous studies. However, advanced simulation tools can be utilized to consider the important factors affecting frequent lane-changing. Furthermore, an advanced comprehensive study needs to be performed on a large extent by conducting a sensitivity analysis to check the constancy of the ranking achieved by the recommended methods. Moreover, the use of the fuzzy AHP approach should be considered to incorporate uncertainty and ambiguity into the evaluation procedure based on subjective decisions. Therefore, the individual can focus on the presentation of several types of fuzzy set theory for solving the issue. In addition, future research can be performed to assess the relationship between socio-demographic characteristics and their involvement in frequent lane-changing.

Author Contributions

Conceptualization, D.F., S.M. and F.M.B.; methodology, S.M.; software, S.M.; validation, R.F.T., A.J. and D.F.; formal analysis, S.M. and Y.A.; investigation, A.J. and F.M.B.; resources, Y.A. and M.A.; data curation, D.F. and R.F.T.; writing—original draft preparation, D.F. and A.J.; writing—review and editing, S.M., F.M.B. and M.A.; visualization, R.F.T.; supervision, Y.A. and M.A.; project administration, F.M.B.; funding acquisition, F.M.B., Y.A. and M.A. All authors have read and agreed to the published version of the manuscript.

Funding

This research received no external funding.

Institutional Review Board Statement

This survey, designed by the Department of Transport Technology and Economics at Budapest University of Technology and Economics, was used to conduct a study on “Assessment of Significant Factors affecting Frequent Lane-changing related to Road Safety: An Integrated Approach of AHP–BWM model”. The principal aim of this paper is to estimate and prioritize the designated critical factors and sub-factors affecting lane-changing based on participants’ responses to a designed questionnaire survey. This study was designed for academic research only, it does not participate in any business activities; no personal information will be disclosed. The questionnaire survey was carried out on a professional online Google form and delivered to faculty and staff members of the above-specified department. The respondents were informed about the survey initiatives/objectives. The respondents were also assured on the confidentiality and anonymity of their responses, which were strictly ensured. Participation was completely voluntary and the participants were not compensated in anyway.

Informed Consent Statement

Not applicable.

Data Availability Statement

All the essential data are presented in the manuscript.

Acknowledgments

The authors wish to acknowledge and appreciate the support of Imam Abdulrahman Bin Faisal University, Saudi Arabia and Saudi Aramco Chair for Traffic, in carrying out this research.

Conflicts of Interest

The authors declare no conflict of interest.

References

  1. World Health Organization. Global Status Report on Road Safety 2018: Summary; WHO: Geneva, Switzerland, 2018. [Google Scholar]
  2. Valette, L. Road Safety: New Statistics Call for Fresh Efforts to Save Lives on EU Roads; European Commission Press: Brussels, Belgium, 2016. [Google Scholar]
  3. E.U. Commission. Road Safety Facts & Figures; EU Commission: Brussels, Belgium, 2019. [Google Scholar]
  4. Janstrup, K.H. Road Safety Annual Report 2017; Technical University of Denmark: Lyngby, Denmark, 2017. [Google Scholar]
  5. Jamal, A.; Zahid, M.; Rahman, M.T.; Al-Ahmadi, H.M.; Almoshaogeh, M.; Farooq, D.; Ahmad, M. Injury Severity Prediction of Traffic Crashes with Ensemble Machine Learning Techniques: A Comparative Study. Int. J. Inj. Control. Saf. Promot. 2021, 1–20. [Google Scholar] [CrossRef]
  6. Zahid, M.; Chen, Y.; Khan, S.; Jamal, A.; Ijaz, M.; Ahmed, T. Predicting Risky and Aggressive Driving Behavior among Taxi Drivers: Do Spatio-Temporal Attributes Matter? Int. J. Environ. Res. Public Health 2020, 17, 3937. [Google Scholar] [CrossRef]
  7. NHTSA. National Motor Vehicle Crash Causation Survey: Report to Congress; National Highway Traffic Safety Administration: Washington, DC, USA, 2008.
  8. Lewin, I. Driver Training: A Perceptual-Motor Skill Approach. Ergonomics 1982, 25, 917–924. [Google Scholar] [CrossRef] [PubMed]
  9. Rumar, K. The Role of Perceptual and Cognitive Filters in Observed Behavior. Human Behavior and Traffic Safety; Springer: Berlin, Germany, 1985; pp. 151–170. [Google Scholar]
  10. Rahman, M.T.; Jamal, A.; Al-Ahmadi, H.M. Examining Hotspots of Traffic Collisions and Their Spatial Relationships with Land Use: A GIS-Based GeographicallyWeighted Regression Approach for Dammam, Saudi Arabia. ISPRS Int. J. Geo-Inf. 2020, 9, 540. [Google Scholar] [CrossRef]
  11. Zahid, M.; Chen, Y.; Jamal, A.; Al-Ahmadi, H.M.; Al-Ofi, A.K. Adopting Machine Learning and Spatial Analysis Techniques for Driver Risk Assessment: Insights from a Case Study. Int. J. Environ. Res. Public Health 2020, 17, 5193. [Google Scholar] [CrossRef]
  12. Jamal, A.; Umer, W. Exploring the Injury Severity Risk Factors in Fatal Crashes with Neural Network. Int. J. Environ. Res. Public Health 2020, 17, 7466. [Google Scholar] [CrossRef] [PubMed]
  13. De Oña, J.; de Oña, R.; Eboli, L.; Forciniti, C.; Mazzulla, G. How to Identify the Key Factors That Affect Driver Perception of Accident Risk. A Comparison between Italian and Spanish Driver Behavior. Accid. Anal. Prev. 2014, 73, 225–235. [Google Scholar] [CrossRef] [PubMed]
  14. Al-Ahmadi, H.M.; Jamal, A.; Ahmed, T.; Rahman, M.T.; Reza, I.; Farooq, D. Calibrating the Highway Safety Manual Predictive Models for Multilane Rural Highway Segments in Saudi Arabia. Arab. J. Sci. Eng. 2021, 1–15. [Google Scholar] [CrossRef]
  15. Ahmed, T.; Moeinaddini, M.; Almoshaogeh, M.; Jamal, A.; Nawaz, I.; Alharbi, F. A New Pedestrian Crossing Level of Service (PCLOS) Method for Promoting Safe Pedestrian Crossing in Urban Areas. Int. J. Environ. Res. Public Health 2021, 18, 8813. [Google Scholar] [CrossRef] [PubMed]
  16. Wang, J.; Ding, J.-X.; Shi, Q.; Kühne, R.D. Lane-Changing Behavior and Its Effect on Energy Dissipation Using Full Velocity Difference Model. Int. J. Mod. Phys. C. 2016, 27, 1650013. [Google Scholar] [CrossRef] [Green Version]
  17. Bernard, K. Accidents Nationwide Associated with Lane-Changing. 2017. Available online: https://www.4injured.com/blog/accidents-lane-changing-risks/ (accessed on 21 August 2020).
  18. Jamal, A. The Dilemma of Road Safety in the Eastern Provice of Sausi Arabia: Consequences and Prevention Strategies. Int. J. Environ. Res. Public Health 2020, 5, 1–23. [Google Scholar]
  19. Jamal, A.; Mahmood, T.; Riaz, M.; Al-Ahmadi, H.M. GLM-Based Flexible Monitoring Methods: An Application to Real-Time Highway Safety Surveillance. Symmetry 2021, 13, 362. [Google Scholar] [CrossRef]
  20. Kesting, A.; Treiber, M.; Helbing, D. General Lane-Changing Model MOBIL for Car-Following Models. Transp. Res. Rec. 2007, 1999, 86–94. [Google Scholar] [CrossRef] [Green Version]
  21. Wang, M.; Hoogendoorn, S.P.; Daamen, W.; van Arem, B.; Happee, R. Game Theoretic Approach for Predictive Lane-Changing and Car-Following Control. Transp. Res. Part C Emerg. Technol. 2015, 58, 73–92. [Google Scholar] [CrossRef]
  22. Wang, X.; Zhang, J.; Liu, Y.; Yunyun, W.; Wang, F.; Wang, J. The Drivers’ Lane Selection Model Based on Mixed Fuzzy Many-Person Multi-Objective Non-Cooperative Game. J. Intell. Fuzzy Syst. 2017, 32, 4235–4246. [Google Scholar] [CrossRef]
  23. Yu, H.; Tseng, H.E.; Langari, R. A Human-like Game Theory-Based Controller for Automatic Lane Changing. Transp. Res. Part C Emerg. Technol. 2018, 88, 140–158. [Google Scholar] [CrossRef]
  24. Zheng, J.; Suzuki, K.; Fujita, M. Predicting Driver’s Lane-Changing Decisions Using a Neural Network Model. Simul. Model. Pract. Theory 2014, 42, 73–83. [Google Scholar] [CrossRef]
  25. Li, K.; Wang, X.; Xu, Y.; Wang, J. Lane Changing Intention Recognition Based on Speech Recognition Models. Transp. Res. Part C Emerg. Technol. 2016, 69, 497–514. [Google Scholar] [CrossRef]
  26. Farooq, D.; Juhasz, J. Simulation-Based Analysis of the Effect of Significant Traffic Parameters on Lane Changing for Driving Logic “Cautious” on a Freeway. Sustainability 2019, 11, 5976. [Google Scholar] [CrossRef] [Green Version]
  27. Long, X.; Zhang, L.; Liu, S.; Wang, J. Research on Decision-Making Behavior of Discretionary Lane-Changing Based on Cumulative Prospect Theory. J. Adv. Transp. 2020, 2020, 1291342. [Google Scholar] [CrossRef]
  28. Li, A.; Sun, L.; Zhan, W.; Tomizuka, M. Multiple Criteria Decision-Making for Lane-Change Model. Available online: https://arxiv.org/abs/1910.10142 (accessed on 28 July 2021).
  29. Duleba, S.; Moslem, S. Examining Pareto Optimality in Analytic Hierarchy Process on Real Data: An Application in Public Transport Service Development. Expert Syst. Appl. 2019, 116, 21–30. [Google Scholar] [CrossRef]
  30. Pourghasemi, H.R.; Pradhan, B.; Gokceoglu, C. Application of Fuzzy Logic and Analytical Hierarchy Process (AHP) to Landslide Susceptibility Mapping at Haraz Watershed, Iran. Nat. Hazards 2012, 63, 965–996. [Google Scholar] [CrossRef]
  31. Ghorbanzadeh, O.; Feizizadeh, B.; Blaschke, T. An Interval Matrix Method Used to Optimize the Decision Matrix in AHP Technique for Land Subsidence Susceptibility Mapping. Environ. Earth Sci. 2018, 77, 1–19. [Google Scholar] [CrossRef]
  32. Moslem, S.; Gul, M.; Farooq, D.; Celik, E.; Ghorbanzadeh, O.; Blaschke, T. An Integrated Approach of Best-Worst Method (Bwm) and Triangular Fuzzy Sets for Evaluating Driver Behavior Factors Related to Road Safety. Mathematics 2020, 8, 414. [Google Scholar] [CrossRef] [Green Version]
  33. Ghoushchi, S.J.; Yousefi, S.; Khazaeili, M. An Extended FMEA Approach Based on the Z-MOORA and Fuzzy BWM for Prioritization of Failures. Appl. Soft Comput. 2019, 81, 105505. [Google Scholar] [CrossRef]
  34. Chang, T.-W.; Lo, H.-W.; Chen, K.-Y.; Liou, J.J. A Novel FMEA Model Based on Rough BWM and Rough TOPSIS-AL for Risk. Assessment. Math. 2019, 7, 874. [Google Scholar] [CrossRef] [Green Version]
  35. Lo, H.-W.; Liou, J.J. A Novel Multiple-Criteria Decision-Making-Based FMEA Model for Risk Assessment. Appl. Soft Comput. 2018, 73, 684–696. [Google Scholar] [CrossRef]
  36. Nie, R.; Tian, Z.; Wang, X.; Wang, J.; Wang, T. Risk Evaluation by FMEA of Supercritical Water Gasification System Using Multi-Granular Linguistic Distribution Assessment. Knowl.-Based Syst. 2018, 162, 185–201. [Google Scholar] [CrossRef]
  37. Rezaei, J. Best-Worst Multi-Criteria Decision-Making Method. Omega 2015, 53, 49–57. [Google Scholar] [CrossRef]
  38. Rezaei, J. Best-Worst Multi-Criteria Decision-Making Method: Some Properties and a Linear Model. Omega 2016, 64, 126–130. [Google Scholar] [CrossRef]
  39. Shekhovtsov, A.; Rehman, N.; Faizi, S.; Salabun, W. On the Analytic Hierarchy Process Structure in Group Decision-Making Using Incomplete Fuzzy Information with Applications. Symmetry 2021, 13, 609. [Google Scholar]
  40. Faizi, S.; Sałabun, W.; Nawaz, S.; Rehman, A.; Wątróbski, J. Best-Worst Method and Hamacher Aggregation Operations for Intuitionistic 2-Tuple Linguistic Sets. Expert Syst. Appl. 2021, 181, 115088. [Google Scholar] [CrossRef]
  41. Moslem, S.; Farooq, D.; Karasan, A. Evaluating driver behavior criteria connected to road safety by considering 2-dimensional uncertain linguistic data. In Proceedings of the International Conference on Intelligent and Fuzzy Systems, Izmir, Turkey, 24–26 August 2021; Springer: Berlin, Germany, 2021; pp. 388–399. [Google Scholar]
  42. Shawky, M. Factors Affecting Lane Change Crashes. IATSS Res. 2020, 44, 155–161. [Google Scholar] [CrossRef]
  43. Almoshaogeh, M.; Abdulrehman, R.; Haider, H.; Alharbi, F.; Jamal, A.; Alarifi, S.; Shafiquzzaman, M. Traffic Accident Risk Assessment Framework for Qassim, Saudi Arabia: Evaluating the Impact of Speed Cameras. Appl. Sci. 2021, 11, 6682. [Google Scholar] [CrossRef]
  44. Farooq, D.; Moslem, S.; Duleba, S. Evaluation of Driver Behavior Criteria for Evolution of Sustainable Traffic Safety. Sustainability 2019, 11, 3142. [Google Scholar] [CrossRef] [Green Version]
  45. Bener, A.; Al Maadid, M.G.; Özkan, T.; Al-Bast, D.A.; Diyab, K.N.; Lajunen, T. The Impact of Four-Wheel Drive on Risky Driver Behaviours and Road Traffic Accidents. Transp. Res. Part F Traffic Psychol. Behav. 2008, 11, 324–333. [Google Scholar] [CrossRef]
  46. Wåhlberg, A.; Dorn, L.; Kline, T. The Manchester Driver Behaviour Questionnaire as a Predictor of Road Traffic Accidents. Theor. Issues Ergon. Sci. 2011, 12, 66–86. [Google Scholar] [CrossRef] [Green Version]
  47. Driving Errors, Driving Violations and Accident Involvement. Google Scholar. Available online: https://scholar.google.com/scholar?hl=en&as_sdt=0%2C5&q=Driving+errors%2C+driving+violations+and+accident+involvement&btnG= (accessed on 25 August 2021).
  48. Reason, J.; Manstead, A.; Stradling, S.; Baxter, J.; Campbell, K. Errors and Violations on the Roads: A Real Distinction? Ergonomics 1990, 33, 1315–1332. [Google Scholar] [CrossRef]
  49. Solomon, M. Groupthink versus The Wisdom of Crowds: The Social Epistemology of Deliberation and Dissent. South. J. Philos. 2006, 44, 28–42. [Google Scholar] [CrossRef]
  50. National Highway Traffic Safety Administration. A Comprehensive Examination of Naturalistic Lane-Change; National Highway Traffic Safety Administration: Washington, DC, USA, 2004.
  51. Ghasemi Noughabi, M.; Sadeghi, A.; Mohammadzadeh Moghaddam, A.; Jalili Qazizadeh, M. Fatigue Risk Management: Assessing and Ranking the Factors Affecting the Degree of Fatigue and Sleepiness of Heavy-Vehicle Drivers Using TOPSIS and Statistical Analyses. Iran. J. Sci. Technol. Trans. Civ. Eng. 2020, 44, 1345–1357. [Google Scholar] [CrossRef]
  52. Fitch, G.M.; Lee, S.E.; Klauer, S.; Hankey, J.; Sudweeks, J. Analysis of Lane-Change Crashes and Near-Crashes” Department of Transportation; National Highway Traffic Safety Administration: Washington, DC, USA, 2009; pp. 1–232.
  53. Park, H.; Oh, C.; Moon, J.; Kim, S. Development of a Lane Change Risk Index Using Vehicle Trajectory Data. Accid. Anal. Prev. 2018, 110, 1–8. [Google Scholar] [CrossRef]
  54. Zhao, D.; Peng, H.; Nobukawa, K.; Bao, S.; David, L.; Pan, C.S. Analysis of Mandatory and Discretionary Lane Change Behaviors for Heavy Trucks. Available online: https://arxiv.org/abs/1707.09411 (accessed on 9 August 2021).
  55. Subramanian, N.; Ramanathan, R. A Review of Applications of Analytic Hierarchy Process in Operations Management. Int. J. Prod. Econ. 2012, 138, 215–241. [Google Scholar] [CrossRef]
  56. Krmac, E.; Djordjević, B. An Evaluation of Train Control Information Systems for Sustainable Railway Using the Analytic Hierarchy Process (AHP) Model. Eur. Transp. Res. Rev. 2017, 9, 35. [Google Scholar] [CrossRef] [Green Version]
  57. Moslem, S.; Ghorbanzadeh, O.; Blaschke, T.; Duleba, S. Analysing Stakeholder Consensus for a Sustainable Transport Development Decision by the Fuzzy AHP and Interval AHP. Sustainability 2019, 11, 3271. [Google Scholar] [CrossRef] [Green Version]
  58. Darko, A.; Chan, A.P.C.; Ameyaw, E.E.; Owusu, E.K.; Pärn, E.; Edwards, D.J. Review of Application of Analytic Hierarchy Process (AHP) in Construction. Int. J. Constr. Manag. 2019, 19, 436–452. [Google Scholar] [CrossRef]
  59. Saaty, T.L. A Scaling Method for Priorities in Hierarchical Structures. J. Math. Psychol. 1977, 15, 234–281. [Google Scholar] [CrossRef]
  60. Rezaei, J.; Kothadiya, O.; Tavasszy, L.; Kroesen, M. Quality Assessment of Airline Baggage Handling Systems Using SERVQUAL and BWM. Tour. Manag. 2018, 66, 85–93. [Google Scholar] [CrossRef]
  61. Mi, X.; Tang, M.; Liao, H.; Shen, W.; Lev, B. The State-of-the-Art Survey on Integrations and Applications of the Best Worst Method in Decision Making: Why, What, What for and What’s Next? Omega 2019, 87, 205–225. [Google Scholar] [CrossRef]
  62. Liang, F.; Brunelli, M.; Rezaei, J. Consistency Issues in the Best Worst Method: Measurements and Thresholds. Omega 2020, 96, 102175. [Google Scholar] [CrossRef]
  63. Moridpour, S.; Rose, G.; Sarvi, M. Effect of Surrounding Traffic Characteristics on Lane Changing Behavior. J. Transp. Eng. 2010, 136, 973–985. [Google Scholar] [CrossRef]
  64. Li, X.; Sun, J.-Q. Studies of Vehicle Lane-Changing Dynamics and Its Effect on Traffic Efficiency, Safety and Environmental Impact. Phys. A Stat. Mech. Its Appl. 2017, 467, 41–58. [Google Scholar] [CrossRef]
  65. Bella, F. How Traffic Conditions Affect Driver Behavior in Passing Meneuver. Adv. Transp. Stud. Int. J. 2011, 113–126. [Google Scholar]
  66. Mizanur, R.M.; Nakamura, F. A study on passing-overtaking characteristics and level of service of heterogeneous traffic flow. J. East. Asia Soc. Transp. Stud. 2005, 6, 1471–1483. [Google Scholar]
  67. Danish, F.; Juhasz, J. An Investigation of Speed Variance Effect on Lane-Changing for Driving Logic “Cautious” on Highways. Adv. Transp. Stud. Int. J. 2020, 51, 109–120. [Google Scholar]
  68. Weng, J.; Meng, Q. Effects of Environment, Vehicle and Driver Characteristics on Risky Driving Behavior at Work Zones. Saf. Sci. 2012, 50, 1034–1042. [Google Scholar] [CrossRef]
  69. Yang, L.; Li, X.; Guan, W.; Zhang, H.M.; Fan, L. Effect of Traffic Density on Drivers’ Lane Change and Overtaking Maneuvers in Freeway Situation—A Driving Simulator–Based Study. Traffic Inj. Prev. 2018, 19, 594–600. [Google Scholar] [CrossRef] [PubMed] [Green Version]
  70. Lee, J.; Park, B.B. Determining Lane Use Distributions Using Basic Freeway Segment Density Measures. J. Transp. Eng. 2012, 138, 210–217. [Google Scholar] [CrossRef]
  71. Sałabun, W.; Urbaniak, K. A New Coefficient of Rankings Similarity in Decision-Making Problems. In Proceedings of the International Conference on Computational Science, Amsterdam, The Netherlands, 3–5 June 2020; Springer: Berlin, Germany, 2020; pp. 632–645. [Google Scholar]
  72. Ding, T.; Li, X.; Zheng, L.; Hao, Z. Research on Safety Lane Change Warning Method Based on Potential Angle Collision Point. J. Adv. Transp. 2019, 2019, 1281425. [Google Scholar] [CrossRef]
  73. Lu, I.-Y.; Kuo, T.; Lin, T.-S.; Tzeng, G.-H.; Huang, S.-L. Multicriteria Decision Analysis to Develop Effective Sustainable Development Strategies for Enhancing Competitive Advantages: Case of the TFT-LCD Industry in Taiwan. Sustainability 2016, 8, 646. [Google Scholar] [CrossRef] [Green Version]
  74. Huang, K.-W.; Huang, J.-H.; Tzeng, G.-H. New Hybrid Multiple Attribute Decision-Making Model for Improving Competence Sets: Enhancing a Company’s Core Competitiveness. Sustainability 2016, 8, 175. [Google Scholar] [CrossRef] [Green Version]
  75. Liou, J.J.; Tsai, C.-Y.; Lin, R.-H.; Tzeng, G.-H. A Modified VIKOR Multiple-Criteria Decision Method for Improving Domestic Airlines Service Quality. J. Air Transp. Manag. 2011, 17, 57–61. [Google Scholar] [CrossRef]
  76. Chang, D.-S.; Chen, S.-H.; Hsu, C.-W.; Hu, A.H.; Tzeng, G.-H. Evaluation Framework for Alternative Fuel Vehicles: Sustainable Development Perspective. Sustainability 2015, 7, 11570–11594. [Google Scholar] [CrossRef] [Green Version]
  77. Dragan Krstić, M.; Radoman Tadić, S.; Brnjac, N.; Zečević, S. Intermodal Terminal Handling Equipment Selection Using a Fuzzy Multi-Criteria Decision-Making Model. Promet-Traffic Transp. 2019, 31, 89–100. [Google Scholar] [CrossRef]
  78. Memiş, S.; Demir, E.; Karamaşa, Ç.; Korucuk, S. Prioritization of Road Transportation Risks: An Application in Giresun Province. Oper. Res. Eng. Sci.Theory Appl. 2020, 3, 111–126. [Google Scholar] [CrossRef]
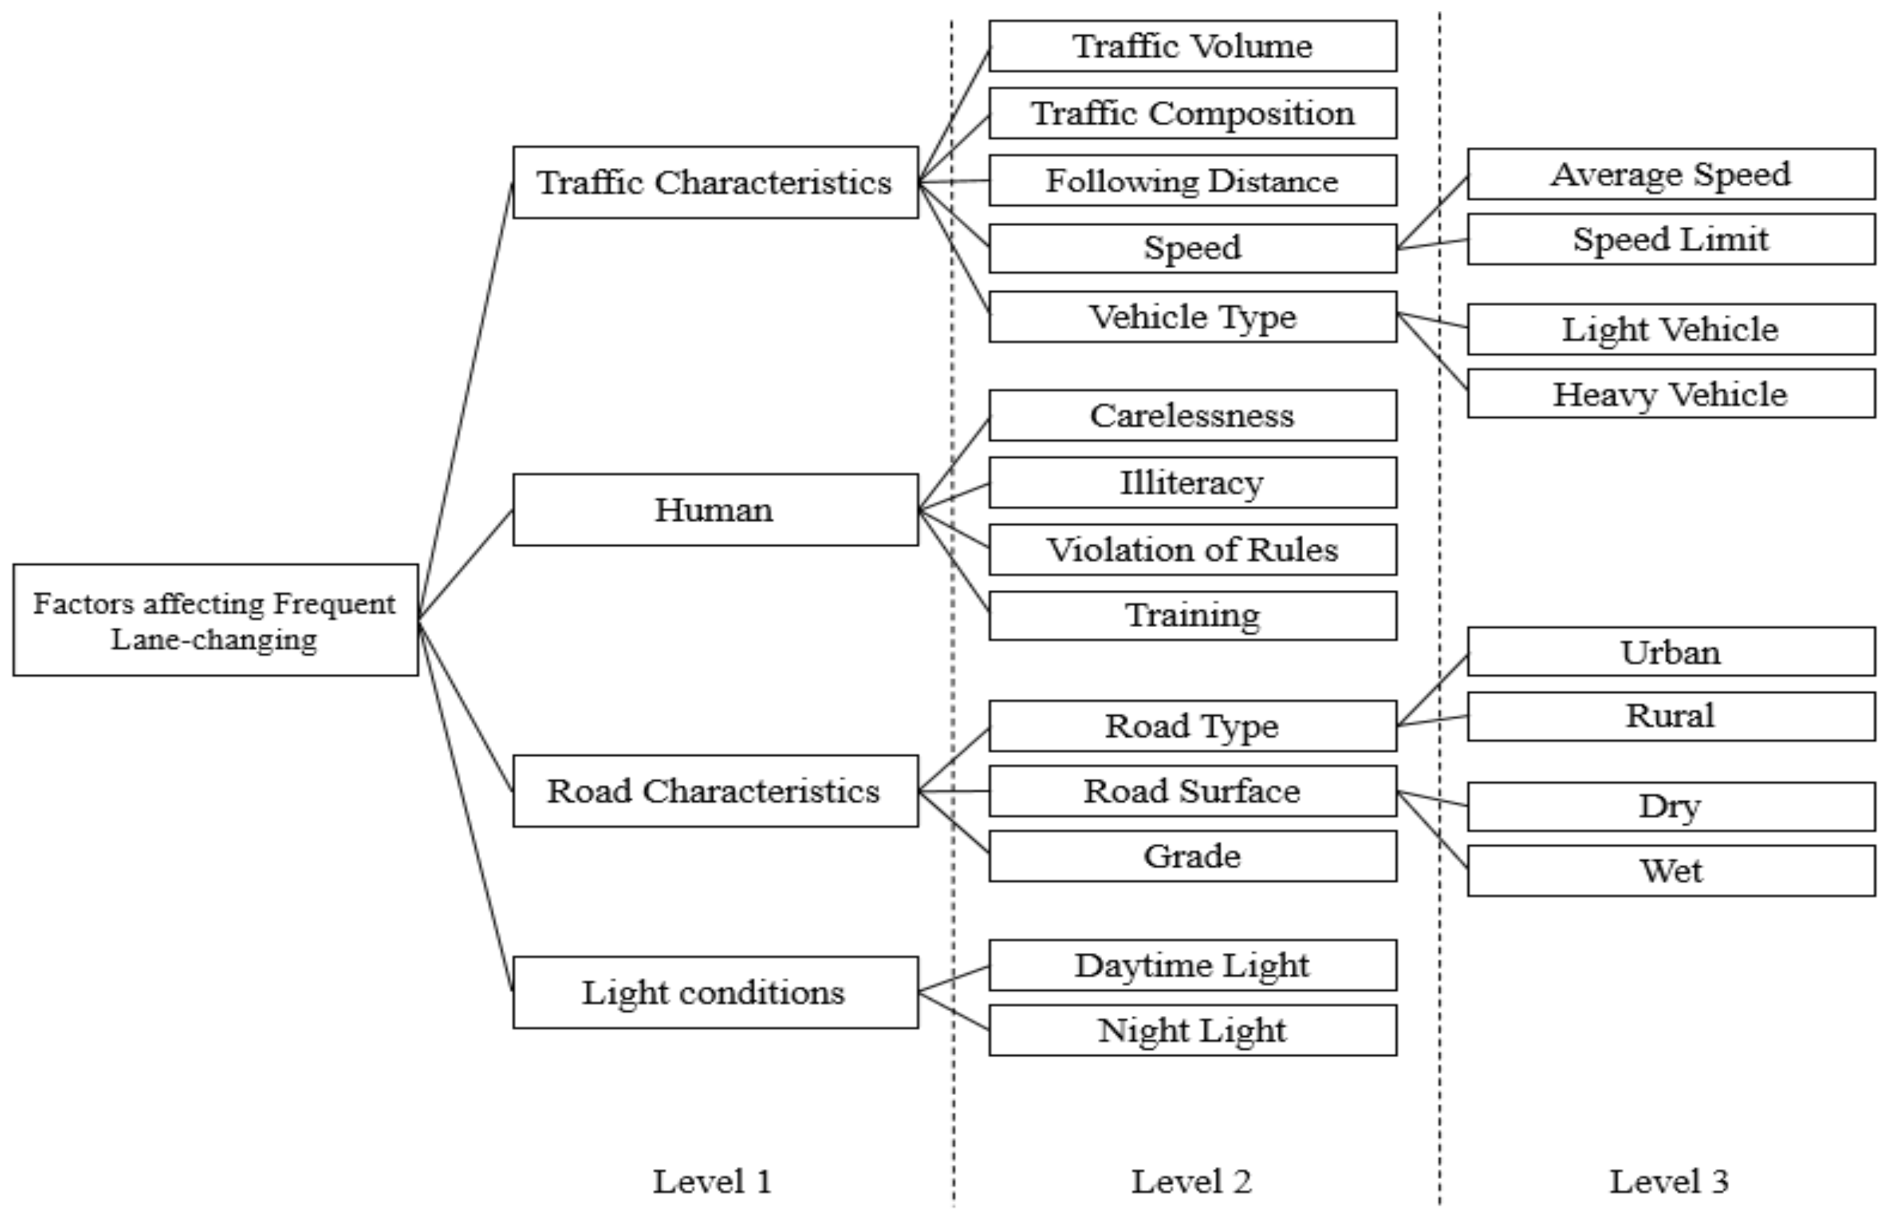
Figure 1. Three-level hierarchical structure of the factors affecting frequent lane-changing (Lane-change model).
Ijerph 18 10628 g001
Figure 2. The ranks of specified factors based on final aggregated weights obtained using BWM.
Ijerph 18 10628 g002
Figure 3. The ranks of specified factors in the first level based on the AHP approach.
Ijerph 18 10628 g003
Figure 4. The ranks of specified factors in the second level based on the AHP–BWM model.
Ijerph 18 10628 g004
Figure 5. The ranks of specified factors in the third level based on the AHP–BWM model.
Ijerph 18 10628 g005
Table 1. Sample characteristics of participants.
VariablesFrequencyPercentage (%)
N49100
Age (years)
18–301735
31–502245
51 above1020
Gender
Male 3878
Female1122
Duration of driving license (years)
01–051327
06–152857
16–30816
Education level
Bachelor’s degree2041
MSc/PhD2959
Working status
Student2245
Job2755
Table 2. DBQ survey example for level 1 (AHP model).
Compare the Importance of Specified Factors with Respect to Frequent Lane-Changing
Traffic Characteristics98765432123456789Human
Traffic Characteristics98765432123456789Road Characteristics
Traffic Characteristics98765432123456789Light conditions
Human98765432123456789Road Characteristics
Human98765432123456789Light conditions
Road Characteristics98765432123456789Light conditions
Table 3. DBQ survey (BWM model).
Please, Select the Most Important Factor from Specified “Traffic Characteristics” Factors and Compare It with Other Factors by Considering Lane-Changing Phenomenon Using a (1–9) Judgment Scale
Traffic CharacteristicsTraffic VolumeTraffic CompositionFollowing DistanceSpeedVehicle Type
Most important factor:
(………….…)
Less important factor:
(………….…)
Table 4. Saaty’s 1–9 scale for evaluating factors in the PCM.
Numerical Judgment ScaleVerbal Judgment Scale (Definition)
1Equal significance
2Weak importance
3Moderate importance
4More than moderate importance
5Strong significance
6More than strong significance
7Very strong importance
8Extremely important
9Absolute significance
Table 5. Random index based on matrix dimensions (Saaty, 1977).
n345678910
RI0.580.91.121.241.321.411.451.49
Table 6. The threshold for different combinations of scaling and number of factors employing an input-based consistency measurement.
ScaleFactors
3456789
30.16670.16670.16670.16670.16670.16670.1667
40.11210.15290.18980.22060.25770.25770.2683
50.13540.19940.23060.25460.27160.28440.2960
60.13300.19900.26430.30440.31440.32210.3262
70.12940.24570.28190.30290.31440.32510.3403
80.13090.25210.31540.31080.34080.36200.3657
90.13590.26810.33370.35170.35170.36200.3662
Table 7. Factors weight scores based on the AHP–BWM model.
Level 1Level 2Level 3
FactorWeightFactorWeightFactorWeight
Main factorsTraffic characteristicsSpeed
Traffic characteristics0.5148Traffic volume0.3440Average speed0.5148
Human0.2134Traffic composition0.1075Speed limit0.4852
Road characteristics0.1834Following distance0.1381Vehicle type
Light conditions0.0884Speed0.2954Light vehicle0.7068
Vehicle type0.1150Heavy vehicle0.2932
HumanRoad type
Carelessness0.2475Urban0.3026
Illiteracy0.1099Rural0.6974
Violation of rules0.3859Road surface
Training0.2566Dry0.7199
Road characteristics Wet0.2801
Road type0.5969
Road surface0.2203
Grade0.1828
Light conditions
Daytime light0.8396
Night light0.1604
Table 8. Comparisons of ranks for the factors in the second level based on the AHP–BWM model and conventional AHP.
FactorFinal Weight
of AHP–BWM
RankFinal Weight
of AHP Approach
Rank
Traffic volume0.177110.18191
Traffic composition0.055480.05788
Following distance0.071160.06906
Speed0.152120.14252
Vehicle type0.059270.06357
Carelessness0.0528100.052810
Illiteracy0.0235130.023513
Violation of rules0.082440.08244
Training0.054890.05489
Road type0.109530.10953
Road surface0.0404110.040411
Grade0.0335120.033512
Daytime light0.074250.07425
Night light0.0142140.014214
Table 9. Comparisons of ranks for the factors in the third level based on the AHP–BWM model and conventional AHP.
FactorFinal Weight
of AHP–BWM
RankFinal Weight
of AHP Approach
Rank
Average speed0.078310.07342
Speed limit0.073830.06913
Light vehicle0.041840.04494
Heavy vehicle0.017470.01867
Urban0.033150.03315
Rural0.076420.07641
Dry0.029160.02916
Wet0.011380.01138
Publisher’s Note: MDPI stays neutral with regard to jurisdictional claims in published maps and institutional affiliations.