Association between Dyslipidemia and Mercury Exposure in Adults


Abstract
:1. Introduction
2. Methods
2.1. Data Source and Participants
2.2. Study Variables: Demographic Factors
2.3. Study Variables: Health-Related Factors
2.4. Study Variables: Heavy Metal Testing
2.5. Statistical Analysis
3. Results
3.1. General Characteristics of the Study Population
3.2. Weighted Prevalence of Dyslipidemia According to Sex
3.3. Factors Affecting Dyslipidemia Risk According to Sex
4. Discussion
5. Conclusions
Author Contributions
Funding
Institutional Review Board Statement
Informed Consent Statement
Data Availability Statement
Acknowledgments
Conflicts of Interest
References
- Na, W.; Chung, B.H.; Sohn, C. A Relationship Between Dietary Patterns and Dyslipidemia in Urban-Dwelling Middle-Aged Korean Men: Using Korean Genome and Epidemiology Study (KoGES). Clin. Nutr. Res. 2019, 8, 219–228. [Google Scholar] [CrossRef] [PubMed]
- Lim, H.; Lee, H.J.; Choue, R.; Wang, Y. Trends in Fast-Food and Sugar-Sweetened Beverage Consumption and Their Association With Social Environmental Status in South Korea. J. Acad. Nutr. Diet. 2018, 118, 1228–1236.e1. [Google Scholar] [CrossRef] [PubMed]
- Van Bussel, E.; Hoevenaar-Blom, M.P.; Poortvliet, R.K.; Gussekloo, J.; Van Dalen, J.; Van Gool, W.; Richard, E.; Van Charante, E.M. Predictive Value of Traditional Risk Factors for Cardiovascular Disease in Older People: A Systematic Review. Prev. Med. 2020, 132, 105986. [Google Scholar] [CrossRef] [PubMed]
- Noale, M.; Limongi, F.; Maggi, S. Epidemiology of Cardiovascular Diseases in the Elderly. Taurine 6 2020, 1216, 29–38. [Google Scholar] [CrossRef]
- Wang, Y.; Li, Y.; Liu, X.; Zhang, H.; Abdulai, T.; Tu, R.; Tian, Z.; Qian, X.; Jiang, J.; Qiao, D.; et al. Prevalence and Influencing Factors of Coronary Heart Disease and Stroke in Chinese Rural Adults: The Henan Rural Cohort Study. Front. Public Health 2020, 7, 411. [Google Scholar] [CrossRef] [PubMed]
- Mooradian, A.D. Dyslipidemia in Type 2 Diabetes Mellitus. Nat. Rev. Endocrinol. 2009, 5, 150–159. [Google Scholar] [CrossRef] [PubMed]
- Shin, S.; Shin, D.W.; Cho, I.Y.; Jeong, S.-M.; Jung, H. Status of Dyslipidemia Management and Statin Undertreatment in Korean Cancer Survivors: A Korean National Health and Nutrition Examination Survey Study. Eur. J. Prev. Cardiol. 2020, 2047487320905722. [Google Scholar] [CrossRef]
- Hashemi Madani, N.; Ismail-Beigi, F.; Poustchi, H.; Nalini, M.; Sepanlou, S.G.; Malek, M.; Abbasi, M.A.; Khajavi, A.; Khamseh, M.E.; Malekzadeh, R. Impaired Fasting Glucose and Major Adverse Cardiovascular Events by Hypertension and Dyslipidemia Status: The Golestan Cohort Study. BMC Cardiovasc. Disord. 2020, 20, 113. [Google Scholar] [CrossRef] [Green Version]
- Hannon, B.A.; Khan, A.N.; Teran-Garcia, M. Nutrigenetic Contributions to Dyslipidemia: A Focus on Physiologically Relevant Pathways of Lipid and Lipoprotein Metabolism. Nutrients 2018, 10, 1404. [Google Scholar] [CrossRef] [Green Version]
- Bamba, V. Update on Screening, Etiology, and Treatment of Dyslipidemia in Children. J. Clin. Endocrinol. Metab. 2014, 99, 3093–3102. [Google Scholar] [CrossRef] [Green Version]
- Morita, S.-Y. Metabolism and Modification of Apolipoprotein B-Containing Lipoproteins Involved in Dyslipidemia and Atherosclerosis. Biol. Pharm. Bull. 2016, 39, 1–24. [Google Scholar] [CrossRef] [PubMed] [Green Version]
- He, X.; Qi, Z.; Hou, H.; Gao, J.; Zhang, X.-X. Effects of Chronic Cadmium Exposure at Food Limitation-Relevant Levels on Energy Metabolism in Mice. J. Hazard. Mater. 2020, 388, 121791. [Google Scholar] [CrossRef] [PubMed]
- Flora, S.J.S.; Mittal, M.; Mehta, A. Heavy Metal Induced Oxidative Stress & Its Possible Reversal by Chelation Therapy. Indian J. Med. Res. 2008, 128, 501–523. [Google Scholar] [PubMed]
- Tinkov, A.A.; Filippini, T.; Ajsuvakova, O.P.; Aaseth, J.; Gluhcheva, Y.G.; Ivanova, J.M.; Bjørklund, G.; Skalnaya, M.G.; Gatiatulina, E.R.; Popova, E.V.; et al. The Role of Cadmium in Obesity and Diabetes. Sci. Total. Environ. 2017, 601-602, 741–755. [Google Scholar] [CrossRef] [PubMed]
- Moon, S.-S. Additive Effect of Heavy Metals on Metabolic Syndrome in the Korean Population: The Korea National Health and Nutrition Examination Survey (KNHANES) 2009–2010. Endocrine 2014, 46, 263–271. [Google Scholar] [CrossRef]
- You, C.-H.; Kim, B.-G.; Kim, J.-M.; Yu, S.-D.; Kim, Y.-M.; Kim, R.-B.; Hong, Y.-S. Relationship Between Blood Mercury Concentration and Waist-to-Hip Ratio in Elderly Korean Individuals Living in Coastal Areas. J. Prev. Med. Public Health 2011, 44, 218–225. [Google Scholar] [CrossRef]
- Fu, Z.; Xi, S. The Effects of Heavy Metals on Human Metabolism. Toxicol. Mech. Methods 2019, 30, 167–176. [Google Scholar] [CrossRef]
- Poursafa, P.; Ataee, E.; Motlagh, M.E.; Ardalan, G.; Tajadini, M.H.; Yazdi, M.; Kelishadi, R. Association of Serum Lead and Mercury Level With Cardiometabolic Risk Factors and Liver Enzymes in a Nationally Representative Sample of Adolescents: The CASPIAN-III Study. Environ. Sci. Pollut. Res. 2014, 21, 13496–13502. [Google Scholar] [CrossRef]
- Yoo, J.; Choi, W.; Jeon, H.; Kwon, Y.; Lee, N.; Jung, S.; Joo, Y.; Lee, K.; Lee, C.; Yu, S. Korean National Environmental Health Survey (KoNEHS); Environmental Health Research Division, Environmental Health Research Department, National Institute of Environmental Research: Incheon, Korea, 2017; pp. 1–64.
- Azevedo, B.F.; Furieri, L.B.; Peçanha, F.M.; Wiggers, G.A.; Vassallo, P.F.; Simões, M.R.; Fiorim, J.; De Batista, P.R.; Fioresi, M.; Rossoni, L.; et al. Toxic Effects of Mercury on the Cardiovascular and Central Nervous Systems. J. Biomed. Biotechnol. 2012, 2012, 1–11. [Google Scholar] [CrossRef]
- Eom, S.-Y.; Choi, S.H.; Ahn, S.-J.; Kim, D.-K.; Lim, J.-A.; Choi, B.-S.; Shin, H.-J.; Yun, S.-W.; Yoon, H.-J.; Kim, Y.-M.; et al. Reference Levels of Blood Mercury and Association With Metabolic Syndrome in Korean Adults. Int. Arch. Occup. Environ. Health 2013, 87, 501–513. [Google Scholar] [CrossRef]
- Park, K.; Seo, E. Toenail Mercury and Dyslipidemia: Interaction With Selenium. J. Trace Elem. Med. Biol. 2017, 39, 43–49. [Google Scholar] [CrossRef] [PubMed]
- Rizzetti, D.A.; Corrales, P.; Piagette, J.T.; Uranga, J.A.; Medina-Gomez, G.; Peçanha, F.M.; Vassallo, D.V.; Miguel, M.; Peçanha, F.M. Chronic Mercury at Low Doses Impairs White Adipose Tissue Plasticity. Toxicology 2019, 418, 41–50. [Google Scholar] [CrossRef] [PubMed]
- Zou, C.; Shao, J. Role of Adipocytokines in Obesity-Associated Insulin Resistance. J. Nutr. Biochem. 2008, 19, 277–286. [Google Scholar] [CrossRef]
- Kawakami, T.; Hanao, N.; Nishiyama, K.; Kadota, Y.; Inoue, M.; Sato, M.; Suzuki, S. Differential Effects of Cobalt and Mercury on Lipid Metabolism in the White Adipose Tissue of High-Fat Diet-Induced Obesity Mice. Toxicol. Appl. Pharmacol. 2012, 258, 32–42. [Google Scholar] [CrossRef] [PubMed]
- Joshi, D.; Srivastav, S.K.; Belemkar, S.; Dixit, V.A. Zingiber Officinale and 6-Gingerol Alleviate Liver and Kidney Dysfunctions and Oxidative Stress Induced by Mercuric Chloride in Male Rats: A Protective Approach. Biomed. Pharmacother. 2017, 91, 645–655. [Google Scholar] [CrossRef]
- Guzik, T.J.; Touyz, R.M. Oxidative Stress, Inflammation, and Vascular Aging in Hypertension. Hypertension 2017, 70, 660–667. [Google Scholar] [CrossRef]
- Farkhondeh, T.; Afshari, R.; Mehrpour, O.; Samarghandian, S. Mercury and Atherosclerosis: Cell Biology, Pathophysiology, and Epidemiological Studies. Biol. Trace Elem. Res. 2019, 196, 27–36. [Google Scholar] [CrossRef]
- Kern, J.K.; Geier, D.A.; Homme, K.G.; King, P.G.; Bjørklund, G.; Chirumbolo, S.; Geier, M.R. Developmental Neurotoxicants and the Vulnerable Male Brain: A Systematic Review of Suspected Neurotoxicants That Disproportionally Affect Males. Acta Neurobiol. Exp. 2017, 77, 269–296. [Google Scholar] [CrossRef] [Green Version]
- Spiller, H.A. Rethinking Mercury: The Role of Selenium in the Pathophysiology of Mercury Toxicity. Clin. Toxicol. 2018, 56, 313–326. [Google Scholar] [CrossRef]
- Rush, J.W.E.; Sandiford, S.D. Plasma Glutathione Peroxidase in Healthy Young Adults: Influence of Gender and Physical Activity. Clin. Biochem. 2003, 36, 345–351. [Google Scholar] [CrossRef]
- Cho, H.W.; Kim, S.-H.; Park, M.J. An Association of Blood Mercury Levels and Hypercholesterolemia Among Korean Adolescents. Sci. Total. Environ. 2020, 709, 135965. [Google Scholar] [CrossRef] [PubMed]
- Oladipo, O.O.; Ayo, J.O.; Ambali, S.F.; Mohammed, B.; Aluwong, T. Dyslipdemia Induced by Chronic Low Dose Co-Exposure to Lead, Cadmium and Manganese in Rats: The Role of Oxidative Stress. Environ. Toxicol. Pharmacol. 2017, 53, 199–205. [Google Scholar] [CrossRef] [PubMed]
- Alissa, E.M.; Ferns, G.A. Heavy Metal Poisoning and Cardiovascular Disease. J. Toxicol. 2011, 2011, 1–21. [Google Scholar] [CrossRef] [PubMed]
- Rhee, E.-J.; Kim, H.C.; Kim, J.H.; Lee, E.Y.; Kim, B.J.; Kim, E.M.; Song, Y.; Lim, J.H.; Kim, H.J.; Choi, S.; et al. 2018 Guidelines for the Management of Dyslipidemia. Korean J. Intern. Med. 2019, 34, 723–771. [Google Scholar] [CrossRef] [PubMed] [Green Version]
- Opoku, S.; Gan, Y.; Fu, W.; Chen, D.; Addo-Yobo, E.; Trofimovitch, D.; Yue, W.; Yan, F.; Wang, Z.; Lu, Z. Prevalence and Risk Factors for Dyslipidemia Among Adults in Rural and Urban China: Findings from the China National Stroke Screening and Prevention Project (CNSSPP). BMC Public Health 2019, 19, 1–15. [Google Scholar] [CrossRef] [PubMed]
- Hiza, H.A.; Casavale, K.O.; Guenther, P.M.; Davis, C.A. Diet Quality of Americans Differs by Age, Sex, Race/Ethnicity, Income, and Education Level. J. Acad. Nutr. Diet. 2013, 113, 297–306. [Google Scholar] [CrossRef] [PubMed]


| Variables | Items | Total Sample | Male | Female | ||||
|---|---|---|---|---|---|---|---|---|
| Unweighted No. | Weighted% (SE) | Unweighted No. | Weighted% (SE) | Unweighted No. | Weighted% (SE) | |||
| Socio-demographic factors | Age (years) + | 5345 | 43.7 (0.3) | 2424 | 42.8 (0.4) | 2921 | 44.6 (0.4) | |
| Marital status | Yes | 3997 | 69.1 (0.8) | 1696 | 64.9 (1.1) | 2301 | 73.2 (1.0) | |
| No | 1348 | 30.9 (0.8) | 728 | 35.1 (1.1) | 620 | 26.8 (1.0) | ||
| Education | ≤Elementary | 1189 | 18.2 (0.6) | 444 | 13.9 (0.7) | 745 | 22.4 (1.0) | |
| Middle school | 633 | 12.4 (0.6) | 301 | 12.6 (0.8) | 332 | 12.3 (0.8) | ||
| High school | 1529 | 32.6 (0.9) | 696 | 33.3 (1.2) | 833 | 32.0 (1.1) | ||
| ≥University | 1744 | 36.7 (0.9) | 857 | 40.1 (1.3) | 887 | 33.3 (1.0) | ||
| Occupation | WC worker | 1174 | 26.4 (0.8) | 603 | 30.3 (1.2) | 571 | 22.6 (0.9) | |
| PC worker | 591 | 13.0 (0.6) | 216 | 11.5 (0.8) | 375 | 14.4 (0.9) | ||
| BC worker | 494 | 11.3 (0.6) | 416 | 19.7 (1.2) | 78 | 3.1 (0.4) | ||
| AL worker | 618 | 10.9 (0.6) | 272 | 10.4 (0.7) | 346 | 11.4 (0.8) | ||
| Unemployed | 1930 | 38.3 (0.9) | 634 | 28.0 (1.2) | 1296 | 48.4 (1.1) | ||
| Household income | Lowest | 906 | 13.8 (0.7) | 369 | 12.4 (0.9) | 537 | 15.3 (0.9) | |
| Lower middle | 1315 | 23.1 (0.9) | 589 | 22.6 (1.1) | 726 | 23.7 (1.1) | ||
| Upper middle | 1495 | 30.0 (1.0) | 716 | 31.6 (1.2) | 779 | 28.4 (1.2) | ||
| Highest | 1614 | 33.0 (1.2) | 740 | 33.5 (1.5) | 874 | 32.6 (1.4) | ||
| Residential area | Urban | 4382 | 86.5 (1.6) | 1990 | 86.7 (1.6) | 2392 | 86.2 (1.6) | |
| Rural | 963 | 13.5 (1.6) | 434 | 13.3 (1.6) | 529 | 13.8 (1.6) | ||
| Health behaviors | Drinking | No | 907 | 15.6 (0.6) | 302 | 11.5 (0.8) | 605 | 19.8 (0.9) |
| Yes | 4368 | 84.4 (0.6) | 2088 | 88.5 (0.8) | 2280 | 80.2 (0.9) | ||
| Smoking | No | 2853 | 57.6 (0.8) | 486 | 25.1 (1.2) | 2367 | 89.7 (0.7) | |
| Yes | 1906 | 42.4 (0.8) | 1628 | 74.9 (1.2) | 278 | 10.3 (0.7) | ||
| BMI | Normal | 3216 | 60.3 (0.9) | 1380 | 55.8 (1.2) | 1836 | 64.9 (1.1) | |
| Overweight | 1502 | 27.7 (0.8) | 813 | 34.1 (1.1) | 689 | 21.3 (0.9) | ||
| Obesity | 279 | 5.4 (0.4) | 105 | 5.1 (0.5) | 174 | 5.6 (0.5) | ||
| Underweight | 341 | 6.6 (0.4) | 124 | 5.0 (0.5) | 217 | 8.2 (0.7) | ||
| Dyslipidemia | No | 3988 | 84.1 (0.6) | 1818 | 85.9 (0.8) | 2170 | 82.4 (0.9) | |
| Yes | 841 | 15.9 (0.6) | 330 | 14.1 (0.8) | 511 | 17.6 (0.9) | ||
| Mental health | Subjective health status | Good | 1610 | 33.0 (0.8) | 826 | 36.9 (1.1) | 784 | 29.1 (1.1) |
| Moderate | 2628 | 51.5 (0.8) | 1138 | 49.3 (1.2) | 1490 | 53.7 (1.2) | ||
| Poor | 881 | 15.5 (0.7) | 346 | 13.8 (0.9) | 535 | 17.1 (0.9) | ||
| Stress level | Low | 789 | 14.2 (0.6) | 383 | 15.4 (0.8) | 406 | 13.1 (0.7) | |
| Moderate | 2909 | 56.7 (0.8) | 1317 | 56.3 (1.2) | 1592 | 57.0 (1.1) | ||
| High | 1455 | 29.1 (0.8) | 624 | 28.3 (1.1) | 831 | 29.9 (1.0) | ||
| Heavy metal exposure | Pb | <1.60 μg/dL | 2681 | 53.6 (1.0) | 910 | 42.1 (1.3) | 1771 | 65.0 (1.1) |
| ≥1.60 μg/dL | 2664 | 46.4 (1.0) | 1514 | 57.9 (1.3) | 1150 | 35.0 (1.1) | ||
| Hg | <2.75 μg/L | 2407 | 44.7 (1.0) | 839 | 34.6 (1.2) | 1568 | 54.8 (1.4) | |
| ≥2.75 μg/L | 2938 | 55.3 (1.0) | 1585 | 65.4 (1.2) | 1353 | 45.2 (1.4) | ||
| Cd | <0.36 μg/L | 689 | 15.9 (0.7) | 403 | 19.4 (1.1) | 286 | 12.5 (0.8) | |
| ≥0.36 μg/L | 4656 | 84.1 (0.7) | 2021 | 80.6 (1.1) | 2635 | 87.5 (0.8) | ||
| Characteristics | Total Sample | Male | Female | |||||||
|---|---|---|---|---|---|---|---|---|---|---|
| Non-Dyslipidemia | Dyslipidemia | p-Value | Non-Dyslipidemia | Dyslipidemia | p-Value | Non-Dyslipidemia | Dyslipidemia | p-Value | ||
| Weighted% (SE) | Weighted% (SE) | Weighted% (SE) | ||||||||
| Age (years) + | 44.56 (0.33) | 59.90 (0.50) | <0.001 | 44.45 (0.41) | 57.18 (0.77) | <0.001 | 44.68 (0.39) | 62.06 (0.57) | <0.001 | |
| Marital status | Yes | 80.3 (0.8) | 19.7 (0.8) | <0.001 | 82.0 (1.1) | 18.0 (1.1) | <0.001 | 78.8 (1.1) | 21.2 (1.1) | <0.001 |
| No | 96.9 (0.6) | 3.1 (0.6) | 96.4 (0.9) | 3.6 (0.9) | 97.7 (0.9) | 2.3 (0.9) | ||||
| Education | ≤Elementary school | 64.2 (2.1) | 35.8 (2.1) | <0.001 | 74.9 (3.4) | 25.1 (3.4) | <0.001 | 59.4 (2.6) | 40.6 (2.6) | <0.001 |
| Middle school | 74.5 (2.3) | 25.5 (2.3) | 81.8 (3.3) | 18.2 (3.3) | 67.4 (3.5) | 32.6 (3.5) | ||||
| High school | 86.8 (1.0) | 13.2 (1.0) | 88.1 (1.3) | 11.9 (1.3) | 85.5 (1.5) | 14.5 (1.5) | ||||
| ≥University | 90.3 (0.8) | 9.7 (0.8) | 87.2 (1.3) | 12.8 (1.3) | 94.0 (0.9) | 6.0 (0.9) | ||||
| Occupation | WC worker | 90.4 (1.0) | 9.6 (1.0) | <0.001 | 87.6 (1.5) | 12.4 (1.5) | 0.550 | 94.1 (1.1) | 5.9 (1.1) | <0.001 |
| PC worker | 85.6 (1.6) | 14.4 (1.6) | 86.4 (2.6) | 13.6 (2.6) | 85.0 (2.1) | 15.0 (2.1) | ||||
| BC worker | 85.2 (1.8) | 14.8 (1.8) | 85.8 (1.8) | 14.2 (1.8) | 82.0 (5.4) | 18.0 (5.4) | ||||
| AL worker | 79.5 (1.9) | 20.5 (1.9) | 86.0 (2.5) | 14.0 (2.5) | 73.7 (2.7) | 26.3 (2.7) | ||||
| Unemployed | 79.3 (1.1) | 20.7 (1.1) | 83.7 (1.8) | 16.3 (1.8) | 77.0 (1.5) | 23.0 (1.5) | ||||
| Household income | Lowest | 78.4 (1.8) | 21.6 (1.8) | <0.001 | 83.3 (2.3) | 16.7 (2.3) | 0.654 | 74.6 (2.6) | 25.4 (2.6) | <0.001 |
| Lower middle | 82.8 (1.3) | 17.2 (1.3) | 85.9 (1.7) | 14.1 (1.7) | 79.9 (1.8) | 20.1 (1.8) | ||||
| Upper middle | 84.7 (1.2) | 15.3 (1.2) | 86.8 (1.6) | 13.2 (1.6) | 82.4 (1.7) | 17.6 (1.7) | ||||
| Highest | 87.2 (1.0) | 12.8 (1.0) | 86.3 (1.5) | 13.7 (1.5) | 88.0 (1.3) | 12.0 (1.3) | ||||
| Residential area | Urban | 84.0 (0.7) | 16.0 (0.7) | 0.597 | 85.4 (0.9) | 14.6 (0.9) | 0.182 | 82.6 (1.0) | 17.4 (1.0) | 0.574 |
| Rural | 84.8 (1.4) | 15.2 (1.4) | 88.6 (2.0) | 11.4 (2.0) | 81.2 (2.3) | 18.8 (2.3) | ||||
| Drinking | No | 73.0 (2.4) | 27.0 (2.4) | <0.001 | 84.9 (3.3) | 15.1 (3.3) | 0.732 | 69.2 (2.8) | 30.8 (2.8) | <0.001 |
| Yes | 85.2 (0.7) | 14.8 (0.7) | 86.0 (0.9) | 14.0 (0.9) | 84.2 (1.0) | 15.8 (1.0) | ||||
| Smoking | No | 83.4 (0.8) | 16.6 (0.8) | 0.195 | 90.6 (1.5) | 9.4 (1.5) | 0.002 | 81.5 (1.0) | 18.5 (1.0) | 0.014 |
| Yes | 84.9 (0.9) | 15.1 (0.9) | 84.4 (1.0) | 15.6 (1.0) | 88.6 (2.3) | 11.4 (2.3) | ||||
| BMI | Normal | 86.3 (0.8) | 13.7 (0.8) | <0.001 | 87.1 (1.1) | 12.9 (1.1) | 0.042 | 85.6 (1.0) | 14.4 (1.0) | <0.001 |
| Overweight | 79.2 (1.2) | 20.8 (1.2) | 83.8 (1.4) | 16.2 (1.4) | 71.8 (2.1) | 28.2 (2.1) | ||||
| Obesity | 77.3 (2.8) | 22.7 (2.8) | 82.7 (4.0) | 17.3 (4.0) | 72.4 (4.0) | 27.6 (4.0) | ||||
| Underweight | 97.3 (1.2) | 2.7 (1.2) | 96.0 (2.8) | 4.0 (2.8) | 98.0 (1.1) | 2.0 (1.1) | ||||
| Subjective health status | Good | 91.3 (0.9) | 8.7 (0.9) | <0.001 | 91.2 (1.2) | 8.8 (1.2) | <0.001 | 91.4 (1.3) | 8.6 (1.3) | <0.001 |
| Moderate | 84.2 (0.9) | 15.8 (0.9) | 86.7 (1.2) | 13.3 (1.2) | 81.9 (1.2) | 18.1 (1.2) | ||||
| Poor | 70.8 (2.0) | 29.2 (2.0) | 72.0 (2.9) | 28.0 (2.9) | 69.9 (2.4) | 30.1 (2.4) | ||||
| Stress level | Low | 83.5 (1.5) | 16.5 (1.5) | 0.191 | 85.9 (2.2) | 14.1 (2.2) | 0.292 | 80.9 (2.1) | 19.1 (2.1) | 0.569 |
| Moderate | 83.4 (0.8) | 16.6 (0.8) | 84.9 (1.2) | 15.1 (1.2) | 81.9 (1.2) | 18.1 (1.2) | ||||
| High | 85.7 (1.1) | 14.3 (1.1) | 88.1 (1.5) | 11.9 (1.5) | 83.5 (1.7) | 16.5 (1.7) | ||||
| Pb exposure | <1.60 μg/dL | 87.5 (0.8) | 12.5 (0.8) | <0.001 | 89.1 (1.2) | 10.9 (1.2) | 0.003 | 86.5 (1.1) | 13.5 (1.1) | <0.001 |
| ≥1.60 μg/dL | 80.9 (1.0) | 19.1 (1.0) | 84.0 (1.1) | 16.0 (1.1) | 75.7 (1.7) | 24.3 (1.7) | ||||
| Hg exposure | <2.75 μg/L | 86.4 (0.9) | 13.6 (0.9) | 0.003 | 90.5 (1.3) | 9.5 (1.3) | <0.001 | 84.1 (1.2) | 15.9 (1.2) | 0.046 |
| ≥2.75 μg/L | 82.6 (0.9) | 17.4 (0.9) | 84.0 (1.1) | 16.0 (1.1) | 80.5 (1.4) | 19.5 (1.4) | ||||
| Cd exposure | <0.36 μg/L | 97.3 (0.8) | 2.7 (0.8) | <0.001 | 97.4 (1.0) | 2.6 (1.0) | <0.001 | 97.3 (1.2) | 2.7 (1.2) | <0.001 |
| ≥0.36 μg/L | 82.7 (0.7) | 17.3 (0.7) | 84.2 (0.9) | 15.8 (0.9) | 81.4 (1.0) | 18.6 (1.0) | ||||
| Characteristics | Total Sample | Male | Female | ||||
|---|---|---|---|---|---|---|---|
| OR | 95% CI | OR | 95% CI | OR | 95% CI | ||
| Age | 1.068 *** | 1.056–1.080 | 1.066 *** | 1.049–1.084 | 1.079 *** | 1.062–1.097 | |
| Marital status | Yes | 1 | 1 | 1 | |||
| No | 0.748 | 0.456–1.229 | 0.846 | 0.457–1.563 | 0.802 | 0.318–2.027 | |
| Education | ≤Elementary | 1 | 1 | 1 | |||
| Middle school | 0.971 | 0.704–1.340 | 0.934 | 0.525–1.660 | 1.162 | 0.763–1.769 | |
| High school | 0.900 | 0.662–1.224 | 1.124 | 0.691–1.831 | 0.923 | 0.604–1.411 | |
| ≥University | 0.773 | 0.538–1.110 | 1.244 | 0.694–2.230 | 0.620 | 0.358–1.072 | |
| Occupation | WC worker | 1 | 1 | 1 | |||
| PC worker | 0.989 | 0.690–1.419 | 1.226 | 0.706–2.130 | 0.855 | 0.501–1.457 | |
| BC worker | 0.855 | 0.566–1.291 | 0.960 | 0.568–1.625 | 0.996 | 0.468–2.119 | |
| AL worker | 0.800 | 0.548–1.167 | 0.577 | 0.297–1.119 | 1.066 | 0.608–1.867 | |
| Unemployed | 0.878 | 0.643–1.198 | 0.689 | 0.409–1.160 | 1.008 | 0.606–1.676 | |
| Household income | Lowest | 1 | 1 | 1 | |||
| Lower middle | 1.571 * | 1.085–2.275 | 1.210 | 0.679–2.156 | 1.980 ** | 1.243–3.152 | |
| Upper middle | 1.872 ** | 1.283–2.732 | 1.307 | 0.730–2.340 | 2.376 *** | 1.502–3.757 | |
| Highest | 1.621 * | 1.122–2.342 | 1.257 | 0.710–2.223 | 1.744 * | 1.094–2.782 | |
| Drinking | No | 1 | 1 | 1 | |||
| Yes | 1.032 | 0.758–1.405 | 1.109 | 0.582–2.117 | 1.125 | 0.773–1.636 | |
| Smoking | No | 1 | 1 | 1 | |||
| Yes | 0.889 | 0.714–1.107 | 1.101 | 0.699–1.735 | 0.958 | 0.558–1.645 | |
| BMI | Normal | 1 | 1 | 1 | |||
| Overweight | 1.558 *** | 1.261–1.924 | 1.423 * | 1.036–1.956 | 1.567 ** | 1.163–2.111 | |
| Obesity | 2.184 *** | 1.454–3.282 | 2.016 * | 1.043–3.896 | 2.078 ** | 1.258–3.433 | |
| Underweight | 0.192 ** | 0.070–0.533 | 0.183 * | 0.036–0.940 | 0.221 * | 0.066–0.747 | |
| Subjective health status | Good | 1 | 1 | 1 | |||
| Moderate | 1.821 *** | 1.392–2.381 | 1.412 | 0.942–2.116 | 2.141 *** | 1.422–3.225 | |
| Poor | 3.115 *** | 2.281–4.252 | 3.621 *** | 2.313–5.668 | 2.665 *** | 1.688–4.209 | |
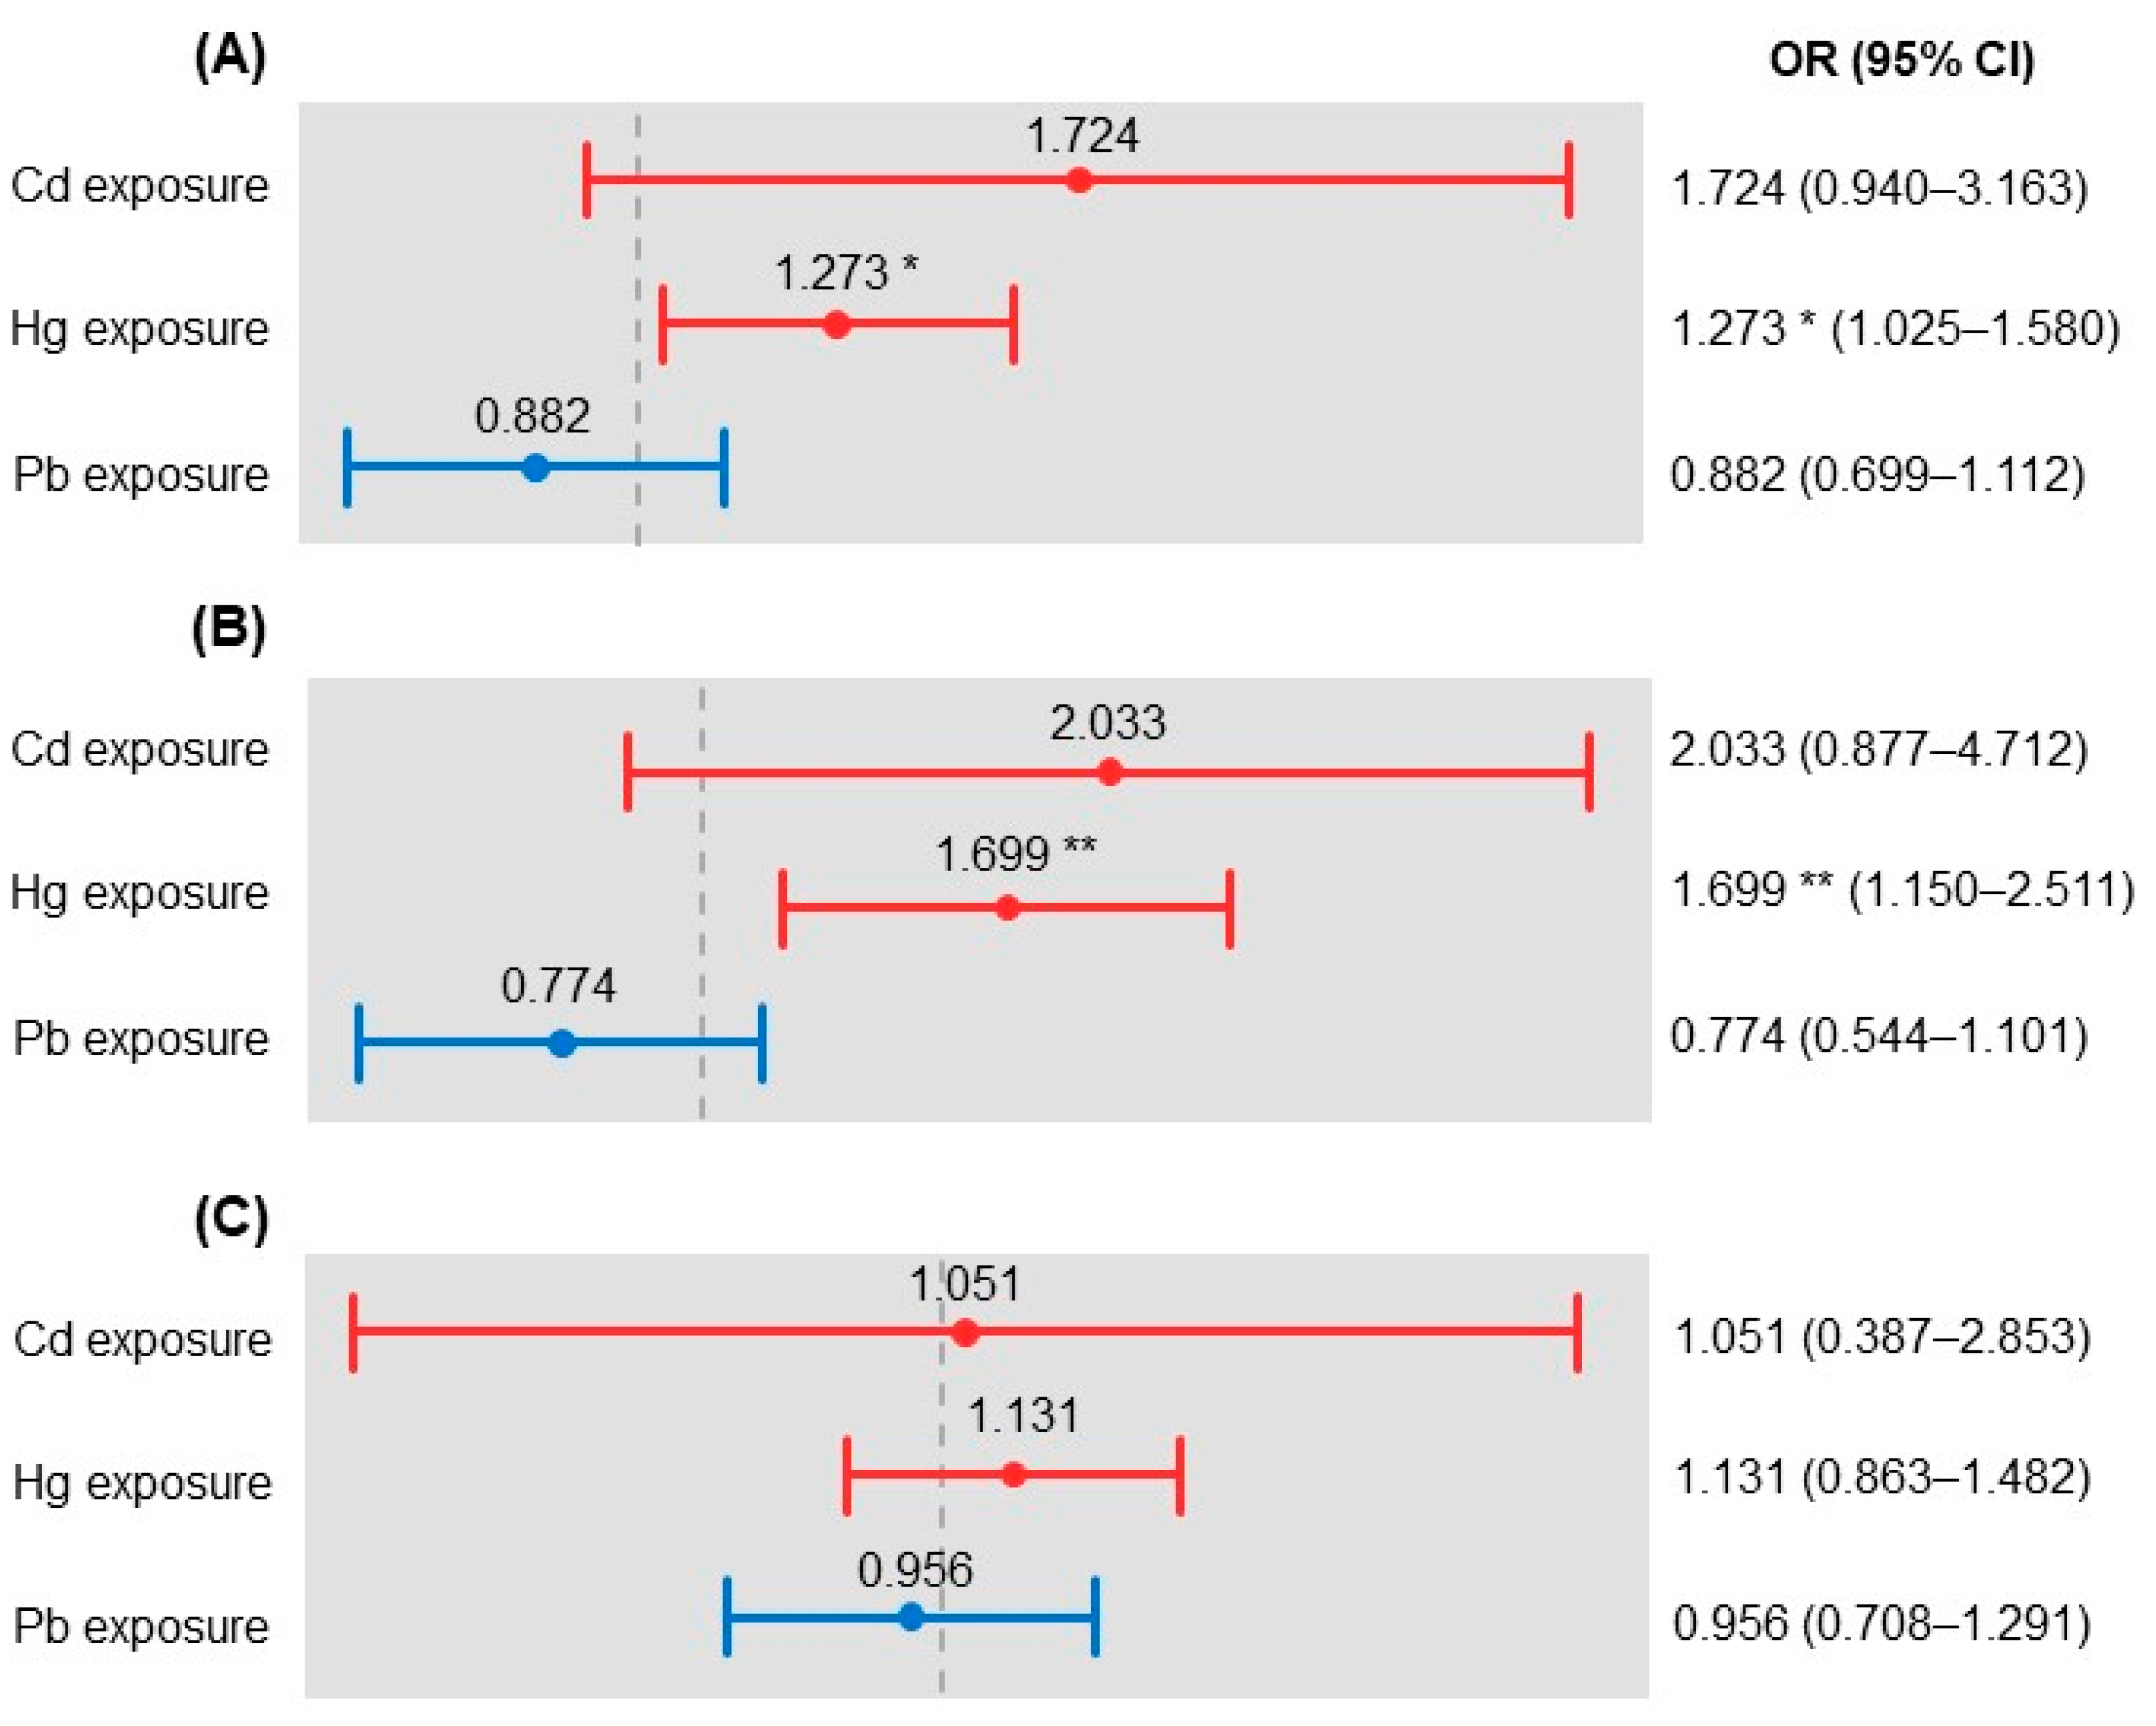
| Pb exposure | <1.60 μg/dL | 1 | 1 | 1 | |||
| ≥1.60 μg/dL | 0.882 | 0.699–1.112 | 0.774 | 0.544–1.101 | 0.956 | 0.708–1.291 | |
| Hg exposure | <2.75 μg/L | 1 | 1 | 1 | |||
| ≥2.75 μg/L | 1.273 * | 1.025–1.580 | 1.699 ** | 1.150–2.511 | 1.131 | 0.863–1.482 | |
| Cd exposure | <0.36 μg/L | 1 | 1 | 1 | |||
| ≥0.36 μg/L | 1.724 | 0.940–3.163 | 2.033 | 0.877–4.712 | 1.051 | 0.387–2.853 | |
Publisher’s Note: MDPI stays neutral with regard to jurisdictional claims in published maps and institutional affiliations. |
© 2021 by the authors. Licensee MDPI, Basel, Switzerland. This article is an open access article distributed under the terms and conditions of the Creative Commons Attribution (CC BY) license (http://creativecommons.org/licenses/by/4.0/).
Share and Cite
Kang, P.; Shin, H.Y.; Kim, K.Y. Association between Dyslipidemia and Mercury Exposure in Adults. Int. J. Environ. Res. Public Health 2021, 18, 775. https://doi.org/10.3390/ijerph18020775
Kang P, Shin HY, Kim KY. Association between Dyslipidemia and Mercury Exposure in Adults. International Journal of Environmental Research and Public Health. 2021; 18(2):775. https://doi.org/10.3390/ijerph18020775
Chicago/Turabian StyleKang, Purum, Hye Young Shin, and Ka Young Kim. 2021. "Association between Dyslipidemia and Mercury Exposure in Adults" International Journal of Environmental Research and Public Health 18, no. 2: 775. https://doi.org/10.3390/ijerph18020775
APA StyleKang, P., Shin, H. Y., & Kim, K. Y. (2021). Association between Dyslipidemia and Mercury Exposure in Adults. International Journal of Environmental Research and Public Health, 18(2), 775. https://doi.org/10.3390/ijerph18020775