Exploring the Dynamic Spatio-Temporal Correlations between PM2.5 Emissions from Different Sources and Urban Expansion in Beijing-Tianjin-Hebei Region

Abstract

1. Introduction
2. Materials and Methods
2.1. Overview of the Study Area
2.2. Remote Sensing Data
2.3. Pollutant Emissions Data
2.4. Bayesian Spatio-Temporal Dynamic Statistical Model
2.5. Local Regression Model
3. Results
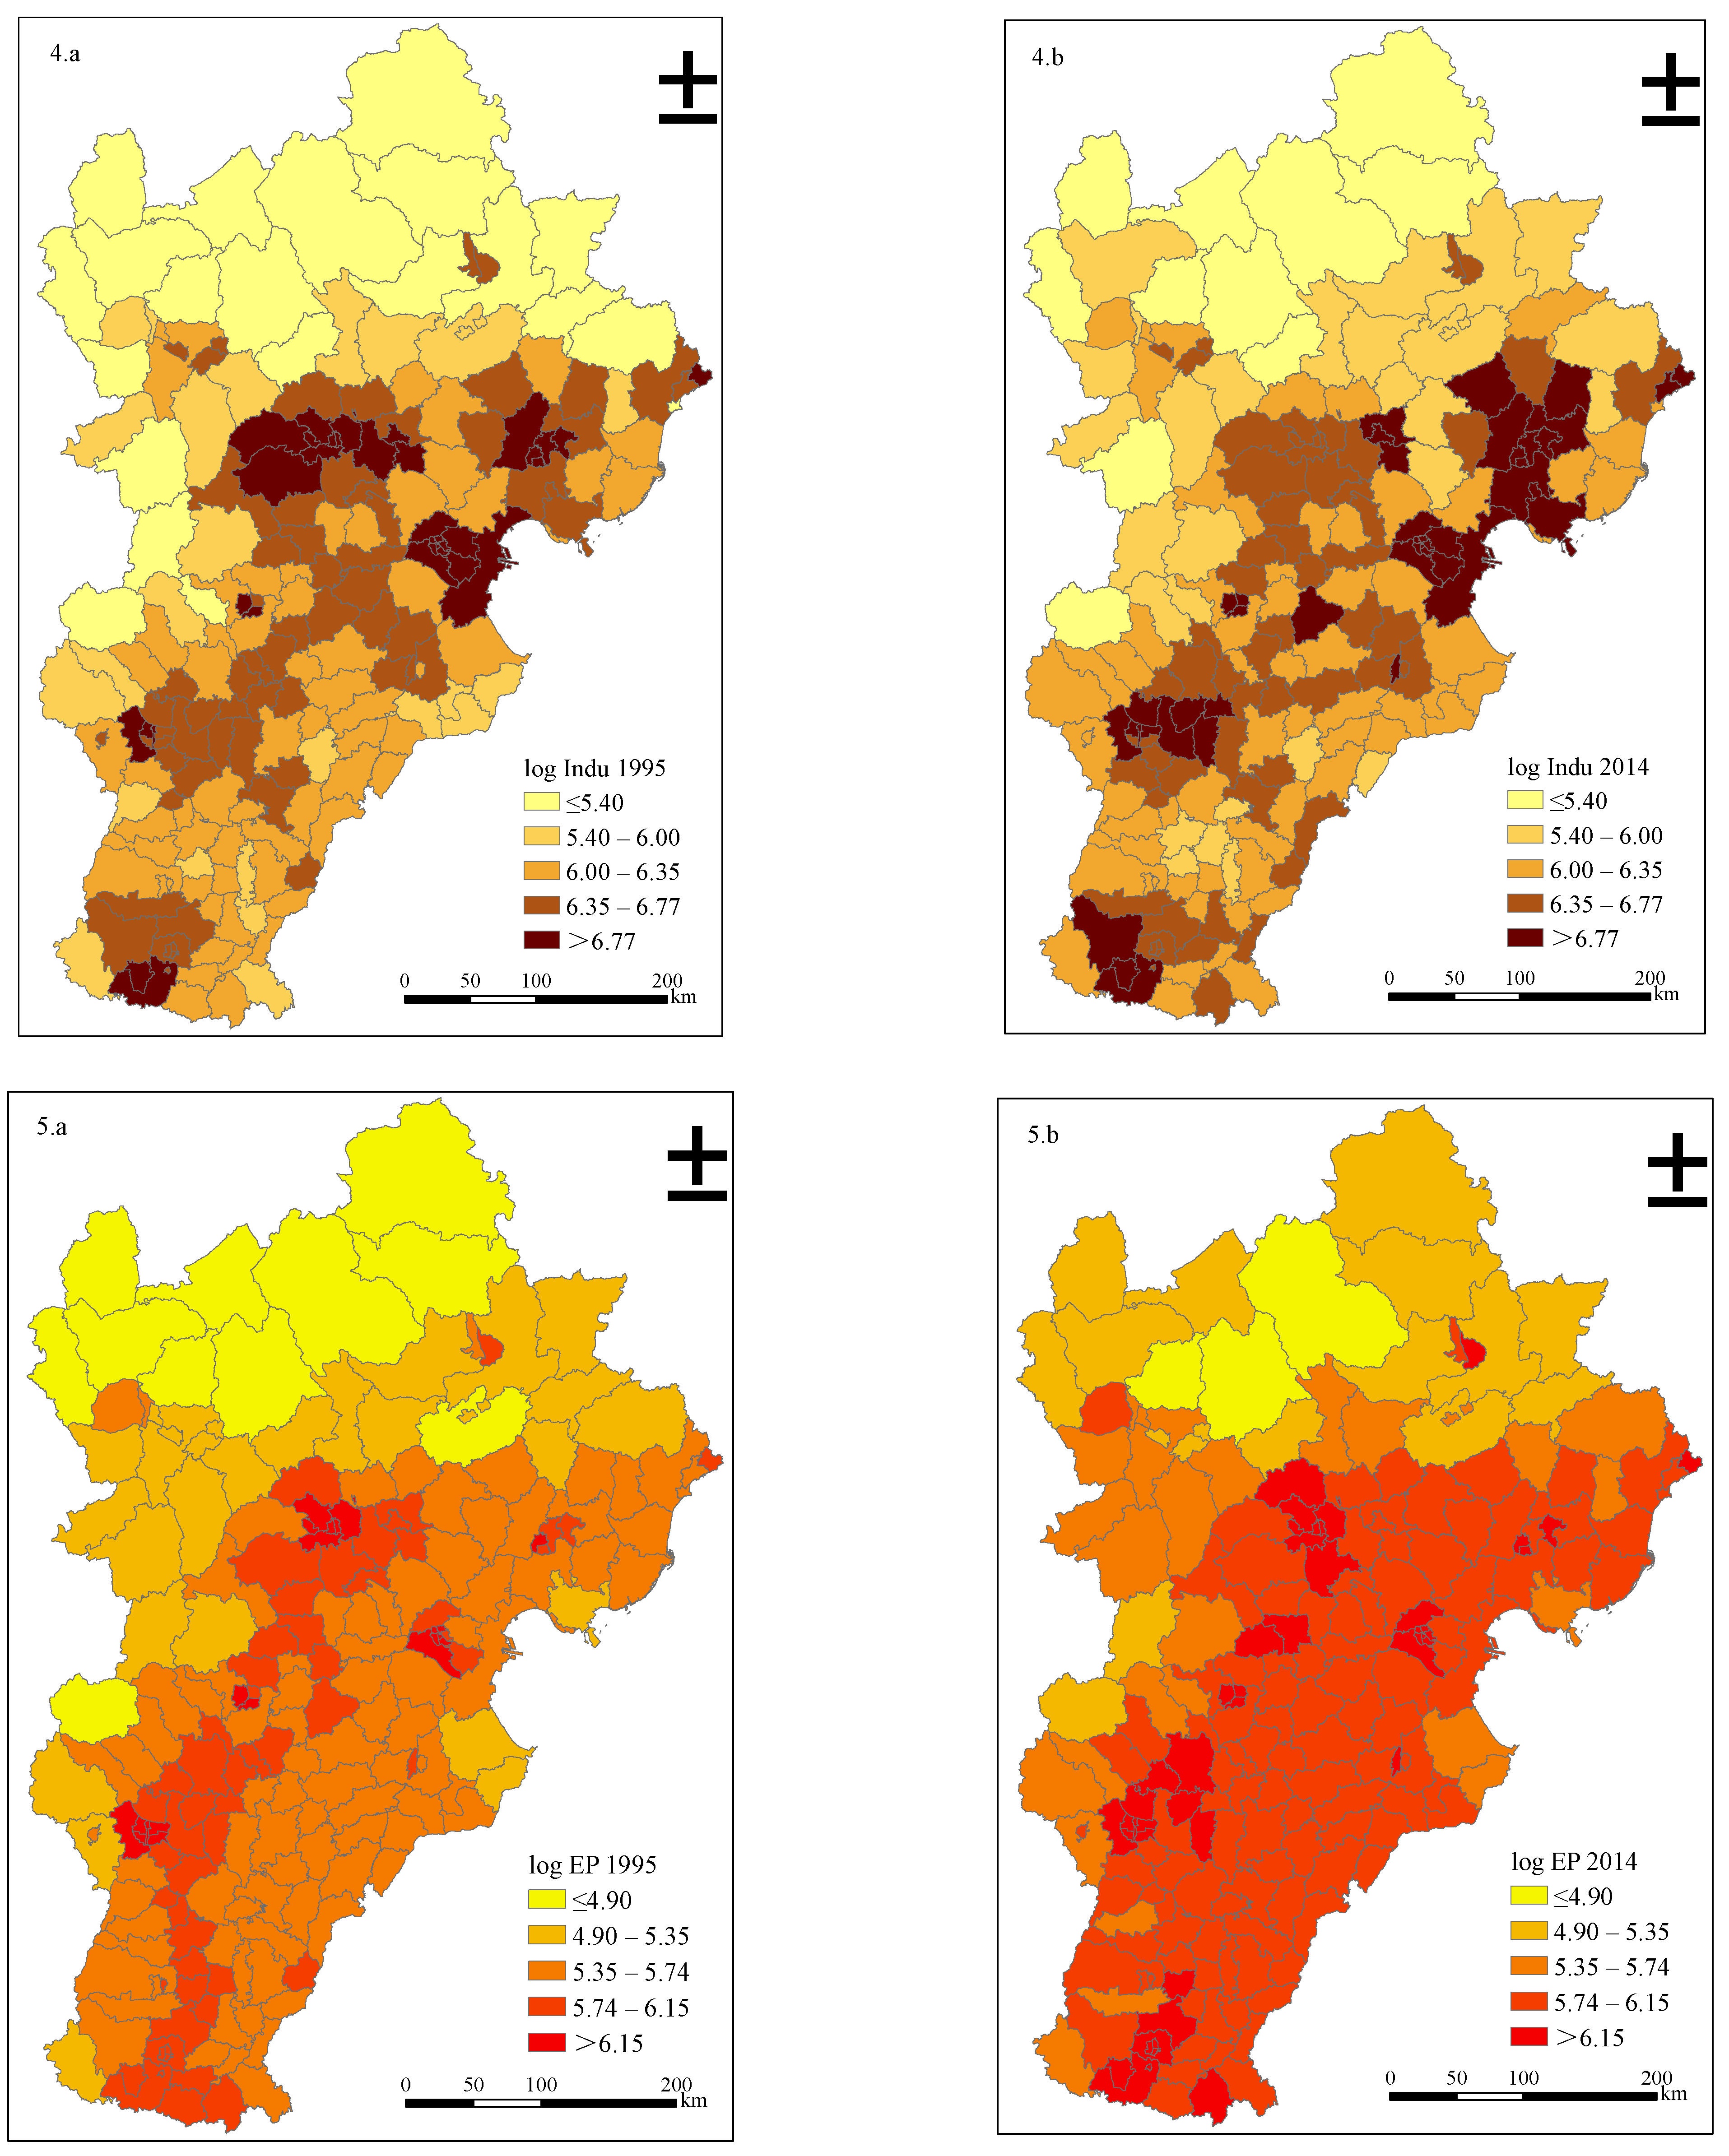
3.1. Characterization of the Spatio-Temporal Dynamics in Data
3.2. Results of Bayesian Spatio-Temporal Statistical Model Estimation
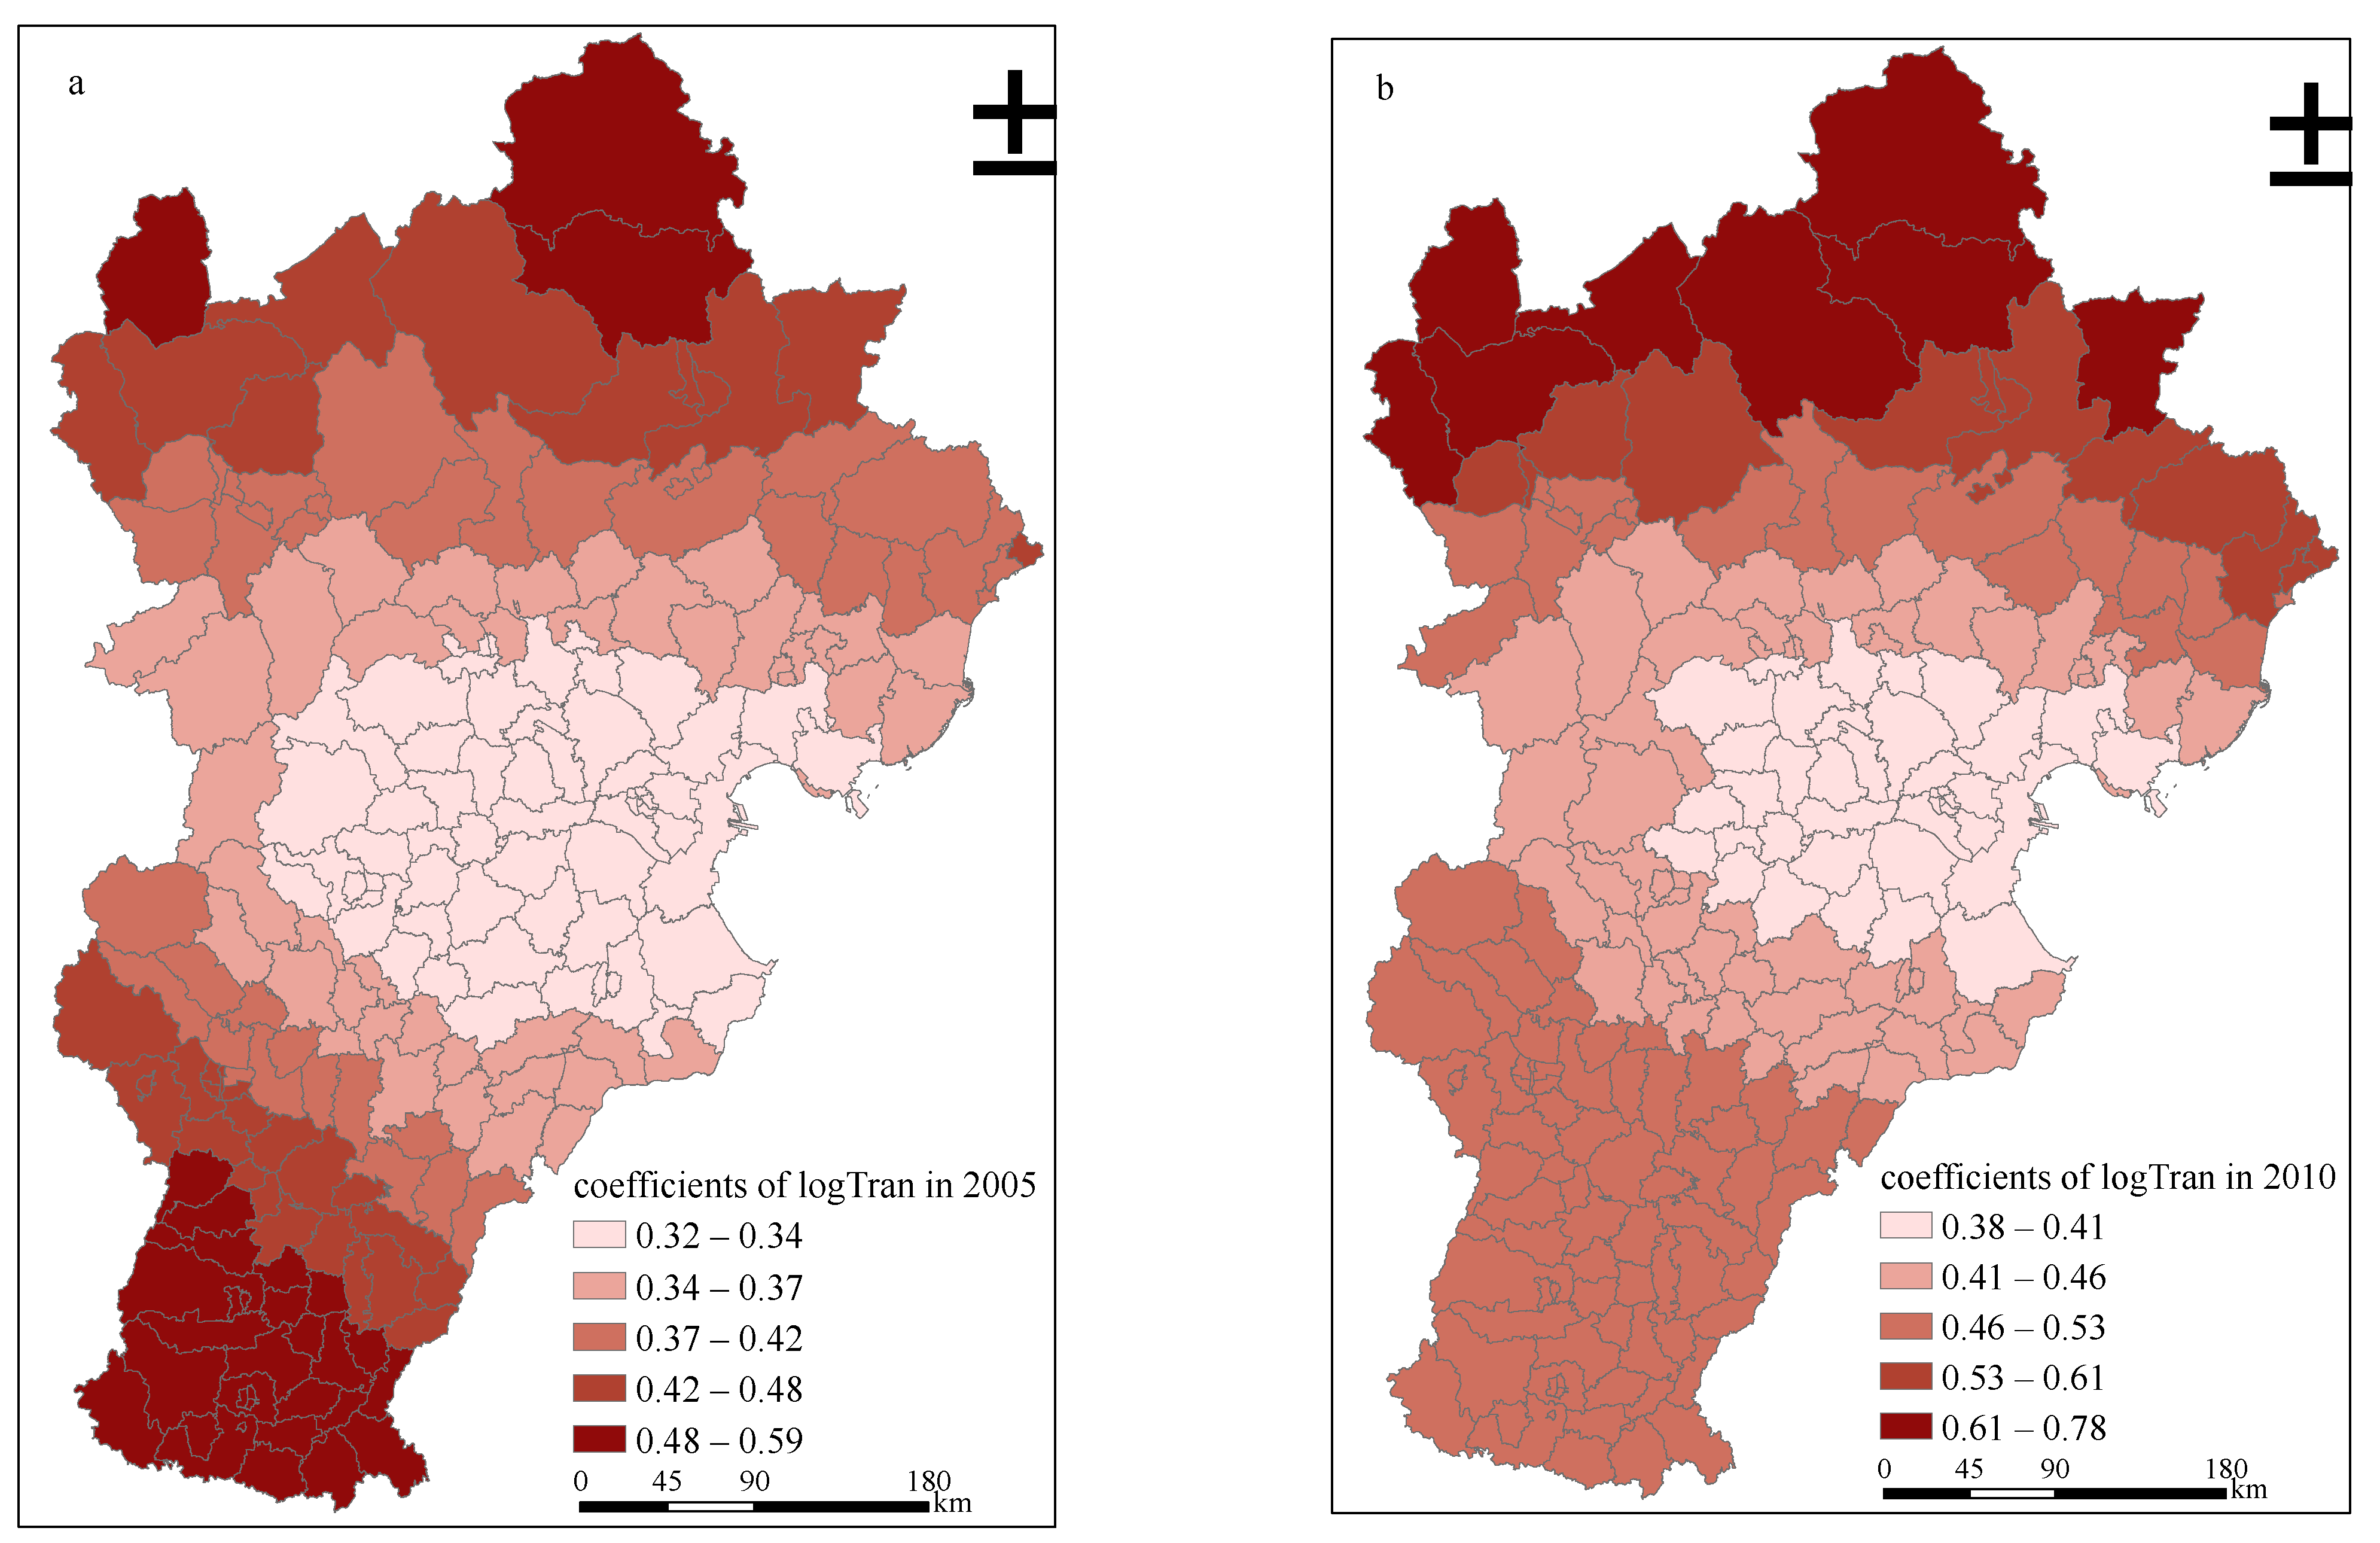
3.3. Results of Local Regression Model Estimation
4. Discussion
5. Conclusions
Author Contributions
Funding
Institutional Review Board Statement
Informed Consent Statement
Data Availability Statement
Conflicts of Interest
References
- Xiao, P.F.; Wang, X.H.; Feng, X.Z.; Zhang, X.L.; Yang, Y.K. Detecting China’s urban expansion over the past three decades using nighttime light data. IEEE J. Sel. Top. Appl. Earth Obs. Remote Sens. 2014, 7, 4095–4106. [Google Scholar] [CrossRef]
- Fei, W.C.; Zhao, S.Q. Urban land expansion in China’s six megacities from 1978 to 2015. Sci. Total. Environ. 2019, 664, 60–71. [Google Scholar] [CrossRef] [PubMed]
- National Bureau of Statistics of China. China’s Total Population and Structural Changes in 2019. Available online: http://www.stats.gov.cn/tjsj/zxfb/202002/t20200228_1728913.html (accessed on 27 November 2020).
- Xia, Y.; Guan, D.B.; Jiang, X.J.; Peng, L.Q.; Schroeder, H.; Zhang, Q. Assessment of socioeconomic costs to China’s air pollution. Atmos. Environ. 2016, 139, 147–156. [Google Scholar] [CrossRef]
- Li, L.; Hong, X.F.; Wang, J. Evaluating the impact of clean energy consumption and factor allocation on China’s air pollution: A spatial econometric approach. Energy 2020, 195, 116842. [Google Scholar] [CrossRef]
- Li, K.; Bai, K.X. Spatiotemporal associations between PM2.5 and SO2 as well as NO2 in China from 2015 to 2018. Int. J. Environ. Res. Public Health 2019, 16, 2352. [Google Scholar] [CrossRef] [PubMed]
- Sun, W.Q.; Zhou, Y.; Lv, J.X.; Wu, J.Z. Assessment of multi-air emissions: Case of particulate matter (dust), SO2, NOx and CO2 from iron and steel industry of China. J. Clean Prod. 2019, 232, 350–358. [Google Scholar] [CrossRef]
- Shao, P.Y.; Tian, H.Z.; Sun, Y.J.; Liu, H.J.; Wu, B.B.; Liu, S.H.; Liu, X.Y.; Wu, Y.M.; Liang, W.Z.; Wang, Y.; et al. Characterizing remarkable changes of severe haze events and chemical compositions in multi-size airborne particles (PM1, PM2.5 and PM10) from January 2013 to 2016–2017 winter in Beijing, China. Atmos. Environ. 2018, 189, 133–144. [Google Scholar] [CrossRef]
- Li, Q.H.; Wu, B.G.; Liu, J.L.; Zhang, H.S.; Cai, X.H.; Song, Y. Characteristics of the atmospheric boundary layer and its relation with PM2.5 during haze episodes in winter in the North China Plain. Atmos. Environ. 2020, 233, 117265. [Google Scholar] [CrossRef]
- Fann, N.; Baker, K.R.; Chan, E.A.W.; Eyth, A.; Macpherson, A.; Miller, E.; Snyder, J. Assessing Human Health PM2.5 and Ozone Impacts from US Oil and Natural Gas Sector Emissions in 2025. Environ. Sci. Technol. 2018, 52, 8095–8103. [Google Scholar] [CrossRef]
- Yang, S.Y.; Fang, D.L.; Chen, B. Human health impact and economic effect for PM2.5 exposure in typical cities. Appl. Energy 2019, 249, 316–325. [Google Scholar] [CrossRef]
- Othman, M.; Latif, M.T.; Yee, C.Z.; Norshariffudin, L.K.; Azhari, A.; Halim, N.D.A.; Alias, A.; Sofwan, N.M.; Hamid, H.H.A.; Matsumi, Y. PM2.5 and ozone in office environments and their potential impact on human health. Ecotox. Environ. Safe. 2020, 194, 110432. [Google Scholar] [CrossRef] [PubMed]
- Chowdhury, P.H.; Okano, H.; Honda, A.; Kudou, H.; Kitamura, G.; Ito, S.; Ueda, K.; Takano, H. Aqueous and organic extract of PM2.5 collected in different seasons and cities of Japan differently affect respiratory and immune systems. Environ. Pollut. 2018, 235, 223–234. [Google Scholar] [CrossRef] [PubMed]
- Cordova, J.E.; Aguirre, V.T.; Apestegui, V.V.; Ibarguen, L.O.; Vu, B.N.; Steenland, K.; Rengifo, G.F. Association of PM2.5 concentration with health center outpatient visits for respiratory diseases of children under 5 years old in Lima, Peru. Environ. Health-Glob. 2020, 19, 1–6. [Google Scholar] [CrossRef]
- Xie, Z.X.; Li, Y.; Qin, Y.C.; Rong, P.J. Value assessment of health losses caused by PM2.5 pollution in cities of atmospheric pollution transmission channel in the Beijing-Tianjin-Hebei region, China. Int. J. Environ. Res. Public Health 2019, 16, 1012. [Google Scholar] [CrossRef]
- Chen, L.; Zhu, J.; Liao, H.; Gao, Y.; Qiu, Y.L.; Zhang, M.G.; Liu, Z.R.; Li, N.; Wang, Y.S. Assessing the formation and evolution mechanisms of severe haze pollution in the Beijing-Tianjin-Hebei region using process analysis. Atmos. Chem. Phys. 2019, 19, 10845–10864. [Google Scholar] [CrossRef]
- Song, Y.M.; Huang, B.; He, Q.Q.; Chen, B.; Wei, J.; Mahmood, R. Dynamic assessment of PM2.5 exposure and health risk using remote sensing and geo-spatial big data. Environ. Pollut. 2019, 253, 288–296. [Google Scholar] [CrossRef] [PubMed]
- Salim, R.; Rafiq, S.; Shafiei, S.; Yao, Y. Does urbanization increase pollutant emission and energy intensity? Evidence from some Asian developing economies. Appl. Econ. 2019, 51, 4008–4024. [Google Scholar] [CrossRef]
- Zhao, S.; Dong, G.P.; Xu, Y. A dynamic spatio-temporal analysis of urban expansion and pollutant emissions in Fujian Province. Int. J. Environ. Res. Public Health 2020, 17, 629. [Google Scholar] [CrossRef]
- Hien, P.D.; Men, N.T.; Tan, P.M.; Hangartner, M. Impact of urban expansion on the air pollution landscape: A case study of Hanoi, Vietnam. Sci. Total Environ. 2020, 702, 134635. [Google Scholar] [CrossRef]
- Joshua, U.; Bekun, F.V.; Sarkodie, S.A. New insight into the causal linkage between economic expansion, FDI, coal consumption, pollutant emissions and urbanization in South Africa. Environ. Sci. Pollut. Res. 2020, 27, 18013–18024. [Google Scholar] [CrossRef]
- Zhang, K.N.; Leeuw, G.; Yang, Z.Q.; Chen, X.F.; Jiao, J.S. The Impacts of the COVID-19 Lockdown on Air Quality in the Guanzhong Basin, China. Remote Sens. 2020, 12, 3042. [Google Scholar] [CrossRef]
- Zhao, M.; Cheng, W.M.; Zhou, C.H.; Li, M.C.; Huang, K.; Wang, N. Assessing spatiotemporal characteristics of urbanization dynamics in Southeast Asia using time series of DMSP/OLS nighttime light data. Remote Sens. 2018, 10, 47. [Google Scholar] [CrossRef]
- Wang, F.; Fan, W.N.; Liu, J.; Wang, G.; Chai, W. The effect of urbanization and spatial agglomeration on carbon emissions in urban agglomeration. Environ. Sci. Pollut. Res. 2020, 27, 24329–24341. [Google Scholar] [CrossRef] [PubMed]
- Ou, J.M.; Meng, J.; Zheng, J.Y.; Mi, Z.F.; Bian, Y.H.; Yu, X.; Liu, J.R.; Guan, D.B. Demand-driven air pollutant emissions for a fast-developing region in China. Appl. Energy 2017, 204, 131–142. [Google Scholar] [CrossRef]
- Li, F.; Zhou, T. Effects of urban form on air quality in China: An analysis based on the spatial autoregressive model. Cities 2019, 89, 130–140. [Google Scholar] [CrossRef]
- Zhao, S.; Liu, S.L.; Hou, X.Y.; Beazley, R.; Sun, Y.X. Identify the contributions of multiple driving forces to PM10 and PM2.5 pollution in urban areas in China. Sci. Total Environ. 2019, 663, 361–368. [Google Scholar] [CrossRef] [PubMed]
- Lopez-Restrepo, S.; Yarce, A.; Pinel, N.; Quintero, O.L.; Segers, A.; Heemink, A.W. Forecasting PM10 and PM2.5 in the Aburrá Valley (Medellín, Colombia) via EnKF based data assimilation. Atmos. Environ. 2020, 232, 117507. [Google Scholar] [CrossRef]
- Li, Q.T.; Lu, L.L.; Weng, Q.H.; Xie, Y.H.; Guo, H.D. Monitoring Urban Dynamics in the Southeast U.S.A. Using Time-Series DMSP/OLS Nightlight Imagery. Remote Sens. 2016, 8, 578. [Google Scholar] [CrossRef]
- Eleanor, C.S.; Karen, C.S. Characterizing urban infrastructural transitions for the Sustainable Development Goals using multi-temporal land, population, and nighttime light data. Remote Sens. Environ. 2019, 234, 111430. [Google Scholar] [CrossRef]
- Peng, J.; Lin, H.X.; Chen, Y.Q.; Blaschke, T.; Luo, L.W.; Xu, Z.H.; Hu, Y.N.; Zhao, M.Y.; Wu, J.S. Spatiotemporal evolution of urban agglomerations in China during 2000–2012: A nighttime light approach. Landsc. Ecol. 2020, 35, 421–434. [Google Scholar] [CrossRef]
- Chang, S.P.; Wang, J.; Zhang, F.F.; Niu, L.W.; Wang, Y.T. A study of the impacts of urban expansion on vegetation primary productivity levels in the Jing-Jin-Ji region, based on nighttime light data. J. Clean Prod. 2020, 263, 121490. [Google Scholar] [CrossRef]
- Andrade-Núñez, M.J.; Mitchell Aide, T. The Socio-Economic and Environmental Variables Associated with Hotspots of Infrastructure Expansion in South America. Remote Sens. 2020, 12, 116. [Google Scholar] [CrossRef]
- Lloyd, C.; Catney, G.; Williamson, P.; Bearman, N. Exploring the utility of grids for analysing long term population change. Comput. Environ. Urban Syst. 2017, 66, 1–12. [Google Scholar] [CrossRef]
- Chen, H.; Huang, Y.; Shen, H.Z.; Chen, Y.L.; Ru, M.Y.; Chen, Y.C.; Lin, N.; Su, S.; Zhuo, S.J.; Zhong, Q.R.; et al. Modeling temporal variations in global residential energy consumption and pollutant emissions. Appl. Energy 2016, 184, 820–829. [Google Scholar] [CrossRef]
- Van der Werf, G.R.; Randerson, J.T.; Giglio, L.; Collatz, G.J.; Mu, M.; Kasibharla, P.S.; Morton, D.C.; DeFries, R.S.; Jin, Y.; van Leeuwen, T.T. Global fire emissions and the contribution of deforestation, savanna, forest, agricultural, and peat fires (1997–2009). Atmos. Chem. Phys. 2010, 10, 11707–11735. [Google Scholar] [CrossRef]
- Wang, R.; Tao, S.; Ciais, P.; Shen, H.Z.; Huang, Y.; Chen, H.; Shen, G.F.; Wang, B.; Li, W.; Zhang, Y.Y.; et al. High-resolution mapping of combustion processes and implications for CO2 emissions. Atmos. Chem. Phys. 2013, 13, 5189–5203. [Google Scholar] [CrossRef]
- Haining, R. Spatial Data Analysis: Theory and Practice; Cambridge University Press: Cambridge, UK, 2003. [Google Scholar]
- Rushworth, A.; Lee, D.; Mitchell, R. A spatio-temporal model for estimating the long-term effects of air pollution on respiratory hospital admissions in Greater London. Spat. Spatio Temporal Epidemiol. 2014, 10, 29–38. [Google Scholar] [CrossRef]
- Rushworth, A.; Lee, D.; Sarran, C. An adaptive spatiotemporal smoothing model for estimating trends and step changes in disease risk. J. R. Stat. Soc. C Appl. 2017, 66, 141–157. [Google Scholar] [CrossRef]
- Rue, H.; Held, L. Gaussian Markov Random Fields: Theory and Applications; Chapman and Hall/ CRC: New York, NY, USA, 2005. [Google Scholar]
- Leroux, B.; Lei, X.; Breslow, N. Estimation of dis- ease rates in small areas: A new mixed model for spatial dependence. In Statistical Models in Epidemiology, the Environment, and Clinical Trials; Halloran, M., Berry, D., Eds.; Springer: New York, NY, USA, 1999; pp. 135–178. [Google Scholar]
- Lee, D.; Rushworth, A.; Napier, G. Spatio-temporal areal unit modeling in R with conditional autoregressive priors using the CARBayesST package. J. Stat. Softw. 2018, 84. [Google Scholar] [CrossRef]
- Spiegelhalter, D.J.; Best, D.N.; Carlin, B.P.; Linde, A.V.D. Bayesian measures of model complexity and fit. J. R. Stat. Soc. 2002, 64, 583–639. [Google Scholar] [CrossRef]
- Ma, Z.W.; Hu, X.F.; Huang, L.; Bi, J.; Liu, Y. Estimating ground-level PM2.5 in china using satellite remote sensing. Environ. Sci. Technol. 2014, 48, 7436–7444. [Google Scholar] [CrossRef] [PubMed]
- Wang, Z.B.; Fang, C.L. Spatial-temporal characteristics and determinants of PM2.5 in the Bohai Rim Urban Agglomeration. Chemosphere 2016, 148, 148–162. [Google Scholar] [CrossRef] [PubMed]
- Wang, J.Y.; Wang, S.J.; Li, S.J. Examining the spatially varying effects of factors on PM2.5 concentrations in Chinese cities using geographically weighted regression modeling. Environ. Pollut. 2019. [Google Scholar] [CrossRef] [PubMed]
- Zhang, X.B.; Yu, W.; Zhang, Y.L.; Song, J.P.; Wang, Z.B. Spatio-temporal differentiation and its influencing factors of regional economic growth in Beijing-Tianjin-Hebei region. J. Geogr. Sci. 2018, 73, 1985–2000. [Google Scholar] [CrossRef]
- Chuang, K.J.; Lin, L.Y.; Ho, K.F.; Su, C.T. Traffic-related PM2.5 exposure and its cardiovascular effects among healthy commuters in Taipei, Taiwan. Atmos. Environ. 2020, 7, 100084. [Google Scholar] [CrossRef]
- Bai, L.; Jiang, L.; Yang, D.Y.; Liu, Y.B. Quantifying the spatial heterogeneity influences of natural and socioeconomic factors and their interactions on air pollution using the geographical detector method: A case study of the Yangtze River Economic Belt, China. J. Clean Prod. 2019, 232, 692–704. [Google Scholar] [CrossRef]


| Variables | Description | Mean | Standard Deviation |
|---|---|---|---|
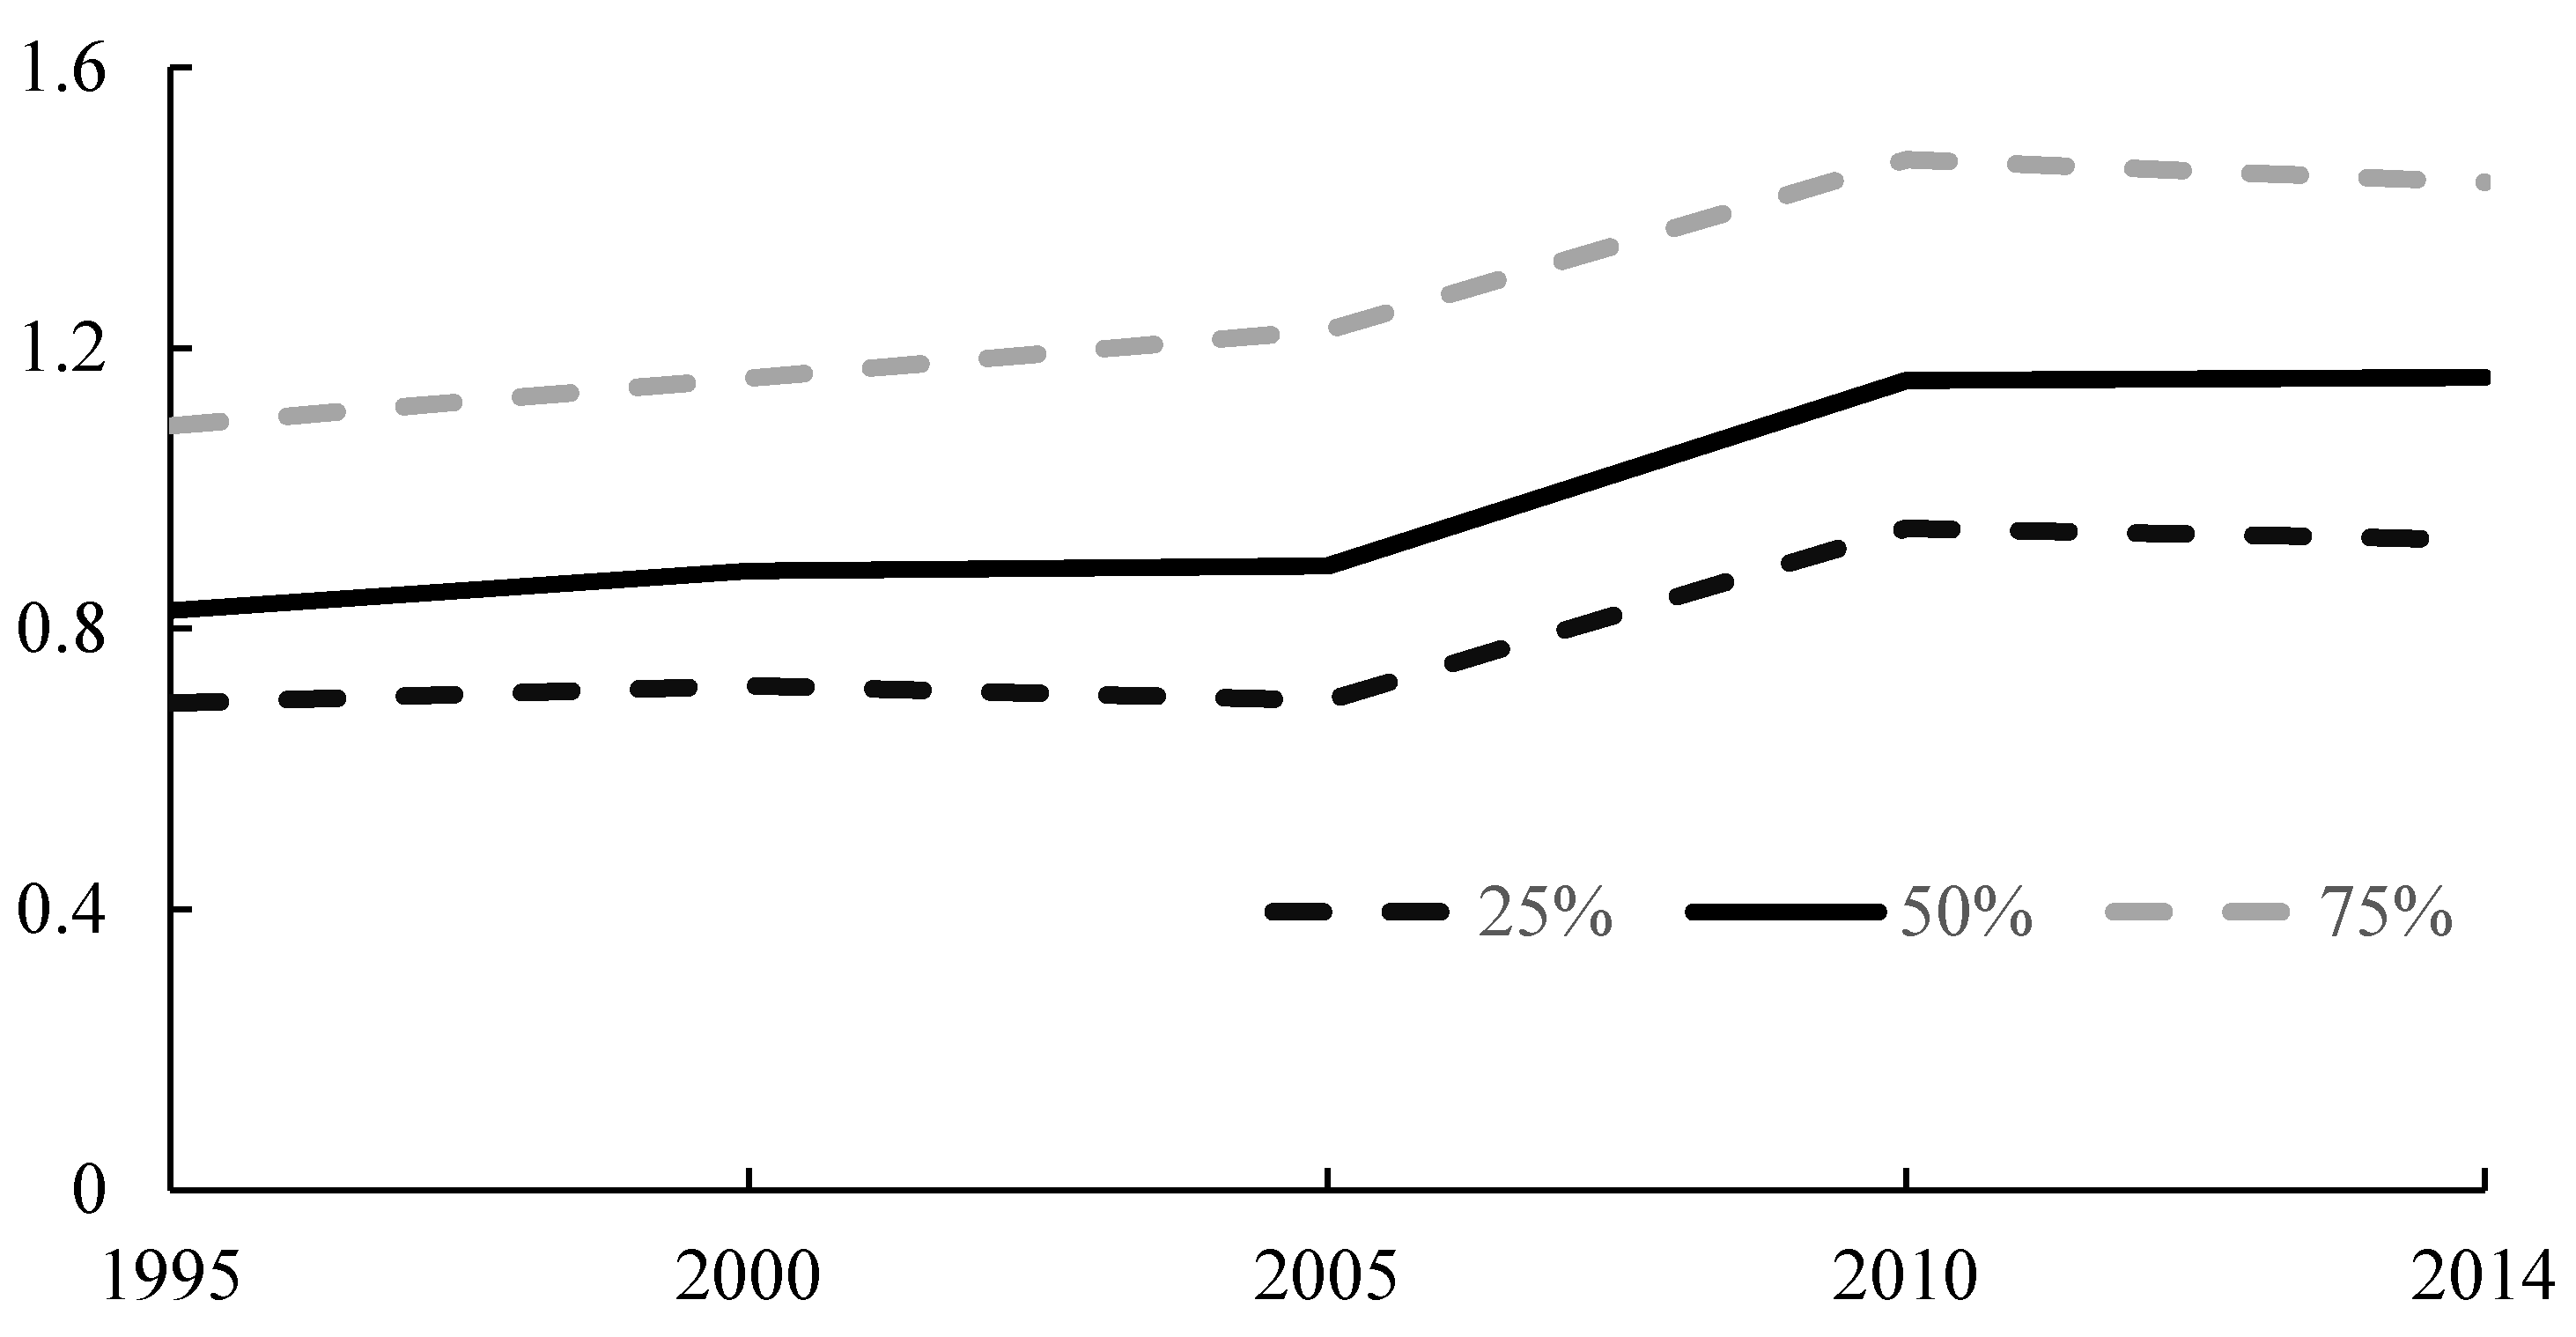
| log LD | log of luminosity density | 0.9397 (1995) | 0.3726 |
| 1.1392 (2014) | 0.4632 | ||
| log Tran | log of PM2.5 emission intensity from transport sector (g/km2) | 3.9147 (1995) | 0.6771 |
| 4.4775 (2014) | 0.6666 | ||
| log RC | log of PM2.5 emission intensity from residential and commercial sector (g/km2) | 6.2076(1995) | 0.2712 |
| 6.4677 (2014) | 0.2736 | ||
| log Indu | log of PM2.5 emission intensity from industry sector (g/km2) | 6.2749 (1995) | 0.5771 |
| 6.3509 (2014) | 0.5067 | ||
| log EP | log of PM2.5 emission intensity from energy production sector (g/km2) | 5.6675 (1995) | 0.4506 |
| 5.9665 (2014) | 0.4501 | ||
| log DW | log of PM2.5 emission intensity from deforestation wildfire sector (g/km2) | 2.5092 (1995) | 0.7176 |
| 3.8058 (2014) | 0.6937 | ||
| log Agri | log of PM2.5 emission intensity from agriculture sector (g/km2) | 4.7293 (1995) | 0.4701 |
| 4.8050 (2014) | 0.3344 |
| Variables | Median | 2.5% | 97.5% |
|---|---|---|---|
| Intercept | −1.5643 | −2.1456 | −0.9747 |
| log Tran | 0.0789 * | 0.0421 | 0.1141 |
| log RC | 0.0726 | −0.0218 | 0.1629 |
| log EP | 0.1360 * | 0.0972 | 0.1758 |
| log Indu | 0.1566 * | 0.1062 | 0.2041 |
| log DW | −0.0063 | −0.0245 | 0.013 |
| log Agri | 0.0106 | −0.0348 | 0.0541 |
| τ2 | 0.0629 | 0.057 | 0.0694 |
| σ2 | 0.0009 | 0.0006 | 0.0014 |
| 0.9598 | 0.9107 | 0.9874 | |
| λ | 0.9138 | 0.8708 | 0.9561 |
| DIC | −3348.4014 | ||
| Likelihood-value | 2566.7320 | ||
| Variables | Model 2 | Model 3 | Model 4 | ||||||
|---|---|---|---|---|---|---|---|---|---|
| Median | 2.5% | 97.5% | Median | 2.5% | 97.5% | Median | 2.5% | 97.5% | |
| Intercept | −3.1064 | −4.1723 | −2.0286 | −2.1633 | −3.5688 | −0.7559 | −1.2961 | −2.0044 | −0.6205 |
| log Tran | 0.0633 * | 0.0057 | 0.1268 | 0.1129 | −0.0024 | 0.2337 | 0.0564 * | 0.0112 | 0.1053 |
| log EP | 0.4266 * | 0.2916 | 0.5508 | 0.0608 | −0.0379 | 0.1595 | 0.1179 * | 0.0702 | 0.1674 |
| log Indu | 0.0431 | −0.1232 | 0.2117 | 0.3256 * | 0.1712 | 0.4843 | 0.1837 * | 0.1240 | 0.2466 |
| τ2 | 0.0160 | 0.0084 | 0.0292 | 0.0159 | 0.0103 | 0.0244 | 0.0601 | 0.0538 | 0.0671 |
| σ2 | 0.0024 | 0.0012 | 0.0049 | 0.0017 | 0.0009 | 0.0033 | 0.0010 | 0.0007 | 0.0015 |
| 0.2858 | 0.0307 | 0.7181 | 0.7388 | 0.4229 | 0.9317 | 0.9209 | 0.8643 | 0.9626 | |
| λ | 0.9165 | 0.7604 | 0.9952 | 0.7384 | 0.4951 | 0.9469 | 0.9163 | 0.8664 | 0.9616 |
| DIC | −207.5416 | −240.9145 | −2754.7026 | ||||||
| Likelihood-value | 157.8441 | 174.3942 | 2124.7144 | ||||||
| Variables | 2005 | 2010 |
|---|---|---|
| log Tran | 0.5986 * | 0.7518 * |
| log EP | 0.7080 * | 0.6676 * |
| log Indu | 0.7108 * | 0.7062 * |
Publisher’s Note: MDPI stays neutral with regard to jurisdictional claims in published maps and institutional affiliations. |
© 2021 by the authors. Licensee MDPI, Basel, Switzerland. This article is an open access article distributed under the terms and conditions of the Creative Commons Attribution (CC BY) license (http://creativecommons.org/licenses/by/4.0/).
Share and Cite
Zhao, S.; Xu, Y. Exploring the Dynamic Spatio-Temporal Correlations between PM2.5 Emissions from Different Sources and Urban Expansion in Beijing-Tianjin-Hebei Region. Int. J. Environ. Res. Public Health 2021, 18, 608. https://doi.org/10.3390/ijerph18020608
Zhao S, Xu Y. Exploring the Dynamic Spatio-Temporal Correlations between PM2.5 Emissions from Different Sources and Urban Expansion in Beijing-Tianjin-Hebei Region. International Journal of Environmental Research and Public Health. 2021; 18(2):608. https://doi.org/10.3390/ijerph18020608
Chicago/Turabian StyleZhao, Shen, and Yong Xu. 2021. "Exploring the Dynamic Spatio-Temporal Correlations between PM2.5 Emissions from Different Sources and Urban Expansion in Beijing-Tianjin-Hebei Region" International Journal of Environmental Research and Public Health 18, no. 2: 608. https://doi.org/10.3390/ijerph18020608
APA StyleZhao, S., & Xu, Y. (2021). Exploring the Dynamic Spatio-Temporal Correlations between PM2.5 Emissions from Different Sources and Urban Expansion in Beijing-Tianjin-Hebei Region. International Journal of Environmental Research and Public Health, 18(2), 608. https://doi.org/10.3390/ijerph18020608