1. Introduction
Taiwan and other parts of East Asia experienced the Severe Acute Respiratory Syndrome (SARS) outbreak in 2003, which led to a sudden and widespread break-out that severely strained health systems. As a result of this epidemic, the medical staff workforce in Taiwan has become strained and insufficient due to a shortage of health care workers and an aging society after 2003. The United Nations World Population Prospects (2019) [
1] pointed out that, for the first time in human history, adults over 65 years old outnumbered children under 5 years of age worldwide in 2018; moreover, in 2015, there were more than twice as many elderly persons over 65 years old as children under 5. The proportion of the world’s elderly population is expected to reach nearly 12% in 2030, 16% in 2050, and possibly almost 23% by 2100 [
2].
As the elderly population continues to increase in number, countries are investing significantly in long-term care resources. For example, the United States has provided insurance since 1965 under the government-run Medicaid and Medicare programs, which cover home and nursing care (mainly medical care), but strictly speaking, there are no complete or separate long-term care systems in the United States. The U.S. government even reduced Medicare, Medicaid, Children’s Health Insurance Program (CHIP), and marketplace subsidies by about 25%, or
$1.1 trillion, in its 2019 budget. Three-fifths of the budget relates to Medicare, which covers 61 million people over the age of 65 or disabled, while the other two-fifths go to Medicaid and CHIP. Social care services produce outcomes that impact several critical aspects of the elderly over the age of 65. From the perspective of such services, the long-term care policy objective is not to spend the least amount of money, but to produce the best quality of life for the elderly. The average active life expectancy (A.L.E.) for men and women was 69.0 and 73.9 years old in Taiwan in 2017, respectively [
3], while the number of unhealthy live years for men and women is 8.3 years and 9.8 years. The data indicate in Taiwan that the elderly need long-term care service for an average of 9 years.
Family sizes around the world are mostly getting smaller now. In Spain, an Alzheimer’s disease study of found that the family caregiver is usually a middle-aged woman with medium-level education and living at home. The researchers attributed this women’s intrinsic sense of obligation. These caregivers must modify their lifestyle and habits to fit their new caregiver role. They suffer from long-term emotional distress, and neuropsychiatric symptoms negatively affect their mental health. When the relationship between caregiver and recipient deteriorates, it will also worsen the severity of neuropsychiatric symptoms [
4]. In the United States, older caregivers are usually white, and most caregivers are their spouses. They have a college degree and earn an average of US
$5500 a month. Caregivers’ higher health satisfaction, well-being, high education level, and high income can enable individuals to help solve health problems and reduce depression. Those conditions can provide support services and offer good care services [
5]. In the future, nursing homes could alleviate the elderly care workforce’s problems by increasing the number of long-term care students, professionals, and caregivers in the United States [
6]. The situation is similar in Taiwan, there are fewer and fewer family members, and there is a lack of caregiver supply in Taiwan.
Taiwan’s Long Term Care Plan 1.0 was formulated in 2007, and an investment of NT$81.7 billion was initiated during 2017–2016. Subsequently, in September 2016 the Legislative Yuan passed the Long-Term Care Ten-Year Plan 2.0 from 2017 to 2026, for an estimated much larger budget of NT$472.1 billion. This plan will expand the target groups and services when integrating social care, under the goal of creating a comprehensive care system that combines medical care, L.T.C. services, housing, prevention, and social assistance to allow people with disabilities to receive the care they need within a 30-min drive of their home. This program has set up three types of service centers for people needing long-term care. Tier A refers to community-integrated service centers that coordinate and link care service resources according to the care plan designated by the care managers, establishes localized service delivery systems that integrate and connect to Tier B and Tier C resources, and provide pick-up and transport services relating to the three tiers through community transport and care transport personnel. Tier B denotes combined service centers that elevate community capacity, provide L.T.C. services, and increase the public’s diversity of benefits. Tier C covers L.T.C. stations located in the neighborhoods that provide respite services in those areas and implement primary prevention programs.
According to the ten-year long-term care plan of the Ministry of Health and Welfare, at the end of 2018 [
7], the number of people needing long-term care services at home was as high as 96,522, followed by 8968 people who needed daytime care, while only 693 needed care at home. The number of cases requiring home services was 56,038 (58%) for women and 44,840 (42%) for men.
As the country’s overall population structure becomes older, the demand for long-term care is increasing rapidly, but the number of nurses and the increasing aging rate cannot balance supply and demand. According to statistics released by the Ministry of Health and Welfare of Taiwan, the average nurse-patient ratio in the world in medical centers is 1:7.7, whereas the nurse-patient ratio in Taiwan is 1:8.6 [
8], which is much higher than that in Japan (1:7) [
9] and the United States and Australia (1:4) [
10]. Therefore, the government’s training of long-term licensors and the setting up of care service stations are alternative solutions for long-term care workforce needs. However, under Taiwan’s long-term care service capacity improvement plan, only 21% of the total number of licensed long-term care employees had received a certificate for completing training in September 2017 [
11,
12].
Hu et al. [
13] used the carrying capacity theory to explore the primary medical staff’s distribution in Taiwan’s administrative regions. Their study found that the supply of medical staff has increased year by year but is concentrated in certain administrative regions and shows overall a shortage of medical staff, more so for nurses than for doctors. The shortage of nurses has pushed Taiwan’s health system to a disadvantageous situation by crowding out caregivers who work in long-term care facilities. Overall, the understaffing of the health care system has become a critical issue in Taiwan.
Taiwan’s problems now include increasing its aging population and the shortages in nurses and long-term care staff. According to the Push-Pull-Mooring theory, caregivers can be regarded as a kind of human capital in each county or city. When the hospital or regional area has enough workforce, it can attract people to move in. The Long-Term-Care Plan 2.0 can help the elderly move forward by preventing incapacitation and utilizing hospice care at home, thus reducing disability and decreasing the number of years requiring long-term care. These goals can only be achieved using outstanding long-term care employees. The resources invested by the government are expected to improve the quality of long-term care. Therefore, this research explores the shortage or surplus of long-term care efficiency spanning a period of ten years in Taiwan.
As of March 2020, the total number of long-term care institutions, nursing homes, and veterans’ homes hit 1649, with a total of 114,308 beds, revealing a bed number that is far below the number of disabled, elderly individuals. There are currently 492,399 elderly disabled persons over 65 [
14]. With the gradual aging of the population structure, long-term care and the adequacy of said workers have become national issues. Because of the influence of economic development, the second purpose of this research is to use the Push-Pull-Mooring theory to explain the migration theory and discuss the dynamic DEA efficiency of each city and county for 2010–2019 with regards to long-term care in the country.
2. Literature Review
There is shortage of health care workforce throughout the world, and various governments are facing high demand for care due to their aging societies. An alternative mechanism appears to be needed to deal with this medical staff shortage. Patient-centered nursing homes in the U.S. connect elderly adult resources and providers to assess the goals and strategies for taking care of older persons. Nursing homes provide primary health care management, patient rights advice, community communications, and integrated elderly care services. In the future, the problems of the elderly care workforce in U.S. nursing homes could be solved by increasing the number of long-term care students, professionals, and caregivers [
6]. Moreover, the application of technology can also reduce contact between people, which is also a way to avoid disease transmission.
With the development of artificial intelligence, many machine learning models have been used in the early study of diabetes risk, such as the novel ensemble learning algorithm, which can investigate personal information, eating habits, exercise status, and family history of the elderly to predict incidences of the disease [
15]. More advanced ways of using telemedicine can be done through the predictive diagnosis of artificial intelligence, by collecting data through a structured database via data mining, and from the small collection of patient information on at-home caregivers. Like novel ensemble learning algorithms, artificial intelligence skills can provide different results and help analyze a model to predict patients’ health risks. The results can be used as future hospital resources for home caregivers, hence providing patients at home with better treatment and reducing the risk of in-hospital infection [
16]. In 2007, the Taiwanese government began to promote a program of setting up long-term care departments and cultivating talent to improve healthcare workers’ needs. Taiwan has a national health insurance (NHI) system that takes care of residents of all ages, but because it faces an aging population and low birth rate, medical workforce demand has increased.
As Taiwan’s society ages, the demand for elderly healthcare services is rising, especially among middle-aged and older patients who are disabled and living independently. Because of the falling population of children and changing family structure, most families cannot afford long-term care. There are many middle-income and low-income families on the verge of poverty in Taiwan and have a monthly income of less than NT
$30,000 (about US
$1000). For this reason, they cannot afford long-term care costs and need to take on the responsibility of care by themselves or through family members [
17].
The Taiwan government started to promote a long-term care plan in 2007 and launched Long-term Care Plan 2.0 in 2017. Starting in 2018, a long-term care service payment system was activated to promote the establishment of care centers categorized into three tiers: A, B, and C. In May 2019, there were 545 Tier A centers, 3439 Tier B centers, and 2014 Tier C centers [
18]. Long-term care resources in all counties and cities across Taiwan have developed rapidly under governmental resources for over ten years. However, due to significant differences in urban and rural areas’ population structures, there are substantial gaps in long-term care services planning and development in different counties and cities.
There are several challenges in the Long-term Care Plan 2.0 implementation process. For example, long-term care workers face cultural and social structure challenges that require more efficient coordination among long-term care managers, attendants, indigenous families, one-step service delivery centers that can integrate different care options, and better indigenous services in the future. Disability studies have found that age significantly affects long-term care services, inpatient services, emergency services, and outpatient services [
19].
Demographers have pointed out that migration is a form of changed behavior associated with people’s residence [
20]. Three forces influence migration: (1) the push effect, which is a negative factor that leads people to leave their original homes; (2) the pull effect, which is a positive factor that attracts people to their places of residence; and (3) the mooring effect, which refers to personal and social factors that accelerate the departure of migrants or people’s continuation of living in the places of their original homes. These three forces make up the Push-Pull-Mooring (PPM) model, which explores middle-aged and elderly patients’ intentions to switch to cloud healthcare services [
21]. Lai and Wang (2015) [
22] showed that the elderly understanding cloud services could help solve medical service conditions; for example, changing their behavior toward a dependence network service can resolve the workforce shortage. Using cloud services can improve the elderly’s quality of medical treatment. The push effect refers to pushing away cynical motives—for example, in an online real-person English learning platform and negative feelings in learning convenience, service quality, and perceived price. The pull effect is a significant e-learning motivation in an online real-person English learning platform. The mooring effect demonstrates switching intentions, which incur switching costs. If a customer has become accustomed to an original online platform and wants to change to another forum, then he/she needs to spend money and time to get used to the new user interface [
23].
According to the Push-Pull-Mooring theory, long-term care workers in each county or city can be regarded as a kind of human capital. The Human Capital theory is developed based on the value, rarity, imitability, and substitutability of personnel from the Resource-based View (RBV). It can create a competitive advantage for organizations through human capital [
24]. Therefore, a company or area with an adequate workforce can attract people to move there. Migration behavior is a human cost input that results in profit maximization. People are expected to move to a county or city when it results in more significant benefits than the moving costs.
For this reason, some people choose to migrate. In health care fields, there is also a migration of talented physicians and health care workers from more impoverished places, leading to a weakening of the health care system and a severe loss of medical talent. Physicians’ push effect includes political instability and corruption, inadequate equipment and facilities, and an inability to support high-quality child-care programs. Physicians’ pull effect includes strong and robust health systems, political stability, and improved quality of life for physicians and their families [
25]. The PPM framework has been applied in mobile personal cloud storage services. Moreover, the pull factor’s recovery significantly increases users’ willingness to switch to another technology [
26].
Many scholars have used DEA in the medical field to help analyze hospital operating efficiency. The commonly searched outputs in Taiwan’s Ministry of Health and Welfare database include the number of medical practitioners, number of beds, number of general outpatients, number of particular medical users, monthly clinical practice registrations of licensed nurses, number of medical operations, and average number of hospitalized patients. One systematic study of the nursing home literature adopted DEA analysis, finding that 68% of papers employed the CRS model and 86% used input-oriented technical efficiency. For variable selection, 16 articles utilized full-time equivalent staff (including nursing and non-nursing) as the input variable, while a few papers took population aged over 84 as the output variable. In the DEA field of research, most articles used several beds, full-time nurses, and labor wage as inputs and the number of resident days, number of residents, or case-mix index as outputs [
27].
Another paper used windows DEA to evaluate maternal health services’ efficiency in different administrative regions of Mexico, finding that the efficiency score is the best in the northern region. The lowest technical efficiency scores are in the south, where there is economic inequality under the presence of indigenous populations. The most impoverished areas have the least efficient maternal health score. For this reason, the Mexico government needs to reorganize the allocation of resources and the criteria for assignment in its administrative regions [
28].
Hu and Huang [
29] noted that the operating efficiency of public hospitals in Taiwan is deteriorating, and that the efficiency of hospital operations can be improved by the utilization of ward space and by investing in medical equipment and beds. Hu, Chang, and Chung [
6] employed population, regional income, local government expenditure on healthcare, physicians, and nurses to explore physicians’ and nurses’ target quantities in Taiwan’s administrative regions. The study found that, except for Taipei City and Chiayi County, the number of medical workers in other cities and counties did not reach the target number, indicating the need to increase the number of medical workers.
Previous literature has used overall technical efficiency or cost efficiency as the basis for creating efficiency reports. However, this approach does not consider the differences in disaggregate input efficiency scores. Therefore, this present paper explores the disaggregate input efficiency score of Hu and Chang [
30] using different county variables over ten years.
This research combines data envelopment analysis (DEA) and a PPM framework to discuss long-term care efficiency. It fills this gap in the literature and also takes Taiwan as an example to compute the distribution efficiency of a shortage in long-term care staff and to assess the target quantity of long-term care staff, the number of caregivers, the uncovered ratio of long-term care, and the actual number of residents in long-term care facilities in administrative regions. Findings present the problem of an urban-rural divide along with disparity in the country’s outer islands.
4. Data and Results
4.1. Data Sources
This study’s longitudinal-sectional data come from the 2010-2019 database of the Department of Statistics, Ministry of Health and Welfare, R.O.C. (Taiwan), with 22 DMUs each year. We measure efficiency using the dynamic DEA technique. The DMUs consist of 22 administrative regions in Taiwan: New Taipei City, Taipei City, Taoyuan City, Taichung City, Tainan City, Kaohsiung City, Yilan County, Hsinchu County, Miaoli County, Changhua County, Nantou County, Yunlin County, Chiayi County, Pingtung County, Taitung County, Hualien County, Penghu County, Keelung City, Hsinchu City, Chiayi City, Kinmen County, and Lienchiang County. Six counties and cities were upgraded to become municipalities of Taiwan in 2014: Taipei City, Kaohsiung City, New Taipei City, Taichung City, Tainan City, and Taoyuan City. This study assumes this action has created a pull effect, because there are more power and resources at the organization, human resource, and financial budget levels than in non-municipalities.
4.2. Descriptive Statistics Analysis
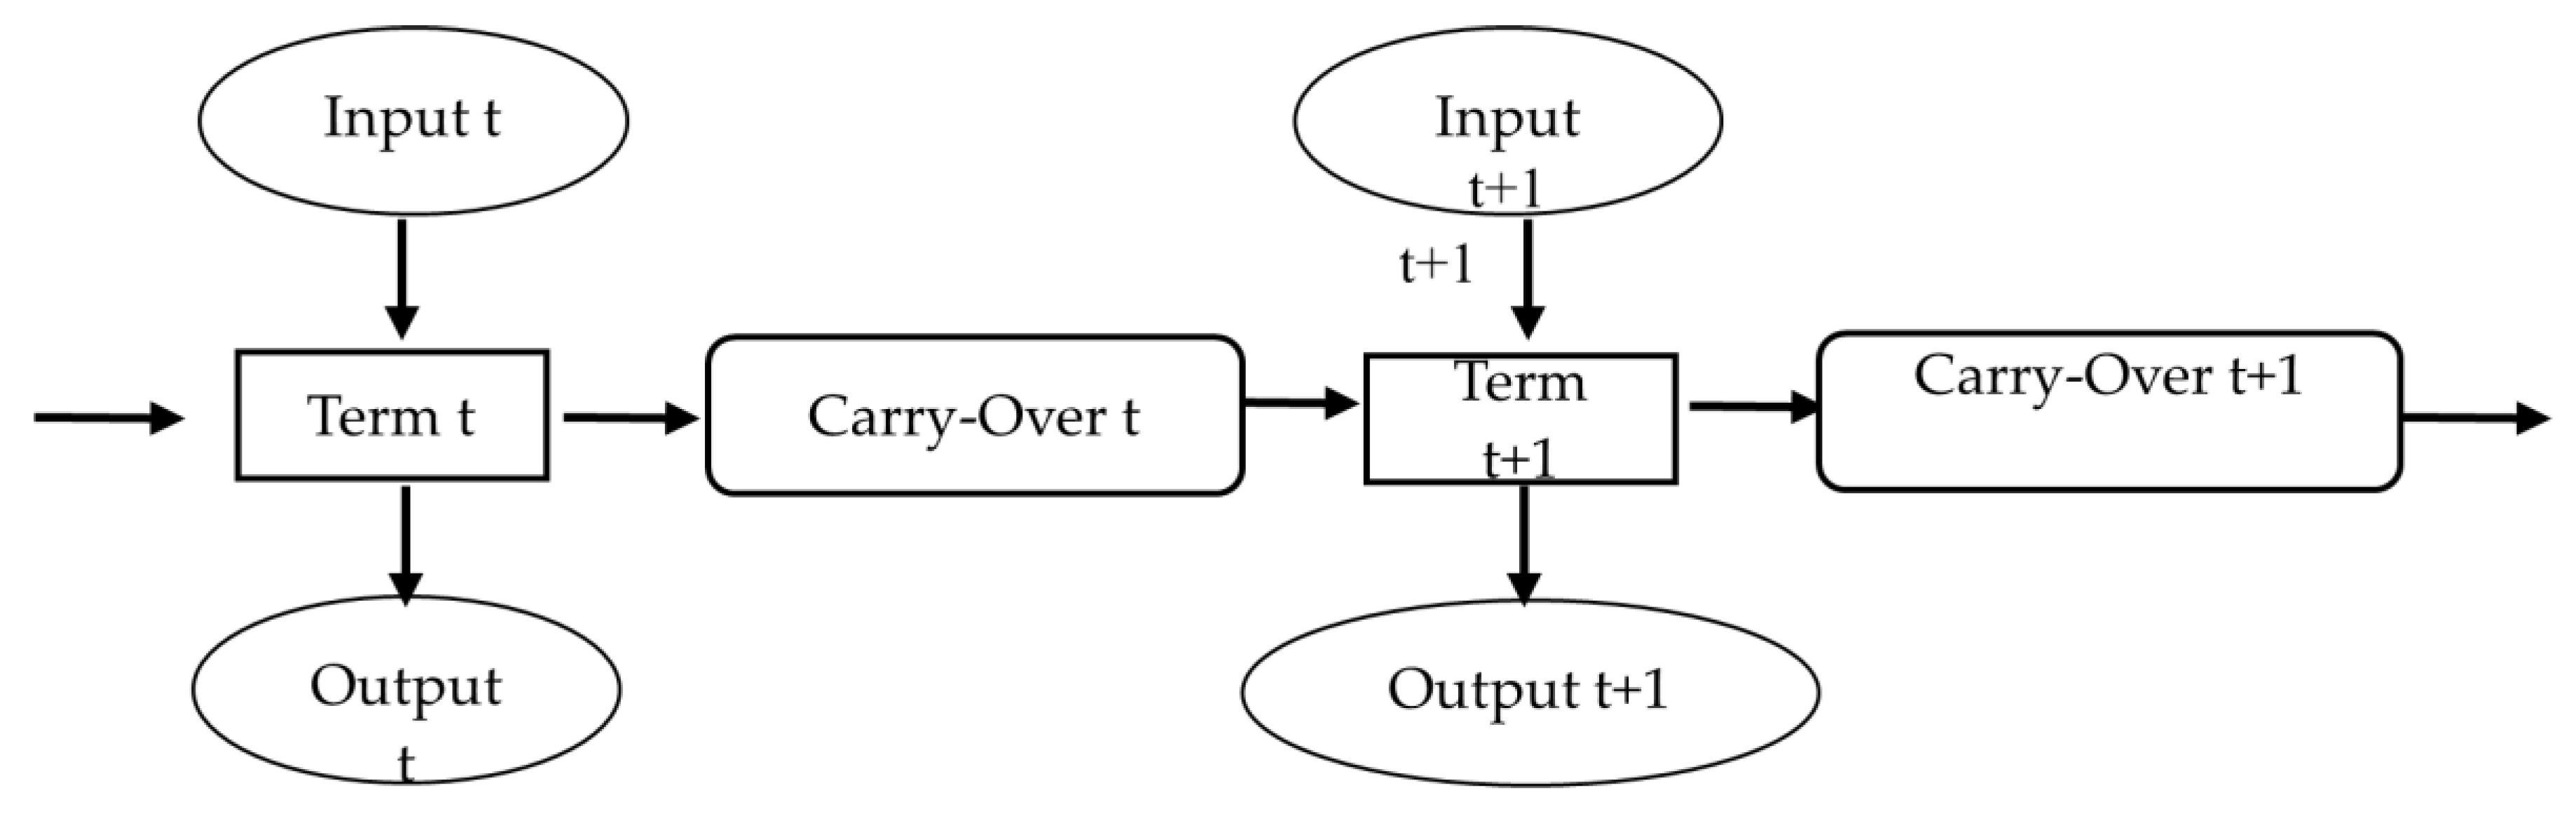
This study uses each municipality and county as a decision-making unit and defines x1 is the total number of caregivers in long-term care facilities in a county, x2 is the total number of licensed caregivers in a county, and y1 is the total number of people needing long-term care services in a county. Moreover, y2 is the actual total number of people living in a long-term care institution. The carry-over variable is the number of individuals over 65 years of age in each county or city; it does not directly indicate that counties and cities have improved long-term care productivity when calculating their long-term care technical efficiency, but is closely related to the number of nurses and caregivers working in long-term care facilities. Long-term care facilities can provide adequate long-term care services only.
Table 1 lists the descriptive statistics of the input, output, and carry-over variables. This study explains the distribution of human resources in different cities and counties from the perspective of the PPM theory. DEA is a non-parametric method using linear programming, and correlation analysis is used to examine the isotonic relationship in which an output will not decrease with an increase in any input. Before we engage in DEA analysis, the input and output variables should have an isotonic relationship.
Table 2 shows the correlation coefficient between the input and output variables. A positive relation among them indicates that increasing the inputs does not cause the outputs to decrease. Between inputs, the number of caregivers in long-term care facilities has a 0.747 correlation coefficient with the number of caregivers in temporary care facilities. The correlations between inputs and outputs are all non-negative, showing that the isotonicity property is satisfied for all inputs and outputs in the data.
4.3. Technical Efficiency
From the Push-Pull-Mooring theory perspective, the better the efficiency is, the greater is the pull force. This research uses the dynamic SBM input-oriented model to explore efficiency in each city and county. To explain more concisely the states of push, pull, and mooring forces in each county and city, we set up the following formula to represent their respective long-term care shortages. The relation between the uncovered ratio (shortage degree) and disaggregate output efficiency is: Uncovered ratio (shortage degree) = 1 − disaggregate output efficiency. Descriptive statistics of overall average inefficiency during 2010–2019 are shown in
Table 3.
If the degree of shortage is equal to 0, then the county and city efficiency scores have reached the target number. In other words, the county and the city have a pull effect, which is defined herein as the population migration pull rate. Conversely, if the degree of shortage is greater than 0, then it means that the target number is higher than the actual number, and the county and city need to increase the number of long-term care receivers (y1) or the number of residents in long-term care facilities (y2). It also implies that the county or city does not have a pull effect, but could have a push effect, spurring people who require long-term care services to move to other counties and cities. This study defines the push effect as the population migration push rate. The number of elderly individuals over age 65 in each county or city is a good carry-over variable and equivalent to the mooring effect in the PPM theory. In other words, personal and social factors may accelerate the departure of migrants or allow them to remain in the places of their original homes. When the proportion of the population above age 65 is higher in a county or city, it is necessary to provide more excellent services for long-term care receivers and increase residents in long-term care facilities.
Table 4 shows overall insufficiency in long-term care for each municipality. The insufficiency score equals one minus the overall efficiency score. Here, Taipei City overall insufficiency is as high as 0.43 and Taoyuan County’s overall insufficiency is 0.42, whereas the average insufficiency in Hsinchu County (under the variable rural) is as high as 0.40. Except for Lienchiang County, there is no shortage of overall efficiency scores in the outer islands. Lienchiang County ‘s overall insufficiency is the highest in Taiwan at 0.50. Over the last ten years, Penghu County ‘s efficiency scores have been perfectly balanced, but this result is different from that in the literature review, which found that six municipalities in Taiwan have more resources than the other counties and cities, indicating that their insufficiency score should be less than those of other counties and cities. One possible reason is that the efficiency provided by dynamic DEA refers to total efficiency, whereas the influence brought by each variable is ignored. In order to explain the causes of insufficiency in long-term care with municipal, rural, and outer islands areas,
Table 5 and
Table 6 list the concept of disaggregate efficiency scores for further illustration.
4.4. Uncovered Ratio for Long-Term Care in Taiwan
Table 5 reports the uncovered ratios of long-term care in Taiwan’s regions during 2010–2019, which further indicates potential expansions to include elderly in long-term care coverage in a region. For the municipality group, the average shortage is 0.39 for Taoyuan County and 0.38 for New Taipei City, indicating that 39% and 38% more elder people need to be covered by long-term care in these two places not being taken care of. In the rural group, Hsinchu County’s and Hsinchu City’s average uncovered ratios are 0.39 and 0.24 for elderly who need long-term care, but who are not being taken care of. In the outer islands, the uncovered ratio of Lienchiang County rises from 0.01 to 0.84 in 2016–2019. The reason is the decline of its elderly population, leading to its unused capacity for long-term care suddenly increasing. Put briefly, the uncovered ratios of long-term care in both municipal and rural regions indicate inefficient results. These areas should increase nursing numbers or long-term caregivers to improve long-term care efficiency.
Table 6 presents the degree of shortage of long-term care facilities in Taiwan’s regions during 2010–2019. In the municipality group, there is almost no shortage in Kaohsiung City. The average degree of shortage for Taoyuan County is 0.31. One possible reason is that residents tend to stay in long-term care facilities in Taipei City and New Taipei City, there has the best medical care system. The elderly chose to live in Taipei and New Taipei rather than Taoyuan, leading to the highest shortage in Taoyuan City in municipality. In the rural group, Keelung City have no shortage in long-term care facilities, whereas Hsinchu City and Changhua County have the highest degree of shortages. One possible reason is that residents of these two counties tend to take care of their family members who do not live in long-term care facilities, causing insufficient results for long-term care facility occupancy. In the outer islands, the average shortage is almost 0, implying that long-term care facilities there exhibit utilization efficiency.
4.5. Annual Average Uncovered Ratio and Shortage Degree in Taiwan
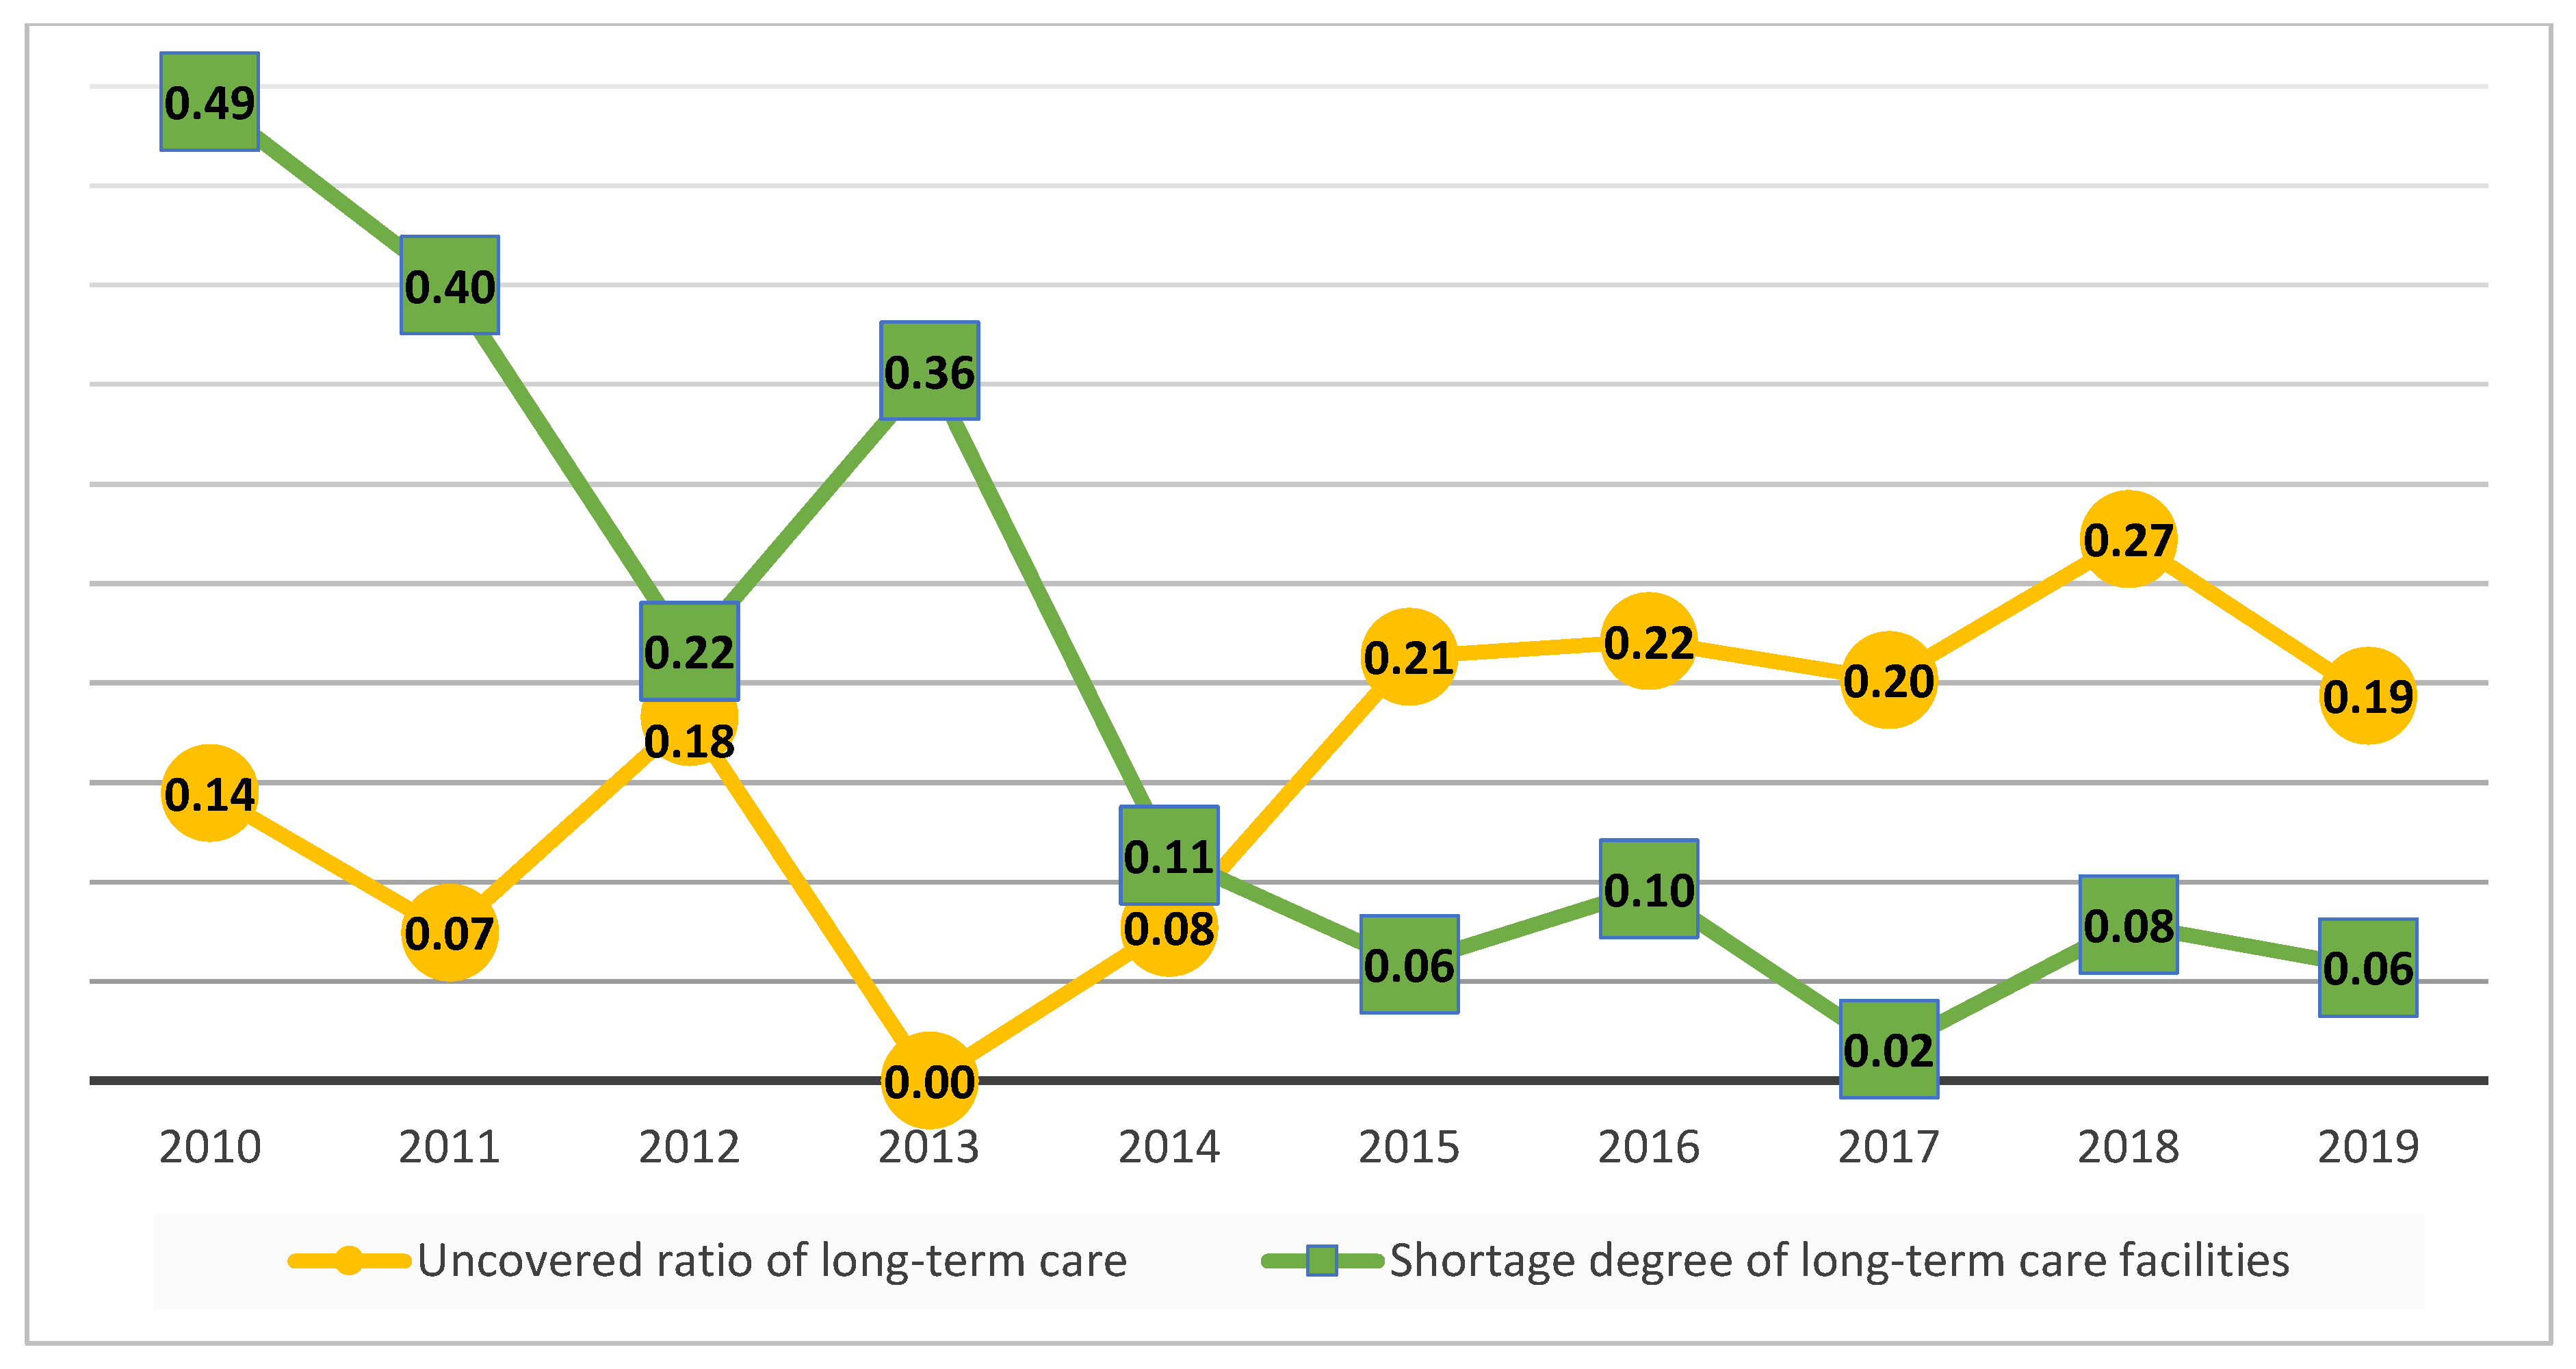
Figure 2 shows that long-term care’s uncovered ratios continue to decline from 0.14 to 0 from 2010 to 2013. However, during 2013–2018 this ratio began to rise. One possible reason might be that the aging ratio of Taiwan is increasing, such that the shortage in the nursing workforce continues to expand. The Taiwan government launched the Long-term Care Plan 2.0 in 2017, and although there was no immediate drop in uncovered ratios of long-term care in 2018, this index did decline in 2019. A lower shortage represents higher long-term care efficiency in the future. The average degree of shortage of long-term facilities is from 0.49 to 0.06 during 2010–2019. However, in 2017 this index fell almost to zero (0.02). In other words, there is virtually no shortage of long-term care facilities in Taiwan on average after 2017.
4.6. Discussion
This research employs the Push-Pull-Mooring theory and Human Capital Theory to discuss the shortage efficiency score and further explains the shortage disaggregate efficiency of each city and county in Taiwan in regard to long-term care services. This study adopts the administrative area as the DMU to discuss regional shortage in long-term care. The push effect and pull effect results are used to investigate the uneven allocation of resources among each city and county in Taiwan for 2010–2019.
This research presents the variables for the number of long-term care receivers (y
1), the actual number of long-term care facilities (y
2), and how to adjust them to achieve a number that is consistent with the target number. The supply of medical staff increases year by year, but it is concentrated in Taipei City and Chiayi County, showing an unequal distribution of medical staff in Taiwan [
13]. While, this research finds that Taoyuan County’s location near Taipei City and New Taipei City, there has the best medical care system. The elderly chose to live in Taipei and New Taipei rather than Taoyuan, leading to the highest shortage in Taoyuan City in municipality. So, there is a more significant long-term care shortage degree in Taoyuan County. It shows that people desire to move to locations with sufficient long-term care resources, leading to presenting a pseudo-thrust result in Taoyuan City. The results are similar to results from the Karan et al. (2016) [
25], indicating that political instability and corruption, inadequate equipment and facilities, and an inability to support high-quality child-care programs. Physicians’ pull effect includes strong and robust health systems, political stability, and improved quality of life for physicians and their families. That is likely why physicians move to a better working environment. The same reason the long-term care needs move to Taoyuan. People who receive long-term care will want to be cared for in a county or city with abundant long-term care resources or in a neighborhood community with a sound health care system in order to obtain the best quality of care when needed in an emergency. For this reason, the government should reduce the overall insufficiency by improving the workforce of local caregivers and increasing the number of people who can be admitted to long-term care institutions to achieve a pull result.
About long-term care facilities shortage, Keelung City’s overall insufficiency is almost 0. However, some areas conversely have insufficient resources in the rural group, such as Hsinchu City, it’s shortage is 0.37, As demographic statistics [
34] show, in 2019, Hsinchu City had the lowest degree of aging and the highest proportion of supported children under five years old. For this reason, Hsinchu City has too much long-term care facilities, due to the shortage of long-term care facilities in Hsinchu City is the highest in Taiwan.
For the outer islands, the overall insufficiency of Penghu County and Kinmen County is almost 0 from 2010 to 2019. In 2018, the degree of shortage suddenly rose in Lienchiang County, because a decline in the elderly population led to a sudden increase in long-term care’s overall insufficiency. The outer islands are the most resource-poor regions in Taiwan, with no population migration. If long-term caregiver numbers, and number of caregivers in temporary care facilities unchanged, then a decline in the elderly population will lead to a sudden increase in long-term care shortage efficiency, presenting a push effect. Because of the lack of medical care resources in the outer islands, telemedicine is available in the outer islands [
16], through telemedicine technology, long-term care patient’s daily health data was collected. When the patient needs emergency medical treatment, such data can provide detailed health information, so that a hospital can immediately receive disease treatment. Cooperation between hospitals and nursing homes may attract people to move to the outer islands, which would also improve long-term care efficiency.


