Association of Food Insecurity with Nutrient Intake and Depression among Korean and US Adults: Data from the 2014 Korea and the 2013–2014 US National Health and Nutrition Examination Surveys


Abstract
1. Introduction
2. Materials and Methods
2.1. Data Sources and Study Populations
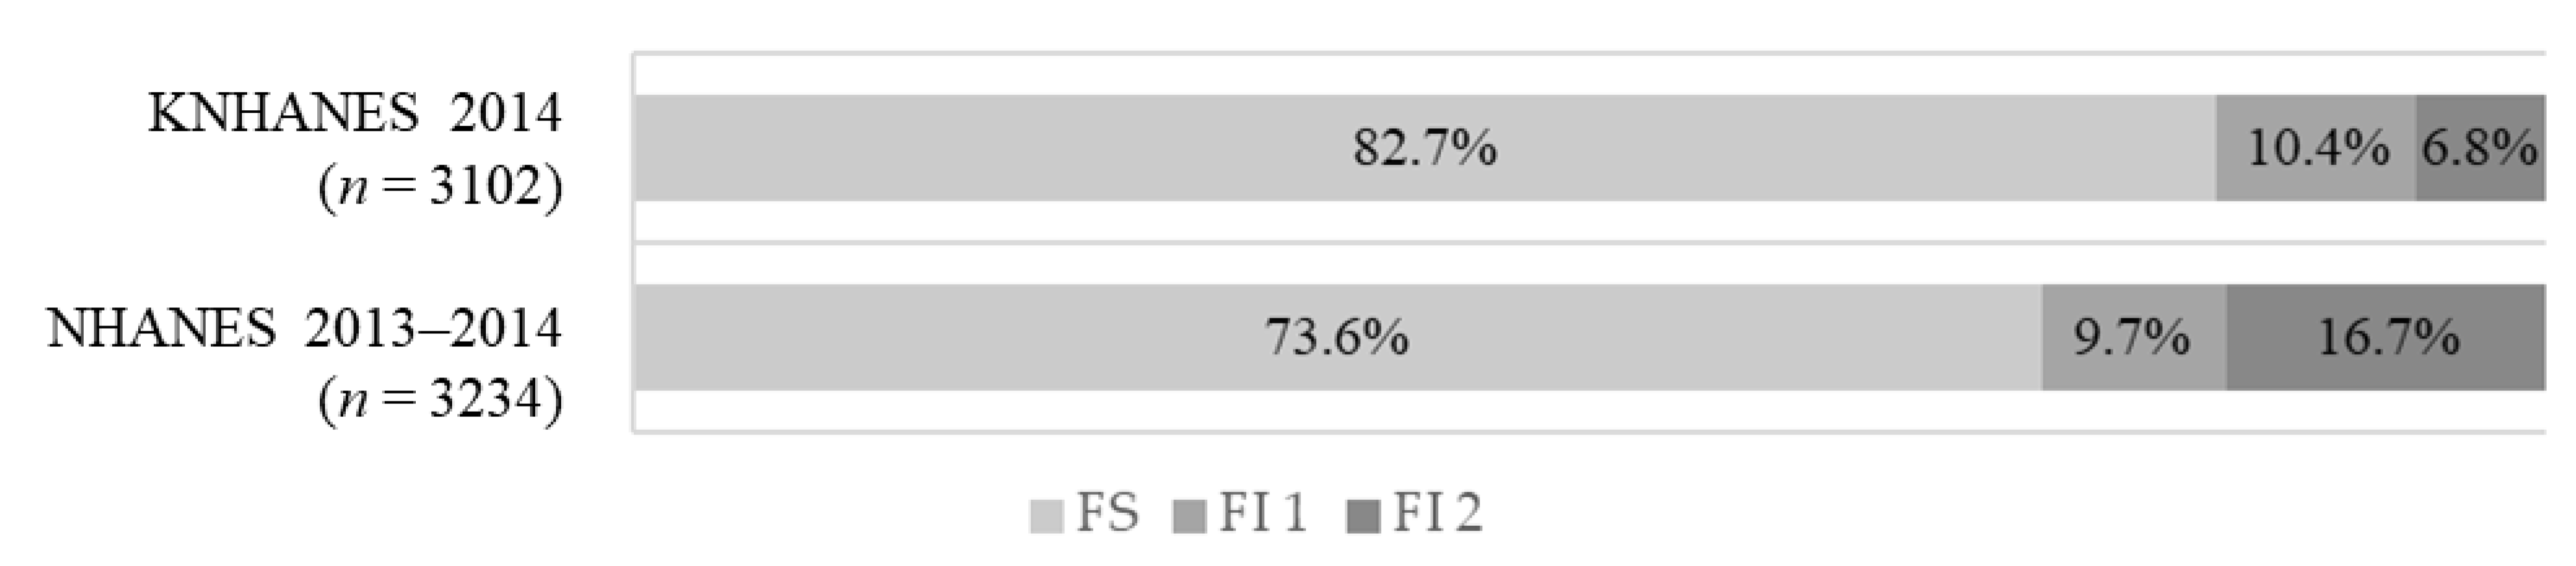
2.2. Food Insecurity
2.3. Nutrient Intake Assessment
2.4. Definition of Depression
2.5. Potential Covariates
2.6. Statistical Analyses
3. Results
4. Discussion
5. Conclusions
Author Contributions
Funding
Institutional Review Board Statement
Informed Consent Statement
Data Availability Statement
Acknowledgments
Conflicts of Interest
References
- Anderson, S.A. Core Indicators of Nutritional State for Difficult-to-Sample Populations. J. Nutr. 1990, 120, 1555–1600. [Google Scholar] [CrossRef] [PubMed]
- Kendall, A.; Kennedy, E. Position of the American Dietetic Association: Domestic food and nutrition security. J. Am. Diet. Assoc. 1998, 98, 337–342. [Google Scholar] [PubMed]
- Bickel, G.; Nord, M.; Price, C.; Hamilton, W.; Cook, J. Guide to Measuring Household Food Security; Revised 2000; Department of Agriculture, Food and Nutrition Service: Alexandria, VA, USA, 2000; Available online: https://alliancetoendhunger.org/wp-content/uploads/2018/03/USDA-guide-to-measuring-food-security.pdf (accessed on 24 November 2020).
- Lee, S.; Lee, K.W.; Oh, J.E.; Cho, M.S. Nutritional and health consequences are associated with food insecurity among Korean elderly: Based on the fifth (2010) Korea National Health and Nutrition Examination Survey (KNHANES V-1). J. Nutr. Health 2015, 48, 519–529. [Google Scholar] [CrossRef]
- Park, G.A.; Kim, S.H.; Kim, S.J.; Yang, Y.J. Health and nutritional status of Korean adults according to age and household food security: Using the data from 2010~2012 Korea National Health and Nutrition Examination Survey. J. Nutr. Health 2017, 50, 603–614. [Google Scholar] [CrossRef]
- Gebre, M.N.; Gebrehiwot, T.T.; Gemeda, D.H. Household Food Insecurity, Low Dietary Diversity, and Early Marriage Were Predictors for Undernutrition among Pregnant Women Residing in Gambella, Ethiopia. Adv. Public Health 2018, 2018, 1–10. [Google Scholar] [CrossRef]
- Coleman-Jensen, A.; Gregory, C.; Singh, A. Household Food Security in the United States in 2013; USDA-ERS Economic Research Report: Washington, DC, USA, 2015. Available online: https://www.ers.usda.gov/webdocs/publications/45265/48787_err173.pdf?v=4908.8 (accessed on 24 November 2020).
- Kim, H.J.; Oh, K. Household food insecurity and dietary intake in Korea: Results from the 2012 Korea National Health and Nutrition Examination Survey. Public Health Nutr. 2015, 18, 3317–3325. [Google Scholar] [CrossRef]
- Martin-Fernandez, J.; Lioret, S.; Vuillermoz, C.; Chauvin, P.; Vandentorren, S. Food Insecurity in Homeless Families in the Paris Region (France): Results from the ENFAMS Survey. Int. J. Environ. Res. Public Health 2018, 15, 420. [Google Scholar] [CrossRef]
- Sorsdahl, K.; Slopen, N.; Siefert, K.; Seedat, S.; Stein, D.J.; Williams, D.R. Household food insufficiency and mental health in South Africa. J. Epidemiol. Community Health 2010, 65, 426–431. [Google Scholar] [CrossRef]
- Hadley, C.; Tegegn, A.; Tessema, F.; A Cowan, J.; Asefa, M.; Galea, S. Food insecurity, stressful life events and symptoms of anxiety and depression in east Africa: Evidence from the Gilgel Gibe growth and development study. J. Epidemiol. Community Health 2008, 62, 980–986. [Google Scholar] [CrossRef]
- Rani, D.; Singh, J.K.; Acharya, D.; Paudel, R.; Lee, K.; Singh, S.P. Household Food Insecurity and Mental Health Among Teenage Girls Living in Urban Slums in Varanasi, India: A Cross-Sectional Study. Int. J. Environ. Res. Public Health 2018, 15, 1585. [Google Scholar] [CrossRef]
- Robaina, K.A.; Martin, K.S. Food Insecurity, Poor Diet Quality, and Obesity among Food Pantry Participants in Hartford, CT. J. Nutr. Educ. Behav. 2013, 45, 159–164. [Google Scholar] [CrossRef] [PubMed]
- Rose, D. Economic Determinants and Dietary Consequences of Food Insecurity in the United States. J. Nutr. 1999, 129, 517–520. [Google Scholar] [CrossRef] [PubMed]
- Bhattacharya, J.; Currie, J.; Haider, S. Poverty, food insecurity, and nutritional outcomes in children and adults. J. Health Econ. 2004, 23, 839–862. [Google Scholar] [CrossRef]
- Pan, L.; Sherry, B.; Njai, R.; Blanck, H.M. Food Insecurity Is Associated with Obesity among US Adults in 12 States. J. Acad. Nutr. Diet. 2012, 112, 1403–1409. [Google Scholar] [CrossRef] [PubMed]
- Olson, C.M. Nutrition and Health Outcomes Associated with Food Insecurity and Hunger. J. Nutr. 1999, 129, 521–524. [Google Scholar] [CrossRef]
- Mangini, L.D.; Hayward, M.D.; Dong, Y.Q.; Forman, M.R. Household Food Insecurity Is Associated with Childhood Asthma. J. Nutr. 2015, 145, 2756–2764. [Google Scholar] [CrossRef]
- To, Q.G.; Frongillo, E.A.; Gallegos, D.; Moore, J.B. Household Food Insecurity Is Associated with Less Physical Activity among Children and Adults in the U.S. Population. J. Nutr. 2014, 144, 1797–1802. [Google Scholar] [CrossRef]
- Leung, C.W.; Epel, E.S.; Willett, W.C.; Rimm, E.B.; Laraia, B.A. Household Food Insecurity Is Positively Associated with Depression among Low-Income Supplemental Nutrition Assistance Program Participants and Income-Eligible Nonparticipants. J. Nutr. 2014, 145, 622–627. [Google Scholar] [CrossRef]
- Whitaker, R.C.; Phillips, S.M.; Orzol, S.M. Food Insecurity and the Risks of Depression and Anxiety in Mothers and Behavior Problems in their Preschool-Aged Children. Pediatrics 2006, 118, e859–e868. [Google Scholar] [CrossRef]
- Slopen, N.; Fitzmaurice, G.; Williams, D.R.; Gilman, S.E. Poverty, food insecurity, and the behavior for childhood internalizing and externalizing disorders. J. Am. Acad. Child. Adolesc. Psychiatry 2010, 49, 444–452. [Google Scholar] [CrossRef]
- Shen, X.; Gao, X.; Tang, W.; Mao, X.; Huang, J.; Cai, W. Food insecurity and malnutrition in Chinese elementary school students. Br. J. Nutr. 2015, 114, 952–958. [Google Scholar] [CrossRef]
- Shariff, Z.M.; Khor, G.L. Obesity and household food insecurity: Evidence from a sample of rural households in Malaysia. Eur. J. Clin. Nutr. 2005, 59, 1049–1058. [Google Scholar] [CrossRef]
- Pérez-Escamilla, R.; Villalpando, S.; Shamah-Levy, T.; Méndez-Gómez-Humarán, I. Household food insecurity, diabetes and hypertension among Mexican adults: Results from Ensanut 2012. Salud Pública México 2014, 56, 62–70. [Google Scholar] [CrossRef]
- Seligman, H.K.; Bindman, A.B.; Vittinghoff, E.; Kanaya, A.M.; Kushel, M.B. Food Insecurity is Associated with Diabetes Mellitus: Results from the National Health Examination and Nutrition Examination Survey (NHANES) 1999–2002. J. Gen. Intern. Med. 2007, 22, 1018–1023. [Google Scholar] [CrossRef]
- Kirkpatrick, S.I.; McIntyre, L.; Potestio, M.L. Child Hunger and Long-term Adverse Consequences for Health. Arch. Pediatr. Adolesc. Med. 2010, 164, 754–762. [Google Scholar] [CrossRef]
- Gany, F.; Lee, T.; Ramirez, J.; Massie, D.; Moran, A.; Crist, M.; McNish, T.; Winkel, G.; Leng, J.C.F. Do Our Patients Have Enough to Eat? Food Insecurity among Urban Low-income Cancer Patients. J. Health Care Poor Underserved 2014, 25, 1153–1168. [Google Scholar] [CrossRef]
- World Health Organization. Depression and Other Common Mental Disorders: Global Health Estimates; World Health Organization: Geneva, Switzerland, 2017; Available online: https://apps.who.int/iris/bitstream/handle/10665/254610/WHO-MSD-MER-2017.2-eng.pdf (accessed on 24 November 2020).
- Davison, K.M.; Kaplan, B.J. Food insecurity in adults with mood disorders: Prevalence estimates and associations with nutritional and psychological health. Ann. Gen. Psychiatry 2015, 14, 21–27. [Google Scholar] [CrossRef] [PubMed]
- Howard, L.L. Does food insecurity at home affect non-cognitive performance at school? A longitudinal analysis of elementary student classroom behavior. Econ. Educ. Rev. 2011, 30, 157–176. [Google Scholar] [CrossRef]
- Pryor, L.; Lioret, S.; Van Der Waerden, J.; Fombonne, É.; Falissard, B.; Melchior, M. Food insecurity and mental health problems among a community sample of young adults. Soc. Psychiatry Psychiatr. Epidemiol. 2016, 51, 1073–1081. [Google Scholar] [CrossRef]
- Becerra, B.J.; Sis-Medina, R.C.; Reyes, A.; Becerra, M.B. Association between Food Insecurity and Serious Psychological Distress Among Hispanic Adults Living in Poverty. Prev. Chronic Dis. 2015, 12, 206–217. [Google Scholar] [CrossRef]
- Shim, J.S.; Oh, K.; Nam, C.M. Association of household food security with dietary intake—Based on the third (2005) Korea National Health and Nutrition Examination Survey (KNHANES III). Korean J. Nutr. 2008, 41, 174–183. [Google Scholar]
- Kroenke, K.; Spitzer, R.L. The PHQ-9: A New Depression Diagnostic and Severity Measure. Psychiatr. Ann. 2002, 32, 509–515. [Google Scholar] [CrossRef]
- World Health Organization; Regional Office for the Western Pacific. The Asia-Pacific Perspective: Redefining Obesity and Its Treatment; Health Communications: Sydney, Australia, 2000; Available online: https://apps.who.int/iris/handle/10665/206936 (accessed on 29 December 2020).
- Centers for Disease Control and Prevention. About Adult BMI; U.S. Department of Health & Human Services: Washington, DC, USA, 2020. Available online: http://www.cdc.gov/healthyweight/assessing/bmi/adult_bmi/index.html (accessed on 29 December 2020).
- Coleman-Jensen, A. U.S food insecurity and population trends with a focus on adults with disabilities. Physiol. Behav. 2020, 220, 112865. [Google Scholar] [CrossRef]
- Jessiman-Perreault, G.; McIntyre, L. The household food insecurity gradient and potential reductions in adverse population mental health outcomes in Canadian adults. SSM Popul. Health 2017, 3, 464–472. [Google Scholar] [CrossRef]
- Kim, K.; Kim, M.K.; Shin, Y.-J.; Lee, S.S. Factors related to household food insecurity in the Republic of Korea. Public Health Nutr. 2011, 14, 1080–1087. [Google Scholar] [CrossRef]
- Tarasuk, V.; Vogt, J. Household Food Insecurity in Ontario. Can. J. Public Health 2009, 100, 184–188. [Google Scholar] [CrossRef]
- Kwon, S.O.; Oh, S.Y. Associations of household food insecurity with socioeconomic measures, health status and nutrient intake in low income elderly. J. Nutr. Health 2007, 40, 762–768. [Google Scholar]
- Misselhorn, A.A. What drives food insecurity in southern Africa? A meta-analysis of household economy studies. Glob. Environ. Chang. 2005, 15, 33–43. [Google Scholar] [CrossRef]
- Smith, L.C.; El Obeid, A.E.; Jensen, H.H. The geography and causes of food insecurity in developing countries. Agric. Econ. 2005, 22, 199–215. [Google Scholar] [CrossRef]
- Lund, C.; Breen, A.; Flisher, A.J.; Kakuma, R.; Corrigall, J.; Joska, J.A.; Swartz, L.; Patel, V. Poverty and common mental disorders in low and middle income countries: A systematic review. Soc. Sci. Med. 2010, 71, 517–528. [Google Scholar] [CrossRef]
- Monsivais, P.; Drewnowski, A. The Rising Cost of Low-Energy-Density Foods. J. Am. Diet. Assoc. 2007, 107, 2071–2076. [Google Scholar] [CrossRef]
- Institute of Medicine. Dietary Reference Intakes for Energy, Carbohydrate, Fiber, Fat, Fatty Acids, Cholesterol, Protein, and Amino Acids; The National Academies Press: Washington, DC, USA, 2002; Available online: https://www.nap.edu/read/10490/chapter/1 (accessed on 24 November 2020).
- Ministry of Health and Welfare. Dietary Reference Intakes for Koreans 2015; Ministry of Health and Welfare: Sejong, Korea, 2015.
- Eicher-Miller, H.A.; Zhao, Y. Evidence for the age-specific relationship of food insecurity and key dietary outcomes among US children and adolescents. Nutr. Res. Rev. 2018, 31, 98–113. [Google Scholar] [CrossRef]
- Shin, C.; Kim, Y.; Park, S.; Yoon, S.; Ko, Y.-H.; Kim, Y.-K.; Kim, S.-H.; Jeon, S.W.; Han, C. Prevalence and Associated Factors of Depression in General Population of Korea: Results from the Korea National Health and Nutrition Examination Survey, 2014. J. Korean Med. Sci. 2017, 32, 1861–1869. [Google Scholar] [CrossRef]
- Klesges, L.M.; Pahor, M.; Shorr, R.I.; Wan, J.Y.; Williamson, J.D.; Guralnik, J.M. Financial difficulty in acquiring food among elderly disabled women: Results from the Women’s Health and Aging Study. Am. J. Public Health 2001, 91, 68–75. [Google Scholar] [CrossRef]
- Lee, K.; Yoo, H.-S. Association of food insecurity and depression in Korean adults. J. Korea Acad. Coop. Soc. 2016, 17, 62–71. [Google Scholar] [CrossRef]
- Alaimo, K.; Olson, C.M.; Frongillo, E.A. Family Food Insufficiency, but Not Low Family Income, Is Positively Associated with Dysthymia and Suicide Symptoms in Adolescents. J. Nutr. 2002, 132, 719–725. [Google Scholar] [CrossRef]
- Stuff, J.E.; Casey, P.H.; Szeto, K.L.; Gossett, J.M.; Robbins, J.M.; Simpson, P.M.; Connell, C.; Bogle, M.L. Household Food Insecurity Is Associated with Adult Health Status. J. Nutr. 2004, 134, 2330–2335. [Google Scholar] [CrossRef]


| KNHANES 2014 | p-Value 2 | NHANES 2013–2014 | p-Value | |||||||
|---|---|---|---|---|---|---|---|---|---|---|
| FS 1 (n = 2575) | FI 1 | FI 2 | Total | FS | FI 1 | FI 2 | Total | |||
| (n = 315) | (n = 212) | (n = 3102) | (n = 2172) | (n = 366) | (n = 696) | (n = 3234) | ||||
| Sex | ||||||||||
| Men | 1007 (49.7) 3 | 123 (47.8) | 71 (45.1) | 1201 (49.9) | 0.3563 | 1083 (50.7) | 176 (49.7) | 336 (48.8) | 1595 (50.3) | 0.8178 |
| Women | 1568 (50.3) | 192 (52.2) | 141 (54.9) | 1901 (50.1) | 1089 (49.3) | 190 (50.3) | 360 (51.2) | 1639 (49.7) | ||
| Age | ||||||||||
| 20–29 | 344 (20.4) | 46 (25.4) | 29 (21.8) | 419 (21.0) | 0.2841 | 424 (21.0) | 93 (28.0) | 171 (30.0) | 688 (23.2) | 0.0014 |
| 30–49 | 1251 (49.6) | 139 (43.5) | 84 (41.7) | 1474 (48.4) | 951 (42.1) | 169 (47.8) | 322 (44.8) | 1442 (43.1) | ||
| 50–64 | 980 (30.0) | 130 (31.2) | 99 (36.6) | 1209 (30.6) | 797 (37.0) | 104 (24.2) | 203 (25.2) | 1104 (33.8) | ||
| Income Level | ||||||||||
| Low | 488 (19.5) | 113 (37.3) | 140 (66.3) | 741 (24.6) | <0.0001 | 752 (25.8) | 249 (62.2) | 563 (74.4) | 1564 (37.4) | <0.0001 |
| Medium | 630 (24.7) | 105 (31.2) | 51 (22.6) | 786 (25.2) | 484 (22.1) | 86 (28.2) | 107 (19.4) | 677 (22.2) | ||
| High | 1457 (55.8) | 97 (31.5) | 21 (11.1) | 1575 (50.2) | 936 (52.2) | 31 (9.6) | 26 (6.2) | 993 (40.4) | ||
| Marital Status 4 | ||||||||||
| Married | 1984 (71.2) | 221 (65.1) | 115 (51.2) | 2320 (69.2) | 0.0011 | 1234 (59.9) | 170 (48.3) | 261 (38.6) | 1665 (55.2) | 0.0006 |
| Single | 591 (28.8) | 94 (34.9) | 97 (48.8) | 782 (30.8) | 938 (40.1) | 196 (51.7) | 435 (61.4) | 1569 (44.8) | ||
| Education Level | ||||||||||
| Middle school or less | 435 (12.2) | 95 (21.9) | 73 (27.0) | 603 (14.2) | <0.0001 | 299 (9.9) | 92 (20.2) | 215 (27.2) | 606 (13.8) | <0.0001 |
| High school | 1379 (56.6) | 166 (61.5) | 111 (59.3) | 1656 (57.3) | 424 (19.3) | 100 (29.3) | 188 (27.2) | 712 (21.5) | ||
| College or higher | 761 (31.2) | 54 (16.6) | 28 (13.7) | 843 (28.5) | 1449 (70.9) | 174 (50.5) | 293 (45.6) | 1916 (64.7) | ||
| BMI 5 | ||||||||||
| Underweight | 125 (4.3) | 14 (5.8) | 3 (7.5) | 142 (4.4) | 0.7084 | 36 (1.3) | 6 (2.3) | 20 (2.9) | 62 (1.6) | 0.3323 |
| Normal weight | 1235 (42.2) | 64 (41.0) | 13 (32.5) | 1312 (42.0) | 639 (28.5) | 98 (25.9) | 170 (24.9) | 907 (27.7) | ||
| Overweight | 651 (22.1) | 41 (20.1) | 11 (31.5) | 703 (22.1) | 705 (33.4) | 112 (31.5) | 194 (27.0) | 1011 (32.1) | ||
| Obese | 879 (31.4) | 53 (33.2) | 13 (28.4) | 945 (31.5) | 792 (36.9) | 150 (40.3) | 312 (45.3) | 1254 (38.6) | ||
| Race/Ethnicity 6 | ||||||||||
| Non-Hispanic white | 951 (69.7) | 130 (50.7) | 278 (51.7) | 1359 (64.9) | <0.0001 | |||||
| Non-Hispanic black | 415 (9.4) | 81 (15.2) | 161 (16.6) | 657 (11.2) | ||||||
| Hispanic | 450 (12.8) | 111 (26.0) | 211 (25.6) | 772 (16.2) | ||||||
| Other | 356 (8.0) | 44 (8.0) | 46 (6.1) | 446 (7.7) | ||||||
| KNHANES 2014 | p-Value 2 | NHANES 2013–2014 | p-Value | |||||||
|---|---|---|---|---|---|---|---|---|---|---|
| FS 1 | FI 1 | FI 2 | Total | FS | FI 1 | FI 2 | Total | |||
| (n = 2575) | (n = 315) | (n = 212) | (n = 3102) | (n = 2172) | (n = 366) | (n = 696) | (n = 3234) | |||
| Energy Source Percentage | ||||||||||
| Carbohydrate (%) | 63.6 ± 0.3 3 | 64.8 ± 1.1 | 62.5 ± 2.6 | 64.4 ± 1.0 | 0.4552 | 48.2 ± 0.4 a4 | 49.6 ± 0.7 ab | 50.9 ± 0.5 b | 48.8 ± 0.3 | 0.0003 |
| Protein (%) | 14.8 ± 0.1 | 14.4 ± 0.3 | 16.0 ± 0.9 | 14.7 ± 0.3 | 0.2034 | 16.6 ± 0.2 a | 15.5 ± 0.3 b | 15.3 ± 0.2 b | 16.3 ± 0.2 | 0.0008 |
| Fat (%) | 21.6 ± 0.2 | 20.8 ± 1.0 | 21.5 ± 2.1 | 20.9 ± 0.9 | 0.7307 | 35.2 ± 0.3 a | 34.9 ± 0.6 ab | 33.8 ± 0.4 b | 34.9 ± 0.2 | 0.0168 |
| Daily Actual Nutrient Intake | ||||||||||
| Energy (kcal) | 2157.4 ± 21.7 a | 1944.4 ± 78.2 b | 1865.3 ± 160.4 b | 1965.0 ± 73.71 | 0.0166 | 2150.2 ± 29.3 | 2184.9 ± 56.5 | 2210.4 ± 34.0 | 2163.3 ± 24.7 | 0.4358 |
| Carbohydrate (g) | 320.0 ± 3.1 a | 299.8 ± 13.6 ab | 260.4 ± 18.4 b | 295.2 ± 12.2 | 0.0033 | 252.0 ± 3.8 a | 259.2 ± 9.0 ab | 274.0 ± 4.9 b | 256.3 ± 3.2 | 0.0060 |
| Protein (g) | 75.9 ± 0.9 a | 67.2± 3.3 b | 73.1 ± 8.2 ab | 69.4 ± 3.2 | 0.0481 | 86.6 ± 0.8 a | 82.8 ± 1.2 b | 83.0 ± 1.8 ab | 85.7 ± 0.7 | 0.0275 |
| Fat (g) | 50.2 ± 0.8 | 43.6 ± 2.7 | 48.9 ± 10.6 | 45.8 ± 3.0 | 0.0657 | 83.5 ± 1.4 | 83.4 ± 2.3 | 82.6 ± 1.6 | 83.3 ± 1.1 | 0.9180 |
| Dietary fiber (g) | 25.7 ± 0.3 a | 21.5 ± 1.1 b | 21.0 ± 2.0 b | 21.2 ± 1.0 | 0.0005 | 17.7 ± 0.3 a | 16.3 ± 0.7 a b | 15.6 ± 0.4 b | 17.2 ± 0.2 | 0.0028 |
| Calcium (mg) | 516.1 ± 5.9 a | 477.4 ± 28.5 ab | 380.9 ± 45.0 b | 463.5 ± 25.1 | 0.0075 | 997.8 ± 15.9 | 942.0 ± 27.1 | 987.0 ± 36.0 | 990.8 ± 12.8 | 0.1679 |
| Phosphorus (mg) | 1159.5 ± 11.5 a | 1022.5 ± 43.2 b | 991.9 ± 73.4 b | 1028.3 ± 39.1 | 0.0029 | 1444.1 ± 17.1 | 1391.8 ± 22.8 | 1387.1 ± 32.7 | 1429.9 ± 14.3 | 0.1711 |
| Iron (mg) | 18.8 ± 0.8 a | 16.3 ± 1.2 ab | 14.1 ± 1.2 b | 16.0 ±1.1 | 0.0013 | 15.0 ± 0.2 | 14.4 ± 0.8 | 14.3 ± 0.3 | 14.8 ± 0.2 | 0.3701 |
| Sodium (mg) | 4097.3 ± 61.4 a | 3657.9 ± 184.5 b | 3254.8 ± 354.9 b | 3657.8 ± 171.9 | 0.0144 | 3612.3 ± 38.7 | 3529.6 ± 83.3 | 3595.5 ± 83.9 | 3601.9 ± 31.2 | 0.7098 |
| Potassium (mg) | 3298.9 ± 39.6 a | 2691.0 ± 123.7 b | 2487.4 ± 174.5 b | 2647.6 ± 106.9 | <0.0001 | 2741.2 ± 34.6 a | 2544.9 ± 53.8 b | 2448.3 ± 35.6 b | 2675.0 ± 29.1 | <0.0001 |
| Vitamin A (μg RAE) | 844.4 ± 30.0 | 888.8 ± 161.7 | 661.7 ± 115.6 | 853.3 ± 130.0 | 0.3185 | 655.0 ± 17.2 a | 568.8 ± 30.3 b | 579.5 ± 24.3 b | 634.7 ± 14.4 | 0.0320 |
| Vitamin B1 (mg) | 2.2 ± 0.0 | 1.9 ± 0.1 | 2.1 ± 0.3 | 2.0 ± 0.1 | 0.0915 | 1.7 ± 0.0 | 1.6 ± 0.0 | 1.6 ± 0.0 | 1.7 ± 0.0 | 0.1418 |
| Vitamin B2 (mg) | 1.5 ± 0.0 | 1.4 ± 0.1 | 1.4 ± 0.2 | 1.4 ± 0.1 | 0.2378 | 2.2 ± 0.0 | 2.1 ± 0.1 | 2.1 ± 0.1 | 2.2 ± 0.0 | 0.1448 |
| Niacin (mg) | 17.9 ± 0.2 a | 15.0 ± 0.6 b | 17.0 ± 2.4 ab | 15.6 ± 0.7 | 0.0003 | 27.1 ± 0.4 | 25.9 ± 1.1 | 26.8 ± 0.9 | 26.9 ± 0.4 | 0.6136 |
| Vitamin C (mg) | 115.1 ± 4.0 a | 68.8 ± 6.2 b | 64.6 ± 16.4 b | 64.7 ± 6.3 | <0.0001 | 79.8 ± 1.9 a | 81.6 ± 4.7 a | 66.2 ± 2.4 b | 77.7 ± 1.6 | 0.0003 |
| KNHANES 2014 | p Value 2 | NHANES 2013–2014 | p Value | |||||
|---|---|---|---|---|---|---|---|---|
| FS 1 | FI 1 | FI 2 | FS | FI 1 | FI 2 | |||
| Depression 3 | ||||||||
| Model 1 4 | 1.00 | 2.3 (1.4–3.8) 5 | 5.1 (3.1–8.3) | <0.0001 | 1.00 | 2.3 (1.2–4.3) | 3.8 (2.9–5.0) | <0.0001 |
| Model 2 | 1.00 | 2.3 (1.4–3.8) | 5.0 (3.1–8.2) | <0.0001 | 1.00 | 2.4 (1.2–4.7) | 4.1 (3.2–5.3) | <0.0001 |
| Model 3 | 1.00 | 1.9 (1.1–3.3) | 4.0 (1.7–9.0) | <0.0001 | 1.00 | 2.0 (1.1–3.6) | 3.0 (2.3–3.7) | <0.0001 |
Publisher’s Note: MDPI stays neutral with regard to jurisdictional claims in published maps and institutional affiliations. |
© 2021 by the authors. Licensee MDPI, Basel, Switzerland. This article is an open access article distributed under the terms and conditions of the Creative Commons Attribution (CC BY) license (http://creativecommons.org/licenses/by/4.0/).
Share and Cite
Lee, S.J.; Lee, K.W.; Cho, M.S. Association of Food Insecurity with Nutrient Intake and Depression among Korean and US Adults: Data from the 2014 Korea and the 2013–2014 US National Health and Nutrition Examination Surveys. Int. J. Environ. Res. Public Health 2021, 18, 506. https://doi.org/10.3390/ijerph18020506
Lee SJ, Lee KW, Cho MS. Association of Food Insecurity with Nutrient Intake and Depression among Korean and US Adults: Data from the 2014 Korea and the 2013–2014 US National Health and Nutrition Examination Surveys. International Journal of Environmental Research and Public Health. 2021; 18(2):506. https://doi.org/10.3390/ijerph18020506
Chicago/Turabian StyleLee, Seung Jae, Kyung Won Lee, and Mi Sook Cho. 2021. "Association of Food Insecurity with Nutrient Intake and Depression among Korean and US Adults: Data from the 2014 Korea and the 2013–2014 US National Health and Nutrition Examination Surveys" International Journal of Environmental Research and Public Health 18, no. 2: 506. https://doi.org/10.3390/ijerph18020506
APA StyleLee, S. J., Lee, K. W., & Cho, M. S. (2021). Association of Food Insecurity with Nutrient Intake and Depression among Korean and US Adults: Data from the 2014 Korea and the 2013–2014 US National Health and Nutrition Examination Surveys. International Journal of Environmental Research and Public Health, 18(2), 506. https://doi.org/10.3390/ijerph18020506