
Ride or Not to Ride: Does the Customer Deviate toward Ridesharing?

 , and
, and
Abstract
:1. Introduction
2. Literature Review
2.1. Information System Acceptance Models
2.2. Related Work
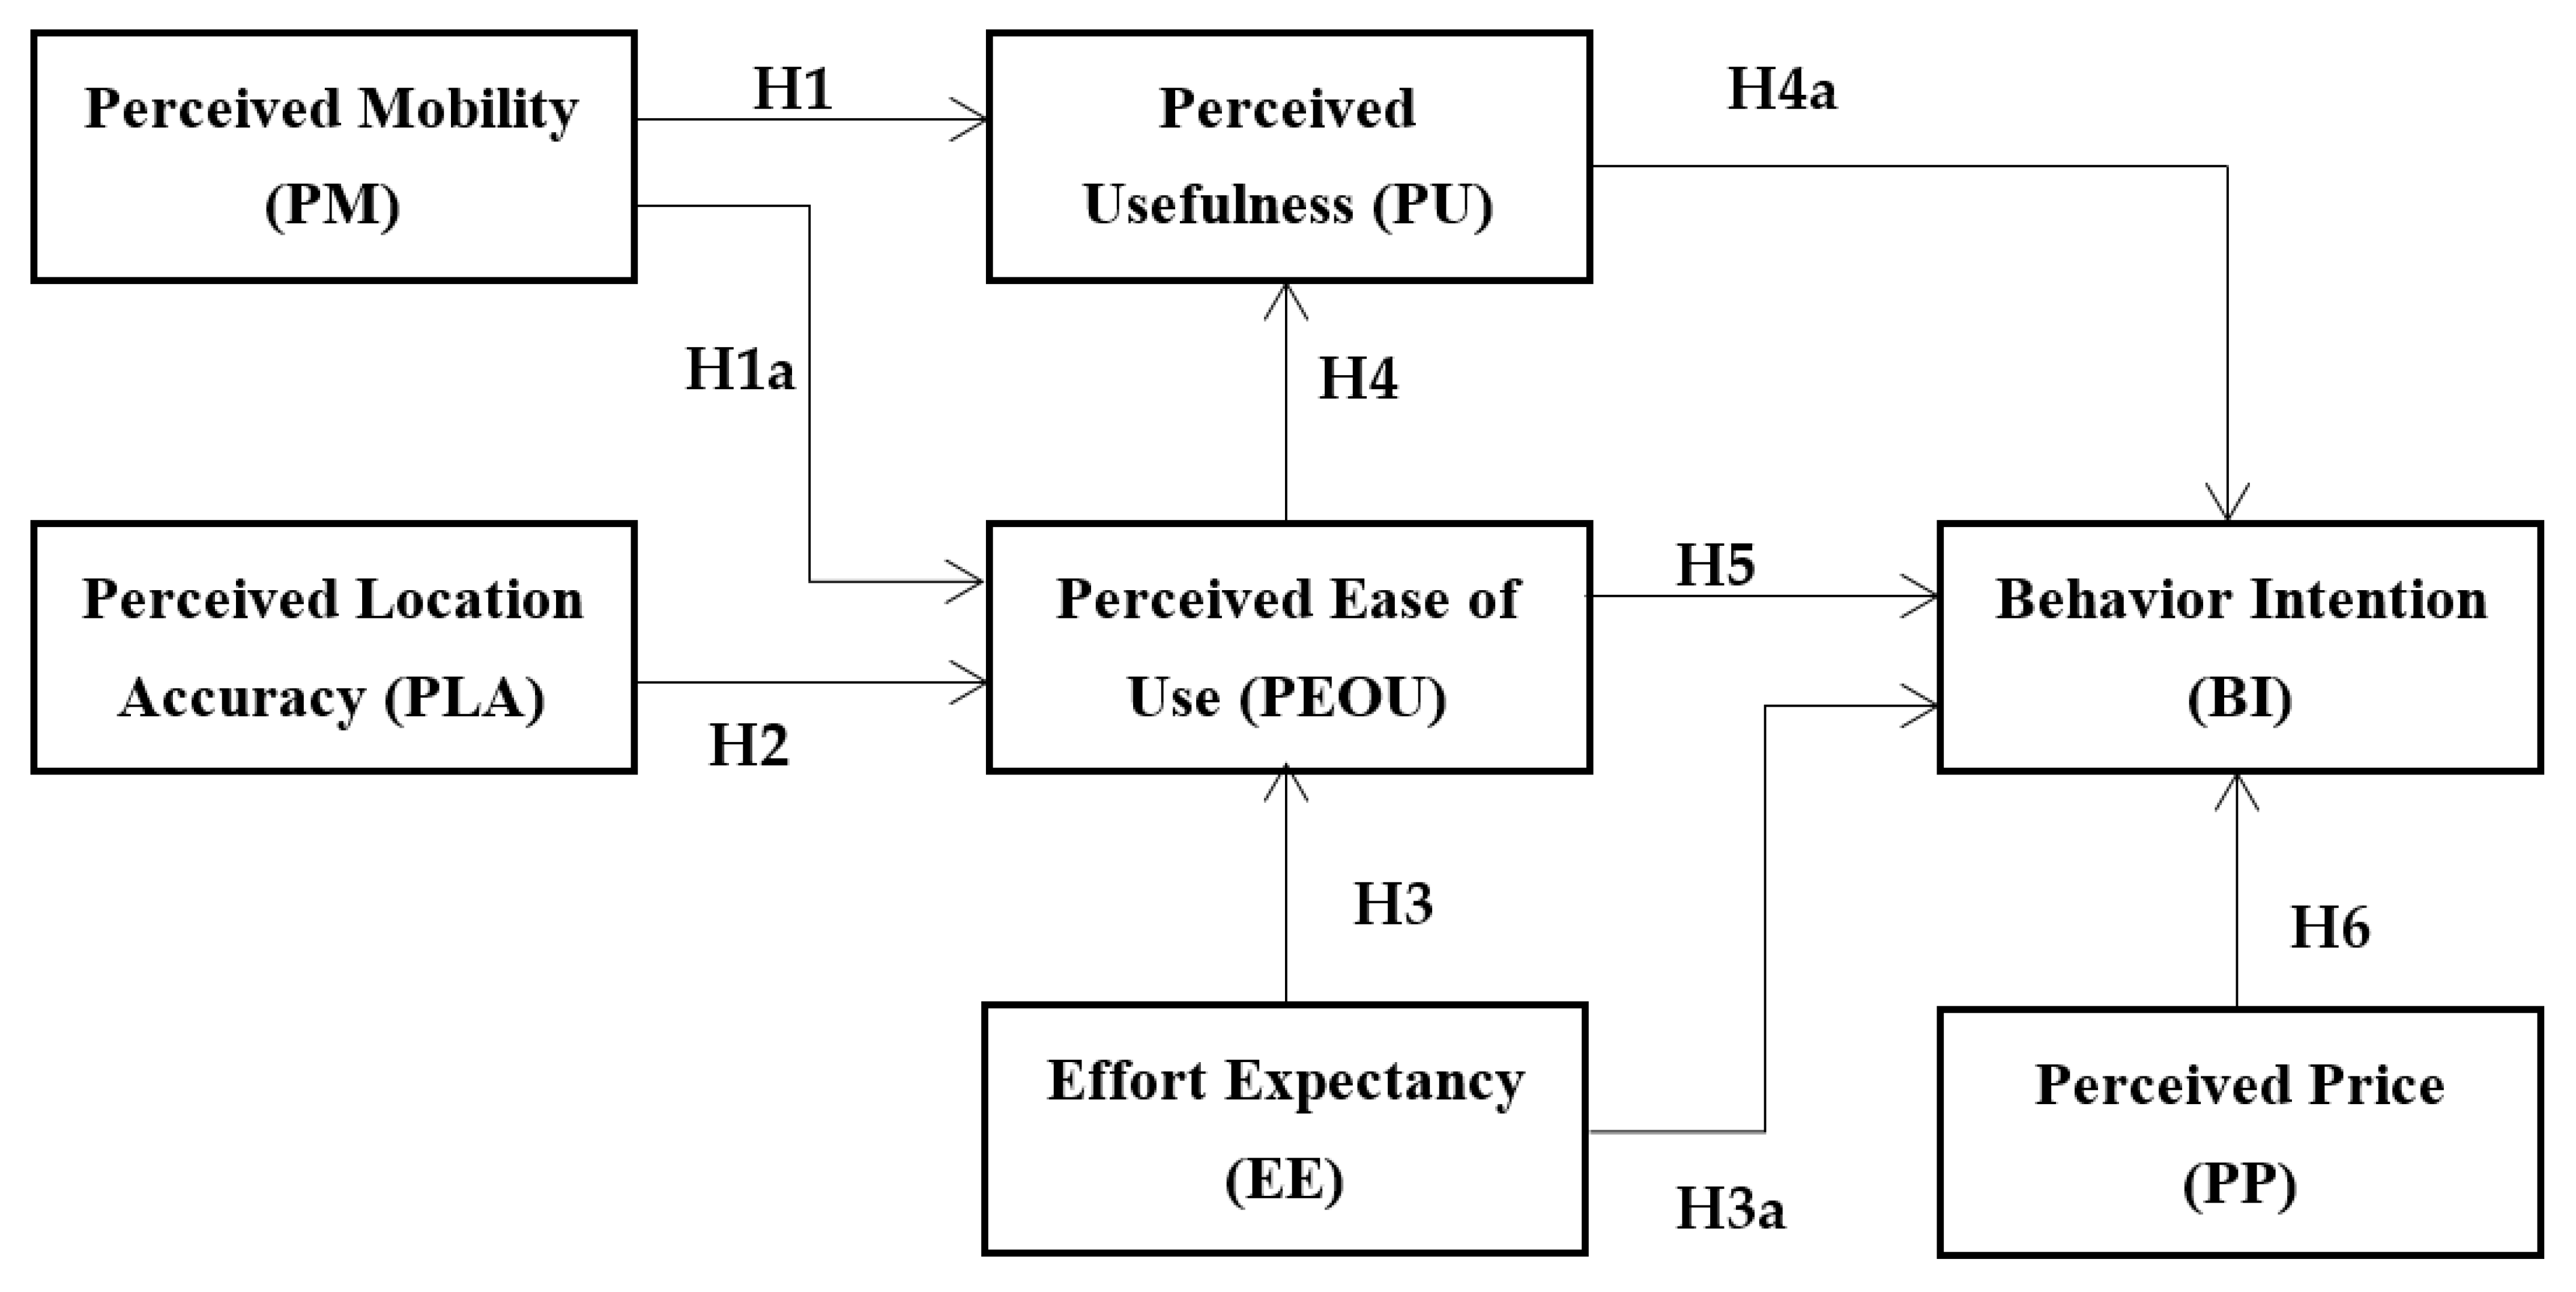
3. Proposed Model and Hypotheses
3.1. Independent Variable: Perceived Mobility (PM)
3.2. Independent Variable: Perceived Locational Accuracy (PLA)
3.3. Independent Variable: Effort Expectancy (EE)
3.4. Independent Variable: Perceived Ease of Use (PEOU)
3.5. Independent Variable: Perceived Usefulness (PU)
3.6. Independent Variable: Perceived Price (PP)
3.7. Dependent Variable: Behavioral Intention (BI)
4. Research Methodology
4.1. Questionnaire Development
4.2. Data Collection
4.3. Data Analysis
4.4. Data Screening
5. Results and Discussion
5.1. Measurement Model
5.2. Structure Model
6. Contributions and Implications of the Study
6.1. Theoretical Contributions
6.2. Practical Implications
7. Conclusions
Author Contributions
Funding
Institutional Review Board Statement
Informed Consent Statement
Data Availability Statement
Conflicts of Interest
Appendix A
- Using E-Hailing applications would enable me to access the taxi more quickly.
- Using E-Hailing applications would make it easier to search for a taxi.
- Using E-Hailing applications will enhance my effectiveness in searching taxis.
- I would find E-Hailing applications useful in my daily life.
- E-Hailing applications have improved my productivity.
- Learning to use E-Hailing applications would be easy for me.
- I would find it easy to get E-Hailing applications to do what I want to do.
- It is easy to become skillful at using e- hailing applications.
- I would find e-hailing applications to be flexible to interact with.
- It is convenient to access E-Hailing anywhere at any time.
- Mobility and E-hailing applications make it possible to get access to taxi services.
- Mobility is an outstanding advantage of E-Hailing applications.
- It would not require me a lot of mental effort to learn because I am skilled at mobile device functions.
- E-Hailing applications you are using always display accurate locations in their service.
- E-Hailing applications always display an accurate location in real-time.
- E-Hailing applications provide efficient routes and accurate destinations for where I want to go.
- It provides alternative routes in rush hours
- E-Hailing applications are providing a low price for the customers.
- Before requesting the pickups, the E-Hailing application revealed a higher price.
- E-Hailing applications are not charging extra fares for any reason.
- I believe that I can save money by using E-Hailing applications.
- Various functions of e-hailing applications are easy to locate and use.
- The E-hailing application’s interface is clear and easy to understand.
- The content and organization of the applications are clear and easy to understand.
- It does not require a lot of time and effort to learn how to use e-hailing applications.
- I intend to continue using E-Hailing applications during my study period.
- I plan to continue using E-Hailing applications frequently.
- I predict that I will use E-Hailing applications as long as I have access to it.
References
- He, F.; Shen, Z.M. Modeling taxi services with smartphone-based e-hailing applications. Transp. Res. Part C 2019, 58, 93–106. [Google Scholar] [CrossRef]
- Cheng, Y.-H.; Huang, T.-Y. High-speed rail passengers’ mobile ticketing adoption. Transp. Res. Part C Emerg. Technol. 2013, 30, 143–160. [Google Scholar] [CrossRef]
- Yeap, J.A.L.; Yapp, E.H.T. User Acceptance of On-Demand Services. In Proceedings of the International Conference on Research and Innovation in Information Systems (ICRIIS), Langkawi, Malaysia, 16–17 July 2017; IEEE: New York, NY, USA, 2017; pp. 1–6. [Google Scholar]
- Hawlitschek, F.; Teubner, T.; Gimpel, H. Understanding the Sharing Economy—Drivers and Impediments for Participation in a Peer-to-Peer rental. In Proceedings of the 49th Hawaii International Conference on System Sciences (HICSS), Koloa, HI, USA, 5–8 January 2016; IEEE: New York, NY, USA, 2016; pp. 4782–4791. [Google Scholar]
- Ma, J.; Xu, M.; Meng, Q.; Cheng, L. Ridesharing user equilibrium problem under OD-based surge pricing strategy. Transp. Res. Part B Methodol. 2020, 134, 1–24. [Google Scholar] [CrossRef]
- Di, X.; Ma, R.; Liu, H.X.; Ban, X.J. A link-node reformulation of ridesharing user equilibrium with network design. Transp. Res. Part B Methodol. 2018, 112, 230–255. [Google Scholar] [CrossRef]
- Ardra, M.; Rejikumar, G. Examining the adoption intentions of women in Kochi regarding uber services. Int. J. Pure Appl. Math. 2017, 117, 937–943. [Google Scholar]
- Jing, P.; Chen, Y.; Wang, X.; Pan, K.; Yuan, D. Evaluating the effectiveness of Didi ride-hailing security measures: An integration model. Transp. Res. Part F Traffic Psychol. Behav. 2021, 76, 139–166. [Google Scholar] [CrossRef]
- Wang, J.; Zhao, S.; Zhang, W.; Evans, R. Why people adopt smart transportation services: An integrated model of TAM, trust and perceived risk. Transp. Plan. Technol. 2021, 44, 629–646. [Google Scholar] [CrossRef]
- Lembcke, T.-B.; Herrenkind, B.; Nastjuk, I.; Brendel, A.B. Promoting Business Trip Ridesharing with Green Information Systems: A Blended Environment Perspective. Transp. Res. Part D Transp. Environ. 2021, 94, 102795. [Google Scholar] [CrossRef]
- Haldar, P.; Goel, P. Usage of Transport Apps by Indian Commuters: An Empirical Investigation. In Geospatial Technology and Smart Cities; Springer: Berlin/Heidelberg, Germany, 2021; pp. 245–259. [Google Scholar]
- Ajzen, I.; Fishbein, M. Attitude-behavior relations: A theoretical analysis and review of empirical research. Psychol. Bull. 1977, 84, 888. [Google Scholar] [CrossRef]
- Ajzen, I. The theory of planned behavior. Organ. Behav. Hum. Decis. Process. 1991, 50, 179–211. [Google Scholar] [CrossRef]
- Davis, F.D. Perceived usefulness, perceived ease of use, and user acceptance of information technology. MIS Q. 1989, 13, 319–340. [Google Scholar] [CrossRef] [Green Version]
- Di Pietro, L.; Mugion, R.G.; Mattia, G.; Renzi, M.F.; Toni, M. The Integrated Model on Mobile Payment Acceptance (IMMPA): An empirical application to public transport. Transp. Res. Part C 2015, 56, 463–479. [Google Scholar] [CrossRef]
- Li, H.; Liu, Y. Understanding post-adoption behaviors of e-service users in the context of online travel services. Inf. Manag. 2014, 51, 1043–1052. [Google Scholar] [CrossRef]
- Weng, G.S.; Zailani, S.; Iranmanesh, M.; Hyun, S.S. Mobile taxi booking application service’s continuance usage intention by users. Transp. Res. Part D Transp. Environ. 2017, 57, 207–216. [Google Scholar] [CrossRef]
- Madigan, R.; Louw, T.; Dziennus, M.; Graindorge, T.; Ortega, E.; Graindorge, M.; Merat, N. Acceptance of Automated Road Transport Systems (ARTS): An Adaptation of the UTAUT Model. Transp. Res. Procedia 2016, 14, 2217–2226. [Google Scholar] [CrossRef] [Green Version]
- Zhou, T. Examining location-based services usage from the perspectives of a unified theory of acceptance and use of technology and privacy risk. J. Electron. Commer. Res. 2012, 13, 135–144. [Google Scholar]
- Osswald, S.; Wurhofer, D.; Trösterer, S.; Beck, E.; Tscheligi, M. Predicting Information Technology Usage in the Car: Towards a Car Technology Acceptance Model. In Proceedings of the 4th International Conference on Automotive User Interfaces and Interactive Vehicular Applications, Portsmouth, NH, USA, 17–19 October 2012; pp. 51–58. [Google Scholar]
- Xu, Z.; Zhang, C.; Ling, H. Examining User Acceptance of Mobile Services. In Proceedings of the 2008 4th International Conference on Wireless Communications, Networking and Mobile Computing, Dalian, China, 12–17 October 2008; pp. 1–4. [Google Scholar]
- Park, E.; Joon, K. Driver acceptance of car navigation systems: Integration of locational accuracy, processing speed, and service and display quality with technology acceptance model. Pers. Ubiquitous Comput. 2014, 18, 503–513. [Google Scholar] [CrossRef]
- Shen, W.; Xiao, W.; Wang, X. Passenger satisfaction evaluation model for Urban rail transit: A structural equation modeling based on partial least squares. Transp. Policy 2016, 46, 20–31. [Google Scholar] [CrossRef]
- Chowdhury, S. Users’ willingness to ride an integrated public-transport service: A literature review. Transp. Policy 2016, 48, 183–195. [Google Scholar] [CrossRef]
- Joia, L.A.; Altieri, D. Antecedents of continued use intention of e-hailing apps from the passengers’ perspective. J. High Technol. Manag. Res. 2018, 29, 204–215. [Google Scholar] [CrossRef]
- Sinaga, Z.H.; Hendayani, R. Acceptance Analysis of Smart Transport Application Using Technology Acceptance Model Approach. In Proceedings of the 4th International Conference on Management, Finance & Entrepreneurship (ICMFE-2015), Medan, Indonesia, 11–12 April 2015; p. 98. [Google Scholar]
- Nor, W.; Al, A.; Wan, B.; Fatihah, A.; Fuad, M.; Shahib, N.S.; Azmi, A.; Bahari, S.; Kamal, M.; Abdullah, D. A Framework of Customer’s Intention to use Uber Service in Tourism Destination. Int. Acad. Res. J. Bus. Technol. 2016, 2, 102–106. [Google Scholar]
- Ooi, K.B.; Foo, F.E.; Tan, G.W.H. Can Mobile Taxi Redefine the Transportation Industry? A Systematic Literature Review from the Consumer Perspective. Int. J. Mob. Commun. 2018, 16, 341–359. [Google Scholar] [CrossRef]
- Wang, Y.; Wang, S.; Wang, J.; Wei, J.; Wang, C. An empirical study of consumers’ intention to use ride-sharing services: Using an extended technology acceptance model. Transportation 2020, 47, 397–415. [Google Scholar] [CrossRef]
- Joia, L.A.; Altieri, D. Adoption of e-hailing apps in Brazil: The passengers’ standpoint. In Proceedings of the AMCIS 2017—23rd America’s Conference on Information Systems: A Tradition of Innovation, Boston, MA, USA, 10–12 August 2017; pp. 1–10. [Google Scholar]
- Ruangkanjanases, A.; Techapoolphol, C. Adoption of E-hailing applications: A comparative study between female and male users in Thailand. J. Telecommun. Electron. Comput. Eng. 2018, 10, 43–48. [Google Scholar]
- Malik, G.; Rao, A.S. Extended expectation-confirmation model to predict continued usage of ODR/ride-hailing apps: Role of perceived value and self-efficacy. Inf. Technol. Tour. 2019, 21, 461–482. [Google Scholar] [CrossRef]
- Giang, P.T.; Trang, P.T.; Yen, V.T. An examination of factors influencing the intention to adopt ride-sharing applications. A Case Study in Vietnam. Imp. J. Interdiscip. Res. 2017, 3, 618–623. [Google Scholar]
- Sánchez-Torres, J.A.; Correa Henao, S.; Gomez, I.C. Assessment of mobile taxi booking apps: An empirical study of adoption by taxi drivers in Medellín-Colombia. Res. Transp. Bus. Manag. 2020, 39, 100500. [Google Scholar] [CrossRef]
- Ali, A.; Rafique, H.; Arshad, T.; Alqarni, M.A.; Chauhdary, S.H.; Bashir, A.K. A fractal-based authentication technique using Sierpinski triangles in smart devices. Sensors 2019, 19, 678. [Google Scholar] [CrossRef] [Green Version]
- Amirkiaee, S.Y.; Evangelopoulos, N. Why do people rideshare? An experimental study. Transp. Res. Part F Psychol. Behav. 2018, 55, 9–24. [Google Scholar] [CrossRef]
- Lu, K.; Wang, X. Analysis of Perceived Value and Travelers’ Behavioral Intention to Adopt Ride-Hailing Services: Case of Nanjing, China. J. Adv. Transp. 2020, 2020, 4380610. [Google Scholar] [CrossRef]
- Man, S.S.; Xiong, W.; Chang, F.; Chan, A.H.S. Critical Factors Influencing Acceptance of Automated Vehicles by Hong Kong Drivers. IEEE Access 2020, 8, 109845–109856. [Google Scholar] [CrossRef]
- Ma, L.; Zhang, X.; Ding, X.; Wang, G. Risk perception and intention to discontinue use of ride-hailing services in China: Taking the example of DiDi Chuxing. Transp. Res. Part F Traffic Psychol. Behav. 2019, 66, 459–470. [Google Scholar] [CrossRef]
- Gaber, H.R.; Elsamadicy, A.M. What drives customers to continue using ride-sharing apps during the COVID-19 pandemic? The case of Uber in Egypt. Cogent Bus. Manag. 2021, 8, 1944009. [Google Scholar] [CrossRef]
- Min, S.; So, K.K.F.; Jeong, M. Consumer adoption of the Uber mobile application: Insights from a diffusion of innovation theory and technology acceptance model. J. Travel Tour. Mark. 2019, 36, 770–783. [Google Scholar] [CrossRef]
- Khan, F.N.; Ali, A.; Hussain, I.; Sarwar, N.; Rafique, H. Repairing Broken Links Using Naive Bayes Classifier. In Proceedings of the Communications in Computer and Information Science, Vienna, Austria, 20–21 September 2019; Volume 932, pp. 461–472. [Google Scholar]
- Fu, X.M. Does heavy ICT usage contribute to the adoption of a ride-hailing app? Travel Behav. Soc. 2020, 21, 101–108. [Google Scholar] [CrossRef]
- Razi, M.J.M.; Tamrin, M.I.M.; Nor, R.M. Adopting e-hailing Application among Malaysian Millennials. In Proceedings of the 2019 7th International Conference on Cyber and IT Service Management, CITSM, Jakarta, Indonesia, 6–8 November 2019; pp. 1–4. [Google Scholar]
- Ali, A.; Sarwar, N.; Rafique, H.; Hussain, I.; Khan, F.N. Connection Time for Routing Decisions in Vehicular Delay Tolerant Network. In Proceedings of the Communications in Computer and Information Science, Vienna, Austria, 20–21 September 2019; Volume 932, pp. 679–690. [Google Scholar]
- Aw, E.C.X.; Basha, N.K.; Ng, S.I.; Sambasivan, M. To grab or not to grab? The role of trust and perceived value in on-demand ridesharing services. Asia Pac. J. Mark. Logist. 2019, 31, 1442–1465. [Google Scholar] [CrossRef]
- Ali, A.; Shakil, M.; Rafique, H.; Munawar, S. Connection Time Estimation between Nodes in VDTN. Int. J. Adv. Comput. Sci. Appl. 2019, 10, 339–345. [Google Scholar] [CrossRef]
- Nguyen-Phuoc, D.Q.; Su, D.N.; Tran, P.T.K.; Le, D.T.T.; Johnson, L.W. Factors influencing customer’s loyalty towards ride-hailing taxi services—A case study of Vietnam. Transp. Res. Part A Policy Pract. 2020, 134, 96–112. [Google Scholar] [CrossRef]
- Sarwar, N.; Khan, F.N.; Ali, A.; Rafique, H.; Hussain, I.; Irshad, A. Microchip with Advance Human Monitoring Technique and RFTS. In Proceedings of the Communications in Computer and Information Science, Vienna, Austria, 20–21 September 2019; Volume 932, pp. 560–570. [Google Scholar]
- Rafique, H.; Anwer, F.; Shamim, A.; Minaei-Bidgoli, B.; Qureshi, M.A.; Shamshirband, S. Factors affecting acceptance of mobile library applications: Structural equation model. Libri 2018, 68, 99–112. [Google Scholar] [CrossRef]
- Musa, A.; Khan, H.U.; AlShare, K.A. Factors Influence Consumers’ Adoption of Mobile Payment Devices in Qatar. Int. J. Mob. Commun. 2015, 13, 670–689. [Google Scholar] [CrossRef]
- Lu, J.; Liu, C.; Wei, J.; Lu, J.; Liu, C.; Wei, J. How Important Are Enjoyment and Mobility for Mobile Applications? J. Comput. Inf. Syst. 2016, 57, 1–12. [Google Scholar] [CrossRef]
- Park, E.; Sung, J.; Cho, K. Reading experiences influencing the acceptance of e-book devices. Electron. Libr. 2015, 33, 120–135. [Google Scholar] [CrossRef]
- Yen, Y.-S.; Wu, F.-S. Predicting the adoption of mobile financial services: The impacts of perceived mobility and personal habit. Comput. Hum. Behav. 2016, 65, 31–42. [Google Scholar] [CrossRef]
- Moody, J.; Middleton, S.; Zhao, J. Rider-to-rider discriminatory attitudes and ridesharing behavior. Transp. Res. Part F Traffic Psychol. Behav. 2019, 62, 258–273. [Google Scholar] [CrossRef]
- Huang, J.; Lin, Y.; Chuang, S. Elucidating user behavior of mobile learning. Electron. Libr. 2007, 25, 585–598. [Google Scholar] [CrossRef] [Green Version]
- Park, E.; Joon, K. An Integrated Adoption Model of Mobile Cloud Services: Exploration of Key Determinants and Extension of Technology Acceptance Model. Telemat. Inform. 2014, 31, 376–385. [Google Scholar] [CrossRef]
- Bicocchi, N.; Mamei, M. Investigating Ride Sharing Opportunities through Mobility Data Analysis. Pervasive Mob. Comput. 2014, 14, 83–94. [Google Scholar] [CrossRef]
- Beldad, A.; Kusumadewi, M.C. Here’s my location, for your information: The impact of trust, benefits, and social influence on location sharing application use among Indonesian university students. Comput. Hum. Behav. 2015, 49, 102–110. [Google Scholar] [CrossRef]
- Nikou, S.A.; Economides, A.A. The Effects of Perceived Mobility and Satisfaction on the Adoption of Mobile-Based Assessment. In Proceedings of the 2015 International Conference on Interactive Mobile Communication Technologies and Learning (IMCL), Thessaloniki, Greece, 19–20 November 2015; pp. 167–171. [Google Scholar]
- Yang, S.; Lu, Y.; Chen, Y.; Gupta, S. Understanding consumers’ mobile channel continuance: An empirical investigation of two fitness mechanisms. Behav. Inf. Technol. 2015, 34, 1135–1146. [Google Scholar] [CrossRef]
- Wong, C.-H.; Tan, G.W.-H.; Ooi, K.-B.; Lin, B. Mobile Shopping: The Next Frontier of the Shopping Industry? An Emerging Market Perspective. Int. J. Mob. Commun. 2015, 13, 92–112. [Google Scholar] [CrossRef]
- Park, E.; Pobil, A.P. Extending the technology acceptance model in remote pointing technology: Identifying the role of perceived mobility and control. Sens. Rev. 2013, 1, 40–47. [Google Scholar] [CrossRef] [Green Version]
- Venkatesh, V.; Morris, M.G.; Davis, G.B.; Davis, F.D. User acceptance of information technology: Toward a unified view. MIS Q. 2003, 27, 425–478. [Google Scholar] [CrossRef] [Green Version]
- Mortimer, G.; Neale, L.; Hasan, S.F.E.; Dunphy, B. Investigating the factors influencing the adoption of m-banking: A cross-cultural study. Int. J. Bank Mark. 2015, 33, 545–570. [Google Scholar] [CrossRef] [Green Version]
- Mostafa, M.M.; El-Masry, A.A. Citizens as consumers: Profiling e-government services’ users in Egypt via data mining techniques. Int. J. Inf. Manag. 2013, 33, 627–641. [Google Scholar] [CrossRef]
- Liang, T.-P.; Ling, Y.-L.; Yeh, Y.-H.; Lin, B. Contextual Factors and Continuance Intention of Mobile Services. Int. J. Mob. Commun. 2013, 11, 313–329. [Google Scholar] [CrossRef]
- Teo, A.-C.; Tan, G.W.-H.; Ooi, K.-B.; Hew, T.-S.; Yew, K.-T. The effects of convenience and speed in m-payment. Ind. Manag. Data Syst. 2015, 115, 311–331. [Google Scholar] [CrossRef]
- Pan, V.-Q.; Chew, P.-Q.; Cheah, A.S.-G.; Wong, C.-H.; Tan, G.W.-H. Mobile marketing in the 21st century: A partial least squares structural equation modeling approach. Int. J. Model. Oper. Manag. 2015, 5, 83–99. [Google Scholar] [CrossRef]
- Lai, I.K.W. Traveler Acceptance of an App-Based Mobile Tour Guide. J. Hosp. Tour. Res. 2015, 39, 401–432. [Google Scholar] [CrossRef]
- Chen, Y.; Salmanian, W.; Akram, A. User Acceptance in the Sharing Economy: An Explanatory Study of Transportation Network Companies in China Based on UTAUT2. In Proceedings of the MCIS 2017 Proceedings, Genoa, Italy, 4–5 September 2017; Available online: https://aisel.aisnet.org/mcis2017/24 (accessed on 1 June 2021).
- Gabel, D. Uber and the persistence of market power. J. Econ. Issues 2016, 50, 527–534. [Google Scholar] [CrossRef]
- Mathieson, K.; Peacock, E.; Chin, W.W. Extending the technology acceptance model: The influence of perceived user resources. ACM SigMIS Database 2001, 32, 86–112. [Google Scholar] [CrossRef]
- Szajna, B. Empirical evaluation of the revised technology acceptance model. Manag. Sci. 1996, 42, 85–92. [Google Scholar] [CrossRef]
- Rafique, H.; Alroobaea, R.; Munawar, B.A.; Krichen, M.; Rubaiee, S.; Bashir, A.K. Do digital students show an inclination toward continuous use of academic library applications? A case study. J. Acad. Librariansh. 2021, 47, 102298. [Google Scholar] [CrossRef]
- Wang, L.; Xiao, J. Research on influencing factors of learners’ intention of online learning behavior in open education based on UTAUT model. In Proceedings of the 10th International Conference on Education Technology and Computers, Tokyo, Japan, 26–28 October 2018; pp. 92–98. [Google Scholar]
- Gefen, D.; Devine, P. Customer Loyalty to an Online Store: The Meaning of Online Service Quality. Available online: https://aisel.aisnet.org/icis2001/80 (accessed on 1 June 2021).
- Rafique, H.; Almagrabi, A.O.; Shamim, A.; Anwar, F.; Bashir, A.K. Investigating the Acceptance of Mobile Library Applications with an Extended Technology Acceptance Model (TAM). Comput. Educ. 2020, 145, 103732. [Google Scholar] [CrossRef]
- Kumar, S. Advanced Diagnostics for Multiple Regression: A Supplement to Multivariate Data Analysis Multivariate Data Analysis; Pearson Prentice Hall Publishing: Hoboken, NJ, USA, 2010. [Google Scholar]
- Straub, D.; Boudreau, M.C.; Gefen, D. Validation guidelines for IS positivist research. Commun. Assoc. Inf. Syst. 2004, 13, 63. [Google Scholar] [CrossRef]
- Moorthy, K.; Chun T’ing, L.; Ming, K.S.; Ping, C.C.; Ping, L.Y.; Joe, L.Q.; Jie, W.Y. Behavioral Intention to Adopt Digital Library by the Undergraduates. Int. Inf. Libr. Rev. 2019, 51, 128–144. [Google Scholar] [CrossRef]


| Factors | Models | ||
|---|---|---|---|
| TRA | TPB | TAM | |
| BI | ✓ | ✓ | ✓ |
| Attitude | ✓ | ✓ | ✗ |
| SN | ✓ | ✓ | ✗ |
| PBI | ✗ | ✓ | ✗ |
| PEOU | ✗ | ✗ | ✓ |
| PU | ✗ | ✗ | ✓ |
| SR | Method/Model | Study |
|---|---|---|
| 1 | TAM | [2] |
| 2 | TAM, DOI, UTAUT model. | [15] |
| 3 | TAM, ECT | [16] |
| 4 | TAM, TCT | [17] |
| 5 | UTAUT | [18] |
| 6 | TAM, UTAUT | [19] |
| 7 | UTAUT2, DOI | [3] |
| 8 | TAM, UTAUT | [20] |
| 9 | TAM | [21] |
| 10 | TAM, TPB | [4] |
| 11 | TAM | [22] |
| 12 | ACSI model, PSI model | [23] |
| 13 | TPB | [24] |
| 14 | IDT, TAM, TRA and TPB | [25] |
| 15 | TAM | [26] |
| 16 | TAM | [27] |
| 17 | UTAUT | [28] |
| 18 | TAM | [29] |
| 19 | DOI | [30] |
| 20 | DOI, TAM | [31] |
| 21 | TAM, ECM | [32] |
| Sr. No | Influencing Factors | Studies |
|---|---|---|
| 1 | Perceived ease of use | [7,15,17,21,25,26,29,30,31,32,33,34] |
| 2 | Perceived usefulness | [2,7,15,16,17,21,22,25,26,29,30,32,33] |
| 3 | Perceived safety | [7,20,23,27,35] |
| 4 | Perceived price | [3,7,23,27,36,37] |
| 5 | Perceived convenience | [23,27] |
| 6 | Perceived accessibility | [27] |
| 7 | Perceived risk | [2,3,17,19,29,37,38,39,40] |
| 8 | Compatibility | [3,15,25,30,38,41,42] |
| 9 | Security | [15,23,31] |
| 10 | Perceived locational accuracy | [22,23,43] |
| 11 | Time benefit | [36] |
| 12 | Effort expectancy | [3,18,19,20,28,44] |
| 13 | Social influence | [3,18,19,20,24,28,36,31,41] |
| 14 | Privacy concern | [3,19,38] |
| 15 | Facilitating conditions | [3,19,20,23] |
| 16 | Complexity | [25,30,31,34] |
| 17 | Relative advantage | [25,30,31,41,45] |
| 18 | Trust | [19,25,30,36,38,39,44,46] |
| 19 | Anxiety | [20,36,28,47] |
| 20 | Personal innovativeness | [2,3,15,26,40,46] |
| 21 | Behavioral intention | [2,15,16,18,20,21,22,24,26,28,29,37] |
| 22 | Attitude towards using | [17,20,22,24,26,33,36,41,43] |
| 23 | Satisfaction | [16,17,22,25,32,48] |
| 24 | Confirmation | [16,17,32] |
| 25 | Subjective norm | [24,25,30,33,37] |
| 26 | Performance expectancy | [3,18,19,20,28,34,44,49] |
| 27 | Self-efficacy | [20,32] |
| 28 | Service Quality | [38,48] |
| Reference | Domain | Context | Findings |
|---|---|---|---|
| [16] | Online Travel Services | China | User satisfaction and usefulness impact the user intention toward the use of online travel services |
| [17] | Mobile Taxi Application | Malaysia | Attitude, PU, and satisfaction are considered important factors in the intention to use mobile taxi applications. |
| [30] | E-Hailing Applications | Brazil | Perceived usefulness has positively influenced user satisfaction. User trust also influences the intention to use EHA. |
| [19] | Location-based Services | China | A strong positive relationship among PEOU, PU, and trust on intentions to use was found. |
| [18] | Automated Road Transport Systems | France | Effort expectancy, social influence, and performance expectancy influence the behavior intention to use the system. |
| [33] | Ridesharing Applications | Vietnam | PU and PEOU are positively related to attitude. |
| [31] | E-Hailing Applications | Thailand | Relative advantage and PEOU influence the intention to use EHA. |
| [2] | Mobile Ticketing | Taiwan | Perceived risk, PU, and PEOU affect the intention to use Mobile ticketing applications. |
| [29] | Ridesharing service | China | Display quality, service, locational accuracy, perceived processing speed, and customer satisfaction are the influencing factors toward the use of ride-sharing services. |
| Demographic Factors | Categories | Frequency | Percentage |
|---|---|---|---|
| Gender | Male | 102 | 48.3 |
| Female | 109 | 51.7 | |
| Age | Less then 20 years | 21 | 10 |
| 20–25 years | 42 | 19.9 | |
| 26–30 years | 109 | 51.6 | |
| 31–35 years | 31 | 14.6 | |
| Above 35 years | 8 | 3.8 |
| Constructs | Items | Factor Loading | CR | AVE | Cronbach’s Alpha |
|---|---|---|---|---|---|
| Behavioral Intention (BI) | BI1 | 0.749 | 0.781 | 0.737 | 0.747 |
| BI2 | 0.738 | ||||
| BI3 | 0.724 | ||||
| Perceived Price (PP) | PP1 | 0.774 | 0.760 | 0.716 | 0.717 |
| PP2 | 0.742 | ||||
| PP3 | 0.632 | ||||
| Perceived Locational Accuracy (PLA) | PLA1 | 0.761 | 0.765 | 0.721 | 0.728 |
| PLA2 | 0.738 | ||||
| PLA3 | 0.665 | ||||
| Perceived Ease of Use (PEOU) | PEOU1 | 0.743 | 0.653 | 0.613 | 0.717 |
| PEOU2 | 0.719 | ||||
| PEOU3 | 0.677 | ||||
| Perceived Mobility Value (PM) | PM1 | 0.817 | 0.770 | 0.725 | 0.703 |
| PM2 | 0.718 | ||||
| PM3 | 0.641 | ||||
| Effort Expectancy (EE) | EE1 | 0.747 | 0.763 | 0.720 | 0.701 |
| EE2 | 0.711 | ||||
| EE3 | 0.703 | ||||
| Perceived Usefulness (PU) | PU1 | 0.799 | 0.723 | 0.676 | 0.706 |
| PU2 | 0.738 | ||||
| PU3 | 0.693 |
| Correlations Squared | BI | PP | PLA | PEOU | PM | EE | PU |
|---|---|---|---|---|---|---|---|
| BI | 0.74 | ||||||
| PP | 0.36 | 0.71 | |||||
| PLA | 0.23 | 0.44 | 0.72 | ||||
| PEOU | 0.27 | 0.28 | 0.49 | 0.61 | |||
| PM | 0.39 | 0.32 | 0.38 | 0.46 | 0.72 | ||
| EE | 0.32 | 0.46 | 0.34 | 0.31 | 0.30 | 0.72 | |
| PU | 0.44 | 0.33 | 0.21 | 0.25 | 0.27 | 0.33 | 0.67 |
| Absolute Fit Measure | Parsimonious Fit Measure | Incremental Fit Measure | |||||
|---|---|---|---|---|---|---|---|
| p-value | RMSEA | GFI | CMIN | CMIN/DF | CFI | TLI | |
| Acceptable fit | <0.05 | <0.08 | >0.9 (STD) >0.8 (GOOD) | <5 | >0.9 (STD) >0.8 (GOOD) | >0.9 (STD) >0.8 (GOOD) | |
| Obtained fit MM | 0.001 | 0.052 | 0.896 | 269.6 | 1.577 | 0.928 | 0.911 |
| Obtained fit SM | 0.001 | 0.051 | 0.896 | 270 | 1.577 | 0.928 | 0.911 |
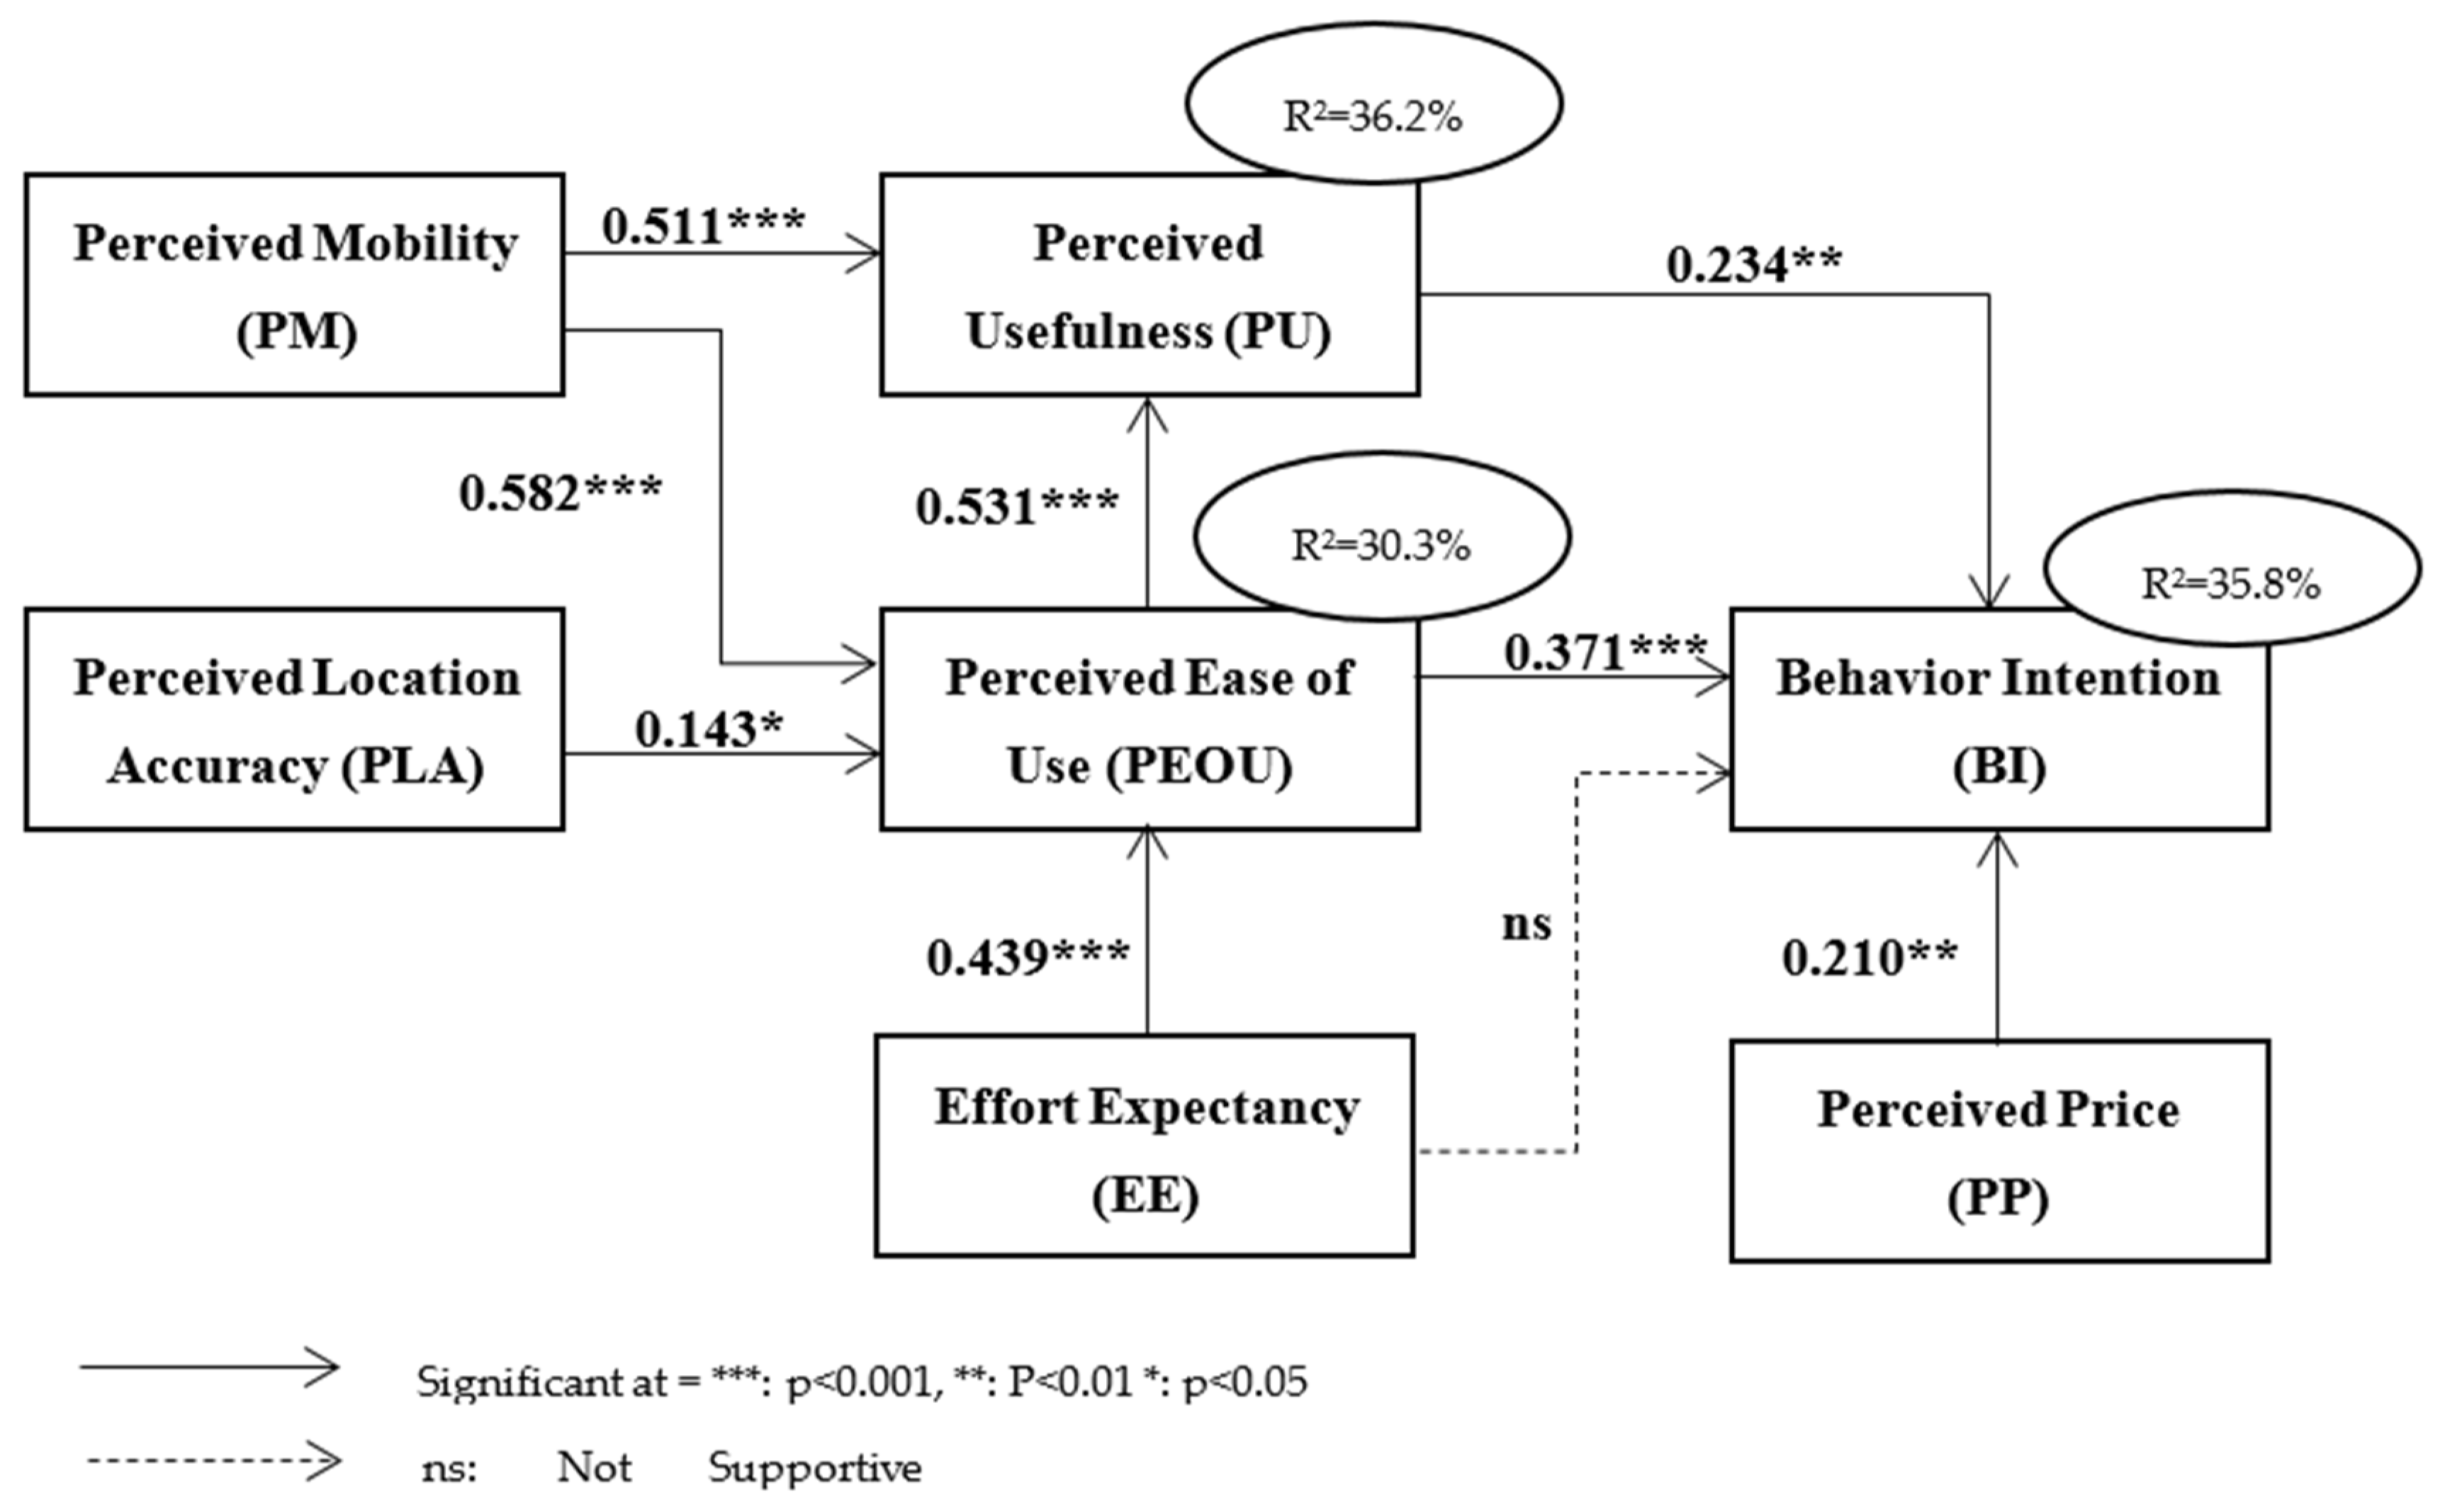
| Constructs | Code | Hypothesis | Relationship | β Value | Status |
|---|---|---|---|---|---|
| Perceived Mobility | PM | H1 | PM→PU | 0.511 *** | Supported |
| H1a | PM→PEOU | 0.582 *** | Supported | ||
| Perceived Locational Accuracy | PLA | H2 | PLA→PEOU | 0.143 * | Supported |
| Effort Expectancy | EE | H3 | EE→PEOU | 0.439 *** | Supported |
| H3a | EE→BI | −0.052 | Rejected | ||
| Perceived ease of use | PEOU | H4 | PEOU→PU | 0.531 *** | Supported |
| H4a | PEOU→BI | 0.371*** | Supported | ||
| Perceived Usefulness | PU | H5 | PU→BI | 0.234 ** | Supported |
| Perceived Price | PP | H6 | PP→BI | 0.210 ** | Supported |
Publisher’s Note: MDPI stays neutral with regard to jurisdictional claims in published maps and institutional affiliations. |
© 2021 by the authors. Licensee MDPI, Basel, Switzerland. This article is an open access article distributed under the terms and conditions of the Creative Commons Attribution (CC BY) license (https://creativecommons.org/licenses/by/4.0/).
Share and Cite
Shamim, A.; Khan, A.A.; Qureshi, M.A.; Rafique, H.; Akhunzada, A. Ride or Not to Ride: Does the Customer Deviate toward Ridesharing? Int. J. Environ. Res. Public Health 2021, 18, 10352. https://doi.org/10.3390/ijerph181910352
Shamim A, Khan AA, Qureshi MA, Rafique H, Akhunzada A. Ride or Not to Ride: Does the Customer Deviate toward Ridesharing? International Journal of Environmental Research and Public Health. 2021; 18(19):10352. https://doi.org/10.3390/ijerph181910352
Chicago/Turabian StyleShamim, Azra, Awais Ali Khan, Muhammad Ahsan Qureshi, Hamaad Rafique, and Adnan Akhunzada. 2021. "Ride or Not to Ride: Does the Customer Deviate toward Ridesharing?" International Journal of Environmental Research and Public Health 18, no. 19: 10352. https://doi.org/10.3390/ijerph181910352
APA StyleShamim, A., Khan, A. A., Qureshi, M. A., Rafique, H., & Akhunzada, A. (2021). Ride or Not to Ride: Does the Customer Deviate toward Ridesharing? International Journal of Environmental Research and Public Health, 18(19), 10352. https://doi.org/10.3390/ijerph181910352