Abstract
Metro systems are gradually becoming more and more crucial in promoting the economy and society in cities. However, various challenges such as financial resources and the efficiency of utilizing these metro plans bring difficulties for metro construction. Hence, accurately evaluating the urban metro system’s development condition seems significant for the sustainable development of the urban metro system. Therefore, a comprehensive evaluation indicator system of metro development conditions containing 25 indicators from dimensions of demand and supply is established in this study, and a coupling coordination degree model combined with the entropy weight method and Technique for Order Preference by Similarity to an Ideal Solution (TOPSIS) method is proposed to analyze the level of metro development conditions and coupling coordination conditions of 35 cities in China. According to the calculation results, 35 cities are divided into six categories, and radar charts are constructed to promote the sustainable development of the metro system.
1. Introduction
As the most critical component in urban infrastructures, the metro system plays a crucial role in promoting a city’s economy and society development. Compared with other modes of transportation, such as buses, taxis, and private cars, the metro system has many advantages and benefits, such as environment protection, better travel safety and efficiency, and high travel punctuality [1,2], while raising a positive stimulating effect on urban transport planning, intelligent transport system, and energy resources [1,3,4,5], so, more and more countries are willing to develop metro construction. By the end of 2020, 178 cities from 57 nations, mainly in Asian areas, European areas, and North American areas, had built metro systems, with a total length of 17,584.77 km and 12,567 stations [6]. As the biggest developing country globally, China has also been building metro systems, particularly in its big cities, to solve traffic congestion induced by the growth of the urban population. It was reported by the China Association of Metros (2021) that, by the end of 2020, 45 cities had built metro systems in China, with a total length of 7969.7 km and a total number of 244 lines in the whole country [7]. Twenty additional cities are planning for building metro systems. In total, about 7085.5 km of new metro lines will be built in China in the future.
However, it is possible that these ambitious metro plans will encounter many challenges, such as financial resources and the efficiency of utilizing these metro plans. It is appreciated that considerable investment is needed to build the metro system. For example, it is reported that the average cost of metro construction rose to 800 million CNY per kilometer in urban areas in China [8]. Furthermore, operating the metro system costs are higher than the construction costs from the whole system lifecycle. Some city governments cannot even afford the operation costs, although they can construct the metro system. In this case, the city government has to provide support to cover high operation costs. According to the statistic data from 2007 to 2014 from the Beijing Municipal Finance Bureau, the operation of the Beijing metro system is primarily supported by the fiscal subsidy, accounting for more than 5% of the revenue of the Beijing government. Therefore, the finance resource is a big challenge to implement the 7085.5 km metro systems planned in China’s future years. On the other hand, the efficiency of using metro systems is different between different cities as they have a different scale of the metro system and management skills. Some cities have the problem of shortage of the metro system, and others face oversupply. For example, it was found that the scale of the metro system in Kunming has over-supply capacity [9], indicating that the metro system in this city has low utility efficiency. Meanwhile in other cities, such as Beijing, the scale of the metro system is undersupplied, evidenced by the crowded ridership.
According to the definition of sustainable development, it emphasizes the ability to meet society’s current needs without compromising the capacity to satisfy future generations’ demands [10]. In addition, various dimensions of objectives, including economy, society, environment, resources, must be coordinated and developed in harmony [11]. The metro system’s sustainable development also needs to solve various problems such as financial resources, utility efficiency, and other natural hazards associated with urban mass transport systems [12]. Therefore, it is crucial to correctly evaluate the urban metro system’s development condition for the sustainable development of the urban metro system. For the development process for the metro system, as pointed out in other studies, the factors affecting the development condition of the metro system can be summarized from the perspective of supply and demand [13]. Specifically, the supply of the metro system is the support of human, material, and financial resources that a city can provide for the development of the metro system. For instance, Loo et al. [3] proposed the benchmarks to evaluate the readiness of a city for metro development from the perspective of economy, which is that a city with a Gross Domestic Product (GDP) of 74,080 CNY per capita can be identified as the city ready for building metro lines. In addition, Sharav et al. [4] emphasized the importance of assessing the investment accurately for metro construction by demonstrating a methodological approach. Besides economy, technology is also considered necessary support for metro construction consisting of hardware and software [14]. The demand for the metro system refers to the purpose that a city needs to build a metro system to reduce urban traffic congestion, environmental pollution, and citizens’ travel demand. For example, The National Development and Reform Commission in China (2018) advised that the local governments must consider some critical parameters when planning the metro system network, including the distribution of population within a city, the city traffic demand, land use and others. Loo et al. [14] pointed out that population, space constraint, cost constraint, and environmental considerations all encouraged the development of public transport networks such as metro systems. Moreover, fares, quality of service, and car ownership also contribute to the development of the metro system from the perspective of demand [15,16]. Among them, fares and quality of service belong to the attributes of the metro system, which can influence demand directly because higher fares or worse quality of service will cause lower passenger flow volume. At the same time, it is also considered that if an increase in car ownership occurs, the demand for the metro system will be reduced [16].
Therefore, there is a need for coordinated development between supply and demand conditions for developing the metro system. It is considered very important to plan the scale of metro systems properly. Suppose the scale of the metro system is too small compared to the population scale of a city. In that case, it will not meet the transportation demand of the urban population [17]. On the other hand, if a metro system is too big, that is oversupply, there will be low utility efficiency, which will result in the consequences of investment waste and the waste of land resources [17,18]. Different transport system models are raised to explore the relationship between demand and supply in urban mass transport. For example, Chen et al. [19] identified the relative spatial gaps in public transport supply and demand from seniors by calculating the public transport supply and public transport demand indices. Hörcher and Graham [20] investigated public transport supply conditions when facing independent but nonidentical demand conditions using a baseline model based on the crowding multiplier approach and the crowding cost function. Konečný et al. [21] concluded that the supply of connections is not a statistically significant indicator that refers to demand in some cases using correlation analysis and covariance methods. In addition, Malavenda et al. [22] simulated the two-way relationship between land use and transport systems in urban areas based on Land Use and Transport Interaction (LUTI) models. Croce et al. [23] constructed the path and route choice model of commercial vehicles travelling on a road network due to the demand conditions.
Although previous studies have paid attention to the supply and demand of the metro system by using various transport system models from different perspectives, few studies focus on the coordination problem of the demand and supply. In fact, the coupling coordination degree model has vast advantages in studying the coordination problem. Coupling, a concept in physics, refers to the phenomenon that several physical systems interact with each other through internal connection, so coupling degree is proposed to describe the degree of interaction among systems [24]. In addition, the coordination degree is raised to measure the status or level of coordination of systems. Therefore, combining the concepts of coupling degree and coordination degree, the coupling coordination degree is used to measure whether the internal systems are in harmony with each other in the development process, considering interaction and coordination [25]. The coupling coordination degree has been widely used to analyze urban development, and most studies concentrate on the subsystems of the whole city, especially between economy and ecology. For example, Sun and Cui [26] applied a coupling coordination degree model to analyze the development in harmony with the economic, social, and environmental benefits of urban public transportation infrastructure to improve the coordinated development level. Li and Yi [27] evaluated the sustainability of cities by calculating coordination among economy, society, and environment with the coupling coordination degree model. Shen et al. [28] introduced an improved coupling coordination degree model to evaluate the coordination between socio-economy and carbon emissions for sustainable urban planning. Xing et al. [29] assessed the coordinated results in the economy-resource-environment system based on the coupling coordination degree model for sustainable urban development.
The above discussions demonstrate a small existing study assessing the coupling coordination degree of metro systems from a perspective between supply and demand conditions. Therefore, in this study, an assessment model is developed to evaluate the coupling coordination degree between the supply and demand conditions for developing the metro system. And then, the coupling coordination conditions of 35 cities in China are analyzed. The contributions of this paper are as follows. First, while some scholars have researched demand or supply conditions of the metro system, previous studies mainly concern the factors affecting development conditions from the perspective of demand or supply [3,4,14,15,16], and empirical analysis of demand or supply conditions in the background of seniors [19], independent but nonidentical demand conditions [20], and normal cases [21]. In this study, under the background of sustainable development, coupling coordination conditions between demand and supply can provide a new angle for developing the metro system. Second, in the case study results, the categories of the coupling coordination degree of the metro system between demand and supply are identified. The suggestions to improve the development of the metro system are also discussed. The research results in this study can provide a reference for other coupling coordination problems in sustainable urban development.
2. Construction of the Metro Development Conditions Comprehensive Evaluation Indicator System
Demand can be defined as the amount of all services and products currently utilized, consumed, or expected to be obtained by the human society in a particular area [30]. Similarly, the demand for the metro system means the number of metros to adapt to the conditions currently, even in the future. After collecting and consolidating the literatures of factors affecting metro system demand [3,4,14,15,16,31], four dimensions, including satisfaction of people’s going out (D1), improvement of urban environmental conditions (D2), improvement of urban traffic conditions (D3), and perfection of the development of metro (D4), are proposed to reflect the level of the demand for the metro system. Among them, the satisfaction of people’s going out mainly considers the amount and the density of population because a higher amount or density will lead to the possibility that more metro systems are needed to accommodate the passengers. As for the improvement of urban environmental conditions, compared to other modes of transportation, the metro system can reduce both exhaust pollution and noise pollution from cars, significantly contributing to the people’s living environment. In the dimension of improving urban traffic conditions, taking road facilities and other transportation infrastructures into account, the metro system can reduce the traffic congestion and the pressure of operation of mass traffic. Finally, the metro’s current construction condition and operational condition can directly report whether the metro system needs to be continuously constructed. Therefore, through a further analysis on the relevance, comparability, and data availability of indicators, 16 demand indicators are selected, as shown in Table 1.

Table 1.
Comprehensive evaluation indicator system of metro development conditions.
Supply refers to the capacity to provide services and goods for human society [30]. Similarly, the supply of the metro system can be defined as the services and goods that the local government or city can provide. Through considering the relevant references [3,4,14,15,16,31], three dimensions, including finance (S1), manpower (S2), and land (S3), are proposed to reflect the level of supply for the metro system. Finance (S1) and manpower (S2) represent the expense and workers that the government can afford or offer in the construction and operation of the metro system. A more excellent level of finance or manpower means a more outstanding development environment in terms of supply conditions. Land (S3) can provide the space for construction and the passenger flow for the operation indirectly. Hence, through a further analysis on the relevance, comparability, and data availability of indicators, 9 supply indicators are selected, as shown in Table 1.
3. Methodology and Research Materials
In order to measure the coupling coordination degree of metro systems, three procedures are proposed in Figure 1. Firstly, a comprehensive evaluation indicator system of metro development conditions is carried out from demand and supply perspective. Secondly, a coupling coordination degree model is developed based on the coupling coordination function to assess the coupling coordination conditions of metro systems. Furthermore, two other methods are also used in the model. The Technique for Order Preference by Similarity to an Ideal Solution (TOPSIS) method is used to calculate the comprehensive evaluation values of demand and supply systems in metro systems. The entropy weight method is used to calculate the weight values of indicators in demand and supply systems. Finally, through data collection, an empirical analysis can be raised, and the categories of the cities for developing metros based on calculation results can be identified.
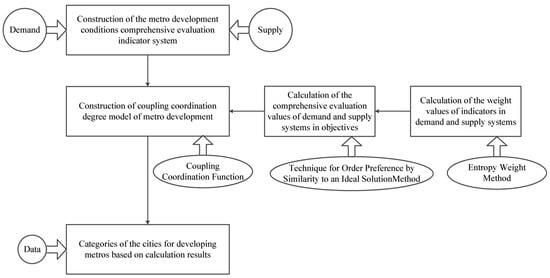
Figure 1.
Producers of methodology.
3.1. Development of Coupling Coordination Degree Model
3.1.1. Coupling Coordination Function
This study uses coupling coordination degree (D) to evaluate the interaction between demand and supply systems and reflect the dynamic trend of coordination and transverse comparison between demand and supply systems [40]. Coupling coordination degree is a quantitative index ranging from 0 to 1. The higher value indicates the more coordinated metro development. The index has been used in oasis urbanization [40] and urban infrastructure [41].
According to Zhang et al. [42], coupling degree (C) and coordination degree (T) is used to calculate the coupling coordination degree (D), and the basic equation of coupling coordination degree can be presented as follows:
where C represents the coupling degree of the metro system, and T represents the coordination degree of the metro system.
In Equation (1), coupling degree (C) comes from physics. It can be defined as a phenomenon in which the systems under investigation influence each other through different links [10]. The basic equation to calculate coupling degree (C) can be presented as follows [10,24,25]:
where x denotes the number of systems and ux represents the comprehensive development value of x-th system.
In this study, there are two systems of the metro system: the demand system and the supply system. Therefore, in Equation (2), the value of x is 2, and Equation (2) can be simplified as:
where ud represents the comprehensive development value of the demand system, and us represents the comprehensive development value of the supply system.
In Equation (1), coordination degree (T) refers to the degree of benign coupling in the coupling interaction relationship, which reflects the quality of coordination among systems [42]. The basic equation to calculate coordination degree (T) can be presented as [42]:
where x denotes the number of systems, and ux represents the comprehensive development value of x-th system. In addition, α, β and γ represent the degree values of the importance of systems.
In this study, there are two systems of the metro system: the demand system and the supply system. Therefore, in Equation (4), the value of x is 2. Meanwhile, the same importance of the demand and supply system is considered. Therefore, in Equation (4), the value of α and β is 0.5. The Equation (4) can be simplified as:
where ud represents the comprehensive development value of the demand system, and us represents the comprehensive development value of the supply system.
By substituting the results Equation (3) and (5) into Equation (1), the coupling coordination degree is presented as follows:
According to the relative research, the coupling coordination degree is divided into 4 levels and 12 types in this study, as shown in Table 2 [29,35].
Table 2.
Coupling coordination degree levels and types.
3.1.2. TOPSIS Method
The comprehensive evaluation includes three main steps: selecting the indicator system, calculating indicators’ weights, and selecting evaluation methods. The selection of evaluation methods is the core stage in the whole process, which is also a significant way to obtain the conclusion. Generally, these evaluation methods are classified into parametric and non-parametric. Moreover, Data Envelopment Analysis (DEA) and Multi Criteria Decision Making Methods (MCDM) are the most commonly used methods in recent years. DEA is a non-parametric method that concentrates on evaluating decision-making units’ efficiency [43,44], and MCDM emphasizes the comprehensive rankness of objectives [45]. As one method of the MCDM, TOPSIS makes full use of objective data and outputs the evaluation conditions with accurate numerical values, which adapts to the research aim of this study.
The TOPSIS method, proposed initially by Hwang and Yoon [46], is used to get the comprehensive development values of the demand (ud) and supply system (us) in this study, which constructs the positive and negative ideal solutions of multi-index problems, considering the proximity to the positive ideal solution, and the distance from the negative ideal solution as the basis for evaluating feasible solutions [47]. Moreover, the method has been used in urban public transport [48], city economy [49], and smart city [50]. The specific steps are as follows [32,47]:
Step 1. Establishment of an evaluation matrix
With n indicators to measure the development of metro systems in m cities, the evaluation matrix can be expressed as
where yij represents the evaluation value of the j-th evaluation indicator in the i-th city.
Step 2. Normalization of all indicators
The evaluation indicators are divided into positive indicators and negative indicators. For those positive indicators, that is, a larger value indicates a better result. The normalized value can be calculated as follows:
For those negative indicators, a smaller value indicates a better result. The normalized value can be calculated as follows:
where and are the minimum value and maximum value for the indicator j. And y′ij represents the evaluation value of the j-th evaluation indicator in the i-th city after normalization.
Step 3. Construction of a weighted decision matrix
The weighted decision matrix can be obtained through the product of the matrix after normalization and the entropy weight as follows:
where zij represents the weighted evaluation value of the j-th indicator in the i-th city after normalization. And represents the weight of the j-th evaluation indicator.
Step 4. Calculation of the positive ideal distance and the negative ideal distance
Before calculating the positive ideal distance and the negative ideal distance, the positive ideal value and the negative ideal value of the j-th evaluation indicator in the i-th city should be calculated as follows:
Then, based on the positive ideal value and the negative ideal value, the positive ideal distance and the negative ideal distance of the i-th city should be calculated as follows:
Step 5. Calculation of relative closeness
The relative closeness value (Ri) of the i-th city is used to sort the evaluation objects. A larger relative closeness value represents a smaller distance between the evaluation object and the ideal sample. The specific equation is as follows:
Therefore, in this study, for the i-th city, the comprehensive development values of the demand system (ud) and supply system (us) are represented by the relative closeness values (Ri), respectively.
3.1.3. Entropy Weight Method
The entropy weight method is used to determine the weight of each indicator (ωj) in this study. Entropy is a measure of the degree of disorder of the system. Suppose the entropy of the indicator is small. In that case, more information is provided by the indicator, which means the role of this indicator in the comprehensive evaluation is bigger. Therefore, the indicator should be given a higher weight [51]. The entropy weight method can effectively avoid the influence of human’s subjective impressions on the evaluation results. At present, the method has been widely applied to many fields such as urban rail transit system operation [36], sustainable performance of urbanization [52], eco-industrial parks [53]. The specific steps are as follows [32,52]:
As for the evaluation matrix after normalization, firstly, the contribution value (pij) of j-th indicator in i-th city should be calculated as follows:
Then, before obtaining the entropy weight of j-th indicator, an entropy value (ej) for each indicator can be calculated as follows:
Finally, the entropy weight value (ωj) of j-th indicator can be calculated as follows:
3.2. Data Sources
In this study, 35 cities that developed and operated metro systems in 2018 in China are selected for the empirical analysis. The research data in assessing urban environmental conditions are collected from Ecology and Environment Statement in 2019 of each city in China. And the ones in the perfection of the metro development come from the Annual Statistics and Analysis Report in 2019 of Urban Rail Transit [54]. Moreover, others are from Statistical Yearbook in 2020 of each city respectively [55]. The 35 cities’ values of 25 indicators are shown in Appendix A.
4. Analysis Results
4.1. Results of Entropy Weights
Firstly, the normalized values of 18 positive and 7 negative indicators in 35 cities are obtained using Equations (8) and (9). After that, the contribution value, the entropy value and the entropy weight of each indicator of demand and supply systems are calculated by the Equations (17)–(19). The entropy weights of the two systems are presented in Table 3 and Table 4.
Table 3.
Entropy weights of demand system.
Table 4.
Entropy weights of supply system.
From Table 3, 16 indicators are in the demand system, and the average weight is 0.0625. In addition, the weight of average daily passenger travel volume stands in the first place, and taxis per 10,000-person locates at the end, whose values are 0.2134 and 0.0192, respectively. Among them, there are 5 indicators whose weight is larger than the average weight. They belong to two-factor layers, which influence the metro development more from the demand dimension. Furthermore, among the four factor layers, the perfection of the development of metro affects the metro development most, followed by the satisfaction of people’s going out and improvement of urban environmental conditions, and improvement of urban traffic conditions takes the last place.
From Table 4, the average weight of 9 indicators is 0.1111. The maximum weight belongs to general public budget revenue and the minimum belongs to the population urbanization rate, whose values are 0.2009 and 0.0258. Moreover, five indicators whose weight is larger than the average weight are distributed in all the factor layers. Therefore, three-factor layers all play an irreplaceable role in developing the metro from the supply dimension.
4.2. Results of TOPSIS Values
Next, the weighted values of the two systems are calculated by the Equation (11), and each indicator’s maximum and minimum values in the 35 cities are identified. Therefore, the positive ideal distance, the negative ideal distance, and the relative closeness value of each city of two systems are calculated by the Equations (12)–(16). The results are presented in Table 5 and Table 6.
Table 5.
TOPSIS values of demand system.
Table 6.
TOPSIS values of supply system.
From Table 5, in the demand system, the average relative closeness value of 35 cities is 0.2950. Shanghai stands in first place with 0.7401, followed by Beijing and Guangzhou, with distinct advantages. In the other cities, the relative closeness values of 14 cities are above the average. The remaining cities are between 0.1607 and 0.2694.
From Table 6, the average relative closeness value of 35 cities is 0.2781 in the supply system. Furthermore, Shanghai, Beijing, Chongqing, Guangzhou, Shenzhen, and Tianjin are located in the top six. And the relative closeness values of the rest cities are between 0.0619 and 0.4554.
4.3. Results of Coupling Coordination Degree Values
Finally, by combining the value of ud in Table 5 and us in Table 6 to Equation (6), the coupling coordination degree values of 35 cities are calculated. Taking the Shanghai metro system as an example, the value of ud in Table 5 is 0.7401, and the value of us in Table 6 is 0.7947. Therefore, based on the Equation (6), the coupling coordination degree value of the Shanghai metro system can be carried out as follows:
The calculating results for 35 cites are presented in Table 7.
Table 7.
Coupling Coordination Degree Values.
From Table 7, the average coupling coordination degree is 0.5115. And Shanghai ranks first with 0.8757, and Lanzhou lies at the end with 0.3492. According to Table 2, Beijing, Shanghai, and Guangzhou belong to the level of highly balanced, and the following 12 cities belong to the next level named barely balanced. The rest of the cities enter a slightly unbalanced level. The coupling coordination degree value and TOPSIS value of each city are shown in Figure 2.
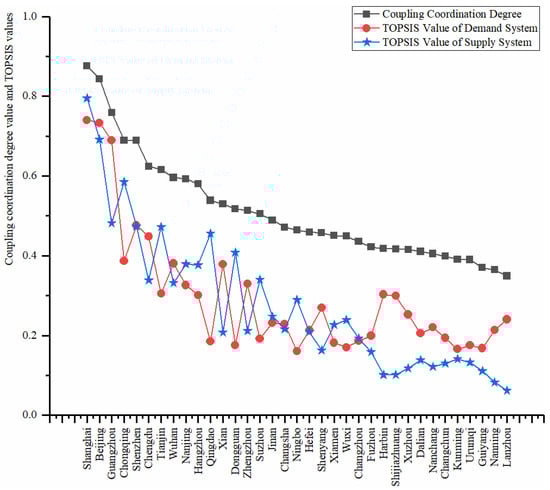
Figure 2.
Coupling coordination degree values and TOPSIS values of all cities.
5. Discussion
According to the coupling coordination degree levels and types in Table 2, the 35 cities can be classified into 6 categories in this study, as shown in Table 8.
Table 8.
Categories of metro systems.
Furthermore, combining metro scales of each metro system, 6 categories of the coupling coordination degree are further analyzed in this study. And the metro scales of the 35 cities in 2019 are shown in Table 9.
Table 9.
Metro scales.
5.1. Highly Balanced with Lagging Demand Conditions
As shown in Figure 3, only the Shanghai metro system belongs to this category, whose TOPSIS values of demand and supply system and coupling coordination degree value rank first, symbolizing the most excellent development condition of the metro system. Significant population mobility, difficult environmental situation, and traffic congestion motivate the demand for metro development; meanwhile, a thriving economy, employment-population, and mature urban construction are supplied for metro development. High-levelled and coordinated conditions of demand and supply system make Shanghai a mature metro scale. The Shanghai Metro is officially the most extended railway network in the world [56].
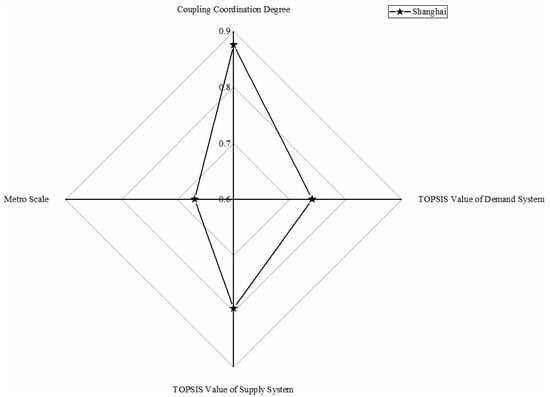
Figure 3.
Metro in highly balanced with lagging demand conditions.
5.2. Highly Balanced with Lagging Supply Conditions
As shown in Figure 4, Beijing metro and Guangzhou metro are highly balanced with lagging supply conditions. Beijing metro shows a great development environment close to Shanghai due to its high TOPSIS demand, supply system values, and coupling coordination degree value. However, in the TOPSIS value of supply system, there is a relatively massive distance between Beijing metro and Shanghai metro mainly because of general public budget revenue, new urban workers, and construction land, which causes Beijing metro and Shanghai metro not to be in the same category. Similarly, the Beijing metro is the world’s busiest in annual ridership [57], so Beijing metro also should aim to achieve metro sustainable development. As for Guangzhou metro, it is evident that it has just reached the level of highly balanced. Guangzhou metro ranks in the forefront in all four aspects, showing a higher level from the ranking point. However, Guangzhou metro performs not so from the point of value, particularly in the TOPSIS value of the supply system. Compared with Beijing and Shanghai, also in the level of highly balanced, Guangzhou metro has disadvantages in various factors. High demand and a relatively lower supply indicates Guangzhou metro is still in the rising period of metro development [58], so Guangzhou should focus on the economy, employment, and urban construction at the city level while developing the metro to lie at the highly balanced level steadily.
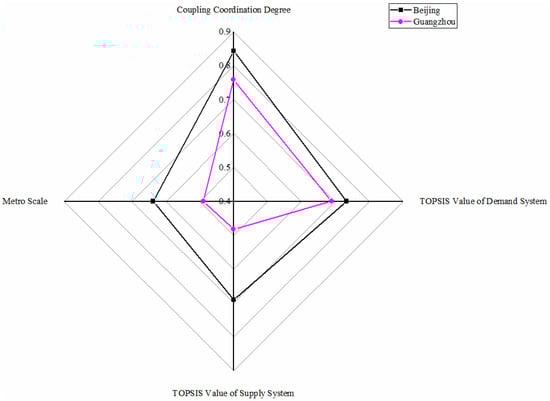
Figure 4.
Metros in highly balanced with lagging supply conditions.
5.3. Barely Balanced with Lagging Demand Conditions
There are seven metro systems in this category: Chongqing, Tianjin, Nanjing, Hangzhou, Qingdao, Dongguan, and Suzhou, as shown in Figure 5. Chongqing metro stands first from the dimension of demand, followed by Nanjing, Tianjin, and Hangzhou; then, Suzhou, Qingdao and Dongguan are in last with a significant distance. Moreover, from the supply dimension, Chongqing metro leads the six other metro systems with apparent advantages. Chongqing, Tianjin, Nanjing, and Hangzhou rank the top four from the dimension of coupling coordination degree, and Qingdao, Dongguan, and Suzhou are relatively close behind.
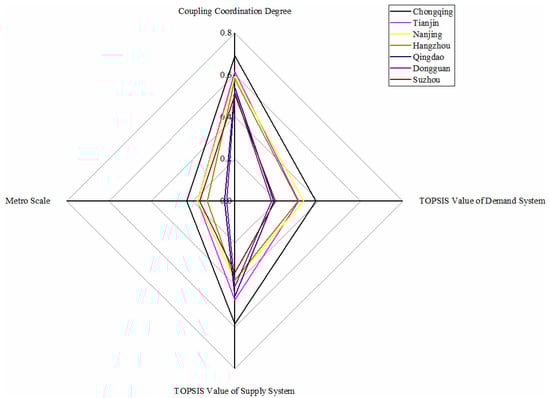
Figure 5.
Metros in barely balanced with lagging demand conditions.
Furthermore, for Chongqing metro system, its excellent supply conditions can suit the high demand well. Since 2005, Chongqing has made tremendous progress in building, facilities, and people satisfaction [59]. Under the same supply conditions, the demand of Tianjin metro is relatively low due to the insufficient support of passenger flow. Lan [60] researched that metro commuters are not the most popular form of transportation for Tianjin residents due to the higher cost of metro tickets, general walkable neighborhoods, and old metro stations’ inconvenience. However, the metro scales of Chongqing and Tianjin are small, which is related to the fact that there are other lines named monorail or light rail. Nanjing metro’s demand and supply system evaluations are pretty close, so the coupling degree is the highest. However, limited by population, economy, and construction, its coupling coordination degree does not perform as well as the coupling degree but is still at the forefront. It is pointed out by Yuan et al. [61] that Nanjing has been ranked sixth in evaluating “Cities with the Strongest Comprehensive Strength” issued by the National Statistics Bureau. Hangzhou metro and Suzhou metro are steadily advancing by taking Nanjing metro as a template through its TOPSIS value, coupling coordination value, and metro scale. Besides, Qingdao metro and Dongguan metro perform worse in the demand system with excellent supply conditions due to the underdeveloped metro scale. In the future, Chongqing and Tianjin can vigorously promote the construction of the metro based on a particular economy. Given the relatively good metro scale in Nanjing, Hangzhou, and Suzhou, steady progress will align with the current situation. Qingdao and Dongguan should pay attention to the economic situation as appropriation construction of the metro system.
5.4. Barely Balanced with Lagging Supply Conditions
From Figure 6, Shenzhen metro system performs best in the TOPSIS value of demand and supply system and coupling coordination degree value in this category. However, Shenzhen does not perform so well for the metro scale. In Guangdong Province, Guangzhou and Shenzhen are considered the forefront of city centrality in transportation and economic networks [62]. Nevertheless, in coupling coordination conditions of metro development, there seem to be certain distances between Shenzhen and Guangzhou, mainly due to the lower demand system in Shenzhen metro system. The reason may be that there is a mutually inhibiting effect between the demand system and the metro scale.
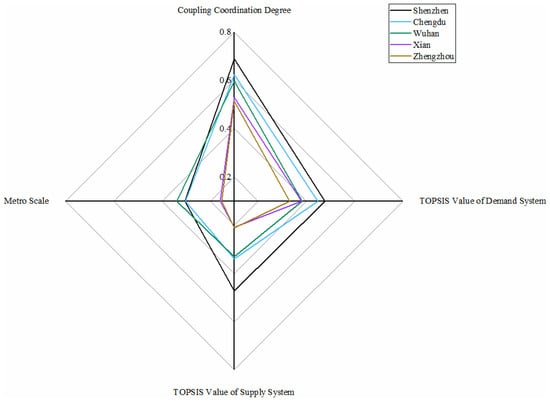
Figure 6.
Metros in barely balanced with lagging supply conditions.
The levels of Chengdu metro and Wuhan metro are lower than Shenzhen in most aspects. As for Chengdu, slightly weak environmental issues and adequate passenger supports make the evaluation value of the demand system a little bit higher than the supply system. Chengdu performs terribly in urban road emissions as one of the three Chinese cities with the most vehicles nationwide [63]. But for Wuhan, undeveloped urban construction makes the supply system a low level. Therefore, there is still a certain distance compared with the ultimate excellence level, the same conclusion in public transport [48]. In addition, Xian and Zhengzhou perform a high demand situation because of the worse environmental issues and crowded metro situation. In the future, the five cities should focus on developing the economy and urban construction when developing the metro to assure coordinated development of demand and supply systems.
5.5. Slightly Unbalanced with Lagging Demand Conditions
As shown in Figure 7, there are five metro systems in this category. All systems are at a low level in the dimension of demand. For the dimension of supply, Ningbo metro performs best due to its economy, and four other cities are not much different. As for the value of coupling coordination degree, Jinan metro takes first, Ningbo, Xiamen and Wuxi, and Changzhou takes last.
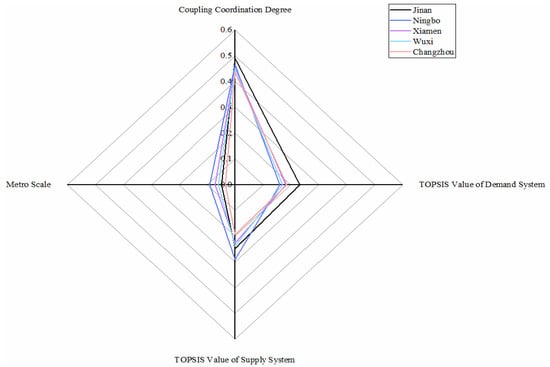
Figure 7.
Metros in slightly unbalanced with lagging demand conditions.
The population is the main reason why the low evaluation values of the demand system in the cities. The resident population and passenger flow of public transportation cannot offer the development of metro supports. Environmental issues and infrastructure situations perform relatively better. In the future, the cities should focus on developing demand conditions, for example, attracting more population by developing the economy and urban construction or improving metro to attract passengers. Meanwhile, not bringing burden to the local economy should taken into consideration when developing metro.
5.6. Slightly Unbalanced with Lagging Supply Conditions
As shown in Figure 8, more than one-third of the metro systems belong to this category. All the metro systems in this category are at a low level in the dimension of supply. However, in the dimension of demand, the differences between metro systems are significant. Meanwhile, the values of coupling coordination degree are between 0.35 and 0.47, which is a small distance. The economy is the main factor that pulls the evaluation values of the supply system down. Its general public budget revenue and GDP both perform worse in all the cities. That is, the economy of the cities cannot create a favourable economic environment for the development of a metro.
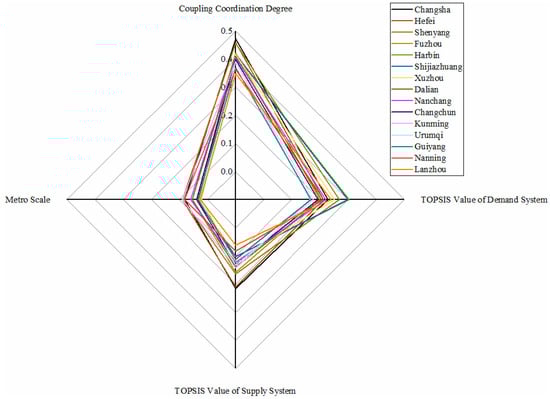
Figure 8.
Metros in slightly unbalanced with lagging supply conditions.
Moreover, some metro systems performed a high demand situation, especially Harbin metro and Shijiazhuang metro, because of the large population and the worse environmental issues. In the future, metro systems in this category should pay more attention to the development of the economy. Only in a favorable economic environment can the metro make a significant development.
6. Conclusions
The coupling coordination degree of 35 cities in China is measured by the indicator system and coupling coordination degree model established in this study. From the results and the discussion, firstly, the comprehensive evaluation indicator system of metro development conditions and the coupling coordination degree model can be well used to evaluate the coupling and coordination of the metro system. Secondly, the development conditions of the metro system among the 35 cities in China are quite different according to the calculation results due to the individual differences in the specific socio-economic condition in all the cities. Finally, the category of coupling coordination degree and the comparison of demand and supply conditions can offer specific suggestions for metro development in the future. For example, the metro systems of slightly unbalanced cities should put urban development first because only favorable demand and supply conditions will benefit the metro development. Moreover, cities’ metro systems in the types of barely balanced and highly balanced should improve the demand or supply conditions based on the results, keep harmony between the two systems, and finally realize sustainable development for the metro system.
This study has yet to consider the availability of data for other countries in the constructed model, which is a limitation. However, suppose the constructed model is applied to other cases. In that case, the parameters of the model will be appropriately modified according to the data characteristics of other countries. This is also the following research focus of the research team, through optimizing the established model and collecting more data for analysis of more metro systems in the world. In addition, sustainable development for the metro system is not only the improvement in demand and supply conditions, but also the sustainability parameters regarding risk management, the environmental impacts of its construction, the comparison with other mass transport systems with lower emissions or fewer infrastructure requirements, and the damage from natural disasters. Hence, there is still considerable space for improvement for model parameters to analyze the sustainable development of the metro system.
Author Contributions
Conceptualization, Y.Z. (Yinghan Zhu) and L.J.; methodology, Y.Z. (Yinghan Zhu); formal analysis, Y.Z. (Yu Zhang); investigation, Y.Z. (Yinghan Zhu) and Y.W.; resources, Y.Z. (Yinghan Zhu); data curation, Y.Z. (Yinghan Zhu); writing—original draft preparation, Y.Z. (Yinghan Zhu); writing—review and editing, L.J.; visualization, X.H. All authors have read and agreed to the published version of the manuscript.
Funding
This research was funded by the National Natural Science Foundation of China (Grant No. 71901043 and No. 72004187) and the Chongqing Municipal Education Commission Project (Grant No. KJQN201900713).
Institutional Review Board Statement
Not applicable.
Informed Consent Statement
Not applicable.
Data Availability Statement
The data presented in this study are available in the main text of the article.
Conflicts of Interest
The authors declare no conflict of interest.
Appendix A. Original Data
Table A1.
Data of Demand System.
Table A1.
Data of Demand System.
| City | Indicator Layer | |||||||||||||||
|---|---|---|---|---|---|---|---|---|---|---|---|---|---|---|---|---|
| D11 | D12 | D13 | D21 | D22 | D23 | D24 | D31 | D32 | D33 | D34 | D35 | D41 | D42 | D43 | D44 | |
| Beijing | 2154 | 1137 | 70.73 | 4 | 42 | 240 | 69.6 | 2.040 | 7.68 | 10.68 | 33.21 | 0.2310 | 1.56 | 0.358 | 6.32 | 1086.9 |
| Shanghai | 2428 | 3830 | 59.17 | 7 | 35 | 309 | 68.3 | 1.739 | 4.72 | 7.37 | 16.46 | 0.1400 | 1.51 | 0.334 | 5.95 | 1064.3 |
| Tianjin | 1562 | 4939 | 16.16 | 11 | 51 | 219 | 66.5 | 1.612 | 12.98 | 8.16 | 20.45 | 0.1683 | 0.60 | 0.153 | 1.76 | 144.2 |
| Chongqing | 2027 | 2012 | 34.93 | 7 | 38 | 316 | 64.6 | 2.165 | 14.38 | 7.04 | 11.72 | 0.1989 | 0.87 | 0.162 | 3.77 | 285.4 |
| Guangzhou | 1531 | 6141 | 55.36 | 7 | 30 | 293 | 69.3 | 1.744 | 13.90 | 9.97 | 13.21 | 0.1417 | 1.74 | 0.327 | 4.86 | 906.8 |
| Shenzhen | 1344 | 6728 | 35.50 | 5 | 24 | 332 | 69.7 | 1.600 | 8.46 | 12.73 | 16.00 | 0.2031 | 1.66 | 0.235 | 5.38 | 490.8 |
| Wuhan | 1121 | 6438 | 26.49 | 9 | 45 | 245 | 68.7 | 1.716 | 13.22 | 8.67 | 15.87 | 0.2735 | 0.88 | 0.346 | 3.34 | 340.5 |
| Nanjing | 850 | 1588 | 20.66 | 10 | 40 | 255 | 67.4 | 1.705 | 24.30 | 10.32 | 14.22 | 0.2485 | 0.84 | 0.464 | 4.01 | 315.7 |
| Shenyang | 832 | 3535 | 14.63 | 21 | 43 | 284 | 70.0 | 1.677 | 15.39 | 7.17 | 26.24 | 0.2581 | 0.60 | 0.222 | 2.46 | 110.6 |
| Changchun | 773 | 1349 | 9.09 | 11 | 38 | 306 | 69.5 | 1.777 | 16.52 | 6.58 | 20.94 | 0.2127 | 0.56 | 0.152 | 1.16 | 56.1 |
| Dalian | 699 | 2899 | 11.39 | 11 | 35 | 302 | 67.3 | 1.659 | 13.86 | 8.04 | 16.65 | 0.2123 | 0.35 | 0.259 | 2.66 | 55.7 |
| Chengdu | 1658 | 6357 | 28.76 | 6 | 43 | 287 | 69.2 | 1.610 | 15.87 | 9.62 | 9.97 | 0.2647 | 1.22 | 0.263 | 5.57 | 417.6 |
| Xian | 1020 | 6767 | 23.20 | 9 | 58 | 225 | 70.5 | 1.730 | 18.44 | 10.36 | 16.50 | 0.3021 | 1.65 | 0.155 | 3.58 | 260.4 |
| Harbin | 1076 | 10,542 | 11.65 | 17 | 42 | 304 | 71.8 | 1.905 | 15.87 | 6.88 | 16.71 | 0.1660 | 0.94 | 0.028 | 1.29 | 28.4 |
| Suzhou | 1075 | 2520 | 11.57 | 9 | 36 | 288 | 66.4 | 1.483 | 29.66 | 8.34 | 8.39 | 0.3260 | 0.60 | 0.195 | 2.11 | 100.2 |
| Zhengzhou | 1035 | 8793 | 13.45 | 9 | 58 | 177 | 67.8 | 1.580 | 9.39 | 6.10 | 10.54 | 0.3380 | 0.84 | 0.188 | 2.99 | 126.7 |
| Kunming | 695 | 2282 | 9.82 | 12 | 26 | 356 | 67.4 | 1.676 | 9.83 | 9.82 | 13.29 | 0.3235 | 0.66 | 0.128 | 1.52 | 58.6 |
| Hangzhou | 1036 | 3950 | 20.41 | 7 | 38 | 287 | 68.6 | 1.627 | 13.69 | 10.34 | 13.64 | 0.2087 | 1.36 | 0.126 | 3.71 | 177.9 |
| Changsha | 839 | 3207 | 10.18 | 7 | 47 | 275 | 69.4 | 1.687 | 13.91 | 11.43 | 9.29 | 0.2841 | 1.01 | 0.120 | 2.25 | 101.2 |
| Ningbo | 854 | 2371 | 5.91 | 9 | 29 | 318 | 68.9 | 1.380 | 12.86 | 8.28 | 7.34 | 0.2770 | 0.53 | 0.113 | 1.28 | 51.1 |
| Wuxi | 659 | 2089 | 4.64 | 8 | 39 | 263 | 68.6 | 1.443 | 27.56 | 7.15 | 7.82 | 0.2613 | 0.51 | 0.089 | 0.83 | 30.0 |
| Nanchang | 560 | 6804 | 5.53 | 9 | 35 | 322 | 66.7 | 1.499 | 13.49 | 6.99 | 9.74 | 0.1786 | 0.80 | 0.108 | 1.47 | 48.0 |
| Lanzhou | 379 | 7817 | 8.75 | 18 | 36 | 296 | 68.8 | 1.548 | 21.54 | 8.20 | 27.87 | 0.1840 | 0.66 | 0.228 | 1.21 | 16.9 |
| Qingdao | 950 | 1714 | 12.69 | 8 | 37 | 287 | 68.3 | 1.574 | 19.32 | 8.94 | 11.45 | 0.2663 | 0.28 | 0.194 | 2.13 | 51.7 |
| Fuzhou | 780 | 4131 | 5.41 | 5 | 24 | 360 | 68.7 | 1.613 | 13.65 | 4.91 | 8.13 | 0.1526 | 0.63 | 0.068 | 1.04 | 33.5 |
| Dongguan | 846 | 3886 | 3.40 | 10 | 32 | 285 | 69.3 | 1.588 | 12.88 | 7.07 | 4.01 | 0.3385 | 0.39 | 0.045 | 0.95 | 14.7 |
| Nanning | 734 | 4386 | 6.00 | 10 | 33 | 333 | 69.0 | 1.526 | 20.94 | 5.12 | 9.29 | 0.2104 | 0.99 | 0.110 | 1.87 | 80.0 |
| Hefei | 819 | 3893 | 7.41 | 6 | 44 | 254 | 68.1 | 1.712 | 19.5 | 9.76 | 14.11 | 0.2282 | 0.77 | 0.109 | 1.79 | 68.5 |
| Shijiazhuang | 1039 | 6491 | 4.68 | 16 | 63 | 174 | 66.9 | 1.593 | 18.54 | 3.74 | 6.46 | 0.2491 | 0.68 | 0.037 | 1.44 | 26.2 |
| Guiyang | 497 | 2412 | 5.98 | 10 | 27 | 358 | 69.8 | 1.979 | 10.25 | 6.41 | 21.01 | 0.2408 | 0.40 | 0.070 | 0.88 | 13.9 |
| Xiamen | 429 | 8437 | 8.32 | 6 | 24 | 356 | 67.2 | 1.666 | 28.5 | 10.31 | 13.24 | 0.2709 | 0.42 | 0.168 | 0.95 | 30.1 |
| Urumqi | 355 | 4153 | 7.41 | 9 | 50 | 277 | 64.9 | 1.517 | 18.92 | 12.42 | 36.88 | 0.2830 | 0.32 | 0.075 | 0.56 | 8.6 |
| Jinan | 891 | 2546 | 7.63 | 15 | 53 | 207 | 69.6 | 1.684 | 20.53 | 9.53 | 12.68 | 0.2618 | 0.10 | 0.054 | 0.33 | 5.0 |
| Changzhou | 474 | 2946 | 3.05 | 10 | 44 | 255 | 67.5 | 1.248 | 21.87 | 5.60 | 7.77 | 0.2546 | 0.28 | 0.072 | 0.70 | 9.6 |
| Xuzhou | 883 | 3432 | 3.38 | 11 | 57 | 216 | 69.1 | 1.519 | 23.04 | 4.92 | 7.75 | 0.1581 | 0.36 | 0.025 | 0.45 | 7.8 |
Table A2.
Data of Supply System.
Table A2.
Data of Supply System.
| City | Indicator Layer | ||||||||
|---|---|---|---|---|---|---|---|---|---|
| S11 | S12 | S13 | S14 | S21 | S22 | S23 | S31 | S32 | |
| Beijing | 5817.10 | 35,371.30 | 73,849 | 7868.74 | 86.6 | 35.10 | 4.1 | 1469 | 1472 |
| Shanghai | 7165.10 | 38,155.32 | 73,615 | 8021.20 | 88.1 | 58.91 | 3.6 | 1238 | 1945 |
| Tianjin | 2410.25 | 14,104.28 | 46,119 | 12,122.73 | 83.5 | 50.17 | 3.5 | 1151 | 998 |
| Chongqing | 2134.90 | 23,605.77 | 37,939 | 19,725.11 | 66.8 | 75.16 | 2.6 | 1515 | 1319 |
| Guangzhou | 1697.21 | 23,628.60 | 65,052 | 7462.12 | 86.5 | 33.73 | 2.2 | 1324 | 722 |
| Shenzhen | 3773.21 | 26,927.09 | 62,522 | 7374.71 | 100.0 | 16.03 | 2.2 | 960 | 940 |
| Wuhan | 1564.12 | 16,223.21 | 51,706 | 9559.25 | 80.5 | 24.25 | 2.0 | 812 | 865 |
| Nanjing | 1580.03 | 14,030.15 | 64,372 | 7343.38 | 83.2 | 32.52 | 1.8 | 823 | 802 |
| Shenyang | 730.30 | 6470.30 | 46,786 | 1936.91 | 81.0 | 11.89 | 2.9 | 563 | 630 |
| Changchun | 420.00 | 5904.10 | 37,844 | 4489.71 | 49.6 | 10.20 | 2.5 | 543 | 537 |
| Dalian | 692.80 | 7001.70 | 46,468 | 1459.43 | 78.7 | 11.60 | 2.7 | 444 | 439 |
| Chengdu | 1483.00 | 17,012.65 | 45,878 | 9175.21 | 74.4 | 26.40 | 3.3 | 950 | 879 |
| Xian | 702.56 | 9321.19 | 41,850 | 8281.32 | 74.6 | 16.12 | 3.3 | 701 | 701 |
| Harbin | 370.90 | 5249.40 | 40,007 | 5372.54 | 65.9 | 10.10 | 3.5 | 446 | 438 |
| Suzhou | 2221.80 | 19,235.80 | 68,629 | 4933.10 | 77.0 | 17.32 | 1.8 | 478 | 476 |
| Zhengzhou | 1222.50 | 11,589.70 | 42,087 | 8634.07 | 74.6 | 11.50 | 1.8 | 581 | 563 |
| Kunming | 630.03 | 6475.88 | 46,289 | 4574.52 | 73.6 | 16.15 | 3.4 | 446 | 458 |
| Hangzhou | 1966.00 | 15,373.05 | 66,068 | 7242.34 | 78.5 | 34.00 | 1.8 | 648 | 612 |
| Changsha | 950.23 | 11,574.22 | 55,211 | 9290.31 | 79.6 | 14.77 | 2.7 | 378 | 324 |
| Ningbo | 1468.50 | 11,985.00 | 64,886 | 5610.33 | 73.6 | 25.40 | 1.6 | 355 | 397 |
| Wuxi | 1036.33 | 11,852.32 | 61,915 | 3595.94 | 77.1 | 15.42 | 1.8 | 347 | 300 |
| Nanchang | 476.08 | 5596.18 | 44,136 | 6253.42 | 75.2 | 7.54 | 2.3 | 356 | 319 |
| Lanzhou | 233.23 | 2837.36 | 38,095 | 1405.33 | 81.0 | 9.36 | 3.4 | 314 | 322 |
| Qingdao | 1247.10 | 11,741.31 | 54,484 | 10,204.05 | 74.1 | 75.10 | 3.0 | 758 | 651 |
| Fuzhou | 668.08 | 9392.30 | 47,920 | 7090.15 | 70.5 | 13.55 | 2.2 | 301 | 225 |
| Dongguan | 673.18 | 9482.50 | 55,156 | 2128.43 | 92.1 | 44.71 | 1.2 | 1194 | 1194 |
| Nanning | 370.93 | 4506.56 | 37,675 | 5293.10 | 63.7 | 7.52 | 2.7 | 320 | 315 |
| Hefei | 745.99 | 9409.40 | 45,404 | 7414.60 | 76.3 | 27.76 | 2.8 | 481 | 464 |
| Shijiazhuang | 569.10 | 5809.90 | 38,550 | 7192.38 | 65.1 | 13.90 | 3.2 | 309 | 57 |
| Guiyang | 417.26 | 4039.60 | 38,240 | 4660.41 | 76.1 | 18.51 | 3.0 | 369 | 345 |
| Xiamen | 768.37 | 5995.04 | 59,018 | 2857.97 | 89.2 | 26.18 | 2.8 | 398 | 383 |
| Urumqi | 472.46 | 3413.26 | 42,667 | 2266.61 | 90.2 | 14.50 | 2.7 | 488 | 456 |
| Jinan | 874.20 | 9443.37 | 51,913 | 5385.10 | 71.2 | 19.39 | 2.0 | 716 | 702 |
| Changzhou | 590.00 | 7400.90 | 58,345 | 4423.08 | 73.3 | 11.30 | 1.8 | 273 | 273 |
| Xuzhou | 468.32 | 7151.35 | 36,215 | 5759.35 | 66.7 | 11.25 | 1.8 | 282 | 280 |
References
- Lin, D.; Nelson, J.D.; Beecroft, M.; Cui, J. An overview of recent developments in China’s metro systems. Tunn. Undergr. Space Technol. 2021, 111, 103783. [Google Scholar] [CrossRef]
- Yang, X.; Wu, J.; Sun, H.; Gao, Z.; Yin, H.; Qu, Y. Performance improvement of energy consumption, passenger time and robustness in metro systems: A multi-objective timetable optimization approach. Comput. Ind. Eng. 2019, 137, 106076. [Google Scholar] [CrossRef]
- Loo, B.; Cheng, A. Are there useful yardsticks of population size and income level for building metro systems? Some worldwide evidence. Cities 2010, 27, 299–306. [Google Scholar] [CrossRef]
- Sharav, N.; Szeinuk, M.; Shiftan, Y. Does your city need a metro?–A Tel Aviv case study. Case Stud. Transp. Policy 2018, 6, 537–553. [Google Scholar] [CrossRef]
- Lusikka, T.; Kinnunen, T.K.; Kostiainen, J. Public transport innovation platform boosting Intelligent Transport System value chains. Util. Policy 2020, 62, 100998. [Google Scholar] [CrossRef]
- Han, B.; Yang, Z.; Yu, Y.; Qian, L.; Chen, J.; Ran, J.; Sun, Y.; Xi, Z.; Lu, F. Statistical analysis of urban rail transit operation in the world in 2020: A review. Urban Rapid Rail Transit 2021, 34, 5–11. (In Chinese) [Google Scholar]
- China Association of Metros. Available online: https://www.camet.org.cn/tjxx/7647 (accessed on 10 April 2021).
- Chang, Z. Financing new metros—The Beijing metro financing sustainability study. Transp. Policy 2014, 32, 148–155. [Google Scholar] [CrossRef]
- Shen, L.; Jiao, L.; He, B.; Li, L. Evaluation on the utility efficiency of metro infrastructure projects in China from sustainable development perspective. Int. J. Proj. Manag. 2015, 33, 528–536. [Google Scholar] [CrossRef]
- Tomal, M. Evaluation of coupling coordination degree and convergence behaviour of local development: A spatiotemporal analysis of all Polish municipalities over the period 2003–2019. Sustain. Cities Soc. 2021, 71, 102992. [Google Scholar] [CrossRef]
- Tan, Y.; Jiao, L.; Shuai, C.; Shen, L. A system dynamics model for simulating urban sustainability performance: A China case study. J. Clean. Prod. 2018, 199, 1107–1115. [Google Scholar] [CrossRef]
- Forero-Ortiz, E.; Martínez-Gomariz, E. Hazards threatening underground transport systems. Nat Hazards 2020, 100, 1243–1261. [Google Scholar] [CrossRef]
- Liu, Y.; Jing, X.; Guo, Q. Rational scale of urban rail transit network based on system dynamics. J. Chongqing Univ. 2011, 10, 26–34. [Google Scholar]
- Loo, B.; Li, D. Developing Metro Systems in the People’s Republic of China: Policy and Gaps. Transportation 2006, 33, 115–132. [Google Scholar] [CrossRef]
- Graham, D.J.; Crotte, A.; Anderson, R.J. A dynamic panel analysis of urban metro demand. Transp. Res. Part E Logist. Transp. Rev. 2009, 45, 787–794. [Google Scholar] [CrossRef]
- Paulley, N.; Balcombe, R.; Mackett, R.; Titheridge, H.; Preston, J.; Wardman, M.; Shires, J.; White, P. The demand for public transport: The effects of fares, quality of service, income and car ownership. Transp. Policy 2006, 13, 295–306. [Google Scholar] [CrossRef] [Green Version]
- Cowie, J. The Economics of Transport: A Theoretical and Applied Perspective, 1st ed.; Routledge: London, UK, 2009; pp. 1–400. [Google Scholar]
- Albalate, D.; Bel, G.; Fageda, X. When supply travels far beyond demand: Causes of oversupply in Spain’s transport infrastructure. Transp. Policy 2015, 41, 80–89. [Google Scholar] [CrossRef] [Green Version]
- Chen, Y.; Bouferguene, A.; Li, H.; Liu, H.; Shen, Y.; Al-Hussein, M. Spatial gaps in urban public transport supply and demand from the perspective of sustainability. J. Clean. Prod. 2018, 195, 1237–1248. [Google Scholar] [CrossRef]
- Hörcher, D.; Graham, D.J. Demand imbalances and multi-period public transport supply. Transp. Res. Part B Methodol. 2018, 108, 106–126. [Google Scholar] [CrossRef] [Green Version]
- Konečný, V.; Brídziková, M.; Marienka, P. Research of bus transport demand and its factors using multicriteria regression analysis. Transp. Res. Procedia 2021, 55, 180–187. [Google Scholar] [CrossRef]
- Malavenda, G.A.; Musolino, G.; Rindone, C.; Vitetta, A. Residential Location, Mobility, and Travel Time: A Pilot Study in a Small-Size Italian Metropolitan Area. J. Adv. Transp. 2020, 2020, 8827466. [Google Scholar] [CrossRef]
- Croce, A.I.; Musolino, G.; Rindone, C.; Vitetta, A. Route and Path Choices of Freight Vehicles: A Case Study with Floating Car Data. Sustainability 2020, 12, 8557. [Google Scholar] [CrossRef]
- Li, J.; Sun, W.; Li, M.; Meng, L. Coupling coordination degree of production, living and ecological spaces and its influencing factors in the Yellow River Basin. J. Clean. Prod. 2021, 298, 126803. [Google Scholar] [CrossRef]
- Dong, F.; Li, W. Research on the coupling coordination degree of “upstream-midstream-downstream” of China’s wind power industry chain. J. Clean. Prod. 2021, 283, 124633. [Google Scholar] [CrossRef]
- Sun, Y.; Cui, Y. Evaluating the coordinated development of economic, social and environmental benefits of urban public transportation infrastructure: Case study of four Chinese autonomous municipalities. Transp. Policy 2018, 66, 116–126. [Google Scholar] [CrossRef]
- Li, W.; Yi, P. Assessment of city sustainability—Coupling coordinated development among economy, society and environment. J. Clean. Prod. 2020, 256, 120453. [Google Scholar] [CrossRef]
- Shen, L.; Huang, Y.; Huang, Z.; Lou, Y.; Ye, G.; Wong, I.S. Improved coupling analysis on the coordination between socio-economy and carbon emission. Ecol. Indic. 2018, 94, 357–366. [Google Scholar] [CrossRef]
- Xing, L.; Xue, M.; Hu, M. Dynamic simulation and assessment of the coupling coordination degree of the economy–resource–environment system: Case of Wuhan City in China. J. Environ. Manag. 2019, 230, 474–487. [Google Scholar] [CrossRef]
- Pan, Z.; Wang, J. Spatially heterogeneity response of ecosystem services supply and demand to urbanization in China. Ecol. Eng. 2021, 169, 106303. [Google Scholar] [CrossRef]
- Chen, Z.; He, Q.; Su, X.; Yuan, Y.; Chen, S. The opening conditions of the metro and its early characteristics: A historical perspective. Tunn. Undergr. Space Technol. 2021, 108, 103732. [Google Scholar] [CrossRef]
- Wang, M.; Zhao, X.; Gong, Q.; Ji, Z. Measurement of Regional Green Economy Sustainable Development Ability Based on Entropy Weight-Topsis-Coupling Coordination Degree—A Case Study in Shandong Province, China. Sustainability 2019, 11, 280. [Google Scholar] [CrossRef] [Green Version]
- Zope, R.; Vasudevan, N.; Arkatkar, S.S.; Joshi, G. Benchmarking: A tool for evaluation and monitoring sustainability of urban transport system in metropolitan cities of India. Sustain. Cities Soc. 2019, 45, 48–58. [Google Scholar] [CrossRef]
- Lan, F.; Gong, X.; Da, H.; Wen, H. How do population inflow and social infrastructure affect urban vitality? Evidence from 35 large- and medium-sized cities in China. Cities 2019, 100, 102454. [Google Scholar] [CrossRef]
- Cui, D.; Chen, X.; Xue, Y.; Li, R.; Zeng, W. An integrated approach to investigate the relationship of coupling coordination between social economy and water environment on urban scale—A case study of Kunming. J. Environ. Manag. 2019, 234, 189–199. [Google Scholar] [CrossRef] [PubMed]
- Huang, W.; Shuai, B.; Sun, Y.; Wang, Y.; Antwi, E. Using entropy-TOPSIS method to evaluate urban rail transit system operation performance: The China case. Transp. Res. Part A Policy Pract. 2018, 111, 292–303. [Google Scholar] [CrossRef]
- Shen, L.; Zhou, J. Examining the effectiveness of indicators for guiding sustainable urbanization in China. Habitat Int. 2014, 44, 111–120. [Google Scholar] [CrossRef]
- Luo, J.; Zhang, X.; Wu, Y.; Shen, J.; Shen, L.; Xing, X. Urban land expansion and the floating population in China: For production or for living? Cities 2018, 74, 219–228. [Google Scholar] [CrossRef]
- Michael, F.L.; Noor, Z.Z.; Figueroa, M.J. Review of urban sustainability indicators assessment—Case study between Asian countries. Habitat Int. 2014, 44, 491–500. [Google Scholar] [CrossRef]
- Ma, L.; Cheng, W.; Qi, J. Coordinated evaluation and development model of oasis urbanization from the perspective of new urbanization: A case study in Shandan County of Hexi Corridor, China. Sustain. Cities Soc. 2018, 39, 78–92. [Google Scholar] [CrossRef]
- Sun, Y.; Cui, Y. Analyzing urban infrastructure economic benefit using an integrated approach. Cities 2018, 79, 124–133. [Google Scholar] [CrossRef]
- Zhang, L.; Wu, M.; Bai, W.; Jin, Y.; Yu, M.; Ren, J. Measuring coupling coordination between urban economic development and air quality based on the Fuzzy BWM and improved CCD model. Sustain. Cities Soc. 2021, 75, 103283. [Google Scholar] [CrossRef]
- Zhang, Y.; Mao, Y.; Jiao, L.; Shuai, C.; Zhang, H. Eco-efficiency, eco-technology innovation and eco-well-being performance to improve global sustainable development. Environ. Impact Assess. Rev. 2021, 89, 106580. [Google Scholar] [CrossRef]
- Xiao, H.; Wang, D.; Qi, Y.; Shao, S.; Zhou, Y.; Shan, Y. The governance-production nexus of eco-efficiency in Chinese resource-based cities: A two-stage network DEA approach. Energy Econ. 2021, 101, 105408. [Google Scholar] [CrossRef]
- Rohit, R.N.; Puthuvayi, B. A comprehensive literature review of Multi-Criteria Decision Making methods in heritage buildings. J. Build. Eng. 2020, 32, 101814. [Google Scholar]
- Hwang, C.L.; Yoon, K.P. Multiple Attribute Decision Making. Methods and Applications. A state-of- the-Art Survey; Springer: Berlin/Heidelberg, Germany, 1981; pp. 1–531. [Google Scholar]
- Wang, Z.; Hao, H.; Gao, F.; Zhang, Q.; Zhang, J.; Zhou, Y. Multi-attribute decision making on reverse logistics based on DEA-TOPSIS: A study of the Shanghai End-of-life vehicles industry. J. Clean. Prod. 2019, 214, 730–737. [Google Scholar] [CrossRef]
- Zhang, X.; Zhang, Q.; Sun, T.; Zou, Y.; Chen, H. Evaluation of urban public transport priority performance based on the improved TOPSIS method: A case study of Wuhan. Sustain. Cities Soc. 2018, 43, 357–365. [Google Scholar] [CrossRef]
- Chen, W.; Shen, Y.; Wang, Y. Evaluation of economic transformation and upgrading of resource-based cities in Shaanxi province based on an improved TOPSIS method. Sustain. Cities Soc. 2018, 37, 232–240. [Google Scholar] [CrossRef]
- Jain, B.; Brar, G.; Malhotra, J.; Rani, S. A Novel Approach for Smart Cities in Convergence to Wireless Sensor Networks. Sustain. Cities Soc. 2017, 35, 440–448. [Google Scholar] [CrossRef]
- Liu, K.; Lin, B. Research on influencing factors of environmental pollution in China: A spatial econometric analysis. J. Clean. Prod. 2019, 206, 356–364. [Google Scholar] [CrossRef]
- Shen, L.; Shuai, C.; Jiao, L.; Tan, Y.; Song, X. A Global Perspective on the Sustainable Performance of Urbanization. Sustainability 2016, 8, 783. [Google Scholar] [CrossRef] [Green Version]
- Zhao, H.; Zhao, H.; Guo, S. Evaluating the comprehensive benefit of eco-industrial parks by employing multi-criteria decision making approach for circular economy. J. Clean. Prod. 2017, 142, 2262–2276. [Google Scholar] [CrossRef]
- China Association of Metros. Available online: https://www.camet.org.cn/tjxx/5133 (accessed on 8 May 2020).
- National Bureau of Statistics. Available online: http://www.stats.gov.cn/ (accessed on 24 June 2021).
- Aina, Y.A.; Wafer, A.; Ahmed, F.; Alshuwaikhat, H.M. Top-down sustainable urban development? Urban governance transformation in Saudi Arabia. Cities 2019, 90, 272–281. [Google Scholar] [CrossRef]
- Sun, G.; Zacharias, J. Can bicycle relieve overcrowded metro? Managing short-distance travel in Beijing. Sustain. Cities Soc. 2017, 35, 323–330. [Google Scholar] [CrossRef]
- Zhang, J.; Wang, S.; Wang, X. Comparison analysis on vulnerability of metro networks based on complex network. Phys. A Stat. Mech. Its Appl. 2018, 496, 72–78. [Google Scholar] [CrossRef]
- Deng, W.; Peng, Z.; Tang, Y. A quick assessment method to evaluate sustainability of urban built environment: Case studies of four large-sized Chinese cities. Cities 2019, 89, 57–69. [Google Scholar] [CrossRef]
- Lan, A. Transport Orientated Development and Commercialization of Underground Space in China: Trends in Shanghai, Tianjin and Shenzhen. Procedia Eng. 2016, 165, 555–563. [Google Scholar] [CrossRef]
- Yuan, F.; Gao, J.; Wu, J. Nanjing-an ancient city rising in transitional China. Cities 2016, 50, 82–92. [Google Scholar] [CrossRef]
- Lao, X.; Zhang, X.; Shen, T.; Skitmore, M. Comparing China’s city transportation and economic networks. Cities 2016, 53, 43–50. [Google Scholar] [CrossRef] [Green Version]
- Zhou, Z.; Tan, Q.; Liu, H.; Deng, Y.; Wu, K.; Lu, C.; Zhou, X. Emission characteristics and high-resolution spatial and temporal distribution of pollutants from motor vehicles in Chengdu, China. Atmos. Pollut. Res. 2019, 10, 749–758. [Google Scholar] [CrossRef]
Publisher’s Note: MDPI stays neutral with regard to jurisdictional claims in published maps and institutional affiliations. |
© 2021 by the authors. Licensee MDPI, Basel, Switzerland. This article is an open access article distributed under the terms and conditions of the Creative Commons Attribution (CC BY) license (https://creativecommons.org/licenses/by/4.0/).