
Enhancing the Physical Activity Levels of Frail Older Adults with a Wearable Activity Tracker-Based Exercise Intervention: A Pilot Cluster Randomized Controlled Trial

 ,
,  , , ,
, , ,  and
and
Abstract
1. Introduction
- To determine the feasibility (i.e., recruitment rate, attrition rate, frequency of using the WAT, adherence to an exercise regimen) of the WAT-based exercise intervention to be employed in community-dwelling older people with frailty;
- To determine issues relating to the acceptability of the WAT-based exercise intervention.
- To explore the preliminary effects of the WAT-based exercise intervention on improving physical activity levels, physical endurance, and the motivation to engage in physical activity.
2. Methods
2.1. Trial Design
2.2. Participants
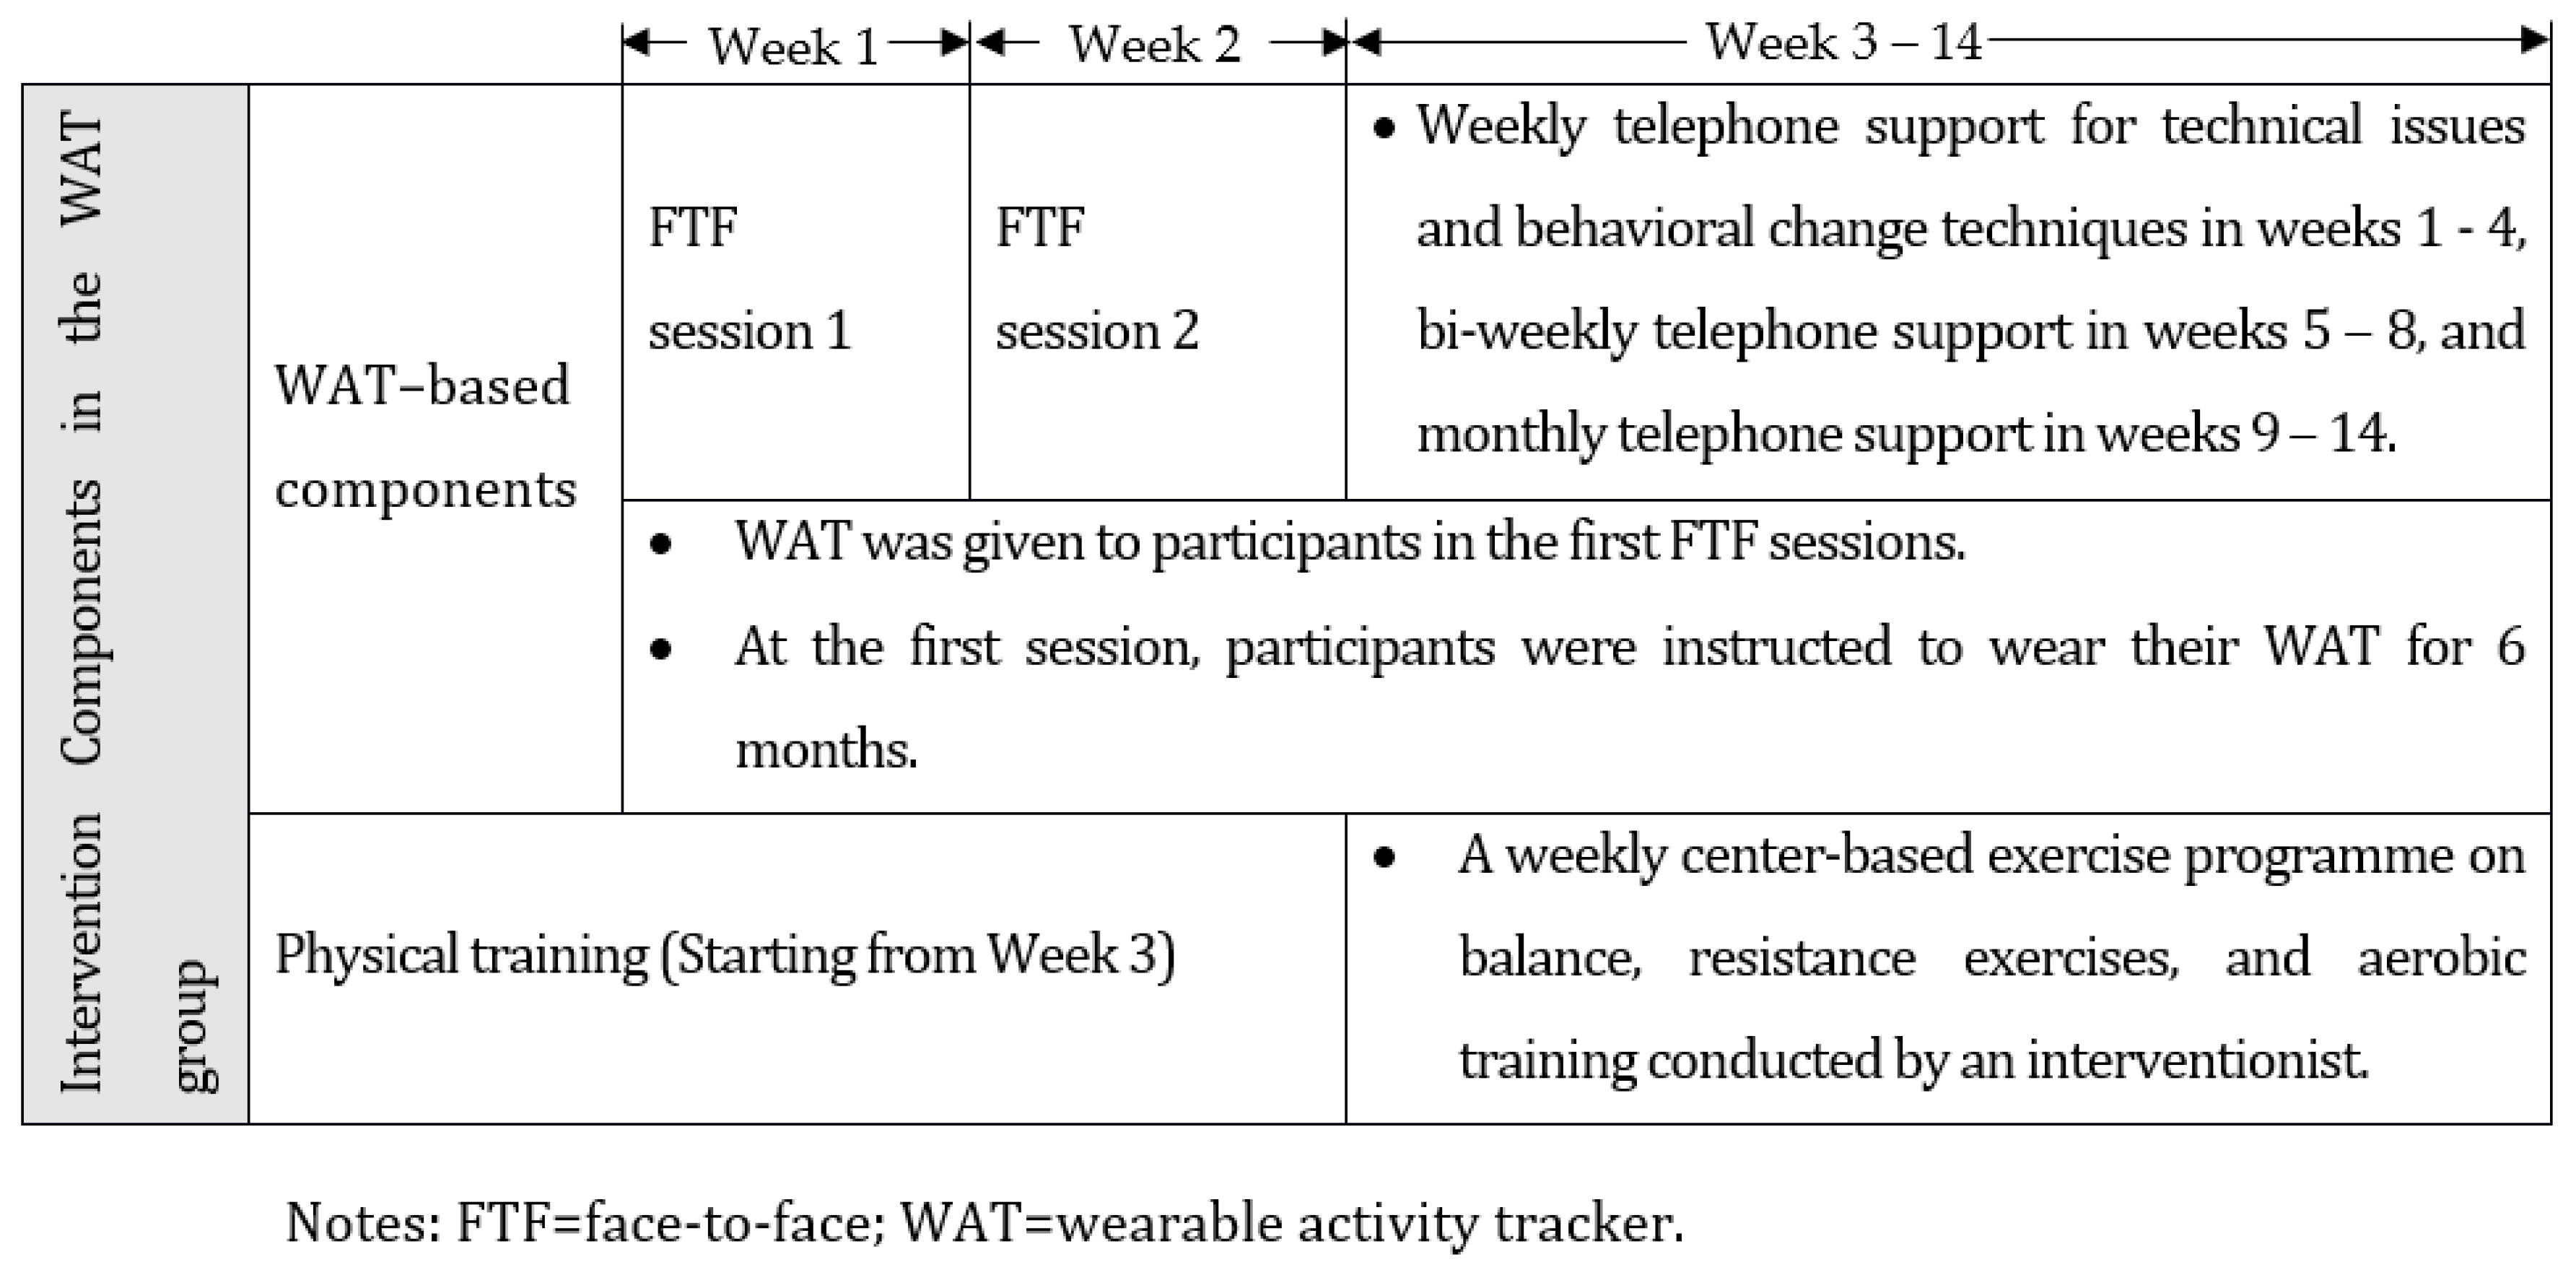
2.3. Interventions
2.3.1. WAT-Based Components in the Intervention Group
2.3.2. Physical Training in the Intervention Group
2.3.3. Physical Training in the Control Group
2.4. Outcomes
2.4.1. Feasibility of the Program
2.4.2. Acceptability of the Program
2.4.3. Effect Outcomes
2.5. Sample Size
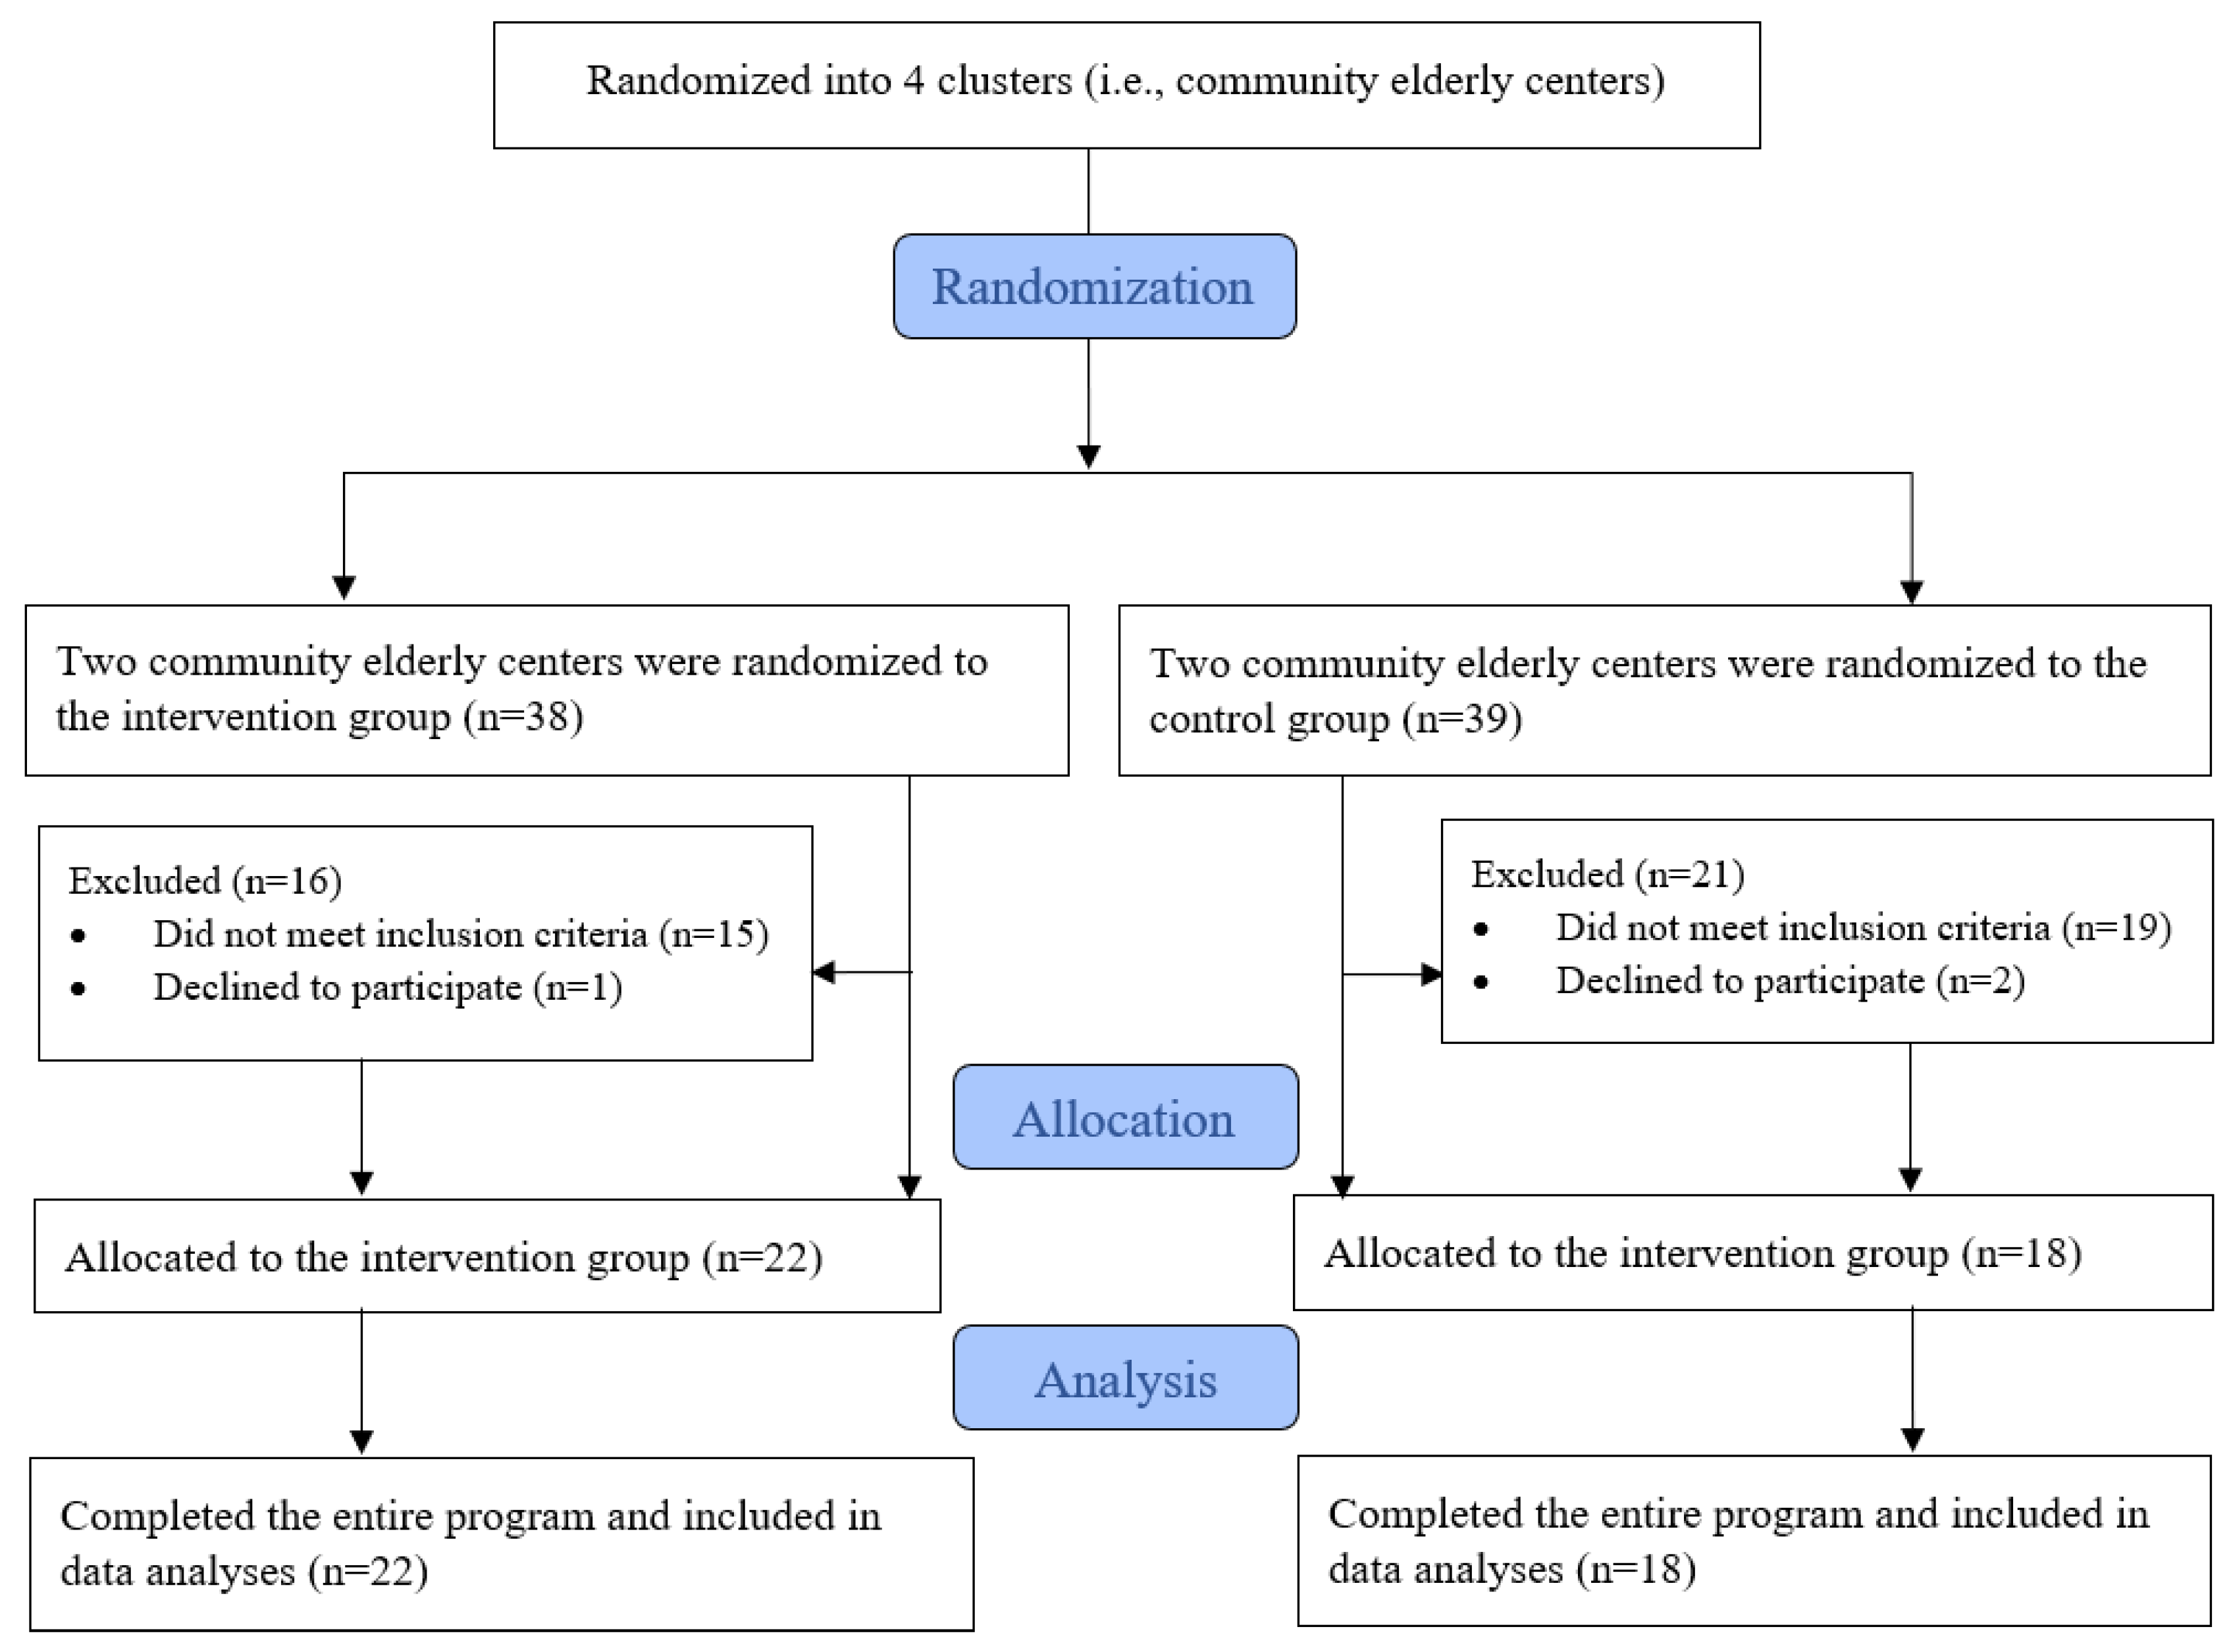
2.6. Randomization
2.7. Blinding
2.8. Statistical Methods
2.9. Ethical Issues
3. Results
3.1. Participant Flow
3.2. Baseline Data
3.3. Main Results
3.3.1. Objective #1: Feasibility of the WAT-Based Exercise Intervention
3.3.2. Objective #2: Acceptability of the WAT-Based Exercise Intervention
3.3.3. Objective #3: Preliminary Effects of the WAT-Based Exercise Intervention
4. Discussion
5. Conclusions
Author Contributions
Funding
Institutional Review Board Statement
Informed Consent Statement
Data Availability Statement
Conflicts of Interest
References
- Xue, Q.-L. The Frailty Syndrome: Definition and Natural History. Clin. Geriatr. Med. 2011, 27, 1. [Google Scholar] [CrossRef]
- Fried, L.P.; Tangen, C.M.; Walston, J.; Newman, A.B.; Hirsch, C.; Gottdiener, J.; Seeman, T.; Tracy, R.; Kop, W.J.; Burke, G.; et al. Frailty in Older Adults: Evidence for a Phenotype. J. Gerontol. Ser. A Biol. Sci. Med.Sci. 2001, 56, M146–M157. [Google Scholar] [CrossRef]
- Angulo, J.; El Assar, M.; Álvarez-Bustos, A.; Rodríguez-Mañas, L. Physical activity and exercise: Strategies to manage frailty. Redox Biol. 2020, 35, 101513. [Google Scholar] [CrossRef] [PubMed]
- Kwan, R.Y.; Lee, D.; Lee, P.H.; Tse, M.; Cheung, D.S.; Thiamwong, L.; Choi, K.-S. Effects of an mHealth Brisk Walking Intervention on Increasing Physical Activity in Older People With Cognitive Frailty: Pilot Randomized Controlled Trial. JMIR mHealth uHealth 2020, 8, e16596. [Google Scholar] [CrossRef] [PubMed]
- Mañas, A.; del Pozo-Cruz, B.; Guadalupe-Grau, A.; Marin-Puyalto, J.; Alfaro-Acha, A.; Rodríguez-Mañas, L.; Garcia-Garcia, F.J.; Ara, I. Reallocating Accelerometer-Assessed Sedentary Time to Light or Moderate- to Vigorous-Intensity Physical Activity Reduces Frailty Levels in Older Adults: An Isotemporal Substitution Approach in the TSHA Study. J. Am. Med. Dir. Assoc. 2018, 19, 185.e1–185.e6. [Google Scholar] [CrossRef] [PubMed]
- World Health Organization. (26 November 2020) Physical Activity. Available online: https://www.who.int/news-room/fact-sheets/detail/physical-activity (accessed on 23 September 2021).
- Bauman, A.E.; Petersen, C.B.; Blond, K.; Rangul, V.; Hardy, L.L. The descriptive epidemiology of sedentary behavior. In Sedentary Behavior Epidemiology; Springer: Cham, Switzerland, 2018; pp. 73–106. [Google Scholar]
- Li, X.; Liu, Q.; Wang, K.; Li, R.; Hou, Y.; Li, Z.; Lin, J. Prevalence and correlates of physical inactivity among elderly Chinese. Osteoarthr. Cartil. 2017, 25, S203. [Google Scholar] [CrossRef]
- Dent, E.; Lien, C.; Lim, W.S.; Wong, W.C.; Wong, C.H.; Ng, T.P.; Woo, J.; Dong, B.; de la Vega, S.; Poi, P.J.H.; et al. The Asia-Pacific Clinical Practice Guidelines for the Management of Frailty. J. Am. Med. Dir. Assoc. 2017, 18, 564–575. [Google Scholar] [CrossRef]
- Olander, E.K.; Fletcher, H.; Williams, S.; Atkinson, L.; Turner, A.; French, D.P. What are the most effective techniques in changing obese individuals’ physical activity self-efficacy and behavior: A systematic review and meta-analysis. Int. J. Behav. Nutr. Phys. Act. 2013, 10, 29. [Google Scholar] [CrossRef] [PubMed]
- Greaves, C.J.; Sheppard, K.E.; Abraham, C.; Hardeman, W.; Roden, M.; Evans, P.H.; Schwarz, P.; The IMAGE Study Group. Systematic review of reviews of intervention components associated with increased effectiveness in dietary and physical activity interventions. BMC Public Health 2011, 11, 11–12. [Google Scholar] [CrossRef] [PubMed]
- Sullivan, A.N.; Lachman, M.E. Behavior Change with Fitness Technology in Sedentary Adults: A Review of the Evidence for Increasing Physical Activity. Front. Public Health 2017, 4, 289. [Google Scholar] [CrossRef]
- Lyons, E.J.; Lewis, Z.H.; Mayrsohn, B.G.; Rowland, J.L. Behavior Change Techniques Implemented in Electronic Lifestyle Activity Monitors: A Systematic Content Analysis. J. Med. Internet Res. 2014, 16, e192. [Google Scholar] [CrossRef]
- Chase, J.-A.D. Interventions to increase physical activity among older adults: A meta-analysis. Gerontologist 2015, 55, 706–718. [Google Scholar] [CrossRef]
- Tully, M.A.; McBride, C.; Heron, L.; Hunter, R.F. The validation of Fitbit Zip™ physical activity monitor as a measure of free-living physical activity. BMC Res. Notes 2014, 7, 952. [Google Scholar] [CrossRef]
- Cadmus-Bertram, L.A.; Marcus, B.H.; Patterson, R.E.; Parker, B.A.; Morey, B.L. Randomized Trial of a Fitbit-Based Physical Activity Intervention for Women. Am. J. Prev. Med. 2015, 49, 414–418. [Google Scholar] [CrossRef]
- Higgins, J.P. Smartphone Applications for Patients’ Health and Fitness. Am. J. Med. 2016, 129, 11–19. [Google Scholar] [CrossRef] [PubMed]
- Lyons, E.; Lewis, Z. An activity monitor and mobile device intervention is feasible among older adults. Clin. Transl. Sci. 2014, 7, 254–255. [Google Scholar]
- Taylor, D. Physical activity is medicine for older adults. Postgrad. Med. J. 2014, 90, 26–32. [Google Scholar] [CrossRef] [PubMed]
- Hogan, M. Age Differences in Technophobia: An Irish Study. In Information Systems Development: Challenges in Practice, Theory and Education; Springer: Galway, Ireland, 2009; pp. 117–130. [Google Scholar] [CrossRef]
- Liu, J.Y.-W.; Kor, P.P.-K.; Chan, C.P.-Y.; Kwan, R.Y.-C.; Sze-Ki, D. The effectiveness of a wearable activity tracker (WAT)-based intervention to improve physical activity levels in sedentary older adults: A systematic review and meta-analysis. Arch. Gerontol. Geriatr. 2020, 91, 104211. [Google Scholar] [CrossRef] [PubMed]
- Campbell, M.K.; Piaggio, G.; Elbourne, D.R.; Altman, D.G. Consort 2010 statement: Extension to cluster randomised trials. BMJ 2012, 345, e5661. [Google Scholar] [CrossRef] [PubMed]
- Collins, J.E.; Yang, H.Y.; Trentadue, T.P.; Gong, Y.; Losina, E. Validation of the Fitbit Charge 2 compared to the ActiGraph GT3X+ in older adults with knee osteoarthritis in free-living conditions. PLoS ONE 2019, 14, e0211231. [Google Scholar] [CrossRef]
- Treacy, D.; Hassett, L.; Schurr, K.; Chagpar, S.; Paul, S.S.; Sherrington, C. Validity of Different Activity Monitors to Count Steps in an Inpatient Rehabilitation Setting. Phys. Ther. 2017, 97, 581–588. [Google Scholar] [CrossRef]
- Maijers, M.; Verschuren, O.; Stolwijk-Swüste, J.; Van Koppenhagen, C.; De Groot, S.; Post, M. Is Fitbit Charge 2 a feasible instrument to monitor daily physical activity and handbike training in persons with spinal cord injury? A pilot study. Spinal Cord Ser. Cases 2018, 4, 84. [Google Scholar] [CrossRef] [PubMed]
- Paul, S.S.; Tiedemann, A.; Hassett, L.M.; Ramsay, E.; Kirkham, C.; Chagpar, S.; Sherrington, C. Validity of the Fitbit activity tracker for measuring steps in community-dwelling older adults. BMJ Open Sport Exerc. Med. 2015, 1, e000013. [Google Scholar] [CrossRef] [PubMed]
- Jo, E.; Lewis, K.; Directo, D.; Kim, M.J.; Dolezal, B.A. Validation of Biofeedback Wearables for Photoplethysmographic Heart Rate Tracking. J. Sports Sci. Med. 2016, 15, 540. [Google Scholar] [PubMed]
- Wattanapisit, A.; Thanamee, S. Evidence behind 10,000 steps walking. J. Health Res. 2017, 31, 241–248. [Google Scholar]
- Deng, Z.; Mo, X.; Liu, S. Comparison of the middle-aged and older users’ adoption of mobile health services in China. Int. J. Med. Inform. 2014, 83, 210–224. [Google Scholar] [CrossRef] [PubMed]
- Jen, W.-Y.; Hung, M.-C. An empirical study of adopting mobile healthcare service: The family’s perspective on the healthcare needs of their elderly members. Telemed. e-Health 2010, 16, 41–48. [Google Scholar] [CrossRef]
- Mercer, K.; Giangregorio, L.; Schneider, E.; Chilana, P.; Li, M.; Grindrod, K. Acceptance of Commercially Available Wearable Activity Trackers Among Adults Aged Over 50 and With Chronic Illness: A Mixed-Methods Evaluation. JMIR mHealth uHealth 2016, 4, e4225. [Google Scholar] [CrossRef]
- French, D.P.; Olander, E.K.; Chisholm, A.; Mc Sharry, J. Which behavior change techniques are most effective at increasing older adults’ self-efficacy and physical activity behavior? A systematic review. Ann. Behav. Med. 2014, 48, 225–234. [Google Scholar] [CrossRef]
- Nelson, M.E.; Rejeski, W.J.; Blair, S.N.; Duncan, P.W.; Judge, J.O.; King, A.C.; Macera, C.A.; Castaneda-Sceppa, C. Physical activity and public health in older adults: Recommendation from the American College of Sports Medicine and the American Heart Association. Circulation 2007, 116, 1094. [Google Scholar] [CrossRef]
- Liu, J.Y.; Lai, C.K.; Siu, P.M.; Kwong, E.; Tse, M.M. An individualized exercise programme with and without behavioral change enhancement strategies for managing fatigue among frail older people: A quasi-experimental pilot study. Clin. Rehabil. 2017, 31, 521–531. [Google Scholar] [CrossRef]
- Liu, J.Y.; Kor, P.P.; Lee, P.L.; Chien, W.T.; Siu, P.M.; Hill, K.D. Effects of an Individualized Exercise Program Plus Behavioral Change Enhancement Strategies for Managing Fatigue in Older People Who Are Frail: Protocol for a Cluster Randomized Controlled Trial. Phys. Ther. 2019, 99, 1616–1627. [Google Scholar] [CrossRef] [PubMed]
- Kwan, R.Y.C.; Liu, J.Y.W.; Lee, D.; Tse, C.Y.A.; Lee, P.H. A validation study of the use of smartphones and wrist-worn ActiGraphs to measure physical activity at different levels of intensity and step rates in older people. Gait Posture 2020, 82, 306–312. [Google Scholar] [CrossRef] [PubMed]
- Rikli, R.E.; Jones, C.J. Development and Validation of a Functional Fitness Test for Community-Residing Older Adults. J. Aging Phys. Act. 1999, 7, 129–161. [Google Scholar] [CrossRef]
- Podsiadlo, D.; Richardson, S. The timed “Up & Go”: A test of basic functional mobility for frail elderly persons. J. Am. Geriatr. Soc. 1991, 39, 142–148. [Google Scholar]
- Butland, R.; Pang, J.; Gross, E.; Woodcock, A.; Geddes, D. Two-, six-, and 12-minute walking tests in respiratory disease. BMJ 1982, 284, 1607–1608. [Google Scholar] [CrossRef] [PubMed]
- Deandrea, S.; Lucenteforte, E.; Bravi, F.; Foschi, R.; La Vecchia, C.; Negri, E. Risk factors for falls in community-dwelling older people: “A systematic review and meta-analysis”. Epidemiology 2010, 21, 658–668. [Google Scholar] [CrossRef]
- Bohannon, R.W.; Wang, Y.-C.; Gershon, R.C. Two-Minute Walk Test Performance by Adults 18 to 85 Years: Normative Values, Reliability, and Responsiveness. Arch. Phys. Med. Rehabil. 2015, 96, 472–477. [Google Scholar] [CrossRef] [PubMed]
- Scalzitti, D.A.; Harwood, K.J.; Maring, J.R.; Leach, S.J.; Ruckert, E.A.; Costello, E. Validation of the 2-minute walk test with the 6-minute walk test and other functional measures in persons with multiple sclerosis. Int. J. MS Care 2018, 20, 158–163. [Google Scholar] [CrossRef] [PubMed]
- Lee, L.-L.; Arthur, A.; Avis, M. Using self-efficacy theory to develop interventions that help older people overcome psychological barriers to physical activity: A discussion paper. Int. J. Nurs. Stud. 2008, 45, 1690–1699. [Google Scholar] [CrossRef]
- Resnick, B.; Jenkins, L.S. Testing the Reliability and Validity of the Self-Efficacy for Exercise Scale. Nurs. Res. 2000, 49, 154–159. [Google Scholar] [CrossRef]
- Liu, J.D.; Chung, P.-K.; Zhang, C.-Q.; Si, G. Chinese-translated Behavioral Regulation in Exercise Questionnaire-2: Evidence from university students in the Mainland and Hong Kong of China. J. Sport Health Sci. 2015, 4, 228–234. [Google Scholar] [CrossRef]
- Thabane, L.; Ma, J.; Chu, R.; Cheng, J.; Ismaila, A.; Rios, L.P.; Robson, R.; Thabane, M.; Giangregorio, L.; Goldsmith, C.H. A tutorial on pilot studies: The what, why and how. BMC Med. Res. Methodol. 2010, 10, 1. [Google Scholar] [CrossRef]
- Teare, M.D.; Dimairo, M.; Shephard, N.; Hayman, A.; Whitehead, A.; Walters, S.J. Sample size requirements to estimate key design parameters from external pilot randomised controlled trials: A simulation study. Trials 2014, 15, 264. [Google Scholar] [CrossRef] [PubMed]
- Hertzog, M.A. Considerations in determining sample size for pilot studies. Res. Nurs. Health 2008, 31, 180–191. [Google Scholar] [CrossRef] [PubMed]
- Dohrn, M.; Gardiner, P.A.; Winkler, E.; Welmer, A.-K. Device-measured sedentary behavior and physical activity in older adults differ by demographic and health-related factors. Eur. Rev. Aging Phys. Act. 2020, 17, 8. [Google Scholar] [CrossRef]
- Shaw, I.G.R.; Holland, S. Doing Qualitative Research in Social Work; Sage: London, UK, 2014. [Google Scholar]
- Ashe, M.C.; Winters, M.; Hoppmann, C.A.; Dawes, M.G.; Gardiner, P.A.; Giangregorio, L.M.; Madden, K.M.; McAllister, M.M.; Wong, G.; Puyat, J.H.; et al. “Not just another walking program”: Everyday Activity Supports You (EASY) model—A randomized pilot study for a parallel randomized controlled trial. Pilot Feasibility Stud. 2015, 1, 4. [Google Scholar] [CrossRef]
- Lyons, E.J.; Swartz, M.C.; Lewis, Z.H.; Martinez, E.; Jennings, K. Feasibility and Acceptability of a Wearable Technology Physical Activity Intervention With Telephone Counseling for Mid-Aged and Older Adults: A Randomized Controlled Pilot Trial. JMIR mHealth uHealth. 2017, 5, e28. [Google Scholar] [CrossRef] [PubMed]
- Bickmore, T.W.; Silliman, R.A.; Nelson, K.; Cheng, D.M.; Winter, M.; Henault, L.; Paasche-Orlow, M. A Randomized Controlled Trial of an Automated Exercise Coach for Older Adults. J. Am. Geriatr. Soc. 2013, 61, 1676–1683. [Google Scholar] [CrossRef]
- McMahon, S.K.; Lewis, B.; Oakes, M.; Guan, W.; Wyman, J.F.; Rothman, A.J. Older Adults’ Experiences Using a Commercially Available Monitor to Self-Track Their Physical Activity. JMIR mHealth uHealth 2016, 4, e35. [Google Scholar] [CrossRef]
- Ekelund, U.; Ward, H.A.; Norat, T.; Luan, J.; May, A.M.; Weiderpass, E.; Sharp, S.J.; Overvad, K.; Østergaard, J.N.; Tjønneland, A.; et al. Physical activity and all-cause mortality across levels of overall and abdominal adiposity in European men and women: The European Prospective Investigation into Cancer and Nutrition Study (EPIC). Am. J. Clin. Nutr. 2015, 101, 613–621. [Google Scholar] [CrossRef] [PubMed]
- Cress, M.; Buchner, D.; Prohaska, T.; Rimmer, J.; Brown, M.; Macera, C.; DePietro, L.; Chodzko-Zajko, W. Best practices for physical activity programs and behavior counseling in older adult populations. Eur. Rev. Aging Phys. Act. 2006, 3, 34–42. [Google Scholar] [CrossRef][Green Version]


| Total | Intervention (n = 22) | Control (n = 18) | p | |||||
|---|---|---|---|---|---|---|---|---|
| n | (%) | n | (%) | n | (%) | |||
| Age [mean ± SD, median] | [75.9 ± 6.74, 73.5] | [72.1 ± 3.7, 71.5] | [80.4 ± 6.83, 80] | <0.001 | ||||
| Gender | 0.130 | |||||||
| Male | 6 | (15.0) | 5 | (22.7) | 1 | (5.6) | ||
| Female | 34 | (85.0) | 17 | (77.3) | 17 | (94.4) | ||
| Marital status | 0.001 | |||||||
| Not married | 5 | (12.5) | 5 | (22.7) | 0 | (0.0) | ||
| Married | 17 | (42.5) | 12 | (54.5) | 5 | (27.8) | ||
| Widowed | 16 | (40.0) | 3 | (13.6) | 13 | (72.2) | ||
| Divorced/Separated | 2 | (5.0) | 2 | (9.1) | 0 | (0.0) | ||
| Education | <0.001 | |||||||
| No formal education | 8 | (20.0) | 1 | (4.5) | 7 | (38.9) | ||
| Primary level | 11 | (27.5) | 2 | (9.1) | 9 | (50.0) | ||
| Secondary level | 16 | (40.0) | 14 | (63.6) | 2 | (11.1) | ||
| Degree level | 3 | (7.5) | 3 | (13.6) | 0 | (0.0) | ||
| Others | 2 | (5.0) | 2 | (9.1) | 0 | (0.0) | ||
| Housemate | 0.575 | |||||||
| Live alone | 16 | (40.0) | 9 | (40.9) | 7 | (38.9) | ||
| Live with family | 19 | (47.5) | 11 | (50.0) | 8 | (44.4) | ||
| Live with others | 5 | (12.5) | 2 | (9.1) | 3 | (16.7) | ||
| Hospitalization in past 12 months | 0.046 | |||||||
| No | 37 | (92.5) | 22 | (100.0) | 15 | (83.3) | ||
| Yes | 3 | (7.5) | 0 | (0.0) | 3 | (16.7) | ||
| Number of medications taken in past 12 months | 0.056 | |||||||
| 0 | 3 | (7.7) | 3 | (14.3) | 0 | (0.0) | ||
| 1 | 10 | (25.6) | 6 | (28.6) | 4 | (22.2) | ||
| 2 | 6 | (15.4) | 4 | (19.0) | 2 | (11.1) | ||
| 3 | 11 | (28.2) | 7 | (33.3) | 4 | (22.2) | ||
| 4 | 6 | (15.4) | 0 | (0.0) | 6 | (33.3) | ||
| 5 and more | 3 | (7.7) | 1 | (4.8) | 2 | (11.1) | ||
| Emergency service in past 12 months | 0.271 | |||||||
| No | 30 | (75.0) | 18 | (81.8) | 12 | (66.7) | ||
| Yes | 10 | (25.0) | 4 | (18.2) | 6 | (33.3) | ||
| Medical follow-up in past 12 months | 0.810 | |||||||
| No | 34 | (85.0) | 3 | (13.6) | 2 | (11.1) | ||
| Yes | 6 | (15.0) | 19 | (86.4) | 16 | (88.9) | ||
| Private hospitals follow-up in past 12 months | 0.789 | |||||||
| No | 34 | (85.0) | 19 | (86.4) | 15 | (83.3) | ||
| Yes | 6 | (15.0) | 3 | (13.6) | 3 | (16.7) | ||
| Walking aids | 0.002 | |||||||
| None | 32 | (80.0) | 22 | (100.0) | 10 | (55.6) | ||
| Walking stick | 2 | (5.0) | 0 | (0.0) | 2 | (11.1) | ||
| Crutches | 6 | (15.0) | 0 | (0.0) | 6 | (33.3) | ||
| Outcome Measure [Mean ± SD, Median] | Total | Intervention (n = 22) | Control (n = 18) | p |
|---|---|---|---|---|
| TUG (second) | 12.4 ± 6.27, 10.39 | 9.8 ± 2.47, 8.98 | 15.6 ± 7.92, 13.2 | 0.002 |
| 30-s Chair Stand Test (second) | 9.6 ± 4.79, 10 | 11.4 ± 3.99, 11 | 7.5 ± 4.93, 8.5 | 0.023 |
| Two-Minute Walk Test (meter) | 89.6 ± 26.47, 86.25 | 99.8 ± 22.82, 91.5 | 77.1 ± 25.75, 78 | 0.011 |
| FFI | 2 ± 0.81, 2 | 1.5 ± 0.67, 1 | 2.4 ± 0.7, 2 | <0.001 |
| CSEE | 37.2 ± 17.08, 39.5 | 43.6 ± 15.73, 45.5 | 29.4 ± 15.72, 25.5 | 0.014 |
| C-BREQ-2 Amotivation (Sum of Q5, 9, 12, 19) | 1.21 ± 2.4, 0 | 0.92 ± 1.86, 0 | 1.56 ± 2.94, 0 | 0.854 |
| C-BREQ-2 External Regulation (Sum of Q1, 6, 11, 16) | 2.52 ± 2.98, 2 | 2.73 ± 2.96, 2 | 2.28 ± 3.06, 1.5 | 0.641 |
| C-BREQ-2 Introjected Regulation (Sum of Q2, 7, 13) | 3.12 ± 3.04, 2.5 | 3.78 ± 2.89, 3.5 | 2.33 ± 3.10, 0 | 0.138 |
| C-BREQ-2 Identified Regulation (Sum of Q3, 8, 14, 17) | 11.74 ± 2.43, 12 | 11.29 ± 2.73, 11.5 | 12.30 ± 1.92, 12 | 0.195 |
| C-BREQ-2 Intrinsic Regulation (Sum of Q4, 10, 15, 18) | 10.8 ± 7.24, 12 | 10.82 ± 4.56, 11 | 10.78 ± 3.95, 12 | 0.977 |
| ActiGraph | ||||
| MVPA (mins per valid day per week) | 185.9 ± 103.73, 166.48 | 218.9 ± 112.24, 216.5 | 145.6 ± 77.44, 142.64 | 0.039 |
| MVPA (mins per valid day per week, only include >10 min) | 37.5 ± 38.14, 22.85 | 47.8 ± 44.68, 34.64 | 25 ± 23.85, 22.1 | 0.157 |
| Maximum duration of brisk walking # over the week (mins) | 7.7 ± 7.92, 5 | 9.2 ± 8.8, 7.5 | 5.8 ± 6.42, 3.5 | 0.189 |
| Average duration spent in brisk walking # per week (mins) | 2.7 ± 3.46, 1.5 | 3.3 ± 3.88, 1.93 | 1.8 ± 2.77, 0.71 | 0.140 |
| Peak cadence (steps/min) per week | 113.8 ± 18.19, 116 | 116.3 ± 19.4, 118 | 110.8 ± 16.64, 111.5 | 0.301 |
| Average step count per week (steps) | 11,691.8 ± 3965.77, 11,335.87 | 12,787.3 ± 4261.92, 12,139.29 | 10,352.9 ± 3192.38, 10,266.29 | 0.073 |
| Average duration of true sleep per week (mins) | 402.9 ± 77.4, 402.38 | 385.7 ± 79.39, 396.6 | 423.8 ± 71.51, 417.79 | 0.174 |
| Average duration of total sleep per week (mins) | 482 ± 80.79, 478.54 | 462.3 ± 81.17, 451.57 | 506.2 ± 75.59, 499.79 | 0.100 |
| Average number of days with 7 h of sleep per week | 2.9 ± 2.03, 3 | 2.6 ± 2.06, 2 | 3.3 ± 1.99, 3 | 0.310 |
| B | SE | 95% CI | p | |
|---|---|---|---|---|
| Count of average daily steps over the week (steps) | 38.452 | 22.119 | (4.900, 81.805) | 0.082 |
| Average daily minutes of sedentary activities over the week (mins) | 0.961 | 2.106 | (−3.166, 5.088) | 0.648 |
| Average daily minutes of lightly active activities over the week b (mins) | −2.311 | 1.632 | (−5.511, 0.888) | 0.157 |
| Average daily minutes of fairly active activity over the week b (mins) | 0.007 | 0.008 | (−0.008, 0.022) | 0.345 |
| Average daily minutes of very active activity over the week b (mins) | 0.013 | 0.007 | (−0.001, 0.026) | 0.062 |
| Average daily number of stairs climbed over the week b | 0.027 | 0.013 | (0.001, 0.052) | 0.039 |
| Q | Questions | Every Day | 5 to 4 Times a Week | 1 to 3 Times a Week | Rarely | ||||||||
|---|---|---|---|---|---|---|---|---|---|---|---|---|---|
| n | % | n | % | n | % | n | % | ||||||
| Q1 | How often do you use the WAT? | 20 | 90.9% | 2 | 9.1% | 0 | 0% | 0 | 0% | ||||
| Q2 | How often do you use the WAT-associated Mobile App (App)? | 13 | 59.1% | 1 | 2.5% | 5 | 12.5% | 3 | 7.5% | ||||
| Q3 | The WAT is easy to use and clear to understand. | Strongly Disagree | Disagree | Somewhat Disagree | Somewhat Agree | Agree | Strongly Agree | ||||||
| 0 | 0.0% | 2 | 9.1% | 0 | 0.0% | 0 | 0.0% | 16 | 72.7% | 4 | 18.2% | ||
| Q4 | The App is easy to use and clear to understand. | 0 | 0.0% | 2 | 9.5% | 1 | 4.8% | 2 | 9.1% | 15 | 68.2% | 2 | 9.1% |
| Q5 | I will continue to use the WAT even after the program. | 0 | 0.0% | 1 | 4.5% | 0 | 0% | 2 | 9.1% | 15 | 68.2% | 4 | 18.2% |
| Q6 | Using worksheets during the face-to-face sessions to formulate a personal exercise plan can enhance my self-efficacy in exercising. | 0 | 0.0% | 0 | 0.0% | 1 | 4.5% | 5 | 22.7% | 13 | 59.1% | 3 | 13.6% |
| Q7 | Using the WAT and the App to formulate personal exercise goals can enhance my self-efficacy in exercising. | 0 | 0.0% | 0 | 0% | 0 | 0% | 3 | 13.6% | 16 | 72.7% | 3 | 13.6% |
| Q8 | Using worksheets during the face-to-face sessions to formulate plans to overcome barriers can enhance my self-efficacy in exercising. | 0 | 0.0% | 0 | 0.0% | 1 | 4.5% | 6 | 27.3% | 13 | 59.1% | 2 | 9.1% |
| Q9 | Setting up personal exercise goals during the face-to-face sessions can enhance my self-efficacy in exercising. | 0 | 0.0% | 0 | 0% | 0 | 0% | 6 | 27.3% | 14 | 63.6% | 2 | 9.1% |
| Q10 | Using the WAT and the App to review my exercise progress (e.g., daily steps, floors climbed, etc.) helps me to maintain habitual physical activity levels. | 0 | 0.0% | 0 | 0% | 0 | 0% | 2 | 9.1% | 18 | 81.8% | 2 | 9.1% |
| Q11 | Using the WAT and the App to revise my exercise plan (e.g., daily steps, floors climbed, etc.) helps me to maintain habitual physical activity levels. | 0 | 0.0% | 0 | 0.0% | 0 | 0% | 5 | 22.7% | 14 | 63.6% | 3 | 13.6% |
| Q12 | The telephone follow-up by the instructor to review my exercise progress helps me to maintain habitual physical activity levels. | 0 | 0.0% | 0 | 0.0% | 0 | 0.0% | 1 | 4.5% | 18 | 81.8% | 3 | 13.6% |
| Q13 | Using the WAT and the App to review the level of achievement of my pre-set exercise goals can enhance my self-efficacy in exercising. | 0 | 0.0% | 0 | 0.0% | 0 | 0% | 4 | 18.2% | 14 | 63.6% | 4 | 18.2% |
| Q14 | The instructor’s positive feedback and suggestions motivate me to engage in regular exercise. | 0 | 0.0% | 0 | 0.0% | 0 | 0% | 2 | 9.1% | 16 | 72.7% | 4 | 18.2% |
| Q15 | Using the weekly exercise record booklet to review my exercise progress helps me to maintain habitual physical activity levels. | 0 | 0.0% | 0 | 0.0% | 0 | 0.0% | 3 | 13.6% | 16 | 72.7% | 3 | 13.6% |
| Q16 | Self-monitoring of my exercise performance from the WAT and the App can enhance my self-efficacy in exercising. | 0 | 0.0% | 0 | 0.0% | 0 | 0.0% | 1 | 4.5% | 17 | 77.3% | 4 | 18.2% |
| Q17 | Using the WAT and the App to observe the changes in my exercise levels helps me to maintain habitual physical activity levels. | 0 | 0.0% | 0 | 0.0% | 0 | 0.0% | 3 | 13.6% | 17 | 77.3% | 2 | 9.1% |
| Q18 | The real-time exercise measurements (e.g., heart rate during exercise) provided by the WAT helps to enhance my self-efficacy in exercising. | 0 | 0.0% | 0 | 0.0% | 0 | 0.0% | 3 | 13.6% | 15 | 68.2% | 4 | 18.2% |
| Q19 | Using the social community functions of the App to share exercise achievements with each other, comment on others’ posts, etc. can enhance my self-efficacy in exercising. | 0 | 0.0% | 0 | 0.0% | 1 | 4.5% | 6 | 27.3% | 13 | 59.1% | 2 | 9.1% |
| Q20 | The positive feedback and encouragement from peers during the face-to-face sessions can enhance my self-efficacy in exercising. | 0 | 0.0% | 0 | 0% | 0 | 0% | 4 | 18.2% | 16 | 72.7% | 2 | 9.1% |
| Q21 | Getting guidance and demonstrations from the instructor can maintain my habitual physical activity levels. | 0 | 0.0% | 0 | 0.0% | 0 | 0.0% | 1 | 4.5% | 14 | 63.6% | 7 | 31.8% |
| Q22 | The “reminder to move” function of the WAT can enhance my self-efficacy in exercising. | 0 | 0.0% | 0 | 0.0% | 0 | 0.0% | 6 | 27.3% | 12 | 54.5% | 4 | 18.2% |
| Q23 | Obtaining appreciation/encouragement for my exercise performance from the support group via the App can enhance my self-efficacy in exercising. | 0 | 0.0% | 1 | 4.5% | 0 | 0.0% | 3 | 13.6% | 15 | 68.2% | 3 | 13.6% |
| Q24 | The badge rewards and celebration vibration reminder from the WAT and the App can enhance my self-efficacy in exercising. | 0 | 0.0% | 1 | 4.5% | 0 | 0.0% | 2 | 9.1% | 12 | 54.5% | 7 | 31.8% |
| Q25 | I would recommend that other older people join this program. | 0 | 0.0% | 0 | 0.0% | 0 | 0.0% | 2 | 9.1% | 15 | 71.4% | 4 | 18.2% |
| Mean (SE) | Tests of GEE Model Effects a | Effect Size | Post Hoc Test (p) | |||||||||||||||
|---|---|---|---|---|---|---|---|---|---|---|---|---|---|---|---|---|---|---|
| Outcome Measures | Baseline (T0) | Post-Intervention (T1) | Time Effect | Group Effect | Group-by-Time Effect | WITHIN-GROUP | Between Groups | |||||||||||
| Wald χ2 | p | Wald χ2 | p | Wald χ2 | p | d | T0 vs. T1 | T0 | T2 | |||||||||
| TUG b (seconds) | 10.114 | 0.006 | 8.554 | 0.003 | 8.879 | 0.012 | 0.768 | 0.027 | ** | 0.002 | ||||||||
| Intervention | 9.76 | (0.53) | 7.98 | (0.37) | 0.006 | |||||||||||||
| Control | 15.62 | (1.87) | 14.55 | (2.27) | 0.484 | |||||||||||||
| 30-s Chair Stand Test (seconds) | 11.566 | 0.003 | 4.687 | 0.030 | 12.157 | 0.002 | 0.687 | 0.536 | 0.011 | |||||||||
| Intervention | 11.36 | (0.85) | 14.14 | (0.81) | <0.001 | |||||||||||||
| Control | 7.50 | (1.16) | 8.50 | (1.49) | 0.827 | |||||||||||||
| Two-Minute Walk Test (meters) | 11.834 | 0.003 | 7.810 | 0.005 | 14.898 | 0.001 | 1.242 | 0.156 | <0.001 | |||||||||
| Intervention | 99.84 | (4.86) | 116.23 | (3.30) | <0.001 | |||||||||||||
| Control | 77.11 | (6.07) | 80.57 | (5.71) | 0.760 | |||||||||||||
| FFI | 6.713 | 0.035 | 11.458 | 0.001 | 6.562 | 0.038 | 0.464 | 0.048 | * | 0.007 | ||||||||
| Intervention | 1.55 | (0.14) | 1.36 | (0.12) | 0.234 | |||||||||||||
| Control | 2.44 | (0.17) | 2.36 | (0.20) | 0.711 | |||||||||||||
| CSEE | 5.422 | 0.066 | 8.488 | 0.004 | 1.575 | 0.455 | 0.284 | 0.037 | * | 0.006 | ||||||||
| Intervention | 43.59 | (3.35) | 42.32 | (2.45) | 0.696 | |||||||||||||
| Control | 29.44 | (3.70) | 23.35 | (4.66) | 0.090 | |||||||||||||
| BREQ-2 Amotivation | 13.380 | 0.001 | 0.047 | 0.828 | 18.839 | <0.001 | 1.369 | 0.343 | 0.345 | |||||||||
| Intervention | 0.92 | (0.40) | 1.82 | (0.68) | <0.001 | |||||||||||||
| Control | 1.56 | (0.68) | 1.94 | (0.60) | 0.310 | |||||||||||||
| BREQ-2 External Regulation | 15.614 | <0.001 | 2.930 | 0.087 | 3.133 | 0.209 | 0.141 | 0.355 | 0.232 | |||||||||
| Intervention | 2.73 | (0.64) | 4.64 | (0.76) | 0.106 | |||||||||||||
| Control | 2.28 | (0.72) | 2.89 | (0.92) | 0.154 | |||||||||||||
| BREQ-2 Introjected Regulation | 2.447 | 0.294 | 4.827 | 0.028 | 1.268 | 0.530 | 0.064 | 0.062 | 0.108 | |||||||||
| Intervention | 3.77 | (0.63) | 4.64 | (0.6) | 0.893 | |||||||||||||
| Control | 2.33 | (0.72) | 3.07 | (0.78) | 0.807 | |||||||||||||
| BREQ-2 Identified Regulation | 6.556 | 0.038 | 0.228 | 0.633 | 9.564 | 0.008 | 0.242 | 0.385 | 0.885 | |||||||||
| Intervention | 11.29 | (0.60) | 11.39 | (0.52) | 0.375 | |||||||||||||
| Control | 12.3 | (0.44) | 10.00 | (0.60) | 0.034 | |||||||||||||
| BREQ-2 Intrinsic Regulation | 4.182 | 0.124 | 0.571 | 0.450 | 2.819 | 0.244 | 0.142 | 0.593 | 0.650 | |||||||||
| Intervention | 10.8 | (0.96) | 12.18 | (0.56) | 0.570 | |||||||||||||
| Control | 10.78 | (0.92) | 11.22 | (0.76) | 0.108 | |||||||||||||
| MVPA (mins per valid day per week) | 0.422 | 0.810 | 2.233 | 0.135 | 4.310 | 0.116 | 0.373 | 0.292 | 0.010 | |||||||||
| Intervention | 218.87 | (23.93) | 226.53 | (24.56) | 0.570 | |||||||||||||
| Control | 145.62 | (18.25) | 126.68 | (17.49) | 0.041 | * | ||||||||||||
| MVPA (mins per valid day per week, only including > 10 min) | 0.192 | 0.909 | 3.110 | 0.078 | 1.119 | 0.571 | 0.156 | 0.251 | 0.011 | |||||||||
| Intervention | 47.76 | (9.53) | 53.00 | (9.66) | 0.520 | |||||||||||||
| Control | 24.96 | (5.62) | 22.36 | (5.38) | 0.421 | |||||||||||||
| Maximum duration of brisk walking # over the week (mins) | 8.256 | 0.016 | 4.278 | 0.039 | * | 2.904 | 0.234 | 0.559 | 0.158 | 0.025 | ||||||||
| Intervention | 9.23 | (1.88) | 9.00 | (2.71) | 0.925 | |||||||||||||
| Control | 5.78 | (1.51) | 3.17 | (1.58) | 0.073 | |||||||||||||
| Average duration of brisk walking # per week b (mins) | 6.720 | 0.035 | 5.074 | 0.024 | * | 1.346 | 0.510 | 0.121 | 0.091 | 0.019 | ||||||||
| Intervention | 3.31 | (0.83) | 3.75 | (1.23) | 0.687 | |||||||||||||
| Control | 1.84 | (0.65) | 1.30 | (0.78) | 0.421 | |||||||||||||
| Peak cadence per week (steps/min) | 7.270 | 0.026 | 2.137 | 0.144 | 1.409 | 0.494 | 0.248 | 0.579 | 0.072 | |||||||||
| Intervention | 116.27 | (4.14) | 112.05 | (3.73) | 0.428 | |||||||||||||
| Control | 110.83 | (3.92) | 104.42 | (4.97) | 0.014 | |||||||||||||
| Average step count per week (steps) | 0.611 | 0.737 | 2.210 | 0.137 | 2.043 | 0.360 | 0.337 | 0.605 | 0.040 | |||||||||
| Intervention | 12,787.32 | (908.64) | 13,683.30 | (845.53) | 0.221 | |||||||||||||
| Control | 10,352.90 | (752.45) | 10,264.35 | (642.43) | 0.494 | |||||||||||||
| Outcome Measures [Mean (SE)] | Baseline (T0) | Post-Intervention (T1) | Follow-Up | Tests of Time Effects | Effect Size (d) | Post Hoc Test (p) | |||||||||||
|---|---|---|---|---|---|---|---|---|---|---|---|---|---|---|---|---|---|
| (T2) | (T3) | Wald χ2 | p | T0 vs. T1 | T0 vs. T2 | T0 vs. T3 | T1 vs. T2 | T1 vs. T3 | T2 vs. T3 | ||||||||
| TUG b | 9.76 | (0.53) | 7.98 | (0.37) | 7.62 | (0.30) | 8.23 | (0.45) | 30.538 | <0.001 | 0.673 | <0.001 | <0.001 | 0.003 | 0.128 | 0.283 | 0.014 |
| 30-s Chair Stand Test | 11.36 | (0.85) | 14.14 | (0.81) | 13.40 | (0.83) | 15.22 | (1.35) | 29.995 | <0.001 | 0.710 | <0.001 | 0.001 | 0.001 | 0.431 | 0.267 | 0.060 |
| Two-Minute Walk Test | 99.84 | (4.86) | 116.23 | (3.30) | 115.73 | (5.14) | 112.00 | (5.87) | 24.868 | <0.001 | 0.459 | <0.001 | 0.001 | 0.039 | 0.828 | 0.302 | 0.071 |
| FFI | 1.55 | (0.14) | 1.36 | (0.12) | 1.20 | (0.14) | 1.22 | (0.15) | 18.579 | 0.001 | 0.557 | 0.234 | 0.055 | 0.018 | 0.344 | 0.289 | 0.996 |
| CSEE | 43.59 | (3.35) | 42.32 | (2.45) | 46.15 | (3.54) | 46.89 | (3.19) | 5.038 | 0.283 | 0.228 | 0.696 | 0.353 | 0.392 | 0.234 | 0.177 | 0.986 |
| BREQ-2 | |||||||||||||||||
| Amotivation | 0.92 | (0.40) | 1.82 | (0.68) | 3.50 | (0.84) | 3.05 | (0.60) | 25.395 | <0.001 | 0.807 | <0.001 | 0.002 | <0.001 | 0.512 | 0.203 | 0.622 |
| External Regulation | 2.73 | (0.64) | 4.64 | (0.76) | 4.50 | (0.96) | 4.75 | (0.68) | 10.395 | 0.034 | 0.527 | 0.106 | 0.015 | 0.023 | 0.752 | 0.882 | 0.527 |
| Introjected Regulation | 3.77 | (0.63) | 4.64 | (0.60) | 3.86 | (0.96) | 5.25 | (0.45) | 11.423 | 0.022 | 0.402 | 0.893 | 0.133 | 0.063 | 0.154 | 0.038 * | 0.517 |
| Identified Regulation | 11.29 | (0.60) | 11.39 | (0.52) | 10.64 | (0.44) | 11.75 | (0.52) | 10.810 | 0.029 | 0.111 | 0.375 | 0.495 | 0.773 | 0.002 ** | 0.100 | 0.665 |
| Intrinsic Regulation | 10.82 | (0.96) | 12.18 | (0.56) | 11.36 | (0.44) | 12.80 | (0.52) | 9.057 | 0.060 | 0.284 | 0.570 | 0.049 | 0.268 | 0.023 * | 0.394 | 0.053 |
| MVPA (mins per valid day per week) | 218.87 | (23.93) | 226.53 | (24.56) | 206.03 | (22.78) | 197.52 | (27.02) | 5.189 | 0.268 | 0.469 | 0.605 | 0.339 | 0.057 | 0.228 | 0.088 | 0.240 |
| MVPA (mins per valid day per week, only including >10 min | 47.76 | (9.53) | 53.00 | (9.66) | 44.43 | (10.22) | 47.97 | (10.90) | 1.341 | 0.854 | 0.199 | 0.541 | 0.772 | 0.960 | 0.396 | 0.519 | 0.742 |
| Maximum duration of brisk walking over the week b | 9.23 | (1.88) | 9.00 | (2.71) | 10.89 | (3.08) | 10.89 | (2.49) | 16.295 | 0.003 | 0.281 | 0.935 | 0.178 | 0.236 | 0.146 | 0.190 | 0.621 |
| Average duration of brisk walking per week b | 3.31 | (0.83) | 3.75 | (1.23) | 3.51 | (0.99) | 4.47 | (1.07) | 8.039 | 0.090 | 0.297 | 0.717 | 0.316 | 0.113 | 0.819 | 0.386 | 0.337 |
| Peak cadence per week (steps/min) | 116.27 | (4.14) | 112.05 | (3.73) | 108.26 | (4.23) | 114.11 | (3.35) | 9.567 | 0.048 | 0.060 | 0.186 | 0.020 | 0.811 | 0.478 | 0.338 | 0.035 |
| Average step count per week | 12,787.32 | (908.64) | 13,683.30 | (845.53) | 12,746.26 | (825.69) | 12,380.51 | (1136.08) | 2.995 | 0.559 | 0.281 | 0.206 | 0.942 | 0.489 | 0.182 | 0.111 | 0.381 |
Publisher’s Note: MDPI stays neutral with regard to jurisdictional claims in published maps and institutional affiliations. |
© 2021 by the authors. Licensee MDPI, Basel, Switzerland. This article is an open access article distributed under the terms and conditions of the Creative Commons Attribution (CC BY) license (https://creativecommons.org/licenses/by/4.0/).
Share and Cite
Liu, J.Y.W.; Kwan, R.Y.C.; Yin, Y.-H.; Lee, P.H.; Siu, J.Y.-m.; Bai, X. Enhancing the Physical Activity Levels of Frail Older Adults with a Wearable Activity Tracker-Based Exercise Intervention: A Pilot Cluster Randomized Controlled Trial. Int. J. Environ. Res. Public Health 2021, 18, 10344. https://doi.org/10.3390/ijerph181910344
Liu JYW, Kwan RYC, Yin Y-H, Lee PH, Siu JY-m, Bai X. Enhancing the Physical Activity Levels of Frail Older Adults with a Wearable Activity Tracker-Based Exercise Intervention: A Pilot Cluster Randomized Controlled Trial. International Journal of Environmental Research and Public Health. 2021; 18(19):10344. https://doi.org/10.3390/ijerph181910344
Chicago/Turabian StyleLiu, Justina Y. W., Rick Y. C. Kwan, Yue-Heng Yin, Paul H. Lee, Judy Yuen-man Siu, and Xue Bai. 2021. "Enhancing the Physical Activity Levels of Frail Older Adults with a Wearable Activity Tracker-Based Exercise Intervention: A Pilot Cluster Randomized Controlled Trial" International Journal of Environmental Research and Public Health 18, no. 19: 10344. https://doi.org/10.3390/ijerph181910344
APA StyleLiu, J. Y. W., Kwan, R. Y. C., Yin, Y.-H., Lee, P. H., Siu, J. Y.-m., & Bai, X. (2021). Enhancing the Physical Activity Levels of Frail Older Adults with a Wearable Activity Tracker-Based Exercise Intervention: A Pilot Cluster Randomized Controlled Trial. International Journal of Environmental Research and Public Health, 18(19), 10344. https://doi.org/10.3390/ijerph181910344