
Using Ecological Diversity Analyses to Characterize the Availability of Healthy Food and Socio-Economic Food Deserts


Abstract
:1. Introduction
2. Materials and Methods
2.1. Data Collection
2.2. Data Analysis
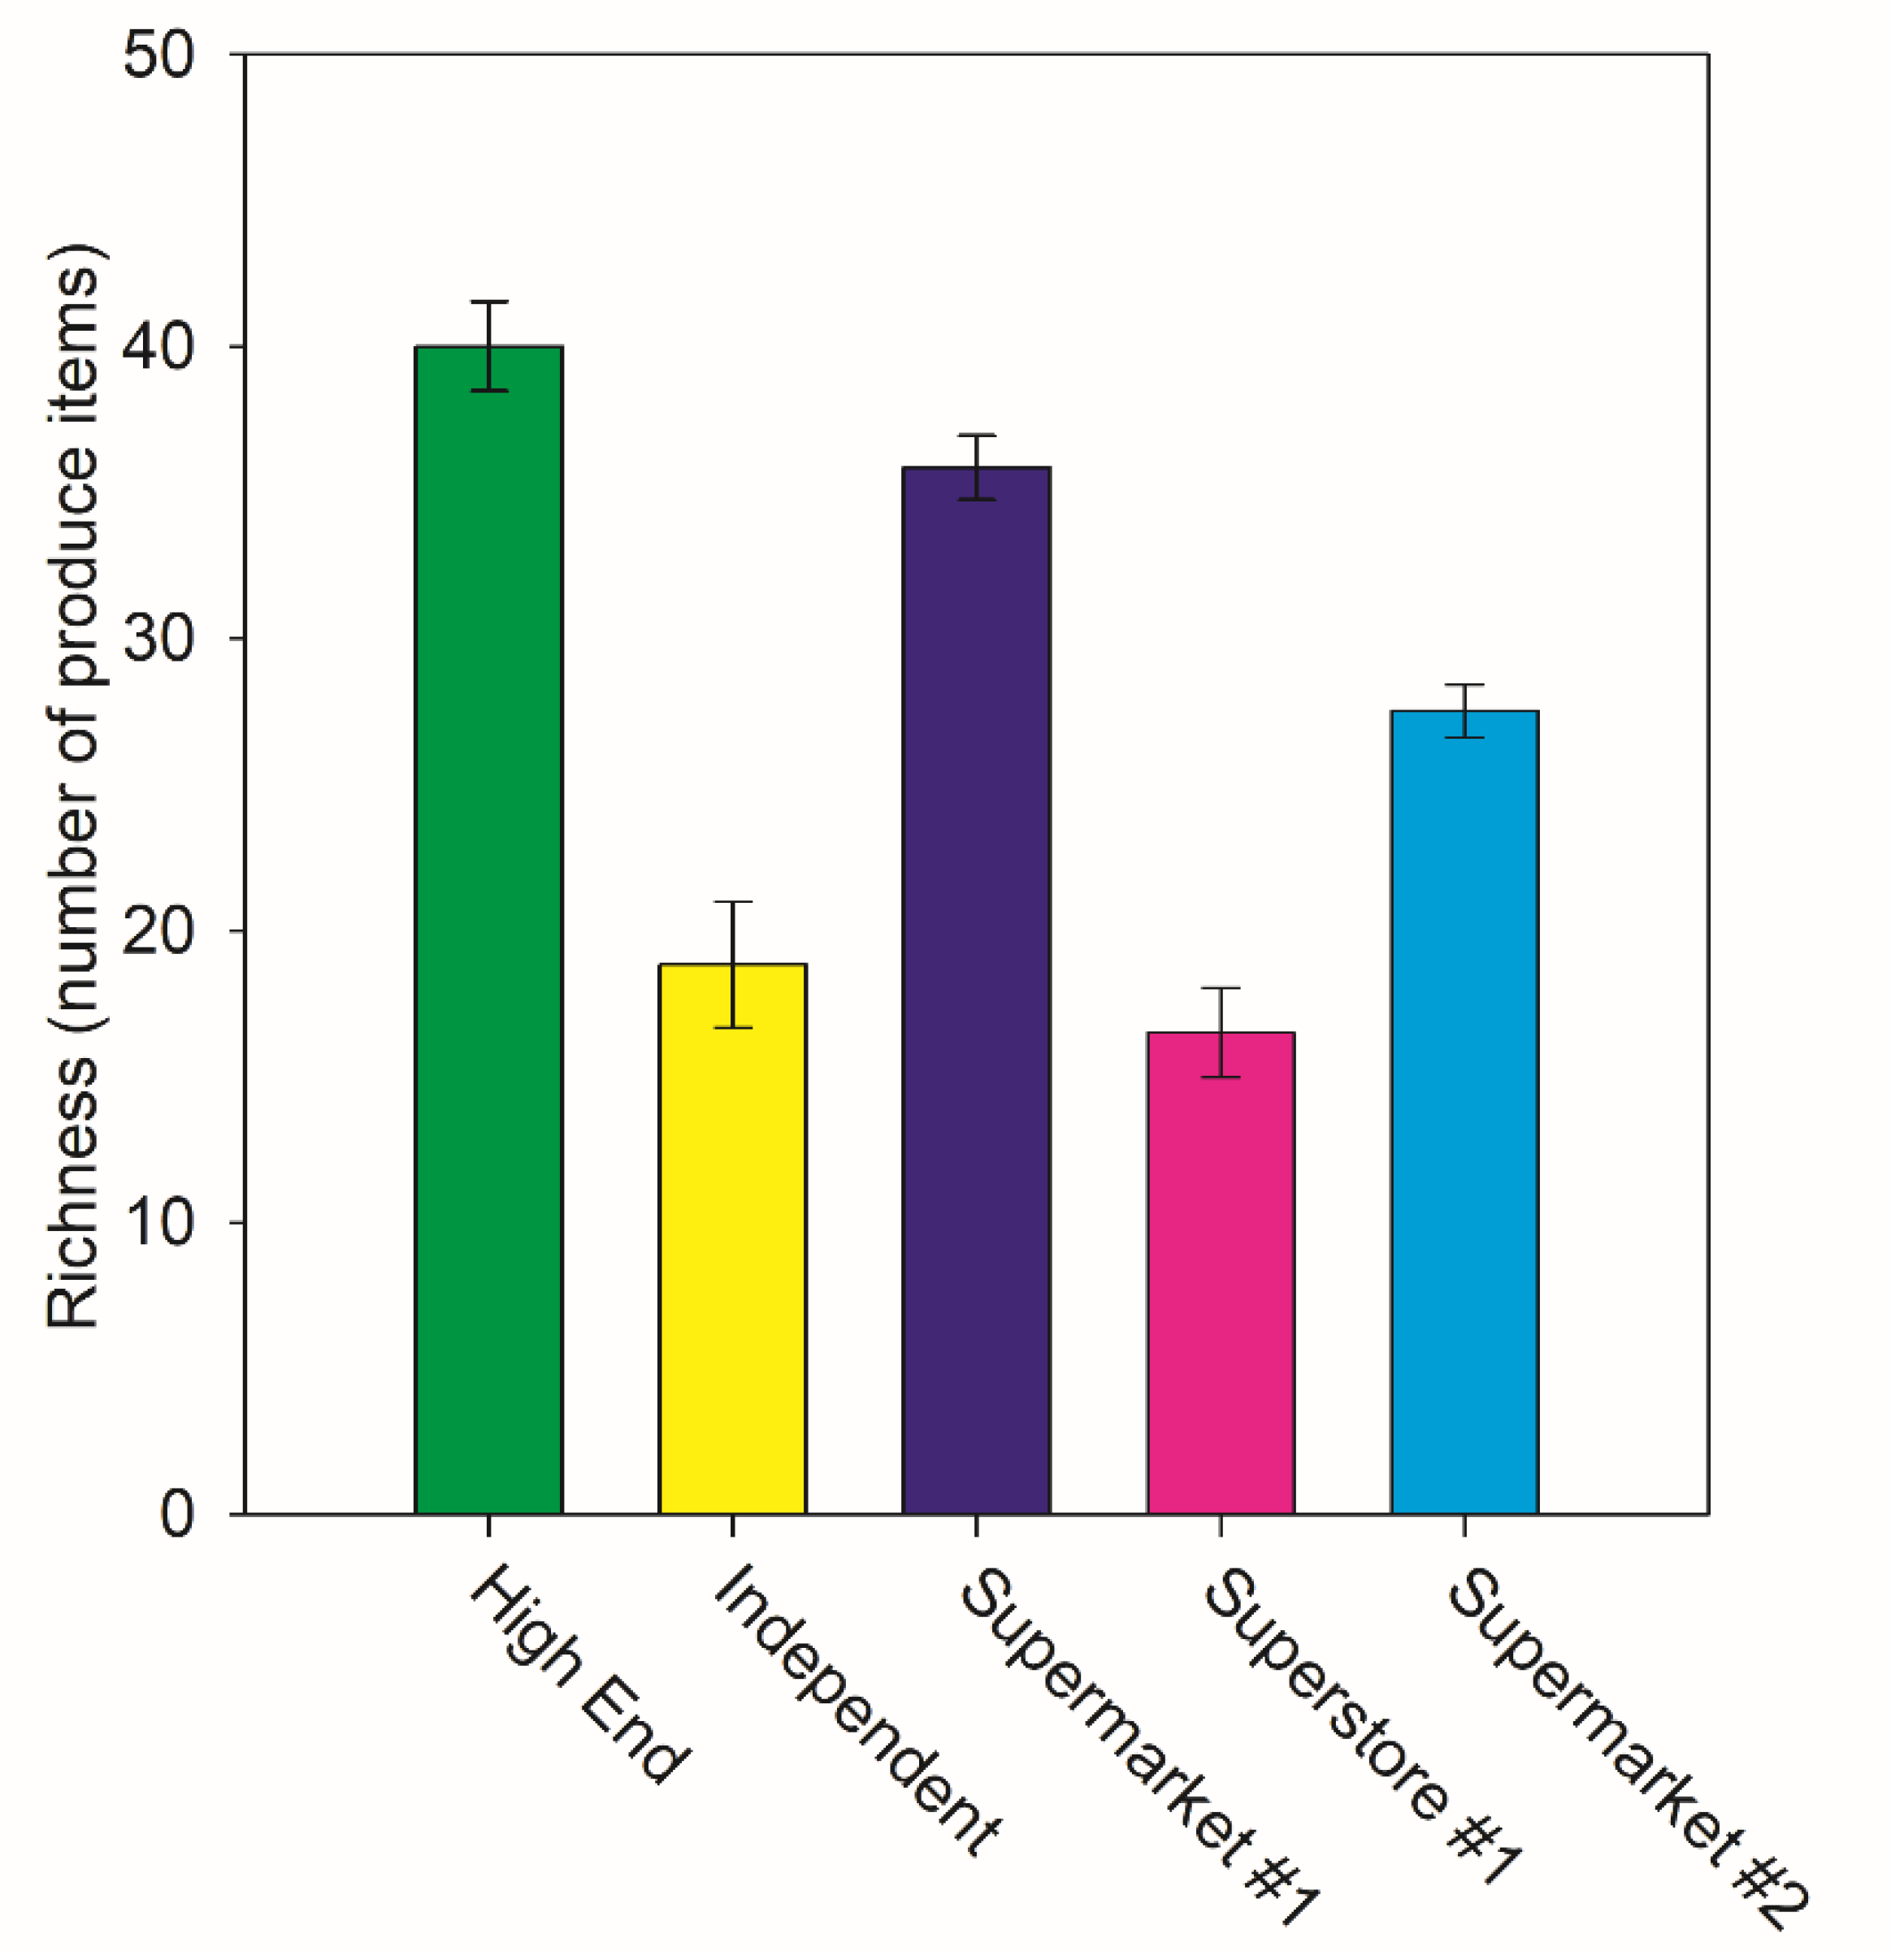
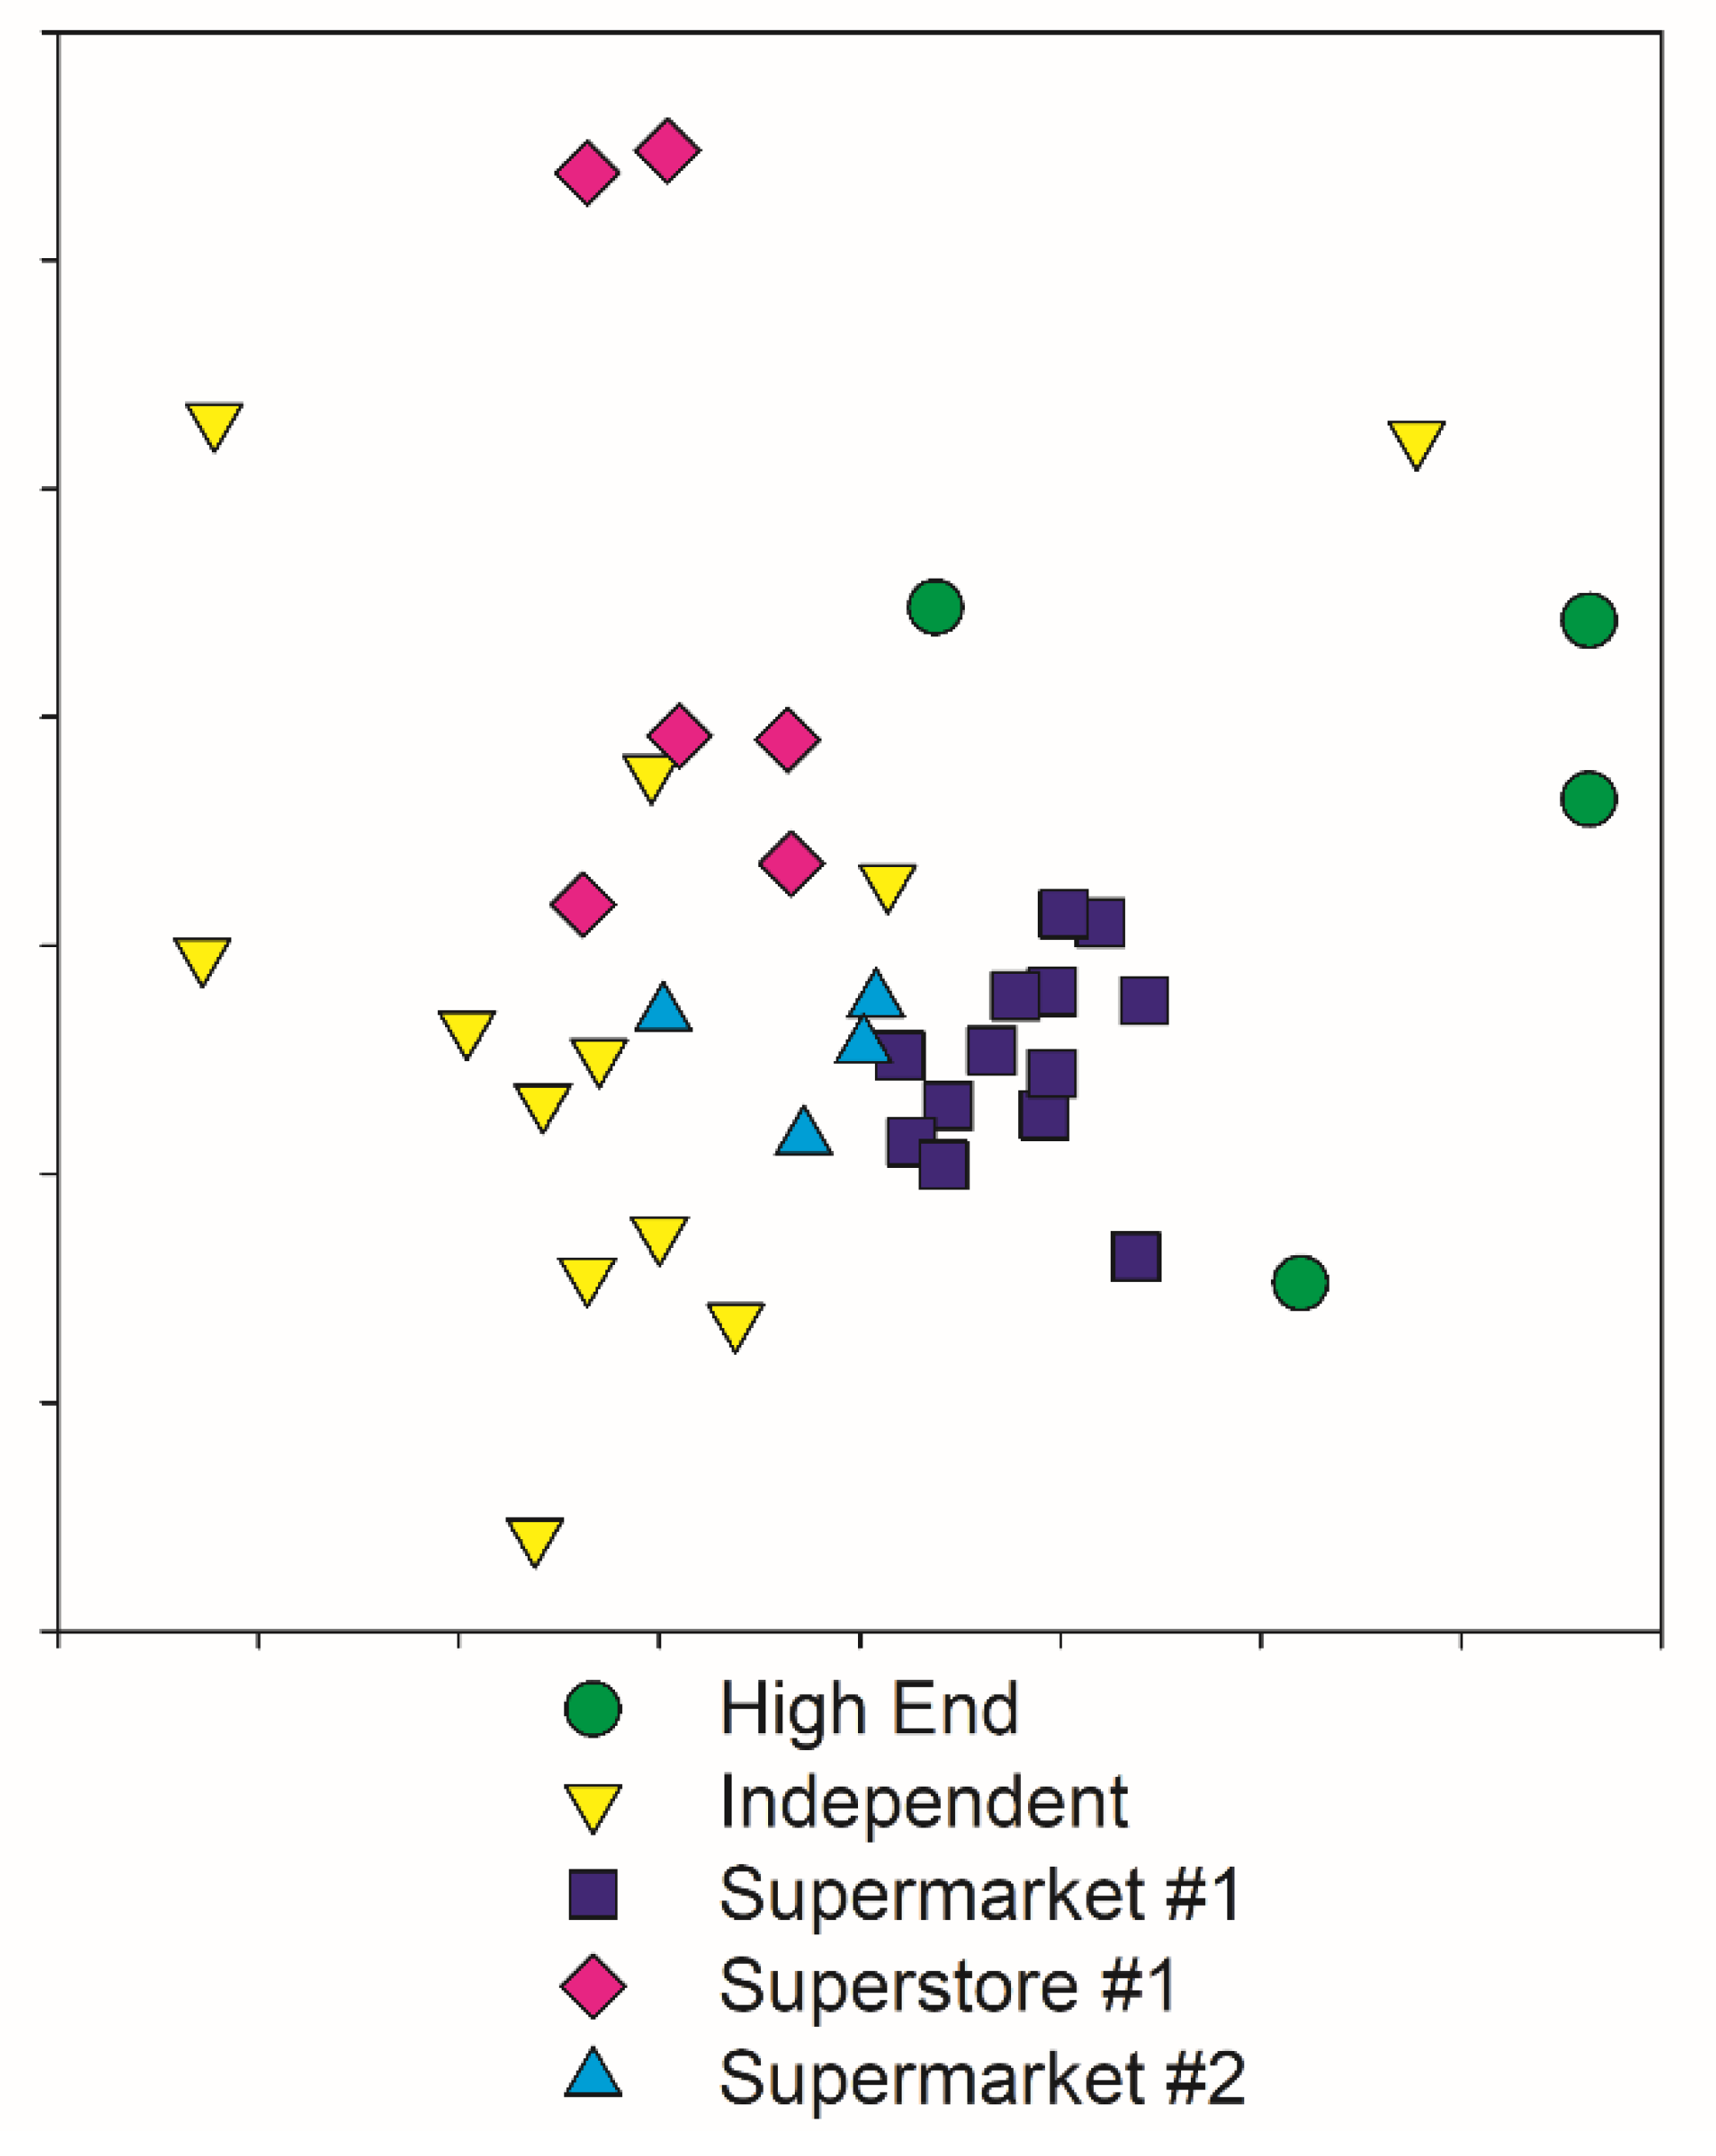
3. Results
4. Discussion
5. Conclusions
Author Contributions
Funding
Institutional Review Board Statement
Informed Consent Statement
Data Availability Statement
Acknowledgments
Conflicts of Interest
References
- Rhone, A. Documentation. United States Department of Agriculture Food Access Research Atlas. Available online: https://www.ers.usda.gov/data-products/food-access-research-atlas/documentation/ (accessed on 31 October 2019).
- Shannon, J. Beyond the supermarket solution: Linking food deserts, neighborhood context, and everyday mobility. Ann. Am. Assoc. Geogr. 2016, 106, 186–202. [Google Scholar] [CrossRef]
- Moore, L.V.; Diez Roux, A.V. Associations of neighborhood characteristics with the location and type of food stores. Am. J. Public Health 2006, 96, 325–331. [Google Scholar] [CrossRef] [PubMed]
- Beaulac, J.; Kristjansson, E.; Cummins, S. Peer reviewed: A systematic review of food deserts, 1966–2007. Prev. Chronic Dis. 2009, 6, A105. [Google Scholar] [PubMed]
- Dutko, P.; Ver Ploeg, M.; Farrigan, T. Characteristics and Influential Factors of Food Deserts. USDA. Available online: https://www.ers.usda.gov/webdocs/publications/45014/30940_err140.pdf (accessed on 29 January 2021).
- Burns, C.M.; Inglis, A.D. Measuring food access in Melbourne: Access to healthy and fast foods by car, bus and foot in an urban municipality in Melbourne. Health Place 2007, 13, 877–885. [Google Scholar] [CrossRef] [PubMed]
- Bodor, J.N.; Rose, D.; Farley, T.A.; Swalm, C.; Scott, S.K. Neighbourhood fruit and vegetable availability and consumption: The role of small food stores in an urban environment. Public Health Nutr. 2008, 11, 413–420. [Google Scholar] [CrossRef] [PubMed] [Green Version]
- Morland, K.; Wing, S.; Roux, A.D.; Poole, C. Neighborhood characteristics associated with the location of food stores and food service places. Am. J. Prev. Med. 2002, 22, 23–29. [Google Scholar] [CrossRef]
- Clarke, G.; Eyre, H.; Guy, C. Deriving indicators of access to food retail provision in British cities: Studies of Cardiff, Leeds and Bradford. Urban Stud. 2002, 39, 2041–2060. [Google Scholar] [CrossRef]
- Bertrand, L.; Thérien, F.; Cloutier, M.S. Measuring and mapping disparities in access to fresh fruits and vegetables in Montreal. Can. J. Public Health 2008, 99, 6–11. [Google Scholar] [CrossRef] [PubMed]
- Donkin, A.J.; Dowler, E.A.; Stevenson, S.J.; Turner, S.A. Mapping access to food at a local level. Br. Food J. 1999, 3, 31–38. [Google Scholar] [CrossRef]
- Lee, G.; Lim, H. A spatial statistical approach to identifying areas with poor access to grocery foods in the city of Buffalo, New York. Urban Stud. 2009, 46, 1299–1315. [Google Scholar] [CrossRef]
- Thomas, B.J. Food deserts and the sociology of space: Distance to food retailers and food insecurity in an urban American neighborhood. Int. J. Humanit. Soc. Sci. 2010, 5, 400–409. [Google Scholar]
- Dubowitz, T.; Zenk, S.N.; Ghosh-Dastidar, B.; Cohen, D.A.; Beckman, R.; Hunter, G.; Steiner, E.D.; Collins, R.L. Healthy food access for urban food desert residents: Examination of the food environment, food purchasing practices, diet and BMI. Public Health Nutr. 2015, 18, 2220–2230. [Google Scholar] [CrossRef] [PubMed] [Green Version]
- Brooten, D.; Youngblut, J.M. South Florida: A national microcosm of diversity and health disparities. J. Cult. Divers. 2005, 12, 136–144. [Google Scholar] [PubMed]
- Vatske, S. New County Hunger Data Released—Map the Meal Gap 2019. Feeding South Florida. Available online: https://feedingsouthflorida.org/2019-map-the-meal-gap-released/ (accessed on 29 October 2019).
- United Health Foundation. Food Insecurity. America’s Health Rankings. Available online: https://www.americashealthrankings.org/explore/health-of-women-and-children/measure/food_insecurity_household/state/FL (accessed on 29 January 2021).
- USDA. Food Security and Nutrition Assistance. Economic Research Service. Available online: https://www.ers.usda.gov/data-products/ag-and-food-statistics-charting-the-essentials/food-security-and-nutrition-assistance/ (accessed on 29 January 2021).
- Beachler, D. Racial Gerrymandering and Republican Gains in Southern House Elections. J. Political Sci. 1995, 23, 4. [Google Scholar]
- Diebel, J.; Norda, J.; Kretchmer, O. Statistical Atlas: Overview of Broward County, FL. Available online: https://statisticalatlas.com/county/Florida/Broward-County/Overview (accessed on 16 June 2020).
- U.S. Census Bureau. 2012–2016 American Community Survey 3-Year Public Use Microdata Samples. Available online: https://www.census.gov/programs-surveys/acs/microdata.html (accessed on 29 October 2019).
- Persaud, C. Rich Blocks Poor Blocks. Available online: https://richblockspoorblocks.com/ (accessed on 16 June 2020).
- Bray, J.R.; Curtis, J.T. An ordination of the upland forest communities of southern Wisconsin. Ecol. Monogr. 1957, 27, 326–349. [Google Scholar] [CrossRef]
- Quinn, G.P.; Keough, M.J. Experimental Design and Data Analysis for Biologists; Cambridge University Press: Cambridge, MA, USA, 2002. [Google Scholar]
- McEntee, J.; Agyeman, J. Towards the development of a GIS method for identifying rural food deserts: Geographic access in Vermont, USA. Appl. Geogr. 2010, 30, 165–176. [Google Scholar] [CrossRef]


| Source | Degrees of Freedom | Type III Sum of Squares | F Value | p |
|---|---|---|---|---|
| Store | 4 | 1608.3 | 6.35 | 0.0175 * |
| Income class | 4 | 191.4 | 0.76 | 0.5851 |
| White class | 4 | 481.1 | 1.9 | 0.2152 |
| Store × Income class | 2 | 2.6 | 0.02 | 0.9799 |
| Store × White class | 3 | 118.1 | 0.62 | 0.6228 |
| Income class × White class | 3 | 122.7 | 0.65 | 0.6097 |
| Variable | DF | Parameter Estimate | Standard Error | t Value | p |
|---|---|---|---|---|---|
| Intercept | 1 | 8.94852 | 5.96096 | 1.5 | 0.142 |
| Median income | 1 | 0.00011833 | 7.1 × 10⁻⁵ | 1.67 | 0.1043 |
| Percent white | 1 | 0.16942 | 0.07854 | 2.16 | 0.0378 * |
| Store | p-Value | Most Important Product Differences |
|---|---|---|
| Independent, High-end | 0.60 | Organic fennel/Organic cucumber (tie) |
| Independent, Supermarket #1 | 0.006 * | Scotch bonnet pepper |
| Independent, Superstore #1 | 1.00 | Artichoke |
| Independent, Supermarket #2 | 0.833 | Butternut squash |
| High-end, Supermarket #1 | 0.257 | Scotch bonnet pepper |
| High-end, Superstore #1 | 0.200 | Organic red beet/Organic fennel/Organic Romaine Lettuce/Organic cucumber/Organic golden beat (5-way tie) |
| High-end, Supermarket #2 | - | Leek/Butternut squash (tie) |
| Supermarket #1, Superstore #1 | 0.005 * | Broccoli |
| Supermarket #1, Supermarket #2 | 0.083 | Scotch bonnet pepper |
| Superstore #1, Supermarket #2 | 0.417 | Broccoli |
Publisher’s Note: MDPI stays neutral with regard to jurisdictional claims in published maps and institutional affiliations. |
© 2021 by the authors. Licensee MDPI, Basel, Switzerland. This article is an open access article distributed under the terms and conditions of the Creative Commons Attribution (CC BY) license (https://creativecommons.org/licenses/by/4.0/).
Share and Cite
Goyanes, A.; Hoch, J.M. Using Ecological Diversity Analyses to Characterize the Availability of Healthy Food and Socio-Economic Food Deserts. Int. J. Environ. Res. Public Health 2021, 18, 10297. https://doi.org/10.3390/ijerph181910297
Goyanes A, Hoch JM. Using Ecological Diversity Analyses to Characterize the Availability of Healthy Food and Socio-Economic Food Deserts. International Journal of Environmental Research and Public Health. 2021; 18(19):10297. https://doi.org/10.3390/ijerph181910297
Chicago/Turabian StyleGoyanes, Annie, and Jeffrey Matthew Hoch. 2021. "Using Ecological Diversity Analyses to Characterize the Availability of Healthy Food and Socio-Economic Food Deserts" International Journal of Environmental Research and Public Health 18, no. 19: 10297. https://doi.org/10.3390/ijerph181910297
APA StyleGoyanes, A., & Hoch, J. M. (2021). Using Ecological Diversity Analyses to Characterize the Availability of Healthy Food and Socio-Economic Food Deserts. International Journal of Environmental Research and Public Health, 18(19), 10297. https://doi.org/10.3390/ijerph181910297