
Impact of Inpatient Unit Design Features on Overall Patient Experience and Perceived Room-Level Call Button Response

 ,
,
Abstract
:1. Introduction
Research Questions
- Whether the decentralized inpatient unit design is associated with improved patient experience;
- Whether there is consistency between rooms in patient experience in decentralized inpatient room design or whether there are differences that may be associated with unit design;
- Whether the room’s visibility within the unit impacts patients’ perceptions of nurses and other staff’s response to call button requests and assistance with their needs.
2. Materials and Methods
2.1. Study Design
2.2. Settings
2.3. Research Methods
2.3.1. Tools to Assess Patient Experience
2.3.2. Patient Experience of Care: Patient Experience and Nurses’ Response to Call Light
2.3.3. Visibility Analysis
2.3.4. Statistical Analysis
3. Results
3.1. Comparing the Units
3.1.1. Research Sample: Patient Demographics
3.1.2. Aggregate Differences between Units
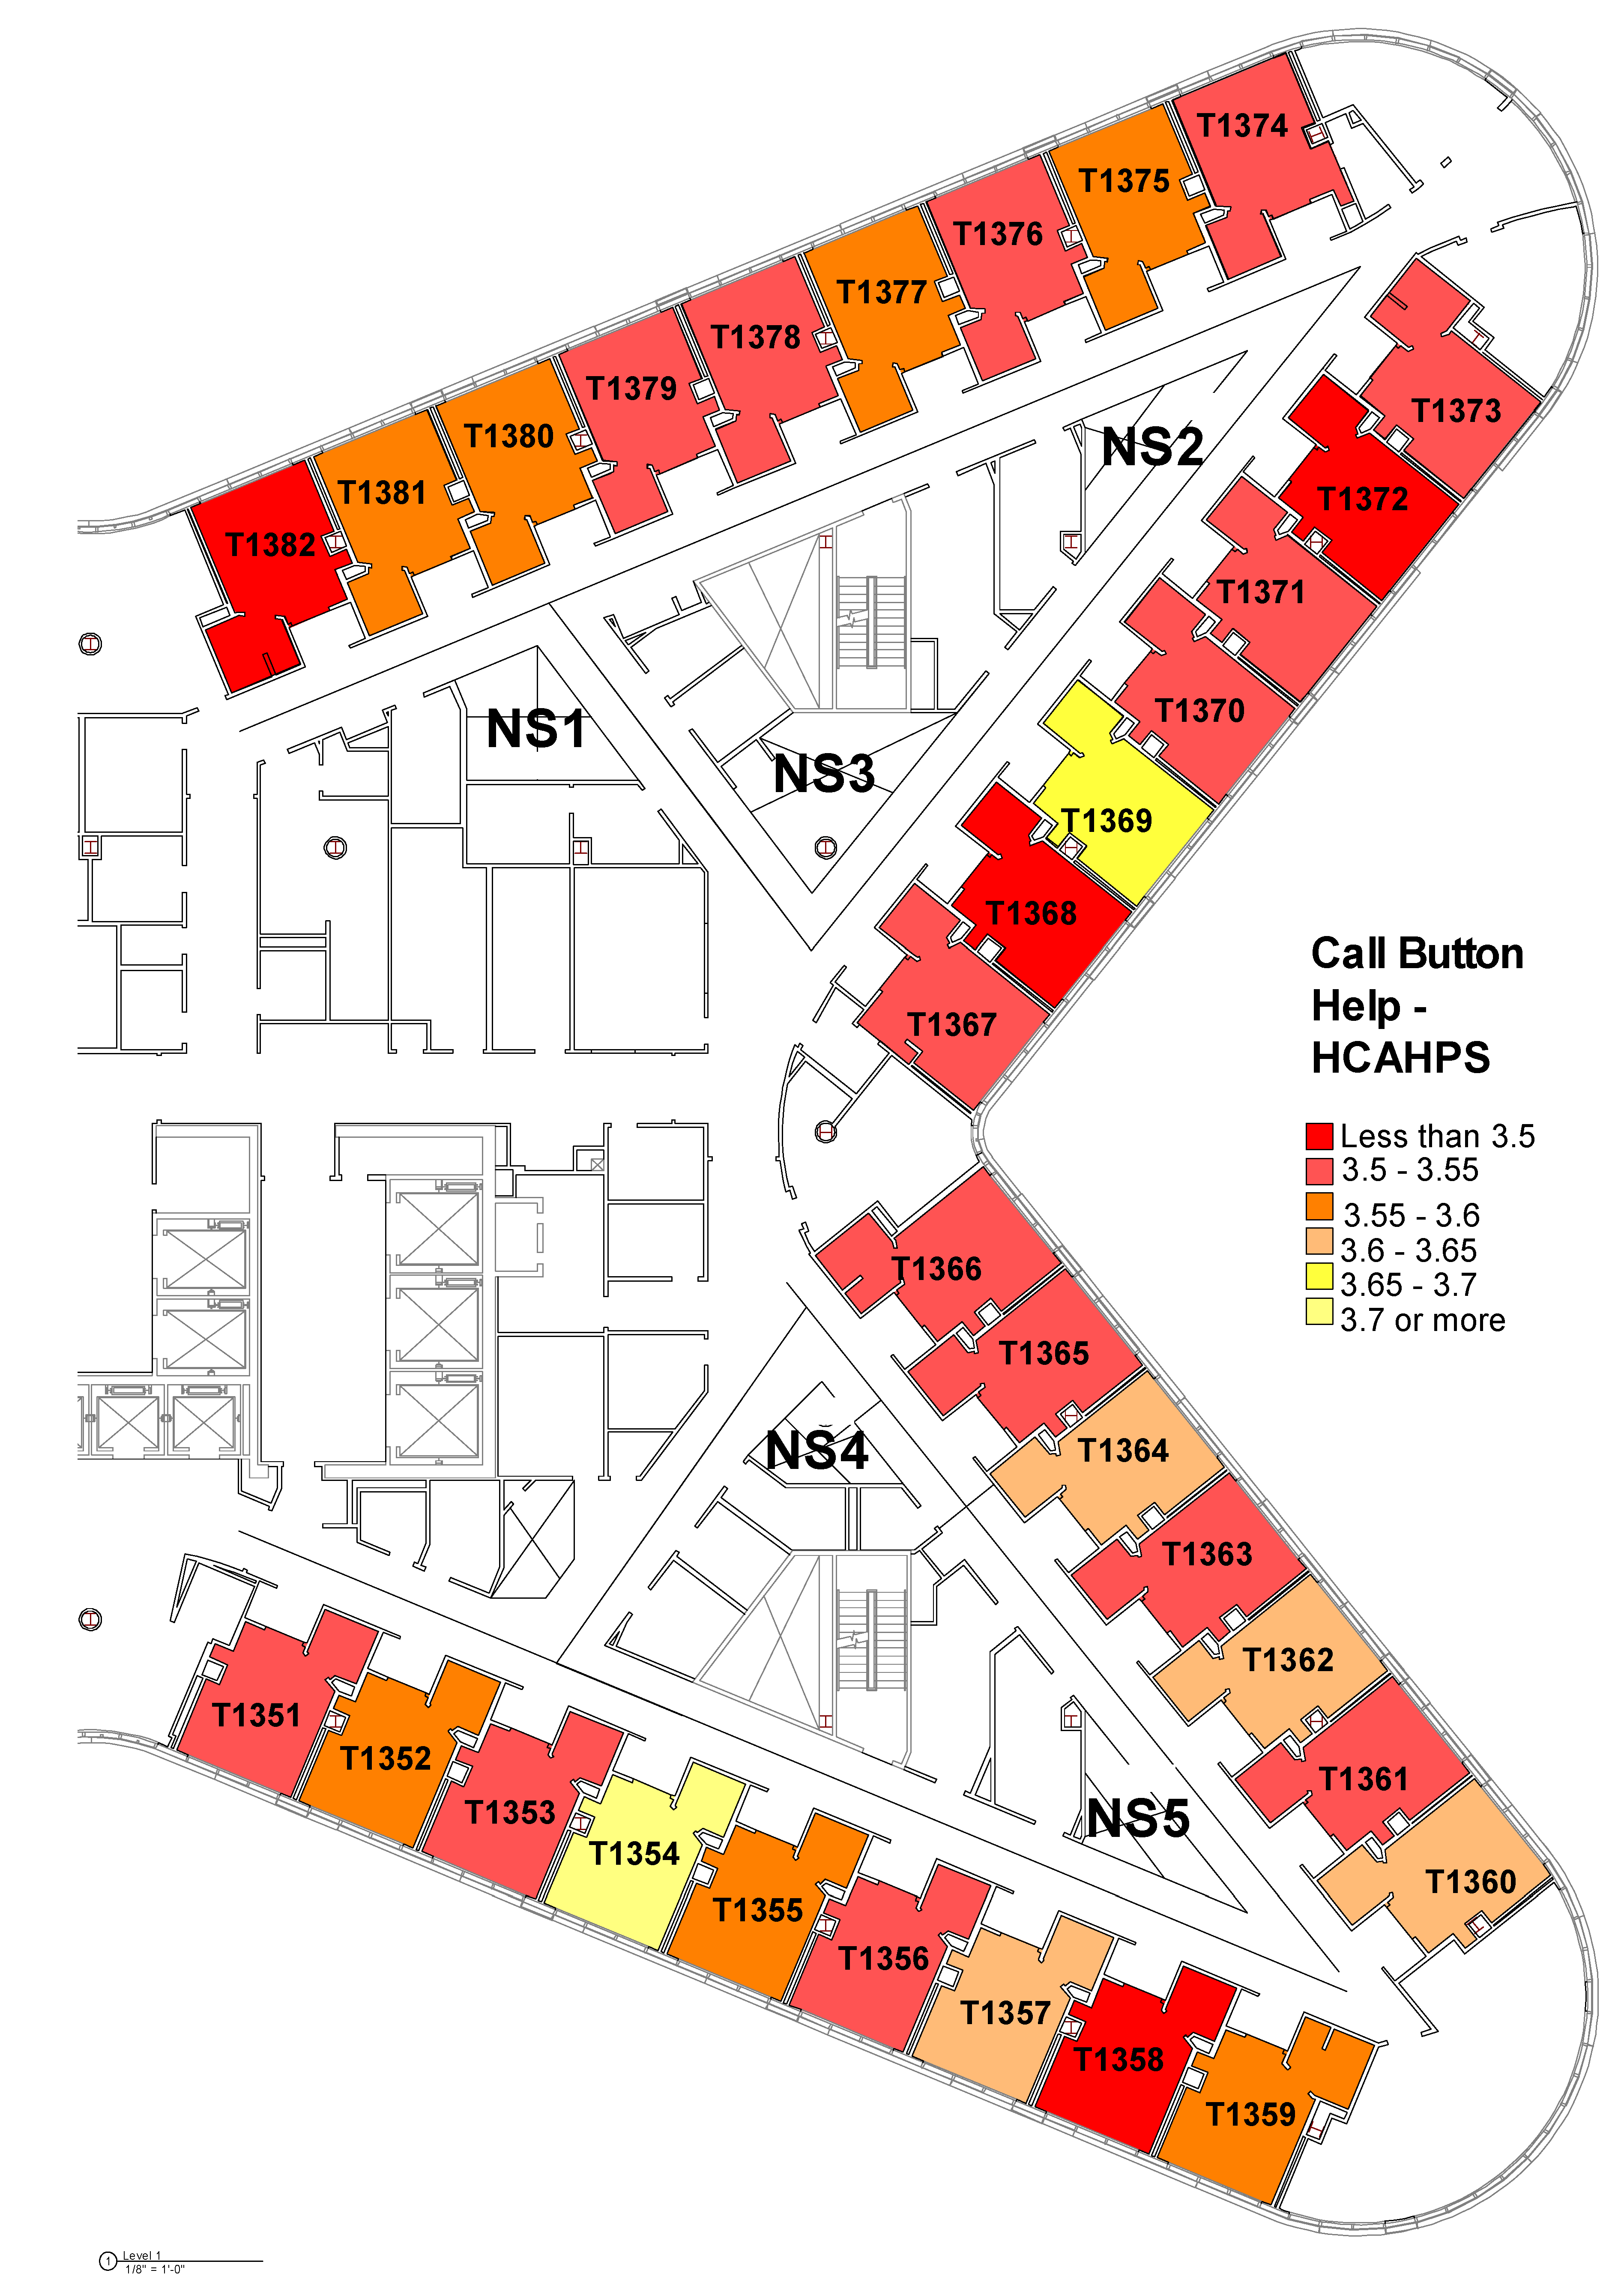
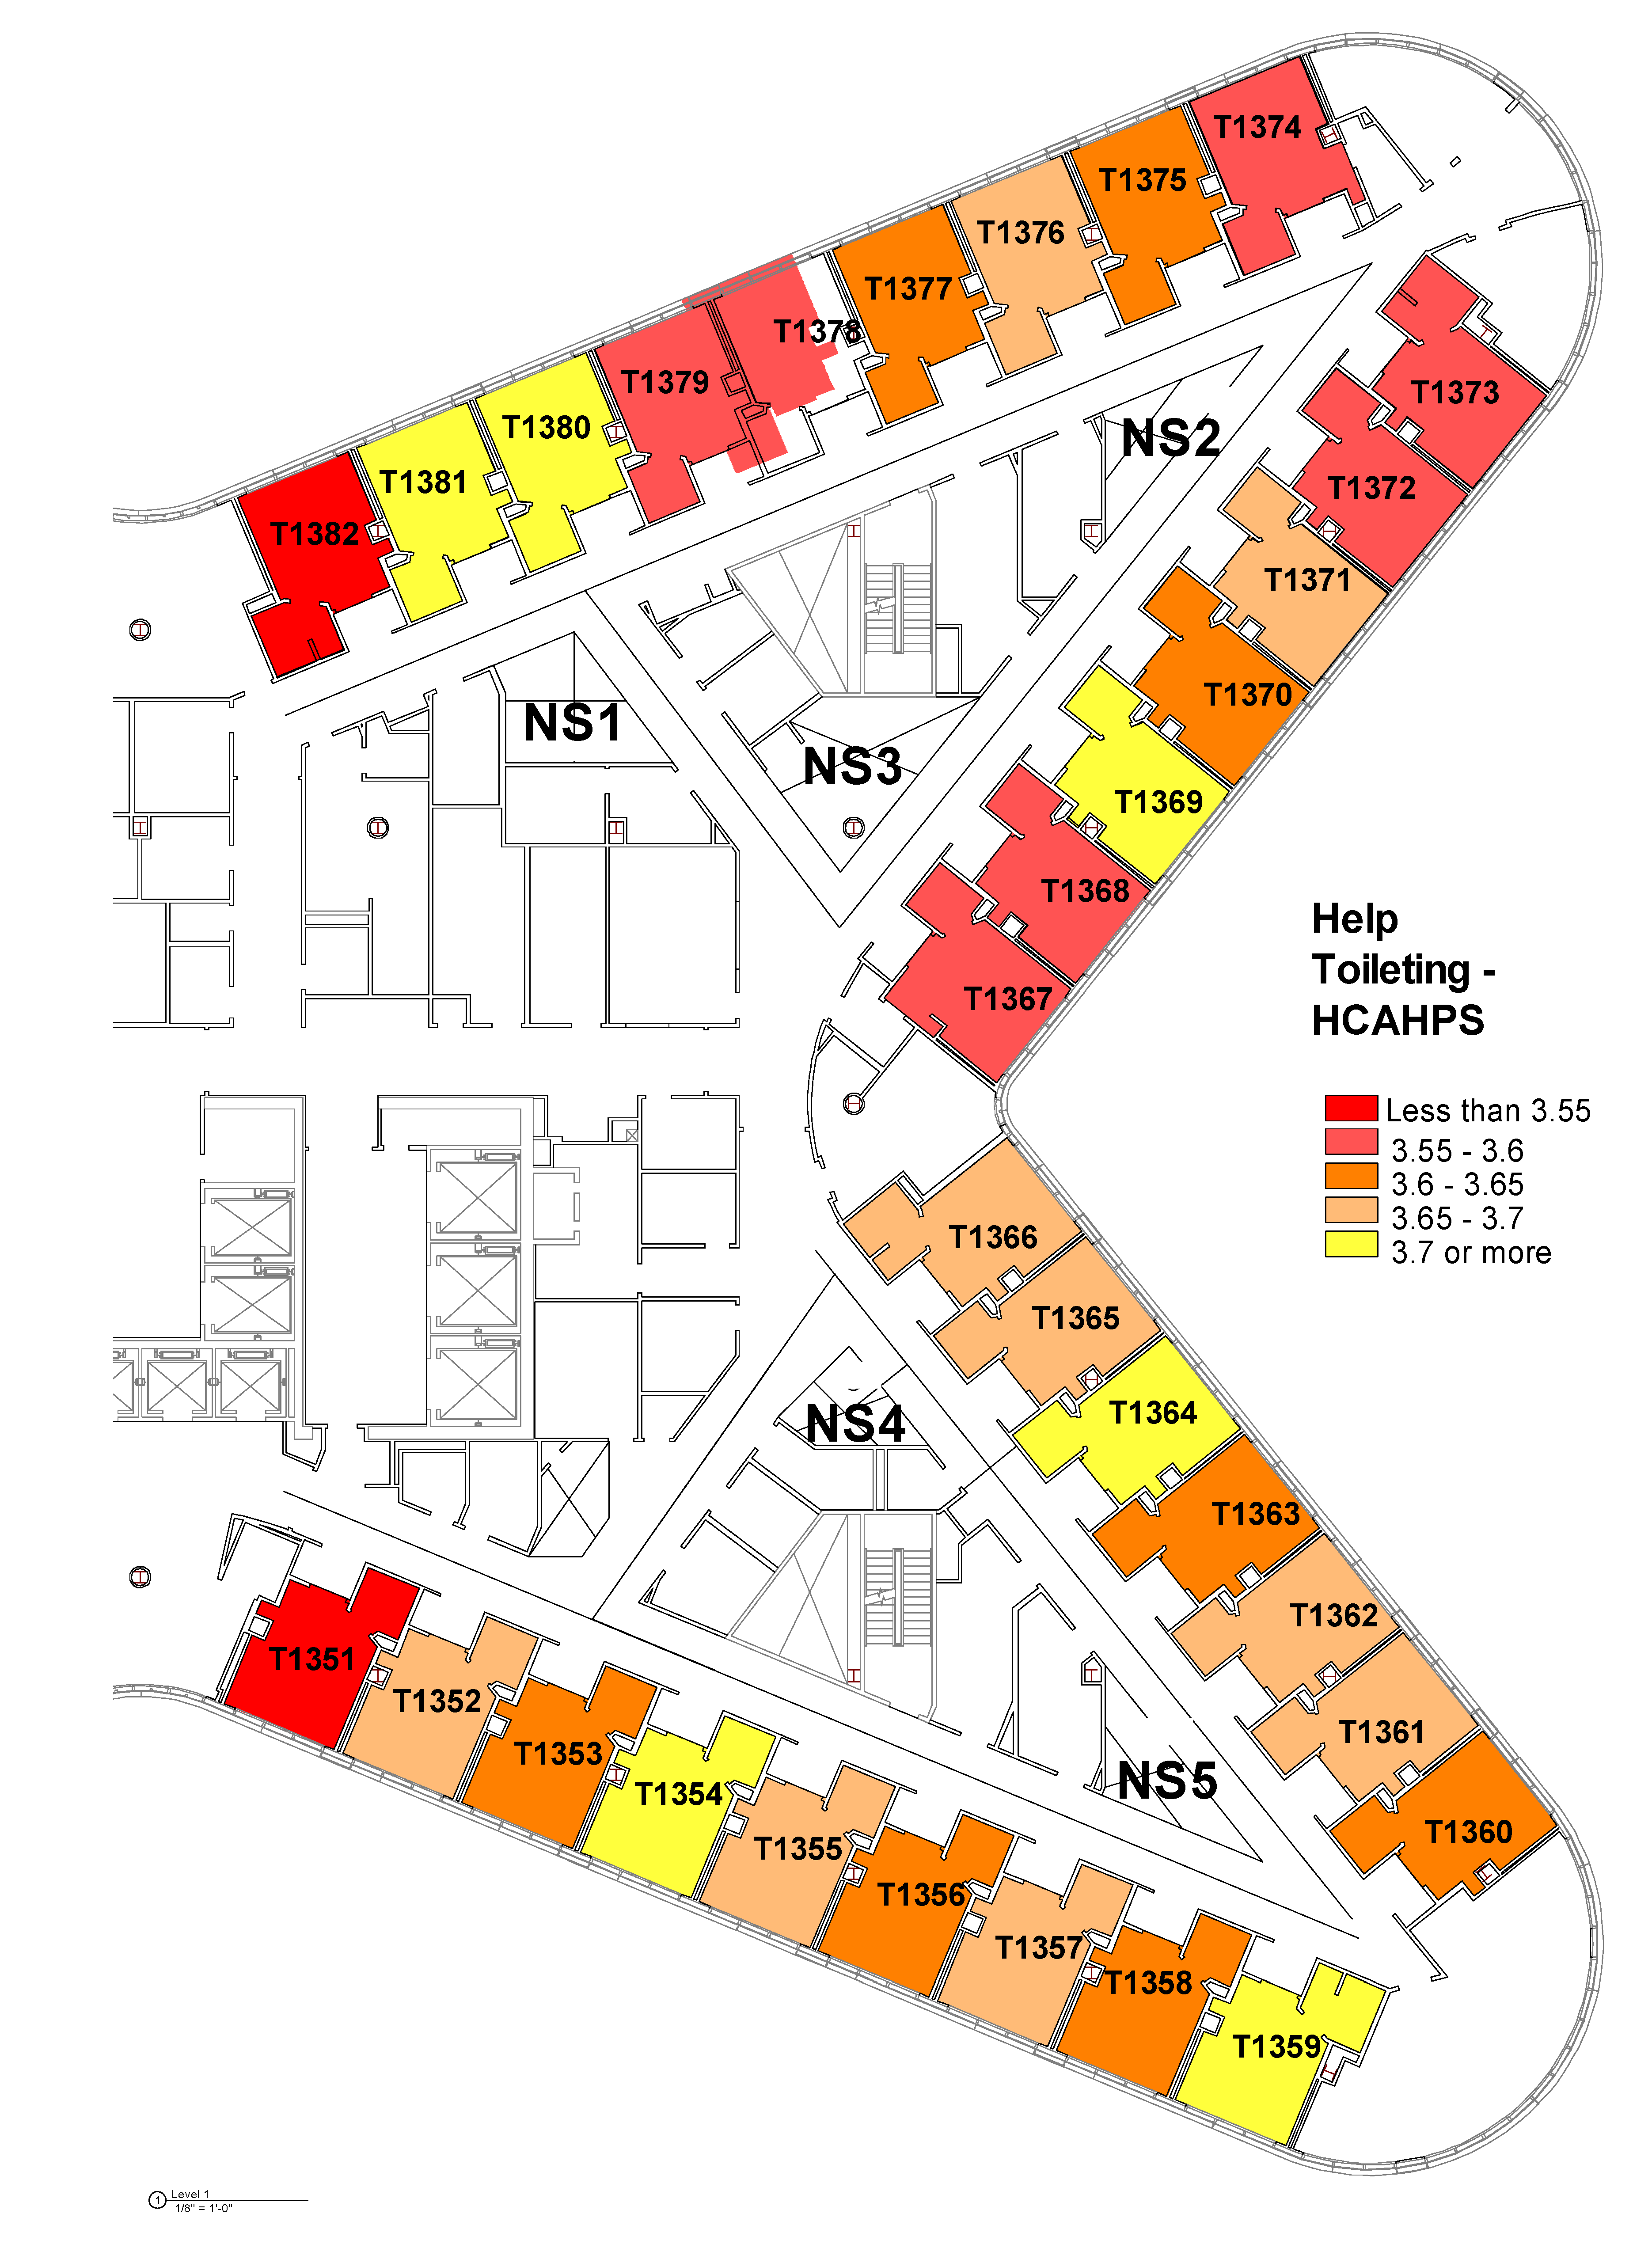
3.2. Differences between Rooms in the Tower
3.3. Visibility and Patients’ Perception of Response to Call Buttons
3.3.1. Visibility Analysis
3.3.2. Visibility and Patient Experience with Call Button Response
4. Discussion
5. Conclusions
5.1. Conclusions
5.2. Limitations and Future Works
Author Contributions
Funding
Institutional Review Board Statement
Informed Consent Statement
Data Availability Statement
Acknowledgments
Conflicts of Interest
Appendix A

| Side | Room # | Visual Integration Value | Visual Step Depth Avg_Home-Base Nurse Station | Nurse Station 5 | Nurse Station 4 | Nurse Station 3 (Charge Nurse) | Nurse Station 2 | Nurse Station 1 |
|---|---|---|---|---|---|---|---|---|
| South | T1351 | 3.75 | 3.71 | 3.22 | 4.21 | 4.21 | 4.22 | 5.21 |
| T1352 | 4.36 | 2.96 | 2.96 | 2.96 | 2.95 | 3.95 | 3.95 | |
| T1353 | 4.86 | 2.57 | 2.58 | 2.56 | 2.58 | 3.57 | 3.57 | |
| T1354 | 3.75 | 3.70 | 3.21 | 4.19 | 4.19 | 4.21 | 5.19 | |
| T1355 | 7.75 | 3.70 | 3.21 | 4.19 | 4.20 | 4.21 | 5.20 | |
| T1356 | 4.18 | 2.75 | 2.75 | 2.75 | 3.75 | 3.75 | 4.75 | |
| T1357 | 4.66 | 1.95 | 1.56 | 2.35 | 3.33 | 3.33 | 4.33 | |
| T1358 | 4.77 | 2.16 | 1.87 | 2.44 | 3.24 | 3.24 | 4.24 | |
| T1359 | 4.67 | 2.60 | 2.27 | 2.93 | 3.27 | 3.27 | 4.27 | |
| T1360 | 4.71 | 2.71 | 2.20 | 3.22 | 3.22 | 3.23 | 4.22 | |
| T1361 | 4.76 | 2.66 | 2.09 | 3.22 | 3.22 | 3.23 | 4.22 | |
| T1362 | 4.73 | 1.80 | 1.39 | 2.21 | 3.21 | 3.23 | 4.21 | |
| T1363 | 4.55 | 1.95 | 1.71 | 2.20 | 3.19 | 3.23 | 4.20 | |
| T1364 | 4.53 | 2.21 | 2.22 | 2.19 | 3.20 | 3.22 | 4.20 | |
| T1365 | 4.67 | 1.86 | 2.23 | 1.49 | 2.91 | 3.27 | 3.67 | |
| T1366 | 5.09 | 1.95 | 2.29 | 1.61 | 2.41 | 2.21 | 3.31 | |
| North | T1367 | 5.39 | 1.94 | 2.86 | 2.25 | 1.97 | 2.21 | 1.64 |
| T1368 | 4.94 | 1.80 | 3.23 | 2.49 | 1.44 | 2.21 | 1.76 | |
| T1369 | 4.73 | 2.32 | 3.24 | 2.97 | 1.53 | 2.20 | 3.22 | |
| T1370 | 4.52 | 2.50 | 3.23 | 3.23 | 2.23 | 2.06 | 3.23 | |
| T1371 | 4.69 | 2.25 | 4.24 | 3.24 | 2.24 | 1.27 | 3.24 | |
| T1372 | 4.81 | 2.43 | 3.24 | 3.24 | 2.24 | 1.81 | 3.24 | |
| T1373 | 4.71 | 2.93 | 3.28 | 3.28 | 3.28 | 2.26 | 3.26 | |
| T1374 | 4.78 | 2.71 | 3.21 | 3.21 | 2.71 | 2.21 | 3.21 | |
| T1375 | 4.82 | 2.52 | 3.23 | 3.23 | 2.25 | 2.11 | 3.21 | |
| T1376 | 4.81 | 2.31 | 3.25 | 3.25 | 2.25 | 1.44 | 3.22 | |
| T1377 | 4.37 | 2.70 | 3.66 | 3.67 | 2.67 | 2.22 | 3.22 | |
| T1378 | 3.79 | 3.22 | 4.23 | 4.20 | 3.23 | 3.23 | 3.20 | |
| T1379 | 3.80 | 3.20 | 4.22 | 4.19 | 4.19 | 3.22 | 2.19 | |
| T1380 | 4.69 | 2.26 | 3.69 | 3.69 | 2.56 | 2.69 | 1.54 | |
| T1381 | 4.65 | 2.26 | 3.71 | 2.71 | 2.73 | 2.73 | 1.33 | |
| T1382 | 3.92 | 3.62 | 4.28 | 3.28 | 4.28 | 3.29 | 3.27 |
| Side | Room # | Metric Step Depth Avg_Home-Base Nurse Stations | Nurse Station 5 | Nurse Station 4 | Nurse Station 3 (Charge Nurse) | Nurse Station 2 | Nurse Station 1 |
|---|---|---|---|---|---|---|---|
| South | T1351 | 1042.86 | 1279.53 | 806.19 | 1696.58 | 2126.92 | 1701.68 |
| T1352 | 880.26 | 1096.49 | 664.02 | 1557.75 | 1988.1 | 1562.85 | |
| T1353 | 750.48 | 915.56 | 585.39 | 1511.13 | 1941.55 | 1516.2 | |
| T1354 | 685.58 | 734.45 | 636.70 | 1565.81 | 1996.36 | 1570.86 | |
| T1355 | 679.83 | 559.06 | 800.59 | 1729.9 | 2160.44 | 1734.98 | |
| T1356 | 569.39 | 388.08 | 750.70 | 1759.29 | 2184.16 | 1778.21 | |
| T1357 | 548.56 | 274.16 | 822.95 | 2347.1 | 1922.39 | 1941.3 | |
| T1358 | 623.27 | 330.82 | 915.71 | 2053.06 | 2477.76 | 2071.97 | |
| T1359 | 765.60 | 480.25 | 1050.94 | 1830.91 | 2255.71 | 1849.83 | |
| T1360 | 796.02 | 534.65 | 1057.38 | 2053.88 | 2478.66 | 2072.76 | |
| T1361 | 635.69 | 394.01 | 877.37 | 1872.47 | 2297.25 | 1891.35 | |
| T1362 | 492.18 | 286.09 | 698.26 | 1691.04 | 2115.82 | 1709.92 | |
| T1363 | 411.80 | 301.34 | 522.26 | 1510.73 | 1935.53 | 1529.61 | |
| T1364 | 400.05 | 442.28 | 357.82 | 1333.22 | 357.1 | 442.44 | |
| T1365 | 426.96 | 612.19 | 241.72 | 1157.07 | 1581.83 | 1175.95 | |
| T1366 | 540.19 | 791.58 | 288.79 | 978.93 | 1403.71 | 997.81 | |
| North | T1367 | 580.41 | 1305.85 | 758.17 | 407.49 | 798.60 | 535.15 |
| T1368 | 488.22 | 1573.5 | 1025.77 | 264.96 | 616.76 | 582.93 | |
| T1369 | 462.24 | 1751.7 | 1203.97 | 258.07 | 444.57 | 684.08 | |
| T1370 | 505.39 | 1931.42 | 1381.83 | 390.58 | 294.96 | 830.62 | |
| T1371 | 502.40 | 1928.28 | 1380.55 | 387.43 | 292.31 | 827.46 | |
| T1372 | 755.63 | 2288.46 | 1740.73 | 721.97 | 372.94 | 1171.97 | |
| T1373 | 924.65 | 2472.02 | 1924.29 | 913.54 | 506.87 | 1353.53 | |
| T1374 | 960.39 | 2532.78 | 1985.05 | 963.85 | 513.48 | 1403.84 | |
| T1375 | 800.02 | 2393.03 | 1845.29 | 823.26 | 349.53 | 1227.28 | |
| T1376 | 682.42 | 2295.39 | 1747.66 | 725.03 | 271.37 | 1050.87 | |
| T1377 | 619.00 | 2202.84 | 1655.11 | 632.03 | 356.82 | 868.14 | |
| T1378 | 629.72 | 2222.71 | 1669.97 | 676.33 | 524.63 | 688.20 | |
| T1379 | 617.11 | 2054.37 | 1501.38 | 630.37 | 702.00 | 518.95 | |
| T1380 | 613.41 | 1966.88 | 1413.89 | 543.60 | 881.24 | 415.39 | |
| T1381 | 676.30 | 2001.23 | 1448.24 | 613.08 | 1062.42 | 353.41 | |
| T1382 | 808.24 | 2108.58 | 1555.59 | 753.65 | 1247.11 | 423.97 |
References
- Isaac, T.; Zaslavsky, A.M.; Cleary, P.D.; Landon, B.E. The relationship between patients’ perception of care and measures of hospital quality and safety. Health Serv. Res. 2010, 45, 1024–1040. [Google Scholar] [CrossRef] [Green Version]
- Stein, S.M.; Day, M.; Karia, R.; Hutzler, L.; Bosco, J.A., III. Patients’ perceptions of care are associated with quality of hospital care: A survey of 4605 hospitals. Am. J. Med. Qual. 2015, 30, 382–388. [Google Scholar] [CrossRef]
- Beattie, M.; Murphy, D.J.; Atherton, I.; Lauder, W. Instruments to measure patient experience of healthcare quality in hospitals: A systematic review. Syst. Rev. 2015, 4, 97. [Google Scholar] [CrossRef] [Green Version]
- Darby, C.; Hays, R.D.; Kletke, P. Development and evaluation of the CAHPS® Hospital Survey. Health Serv. Res. 2005, 40, 1973. [Google Scholar] [CrossRef] [PubMed] [Green Version]
- Goldstein, E.; Farquhar, M.; Crofton, C.; Darby, C.; Garfinkel, S. Measuring hospital care from the patients’ perspective: An overview of the CAHPS® hospital survey development process. Health Serv. Res. 2005, 40, 1977–1995. [Google Scholar] [CrossRef] [PubMed] [Green Version]
- Fay, L.; Cai, H.; Real, K. A systematic literature review of empirical studies on decentralized nursing stations. HERD Health Environ. Res. Des. J. 2019, 12, 44–68. [Google Scholar] [CrossRef]
- MacAllister, L.; Zimring, C.; Ryherd, E. Exploring the Relationships between Patient Room Layout and Patient Satisfaction. HERD Health Environ. Res. Des. J. 2019, 12, 91–107. [Google Scholar] [CrossRef] [PubMed]
- MacAllister, L.; Zimring, C.; Ryherd, E. Environmental Variables That Influence Patient Satisfaction: A Review of the Literature. HERD Health Environ. Res. Des. J. 2016, 10, 155–169. [Google Scholar] [CrossRef] [PubMed]
- Freudenberger, D.C.; Baker, E.A.; Siljander, M.P.; Rohde, R.S. Factors driving patient perception of quality care after primary total hip and total knee arthroplasty. JAAOS Glob. Res. Rev. 2018, 2, e061. [Google Scholar] [CrossRef]
- Siddiqui, Z.K.; Zuccarelli, R.; Durkin, N.; Wu, A.W.; Brotman, D.J. Changes in patient satisfaction related to hospital renovation: Experience with a new clinical building. J. Hosp. Med. 2015, 10, 165–171. [Google Scholar] [CrossRef]
- Van Handel, K.; Krug, B. Prevalence and nature of call light requests on an orthopaedic unit. Orthop. Nurs. 1994, 13, 13–18, 20; discussion 18. [Google Scholar] [CrossRef]
- Tzeng, H.M.; Yin, C.Y. Are Call Light Use and Response Time Correlated with Inpatient Falls and Inpatient Dissatisfaction? J. Nurs. Care Qual. 2009, 24, 232–242. [Google Scholar] [CrossRef] [Green Version]
- Deitrick, L.; Bokovoy, J.; Stern, G.; Panik, A. Dance of the call bells—Using ethnography to evaluate patient satisfaction with quality of care. J. Nurs. Care Qual. 2006, 21, 316–324. [Google Scholar] [CrossRef]
- Lasiter, S. The Button. Clin. Nurs. Res. 2014, 23, 188–200. [Google Scholar] [CrossRef]
- Montie, M.; Shuman, C.; Galinato, J.; Patak, L.; Anderson, C.A.; Titler, M.G. Conduits to care: Call lights and patients’ perceptions of communication. J. Multidiscip. Healthc. 2017, 10, 359. [Google Scholar] [CrossRef] [Green Version]
- Meade, C.M.; Bursell, A.L.; Ketelsen, L. Effects of nursing rounds on patients’ call light use, satisfaction, and safety. Am. J. Nurs. 2006, 106, 58–70. [Google Scholar] [CrossRef] [PubMed]
- Tzeng, H.M. Perspectives of staff nurses of the reasons for and the nature of patient-initiated call lights: An exploratory survey study in four USA hospitals. BMC Health Serv. Res. 2010, 10, 52. [Google Scholar] [CrossRef] [PubMed] [Green Version]
- Tzeng, H.-M.; Titler, M.G.; Ronis, D.L.; Yin, C.-Y. The contribution of staff call light response time to fall and injurious fall rates: An exploratory study in four US hospitals using archived hospital data. BMC Health Serv. Res. 2012, 12, 84. [Google Scholar] [CrossRef] [PubMed] [Green Version]
- Tzeng, H.M.; Yin, C.Y. Relationship between call light use and response time and inpatient falls in acute care settings. J. Clin. Nurs. 2009, 18, 3333–3341. [Google Scholar] [CrossRef] [PubMed] [Green Version]
- Tzeng, H.M.; Ronis, D.L.; Yin, C.Y. Relationship of Actual Response Time to Call Lights and Patient Satisfaction at 4 US Hospitals. J. Nurs. Care Qual. 2012, 27, E1–E8. [Google Scholar] [CrossRef] [PubMed] [Green Version]
- Gersch, P. Initiating a patient service partner program. Nurs. Manag. 1996, 27, 46. [Google Scholar] [CrossRef]
- Miller, E.T.; Deets, C.; Miller, R.V. Nurse call and the work environment: Lessons learned. J. Nurs. Care Qual. 2001, 15, 7–15. [Google Scholar] [CrossRef]
- Murray, T.; Spence, J.; Bena, J.F.; Morrison, S.; Albert, N.M. Perceptions of reasons call lights are activated pre-and postintervention to decrease call light use. J. Nurs. Care Qual. 2010, 25, 366–372. [Google Scholar] [CrossRef] [PubMed]
- Culley, T. Reduce call light frequency with hourly rounds. Nurs. Manag. 2008, 39, 50–52. [Google Scholar] [CrossRef]
- Nelson, J.J.; Staffileno, B.A. Improving the patient experience: Call light intervention bundle. J. Pediatr. Nurs. 2017, 36, 37–43. [Google Scholar] [CrossRef]
- Pati, D.; Harvey, T.E., Jr.; Redden, P.; Summers, B.; Pati, S. An empirical examination of the impacts of decentralized nursing unit design. HERD Health Environ. Res. Des. J. 2015, 8, 56–70. [Google Scholar] [CrossRef]
- Friese, C.R.; Grunawalt, M.J.C.; Bhullar, S.; Bihlmeyer, M.K.; Chang, R.; Wood, M.W. Pod nursing on a medical/surgical unit: Implementation and outcomes evaluation. J. Nurs. Adm. 2014, 44, 207. [Google Scholar] [CrossRef] [Green Version]
- Gurascio-Howard, L.; Malloch, K. Centralized and Decentralized Nurse Station Design: An Examination of Caregiver Communication, Work Activities, and Technology. Herd-Health Environ. Res. Des. J. 2007, 1, 44–57. [Google Scholar] [CrossRef]
- Donahue, L. A pod design for nursing assignments. AJN Am. J. Nurs. 2009, 109, 38–40. [Google Scholar] [CrossRef]
- Hua, Y.; Becker, F.; Wurmser, T.; Bliss-Holtz, J.; Hedges, C. Effects of Nursing Unit Spatial Layout on Nursing Team Communication Patterns, Quality of Care, and Patient Safety. HERD Health Environ. Res. Des. J. 2012, 6, 8–38. [Google Scholar] [CrossRef]
- Cai, H.; Spreckelmeyer, K. The Continuous Learning Cycle: A Multi-Phase Post-Occupancy Evaluation (POE) of Decentralized Nursing Unit Design. HERD Health Environ. Res. Des. J. 2021. under review. [Google Scholar]
- Lu, Y.; Ossmann, M.M.; Leaf, D.E.; Factor, P.H. Patient visibility and ICU mortality: A conceptual replication. HERD Health Environ. Res. Des. J. 2014, 7, 92–103. [Google Scholar] [CrossRef] [PubMed]
- Lim, L.; Zimring, C.M. A Conceptual Visibility Framework for Linking Spatial Metrics with Experience and Organizational Outcomes. HERD Health Environ. Res. Des. J. 2020, 13, 225–239. [Google Scholar] [CrossRef]
- Pettit, N.R.; Wood, T.; Lieber, M.; O’Mara, M.S. Intensive care unit design and mortality in trauma patients. J. Surg. Res. 2014, 190, 640–646. [Google Scholar] [CrossRef] [PubMed]
- Cai, H.; Zimring, C. Correlating Spatial Metrics of Nurse Station Typology with Nurses’ Communication and Co-Awareness in an Intensive Care Unit. In Development of Tools for Healthcare Environments Research and Practice; Environmental Design Research Association: Pinole, CA, USA, 2013; pp. 25–29. [Google Scholar]
- Cai, H.; Zimring, C. Out of sight, out of reach: Correlating spatial metrics of nurse station typology with nurses’ communication and co-awareness in an intensive care unit. In Proceedings of the 8th International Space Syntax Symposium, Santiago, Chile, 3–6 January 2012; pp. 381–391. [Google Scholar]
- Peavey, E.; Cai, H. A Systems Framework for Understanding the Environment’s Relation to Clinical Teamwork: A Systematic Literature Review of Empirical Studies. Environ. Behav. 2020, 52, 726–760. [Google Scholar] [CrossRef]
- Hendrich, A.; Chow, M.P.; Bafna, S.; Choudhary, R.; Heo, Y.; Skierczynski, B.A. Unit-Related Factors That Affect Nursing Time with Patients: Spatial Analysis of the Time and Motion Study. HERD Health Environ. Res. Des. J. 2009, 2, 5–20. [Google Scholar] [CrossRef] [PubMed]
- Hillier, B. Space Is the Machine: A Configurational Theory of Architecture; Cambridge University Press: Cambridge, UK, 1996. [Google Scholar]
- Haq, S.; Luo, Y. Space syntax in healthcare facilities research: A review. HERD Health Environ. Res. Des. J. 2012, 5, 98–117. [Google Scholar] [CrossRef] [PubMed]
- Centers for Medicare & Medicaid Services. Baltimore, MD, USA. Available online: https://www.hcahpsonline.org (accessed on 27 June 2021).
- Medicare.gov. Available online: https://www.medicare.gov/care-compare/ (accessed on 27 June 2021).
- Turner, A. Depthmap 4: A Researcher’s Handbook; Barlett School of Graduate Studies, UCL: London, UK, 2004. [Google Scholar]
- Fields, A. Discovering Statistics Using IBM SPSS Statistics, 4th ed.; Sage Publications: London, UK, 2013. [Google Scholar]
- HCAHPS. HCAHPS Percentiles Table. HCAHPS Tables on HCAHPS On-Line. Available online: https://www.hcahpsonline.org/en/summary-analyses/#PercentileTable (accessed on 27 June 2021).
- Beckwith, N.E.; Kassarjian, H.H.; Lehmann, D.R. Halo effects in marketing research: Review and prognosis. ACR N. Am. Adv. 1978, 5, 465–467. [Google Scholar]
- Fullam, F.; Garman, A.; Johnson, T.; Hedberg, E. The Use of Patient Satisfaction Surveys and Alternative Coding Procedures to Predict Malpractice Risk. Med. Care 2009, 47, 553–559. Available online: www.jstor.org/stable/40221917 (accessed on 30 June 2021). [CrossRef] [PubMed]
| Meta-Theme | Question [Source] | 9 South Atrium Top Box Score | 9 South Atrium Number of Patient Surveys | 13 East Tower Top Box Score | 13 East Tower Number of Patient Surveys | Difference between Atrium and Tower Top Box Score | Chi-Square Value (All Significant at 0.00 Level, 2-Sided Asymptotic Test Unless Otherwise Noted) |
|---|---|---|---|---|---|---|---|
| Responsiveness | (Nurses) Promptness in responding to the call button [PG] | 51% | 1818 | 65.8% | 5334 | 14.8% | 126 |
| During the hospital stay, after you pressed the call button, how often did you get help as soon as you wanted? [HCAHPS] | 49.9% | 1708 | 63.2% | 4871 | 13.3% | 92.8 | |
| How often did you get help in getting to the bathroom or using a bedpan as soon as you wanted? [HCAHPS] | 61.6% | 1161 | 73.7% | 3925 | 12.1% | 63.3 | |
| Nurses | Friendliness/courtesy of the nurses [PG] | 74.7% | 1943 | 83.3% | 5642 | 8.6% | 69.5 |
| Nurses’ attitude toward your requests [PG] | 66.44% | 1903 | 78.1% | 5580 | 11.66% | 104.5 | |
| (Nurses) Amount of attention paid to your special or personal needs [PG] | 63.1% | 1900 | 75.5% | 5560 | 12.4% | 110 | |
| How well the nurses kept you informed [PG] | 61.5% | 1918 | 74.8% | 5597 | 13.3% | 122.8 | |
| Skill of the nurses [PG] | 72.3% | 1908 | 81.8% | 5572 | 9.5% | 78.5 | |
| During this hospital stay, how often did nurses treat you with courtesy and respect? [HCAHPS] | 81.2% | 1967 | 89.5% | 5759 | 8.3% | 90.7 | |
| During this hospital stay, how often did nurses listen carefully to you? [HCAHPS] | 69% | 1963 | 81.1% | 5754 | 12.1% | 125.7 | |
| During this hospital stay, how often did nurses explain things in a way you could understand? [HCAHPS] | 72% | 1961 | 81.9% | 5746 | 9.9% | 88.4 | |
| Physicians | Time physician spent with you [PG] | 41.3% | 1866 | 50.4% | 5438 | 9.1% | 46.3 |
| Physician’s concern for your questions and worries [PG] | 56% | 1851 | 64.2% | 5388 | 8.2% | 39.6 | |
| How well physician kept you informed [PG] | 56% | 1855 | 64.8% | 5393 | 8.8% | 45.5 | |
| Friendliness/courtesy of the physician [PG] | 66.5% | 1868 | 74.8% | 5446 | 8.3% | 47.2 | |
| Skill of physician [PG] | 83.7% | 1860 | 89.1% | 5438 | 5.4% | 38.3 | |
| During this hospital stay, how often did doctors treat you with courtesy and respect? [HCAHPS] | 85.3% | 1948 | 90.8% | 5716 | 5.5% | 47.6 | |
| During this hospital stay, how often did doctors listen carefully to you? [HCAHPS] | 75.8% | 1943 | 83% | 5696 | 7.2% | 49.5 | |
| During this hospital stay, how often did doctors explain things in a way you could understand? [HCAHPS] | 75.2% | 1940 | 82.4% | 5690 | 7.2% | 47.9 | |
| Pain | How well your pain was controlled? [PG] | 64.1% | 1925 | 74.1% | 5667 | 10% | 70 |
| During this hospital stay, how often was your pain well-controlled? [HCAHPS] | 64.9% | 1864 | 70.9% | 4293 | 6% | 22.1 | |
| During this hospital stay, how often did the hospital staff do everything they could to help you with your pain? [HCAHPS] | 77.4% | 1865 | 84.9% | 4291 | 7.5% | 50.6 | |
| Room | Pleasantness of room décor [PG] | 37.1% | 1926 | 67.8% | 5616 | 30.7% | 561 |
| Courtesy of person who cleaned your room [PG] | 59% | 1696 | 76% | 5193 | 17% | 182.5 | |
| Room cleanliness [PG] | 50.3% | 1913 | 75.5% | 5588 | 25.2% | 422.4 | |
| Room temperature [PG] | 48.6% | 1902 | 67.6% | 5570 | 19% | 218.9 | |
| Noise level in and around your room [PG] | 39.3% | 1878 | 65.4% | 5525 | 26.1% | 395.7 | |
| During this hospital stay, how often were your room and bathroom kept clean? [HCAHPS] | 63.4% | 1925 | 80.4% | 5711 | 17% | 228.9 | |
| During the hospital stay, how often was the area around your room quiet at night [HCAHPS] | 51.1% | 1951 | 73.9% | 5735 | 22.8% | 350.1 | |
| Admission | Speed of admission process [PG] | 74.8% | 1946 | 77.9% | 5606 | 3.1% | 8.1 |
| Courtesy of the person who admitted you [PG] | 84.2% | 1805 | 85.8% | 5348 | 1.6% | 3 * | |
| Discharge | Extent to which you felt ready to be discharged [PG] | 61.1% | 1925 | 71.1% | 5659 | 10% | 65.9 |
| Speed of discharge process [PG] | 54.4% | 1915 | 64.4% | 5618 | 10% | 60.4 | |
| Home Care | Instructions given about how to care for yourself at home [PG] | 65.1% | 1889 | 74.9% | 5592 | 9.8% | 68.4 |
| During this hospital stay, did doctors, nurses or other hospital staff talk with you about whether you would have the help you needed when you left the hospital? [HCAHPS] | 43.2% | 1386 | 49.7% | 4143 | 6.5% | 17.6 | |
| Overall Assessment | How well staff worked together to care for you [PG] | 68.8% | 1920 | 79.7% | 5673 | 10.9% | 95.2 |
| Likelihood of your recommending this hospital to others [PG] | 73.3% | 1937 | 85.3% | 5684 | 12% | 144.2 | |
| Overall rating of care given at hospital [PG] | 71.8% | 1932 | 83.3% | 5675 | 11.5% | 120.8 | |
| Using any number from 0 to 10, where 0 is the worst hospital possible and 10 is the best hospital possible, what number would you use to rate the hospital during your stay? [HCAHPS] | 69.2% | 1966 | 84.1% | 5751 | 14.9% | 204 | |
| Would you recommend this hospital to your friends and family? [HCAHPS] | 77.3% | 1969 | 87.5% | 5745 | 10.2% | 120.1 | |
| Medication, Tests and Treatment | Waiting time for test and treatment [PG] | 51.4% | 1788 | 65.6% | 5103 | 14.2% | 113.1 |
| Explanations about what would happen during tests and treatments [PG] | 58.9% | 1773 | 71.7% | 5090 | 12.8% | 100.4 | |
| Courtesy of the person who took your blood [PG] | 69% | 1900 | 78.9% | 5430 | 9.9% | 75 | |
| Courtesy of person who started the IV [PG] | 70.1% | 1871 | 79.9% | 5433 | 9.8% | 76.4 | |
| Before giving any new medicine, how often did hospital staff tell you what the medicine was for? [HCAHPS] | 74.8% | 1403 | 80.4% | 4194 | 5.6% | 19.7 | |
| Before giving any new medicine, how often did hospital staff describe possible side effects in a way you could understand? [HCAHPS] | 43.2% | 1386 | 49.7% | 4143 | 6.5% | 17.6 | |
| Meals | Temperature of the food (cold foods cold, hot foods hot) [PG] | 35.9% | 1908 | 42.2% | 5547 | 6.3% | 23.6 |
| Quality of food [PG] | 29.9% | 1890 | 35.7% | 5511 | 5.8% | 21.1 | |
| Courtesy of the person who served your food [PG] | 61.9% | 1880 | 67.4% | 6474 | 5.5% | 19.2 | |
| Visitors and Family | Accommodations and comfort for visitors [PG] | 51.8% | 1903 | 73.2% | 5499 | 21.4% | 296.4 |
| Staff attitude toward your visitors [PG] | 66.8% | 1874 | 81.3% | 5463 | 14.5% | 167.9 | |
| Personal Issues | Staff concern for your privacy [PG] | 63% | 1907 | 75.4% | 5648 | 12.4% | 109.7 |
| Degree to which staff addressed your emotional needs [PG] | 57.7% | 1782 | 69% | 5351 | 11.3% | 76.2 | |
| Response to concerns/complaints made during your stay [PG] | 58% | 1733 | 70.3% | 5191 | 12.3% | 88.7 | |
| Staff efforts to include you in decisions about your treatment [PG] | 57.8% | 1746 | 69.5% | 5297 | 11.7% | 80.6 |
| (a) Press Ganey Question: Pleasantness of Room Décor numerical values. | |||||||||||
| Question (Press Ganey) | Pleasantness of RoomDécor | ||||||||||
| Answer category | Very poor | Poor | Fair | Good | Very good | ||||||
| Numerical value assigned | 1 | 2 | 3 | 4 | 5 | ||||||
| Numerical value recoded as top box value | 0 | 0 | 0 | 0 | 1 | ||||||
| (b) HCAHPS Question: During This hospital stay, how often were your room and bathroom kept clean? Numerical values | |||||||||||
| Question (HCAHPS) | During This Hospital Stay, How Often Were Your Room and Bathroom Kept Clean? | ||||||||||
| Answer category | Never | Sometimes | Usually | Always | |||||||
| Numerical value assigned | 1 | 2 | 3 | 4 | |||||||
| Numerical value recoded as top box value | 0 | 0 | 0 | 1 | |||||||
| (c) HCAHPS Question: What number would you use to rate this hospital during your stay numerical values | |||||||||||
| Question (HCAHPS) | Using Any Number from 0 to 10, Where 0 is the Worst Possible Hospital and 10 is the Best Hospital Possible, What Number Would You Use to Rate This Hospital during Your Stay? | ||||||||||
| Answer category | 0—Worst hospital possible | 1 | 2 | 3 | 4 | 5 | 6 | 7 | 8 | 9 | 10—Best hospital possible |
| Numerical value assigned | 1 | 2 | 3 | 4 | 5 | 6 | 7 | 8 | 9 | 10 | 11 |
| Numerical value recoded as top box value | 0 | 0 | 0 | 0 | 0 | 0 | 0 | 0 | 0 | 1 | 1 |
| (d) HCAHPS Question: Would you recommend this hospital to your friends and family? Numerical values | |||||||||||
| Question (HCAHPS) | Would You Recommend this Hospital to Your Friends and Family? | ||||||||||
| Answer categories | Definitely no | Probably no | Probably yes | Definitely yes | |||||||
| Numerical value assigned | 1 | 2 | 3 | 4 | |||||||
| Numerical value recoded as top box value | 0 | 0 | 0 | 1 | |||||||
| 9 South Atrium | 13 East Tower | Pearson Chi-Square Value | Significance | |
|---|---|---|---|---|
| Male | 40.8% (n = 811) | 43.9% (n = 2486) | 6.1 | 0.013 |
| Female | 59.2% (n = 1990) | 56.1% (n = 5657) | ||
| High school graduate or less | 23.7% (n = 461) | 19.6% (n = 1101) | 22.5 | 0.000 |
| Some college | 30.6% (n = 594) | 29.1% (n = 1639) | ||
| College graduate | 17.7% (n = 345) | 20.5% (n = 1156) | ||
| Graduate study | 28.0% (n = 544) | 30.8% (n = 1731) | ||
| Race: white | 83.6% (n = 1663) | 82.9% (n = 2815) | 0.55 | 0.459 |
| Race: non-white | 16.4% (n = 326) | 17.1% (n = 994) |
| 9 South Atrium | 13 East Tower | ANOVA F Value | Significance | |
|---|---|---|---|---|
| Patient age | 61.8 (n = 1990) | 63.7 (n = 5774) | 42.8 | 0.000 |
| Length of stay | 2.7 (n = 1941) | 2.1 (n = 5809) | 158.8 | 0.000 |
| Variable | Promptness of Response to Call Light (PG) | Call Button Help Soon as Wanted (HCAHPS) | Help Toileting as Soon as You Wanted (HCAHPS) | |
|---|---|---|---|---|
| Visual Step Depth Integration Average Home-Base NS | Pearson r | −0.010 | 0.003 | −0.024 |
| Significance (two-tailed) | 0.450 | 0.830 | 0.140 | |
| N | 5333 | 4870 | 3924 | |
| Visual Integration Value | Pearson r | 0.013 | 0.001 | 0.018 |
| Significance (2-trailed) | 0.346 | 0.951 | 0.251 | |
| N | 5333 | 4870 | 3924 | |
| Metric Step Depth Average Home-Base NS | Pearson r | −0.029 * | −0.011 | −0.033 * |
| Significance (two-tailed) | 0.032 | 0.443 | 0.037 | |
| N | 5333 | 4870 | 3924 |
Publisher’s Note: MDPI stays neutral with regard to jurisdictional claims in published maps and institutional affiliations. |
© 2021 by the authors. Licensee MDPI, Basel, Switzerland. This article is an open access article distributed under the terms and conditions of the Creative Commons Attribution (CC BY) license (https://creativecommons.org/licenses/by/4.0/).
Share and Cite
Cai, H.; Fullam, F.; MacAllister, L.; Fogg, L.F.; Canar, J.; Press, I.; Weissman, C.; Velasquez, O. Impact of Inpatient Unit Design Features on Overall Patient Experience and Perceived Room-Level Call Button Response. Int. J. Environ. Res. Public Health 2021, 18, 9747. https://doi.org/10.3390/ijerph18189747
Cai H, Fullam F, MacAllister L, Fogg LF, Canar J, Press I, Weissman C, Velasquez O. Impact of Inpatient Unit Design Features on Overall Patient Experience and Perceived Room-Level Call Button Response. International Journal of Environmental Research and Public Health. 2021; 18(18):9747. https://doi.org/10.3390/ijerph18189747
Chicago/Turabian StyleCai, Hui, Francis Fullam, Lorissa MacAllister, Louis F. Fogg, Jeff Canar, Irwin Press, Connie Weissman, and Olivia Velasquez. 2021. "Impact of Inpatient Unit Design Features on Overall Patient Experience and Perceived Room-Level Call Button Response" International Journal of Environmental Research and Public Health 18, no. 18: 9747. https://doi.org/10.3390/ijerph18189747
APA StyleCai, H., Fullam, F., MacAllister, L., Fogg, L. F., Canar, J., Press, I., Weissman, C., & Velasquez, O. (2021). Impact of Inpatient Unit Design Features on Overall Patient Experience and Perceived Room-Level Call Button Response. International Journal of Environmental Research and Public Health, 18(18), 9747. https://doi.org/10.3390/ijerph18189747