
COVID-19 Risk Mapping with Considering Socio-Economic Criteria Using Machine Learning Algorithms


 and
and
Abstract
:1. Introduction
2. Materials and Methods
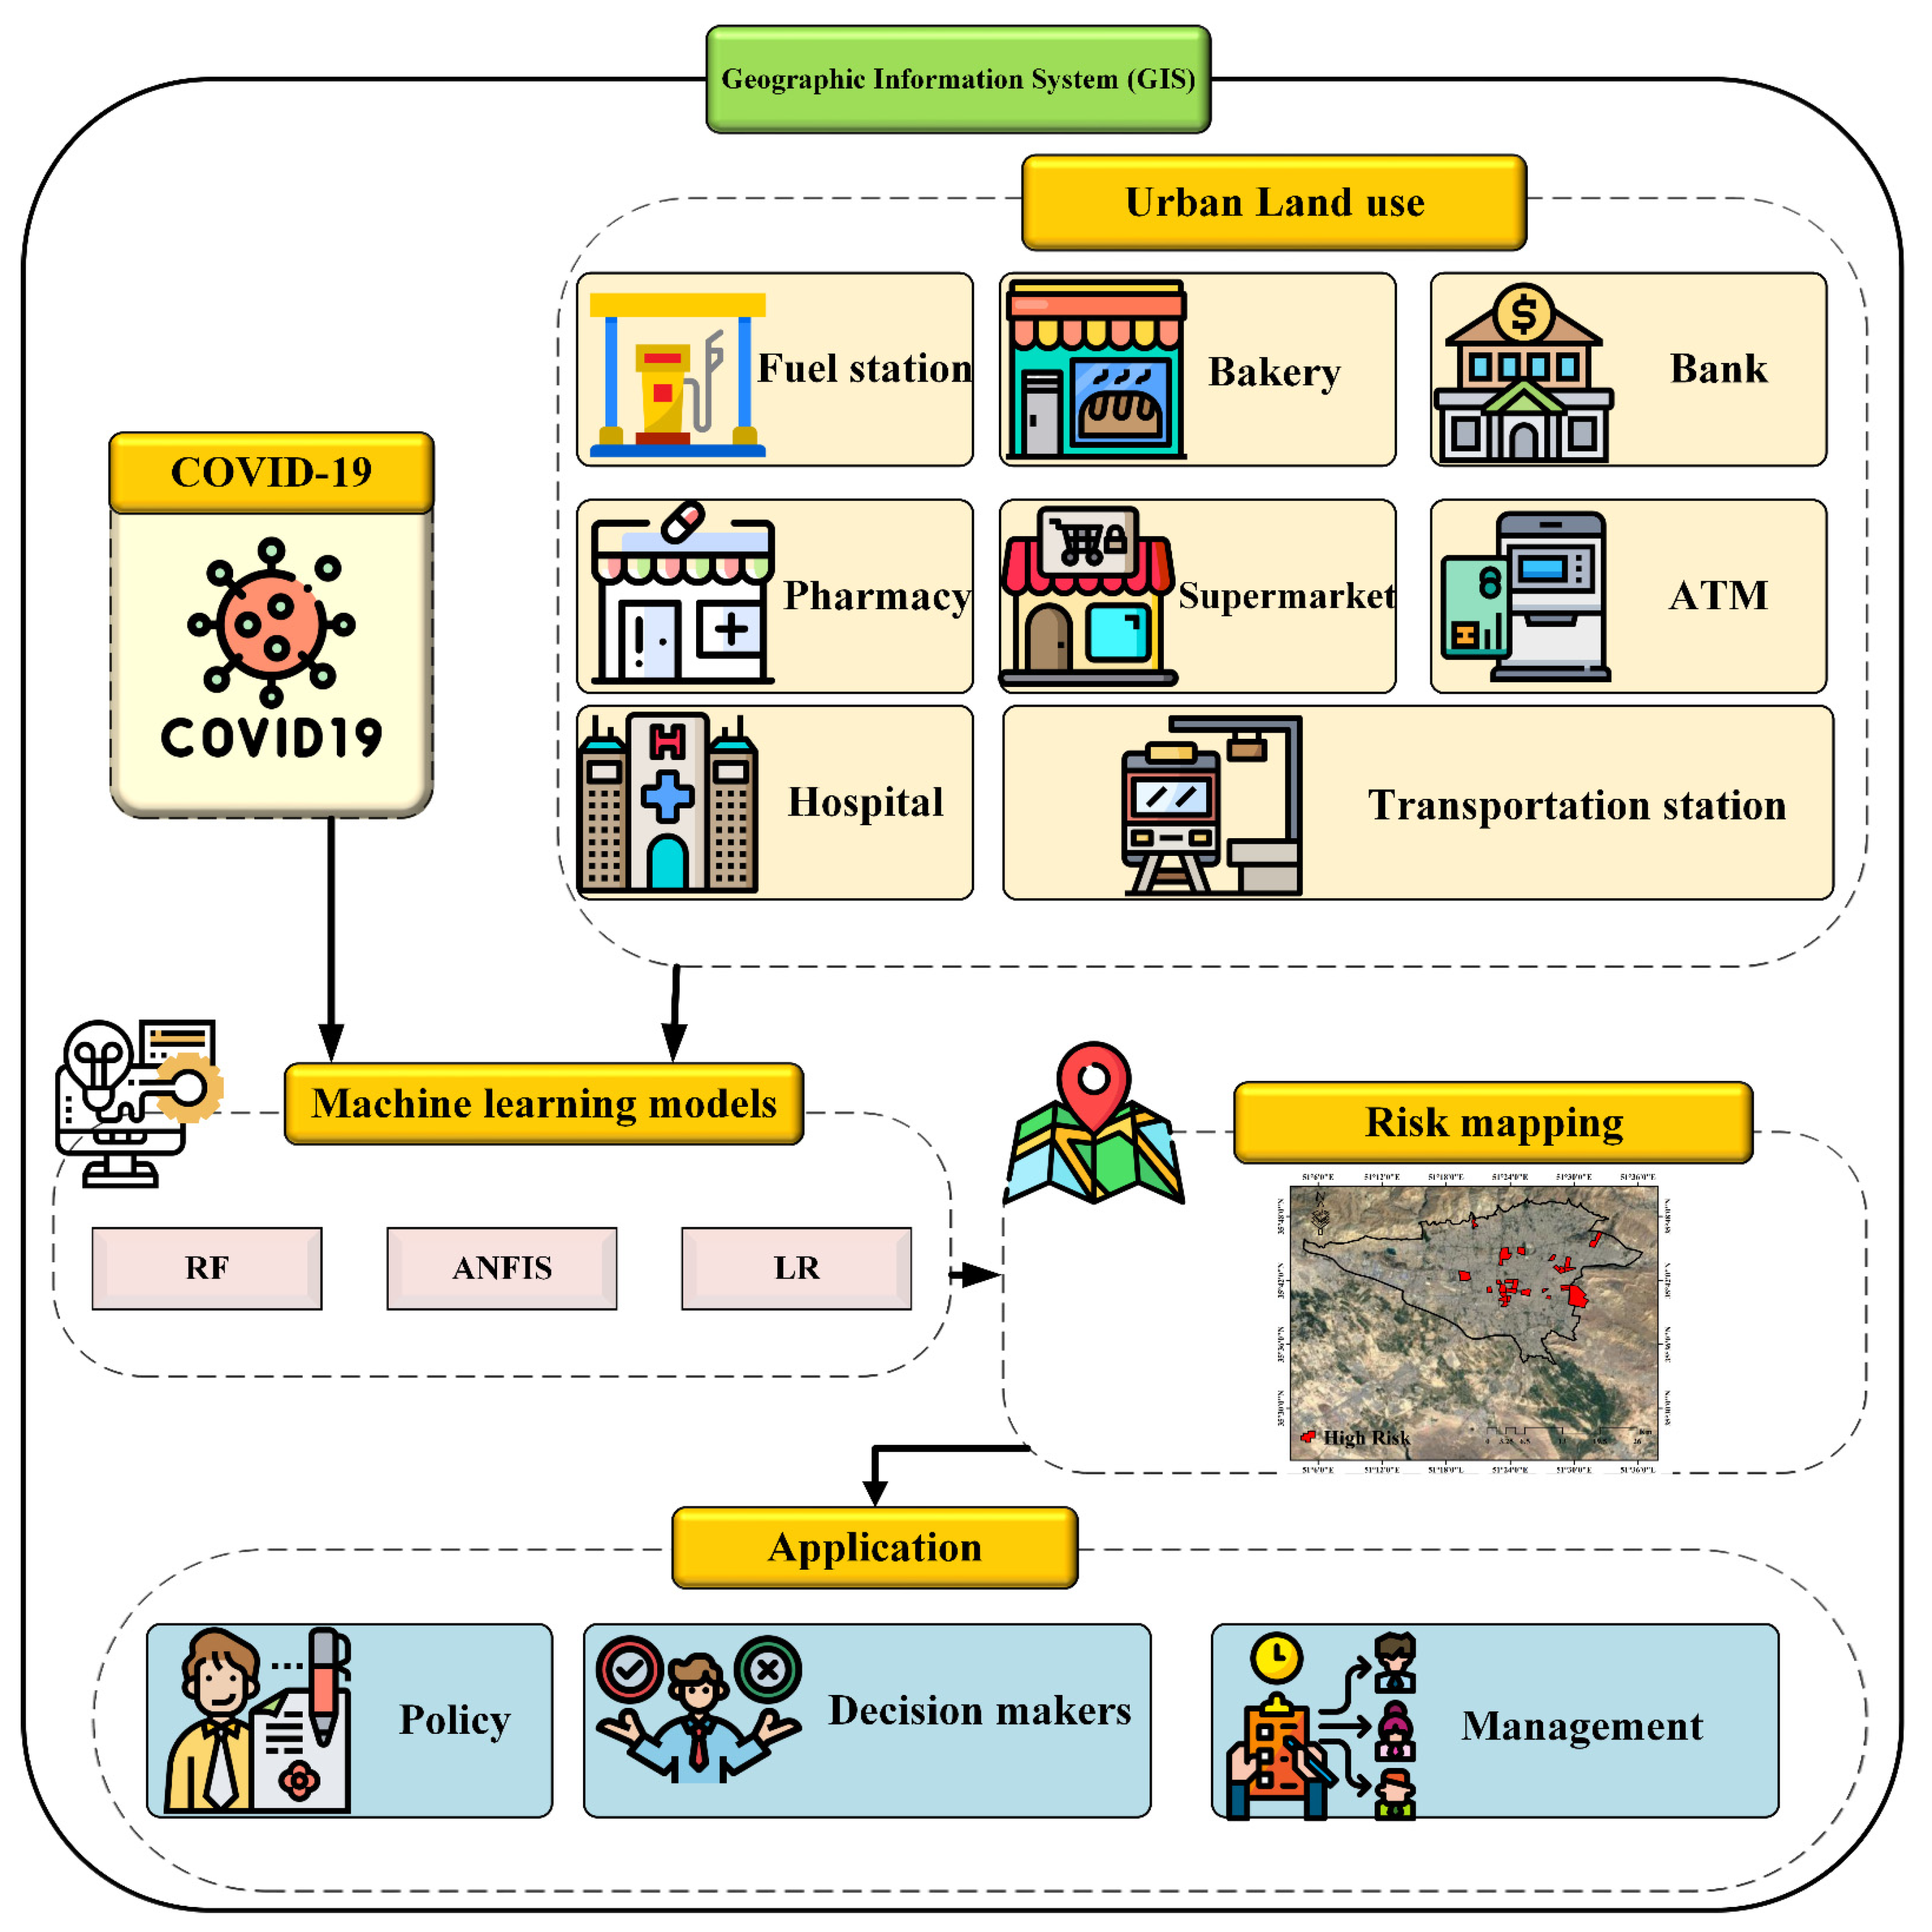
2.1. Methodology
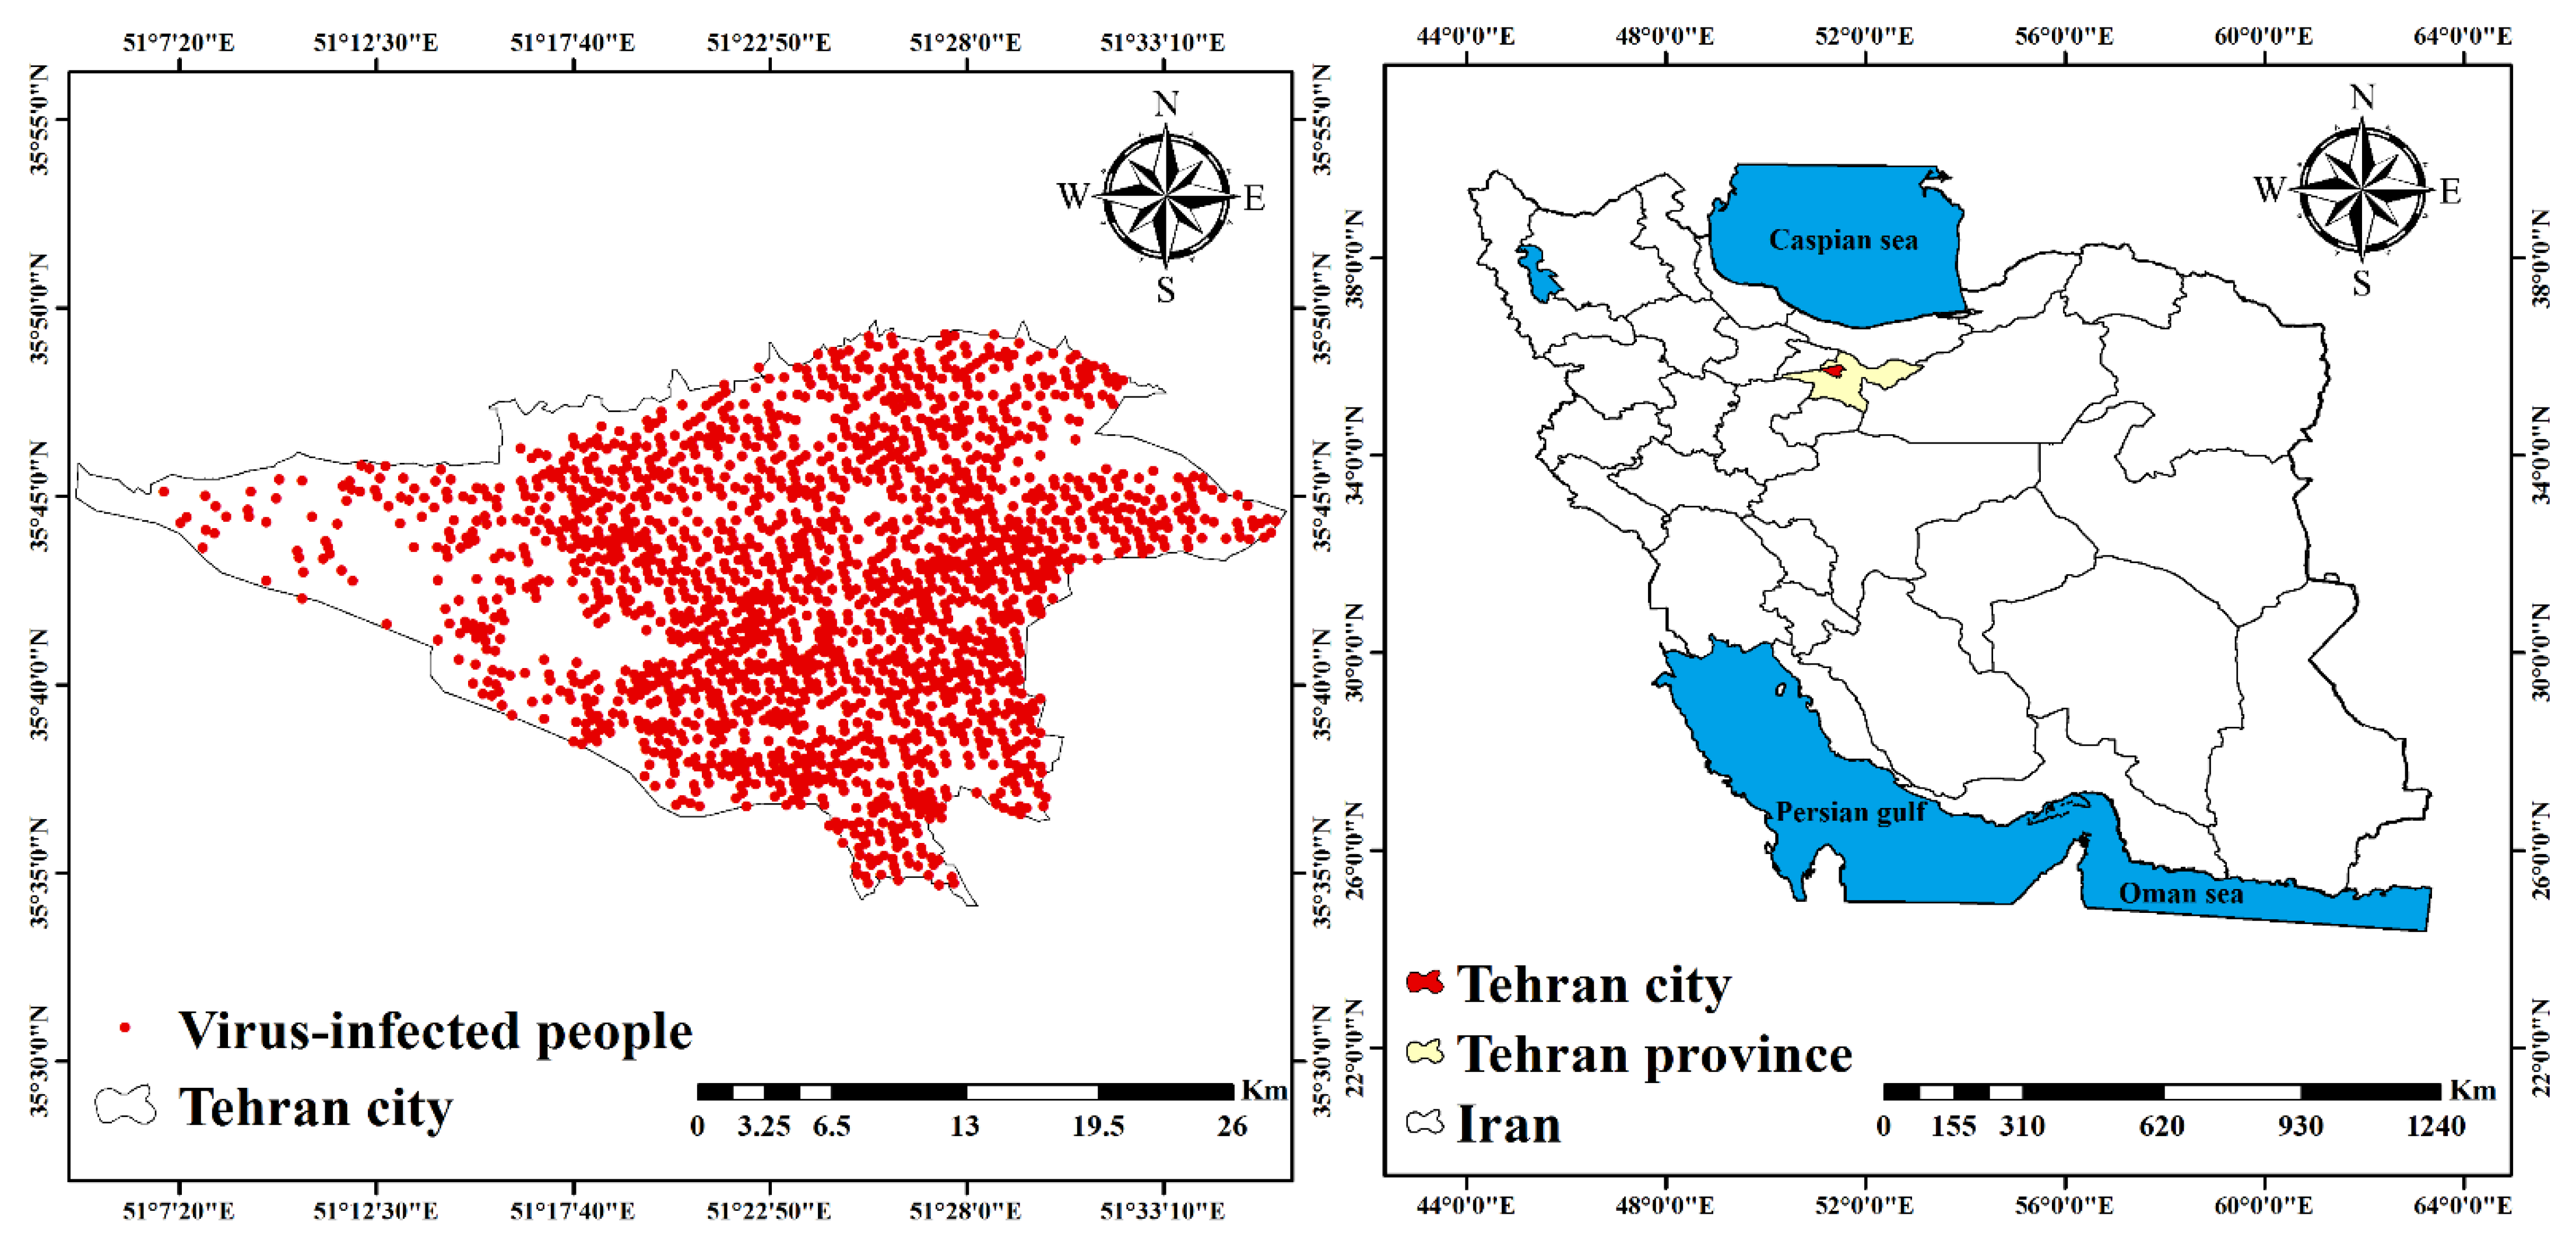
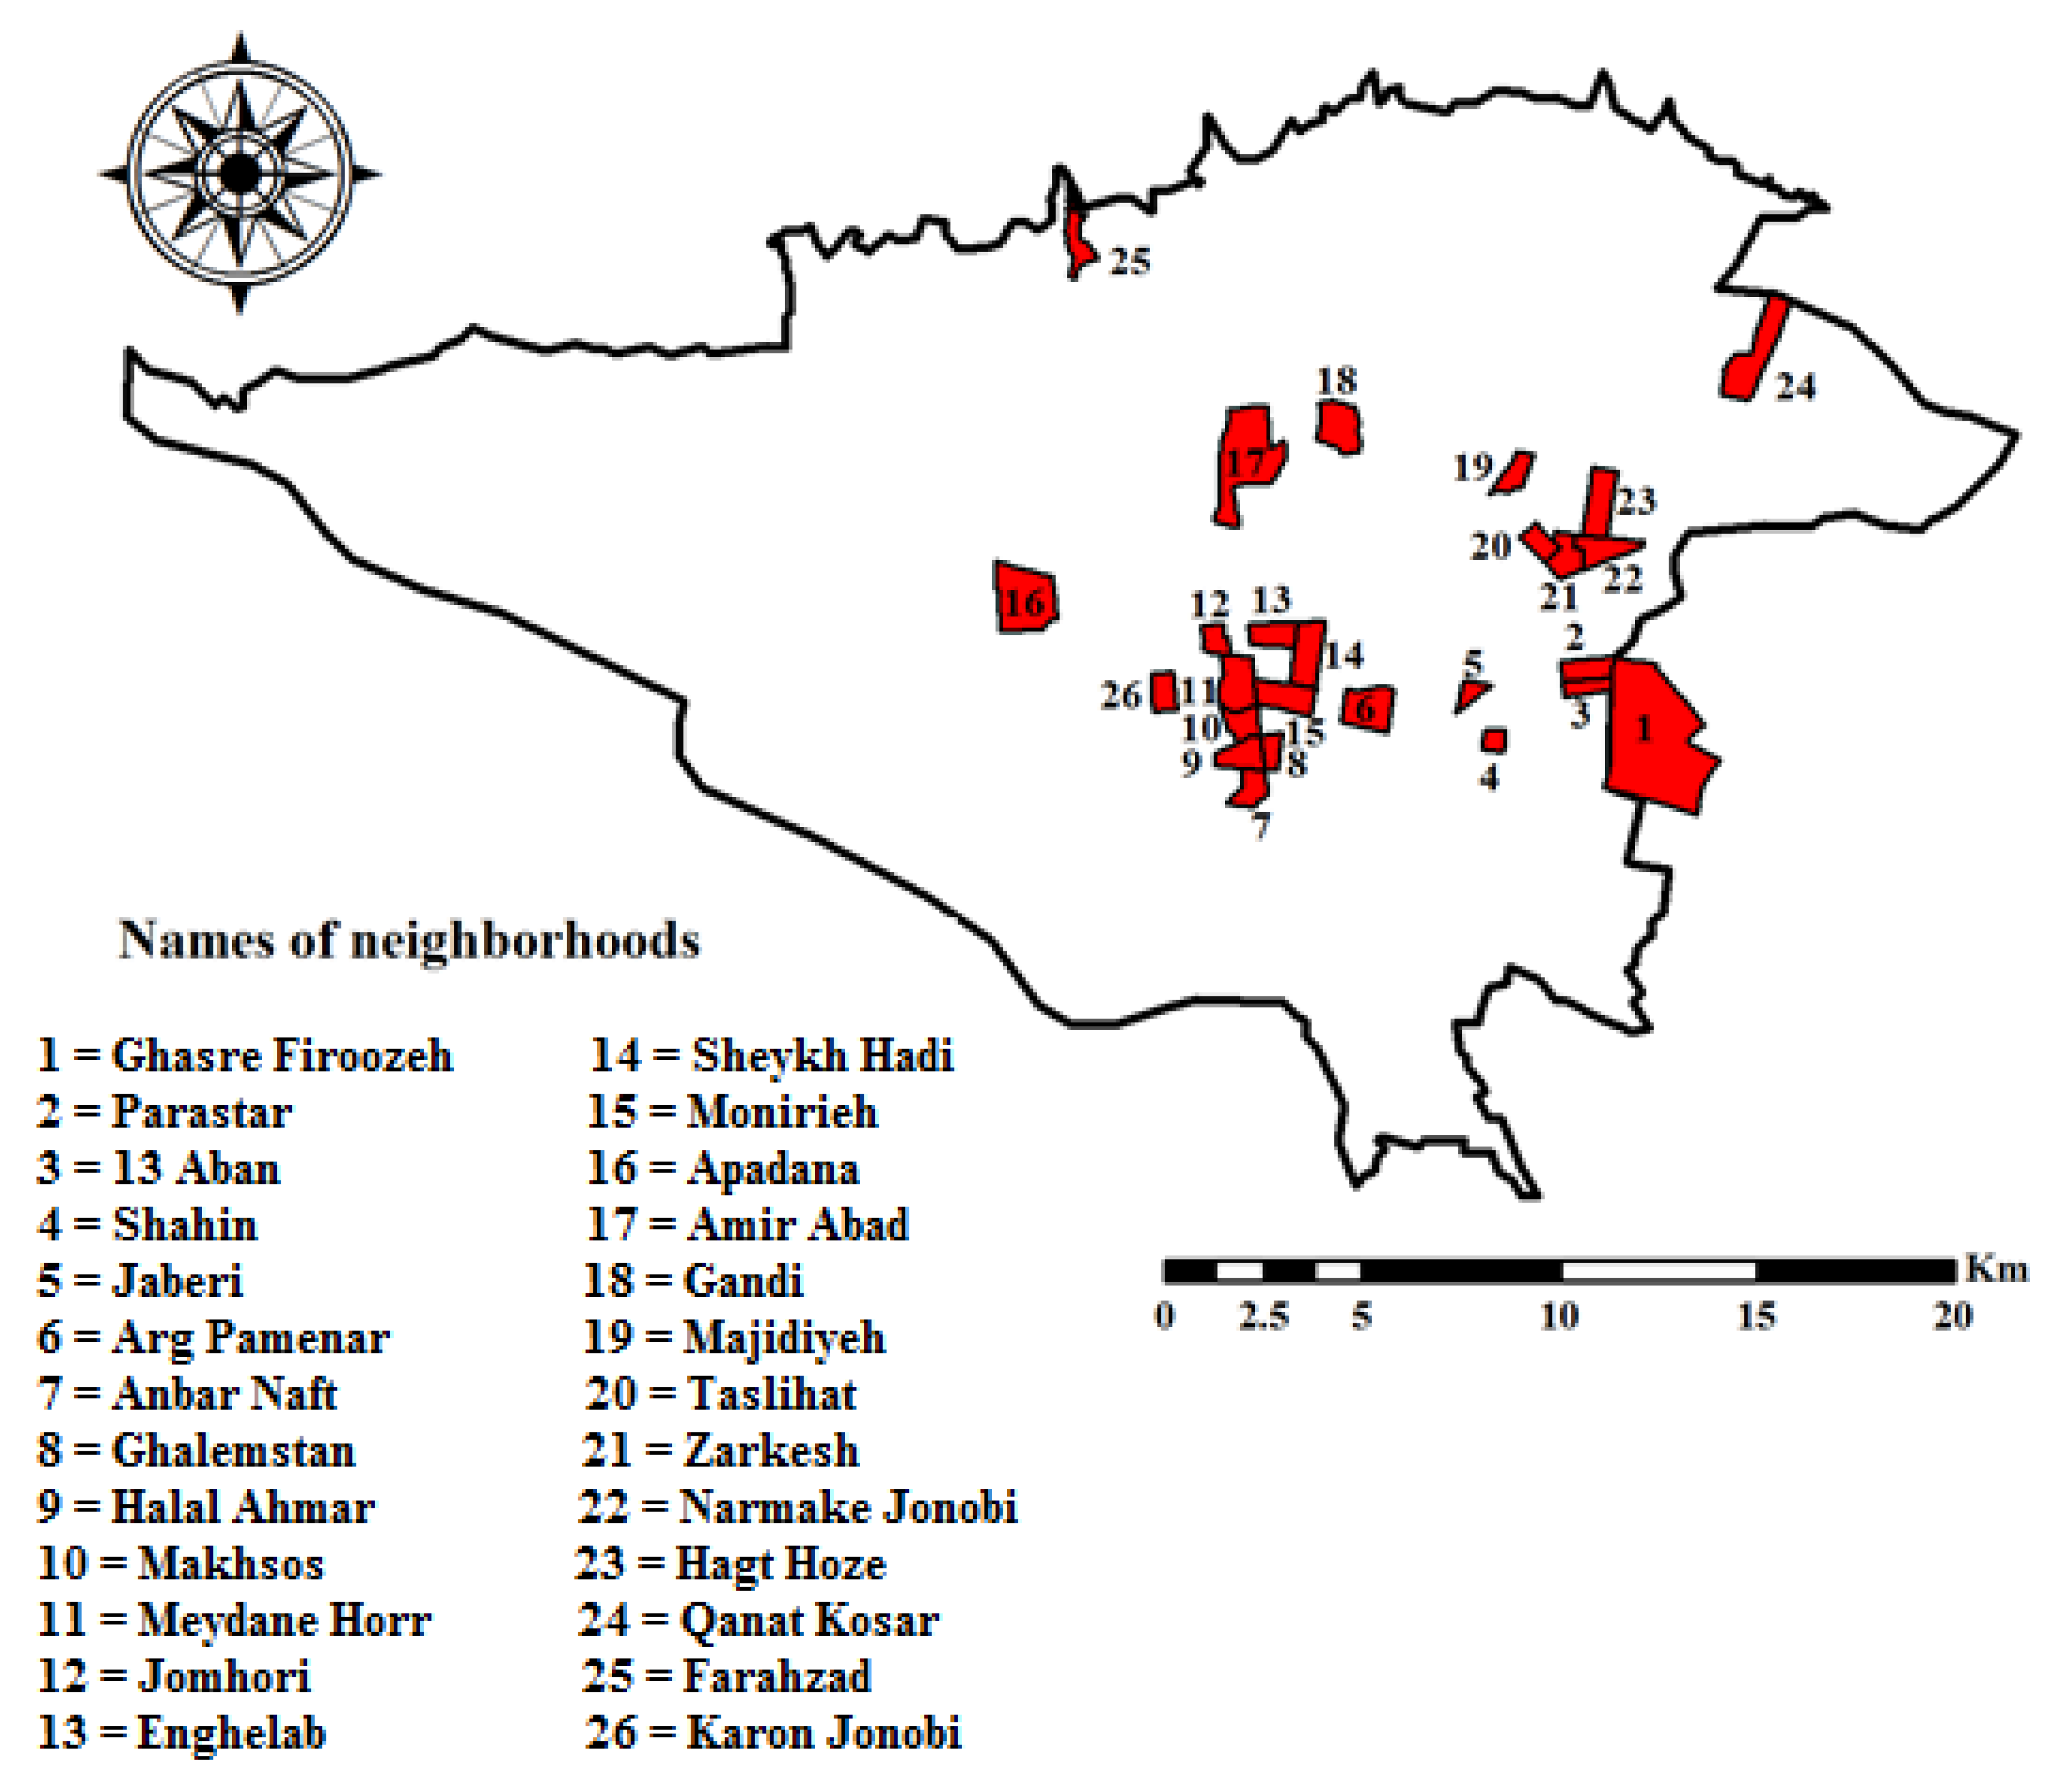
2.2. Study Area
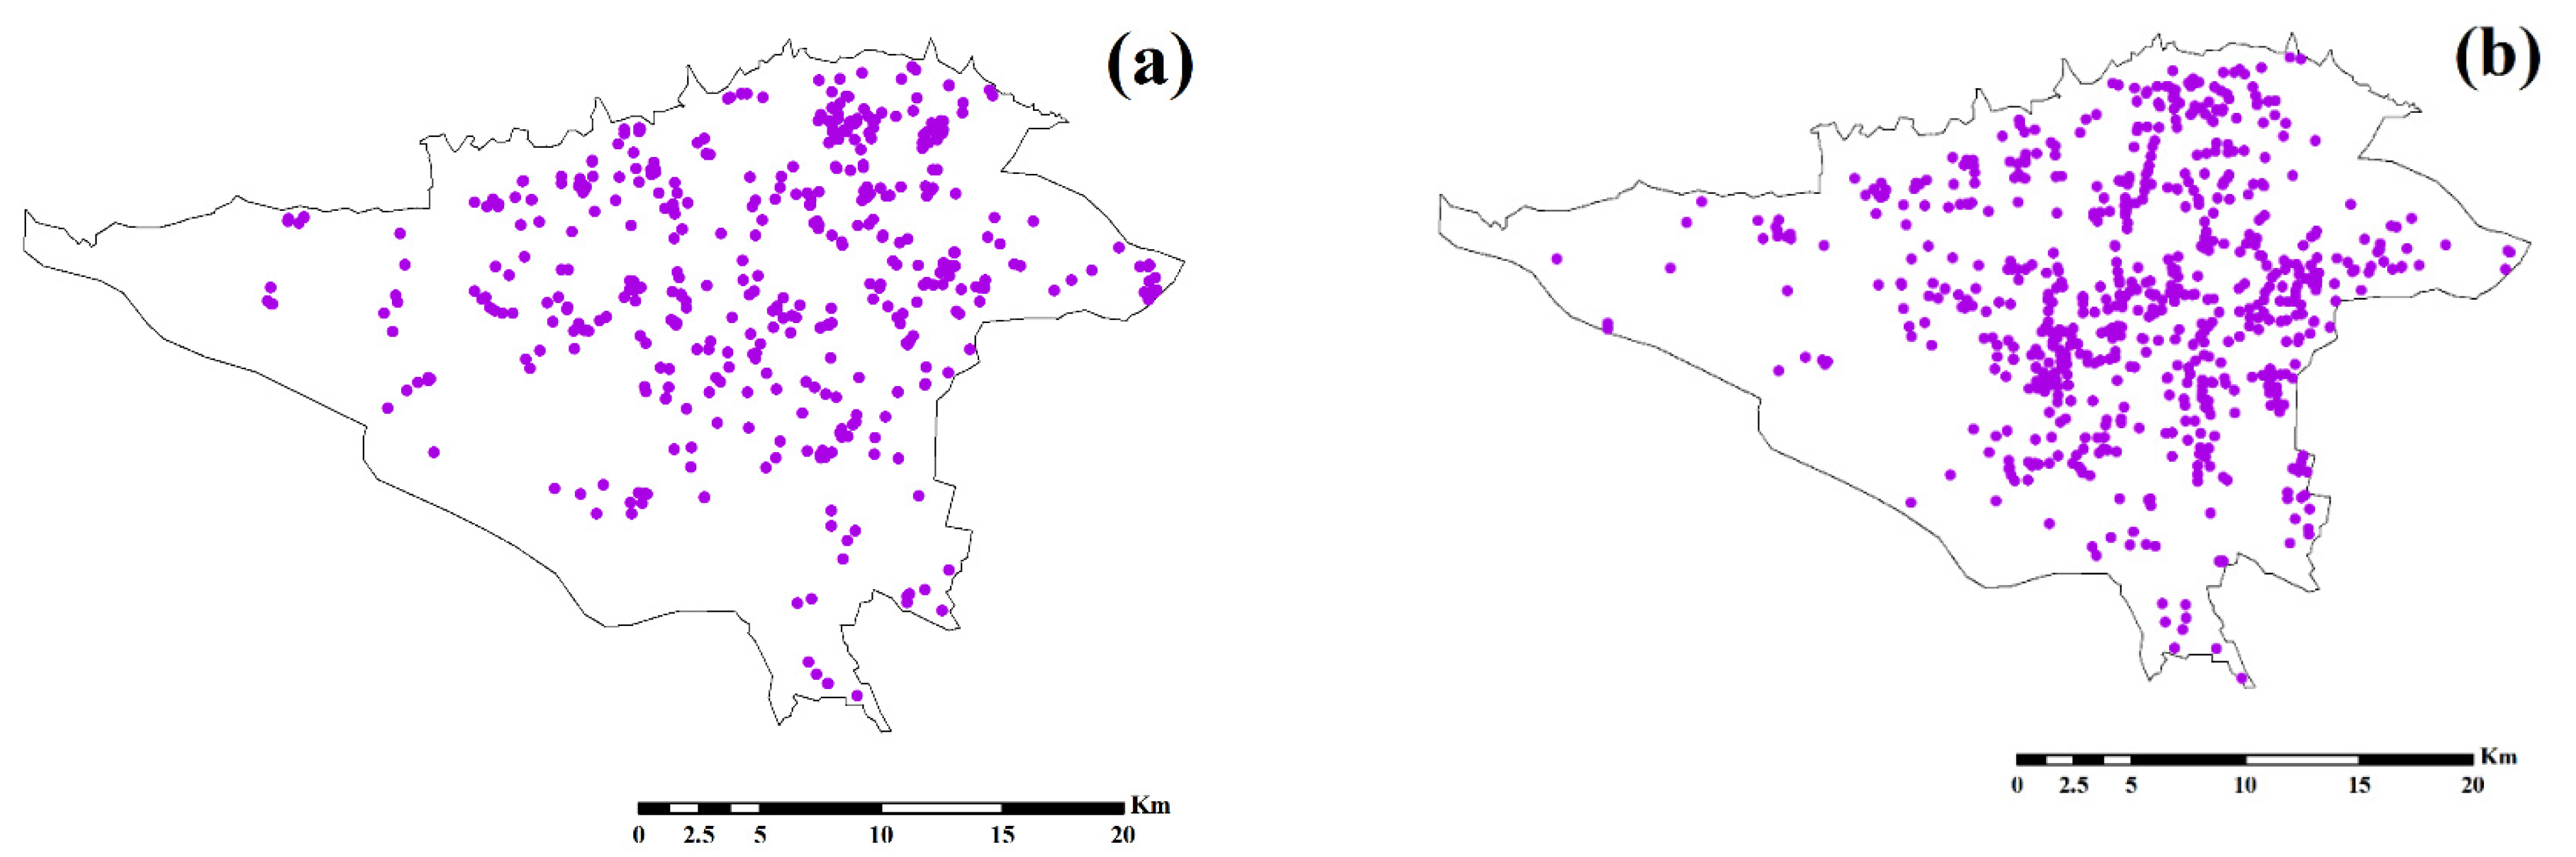
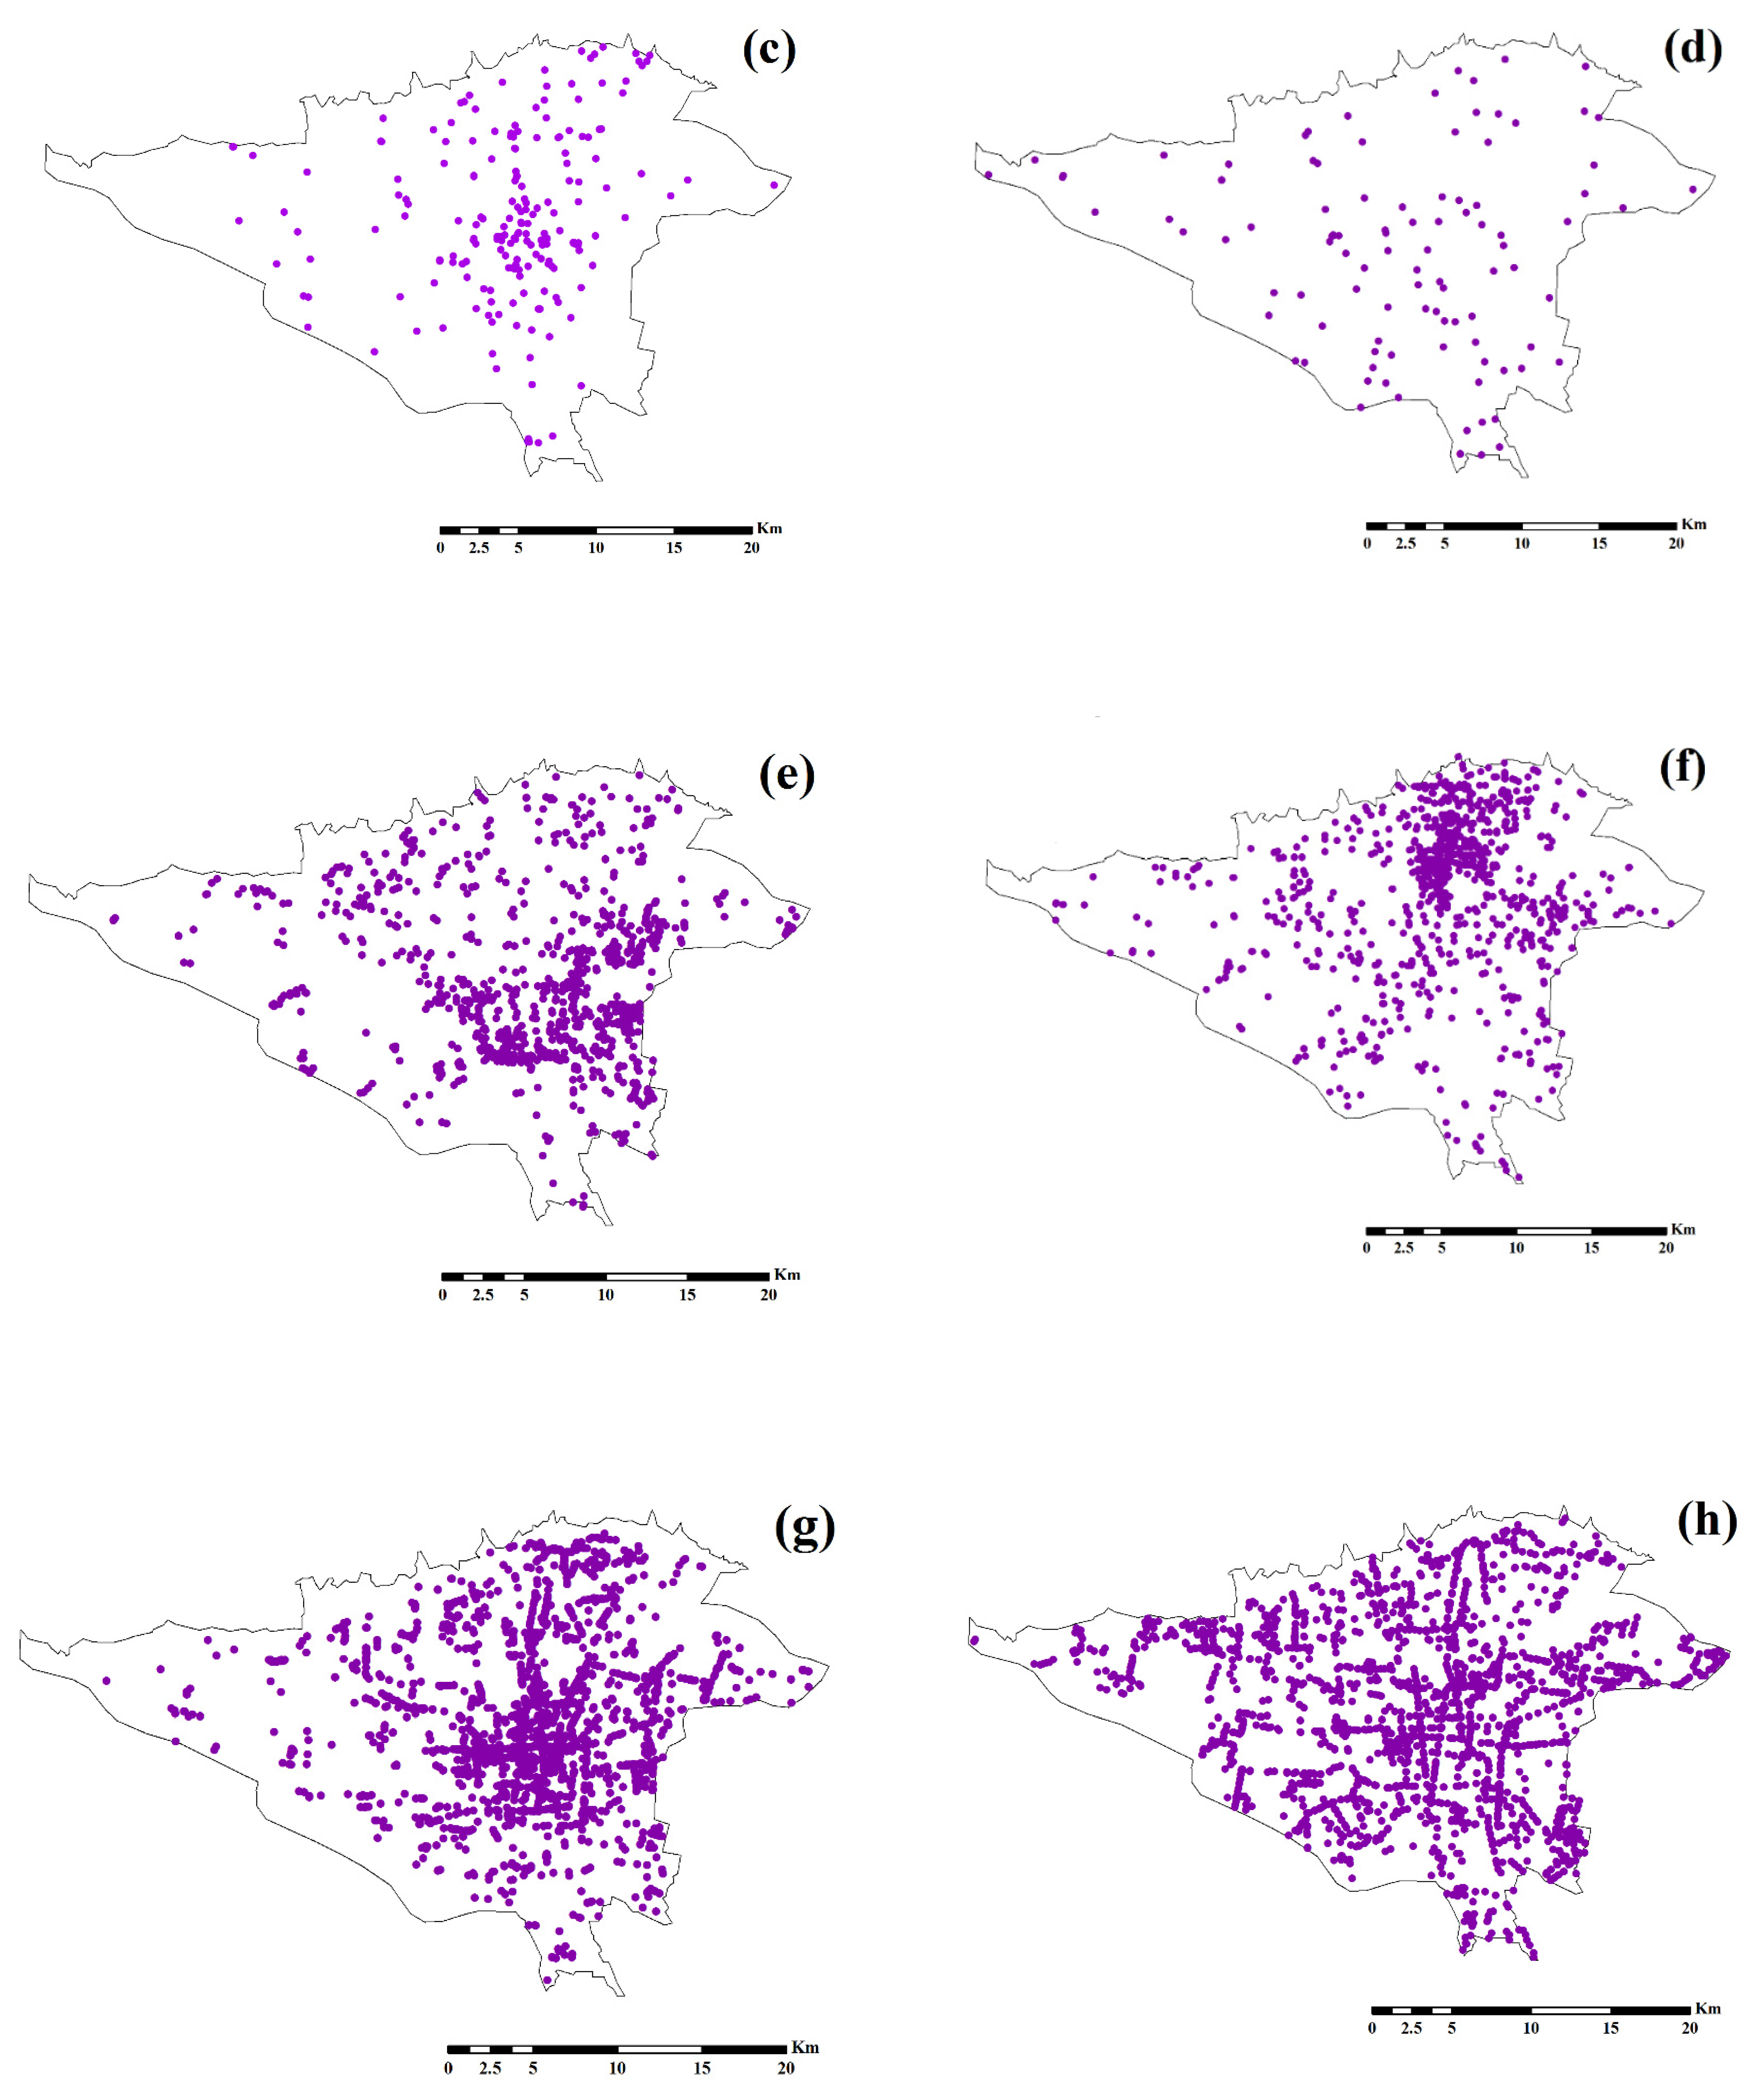
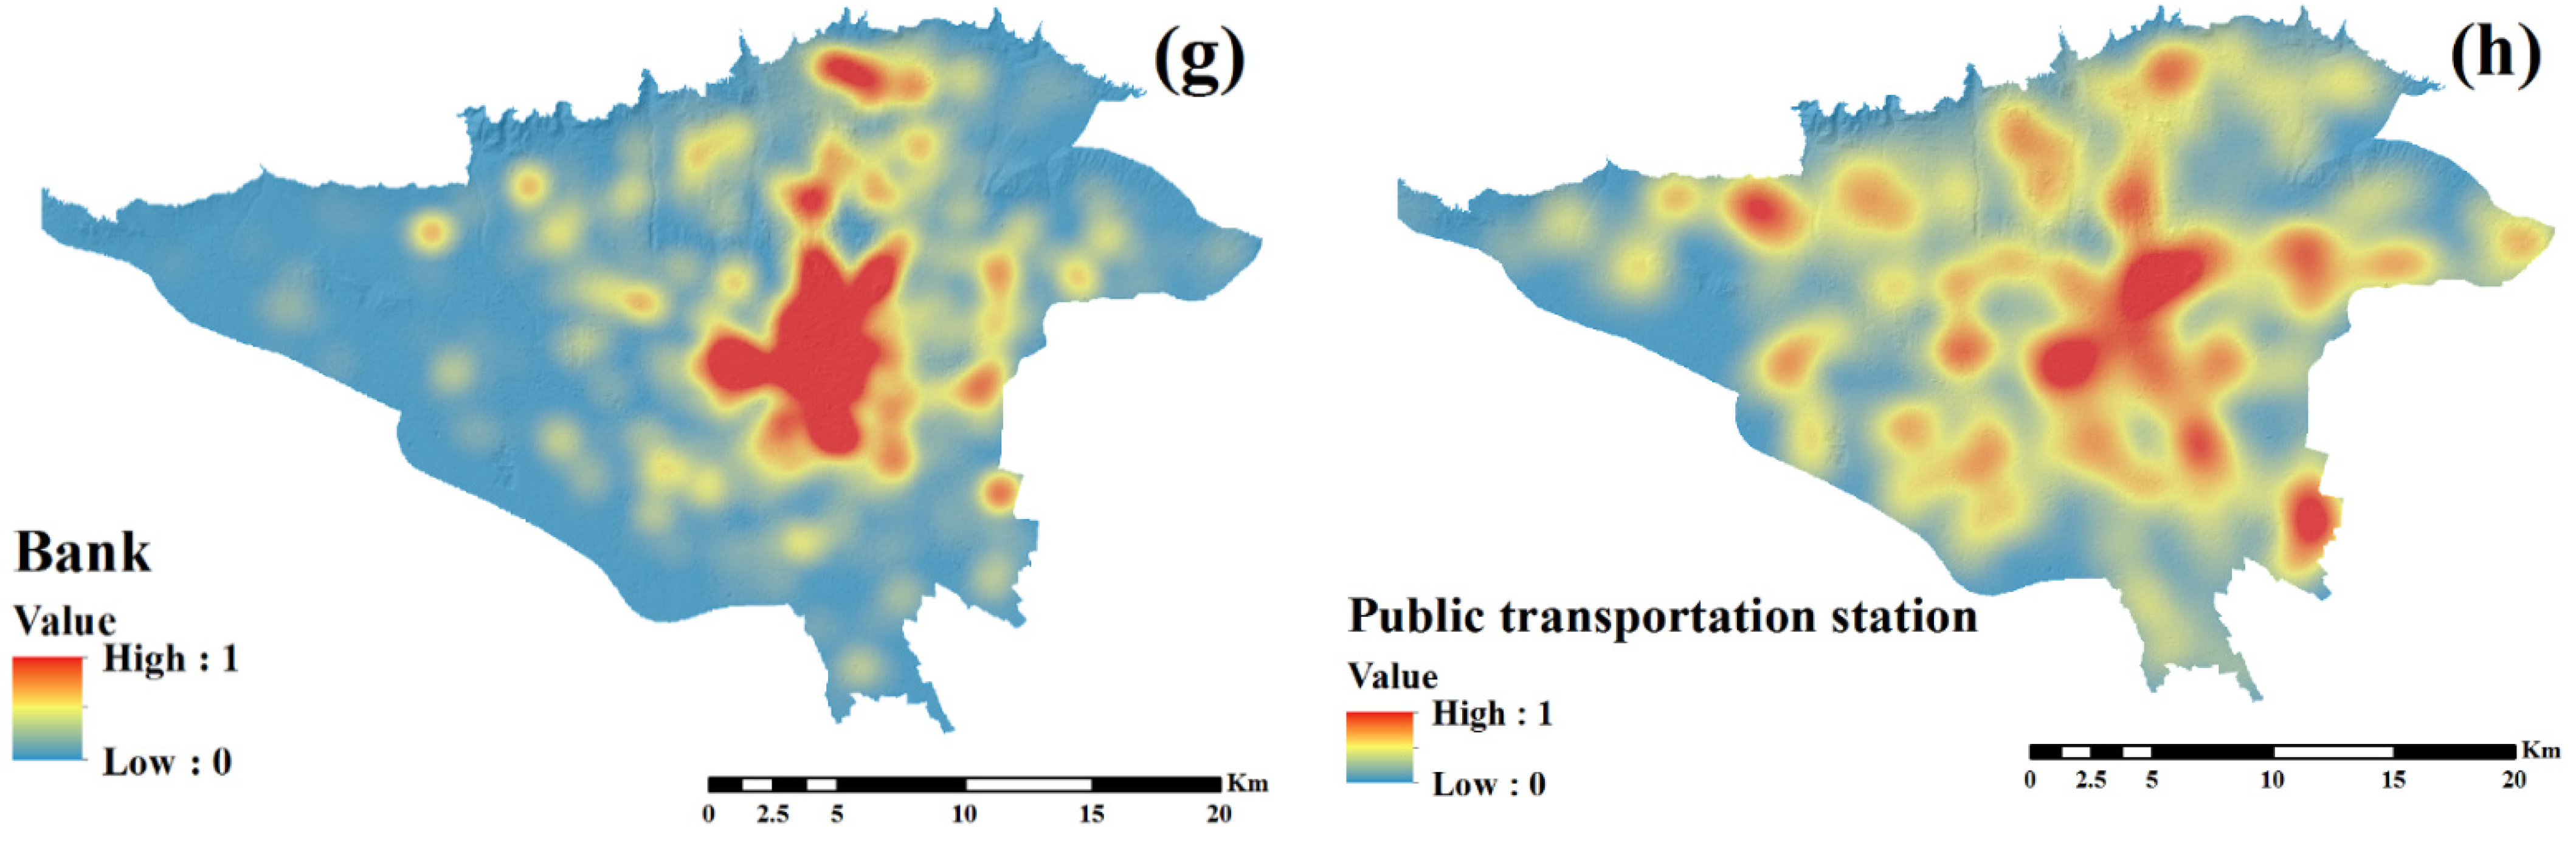
2.3. The Effective Criteria
2.4. Methods
2.4.1. The RF Algorithm
2.4.2. The LR Algorithm
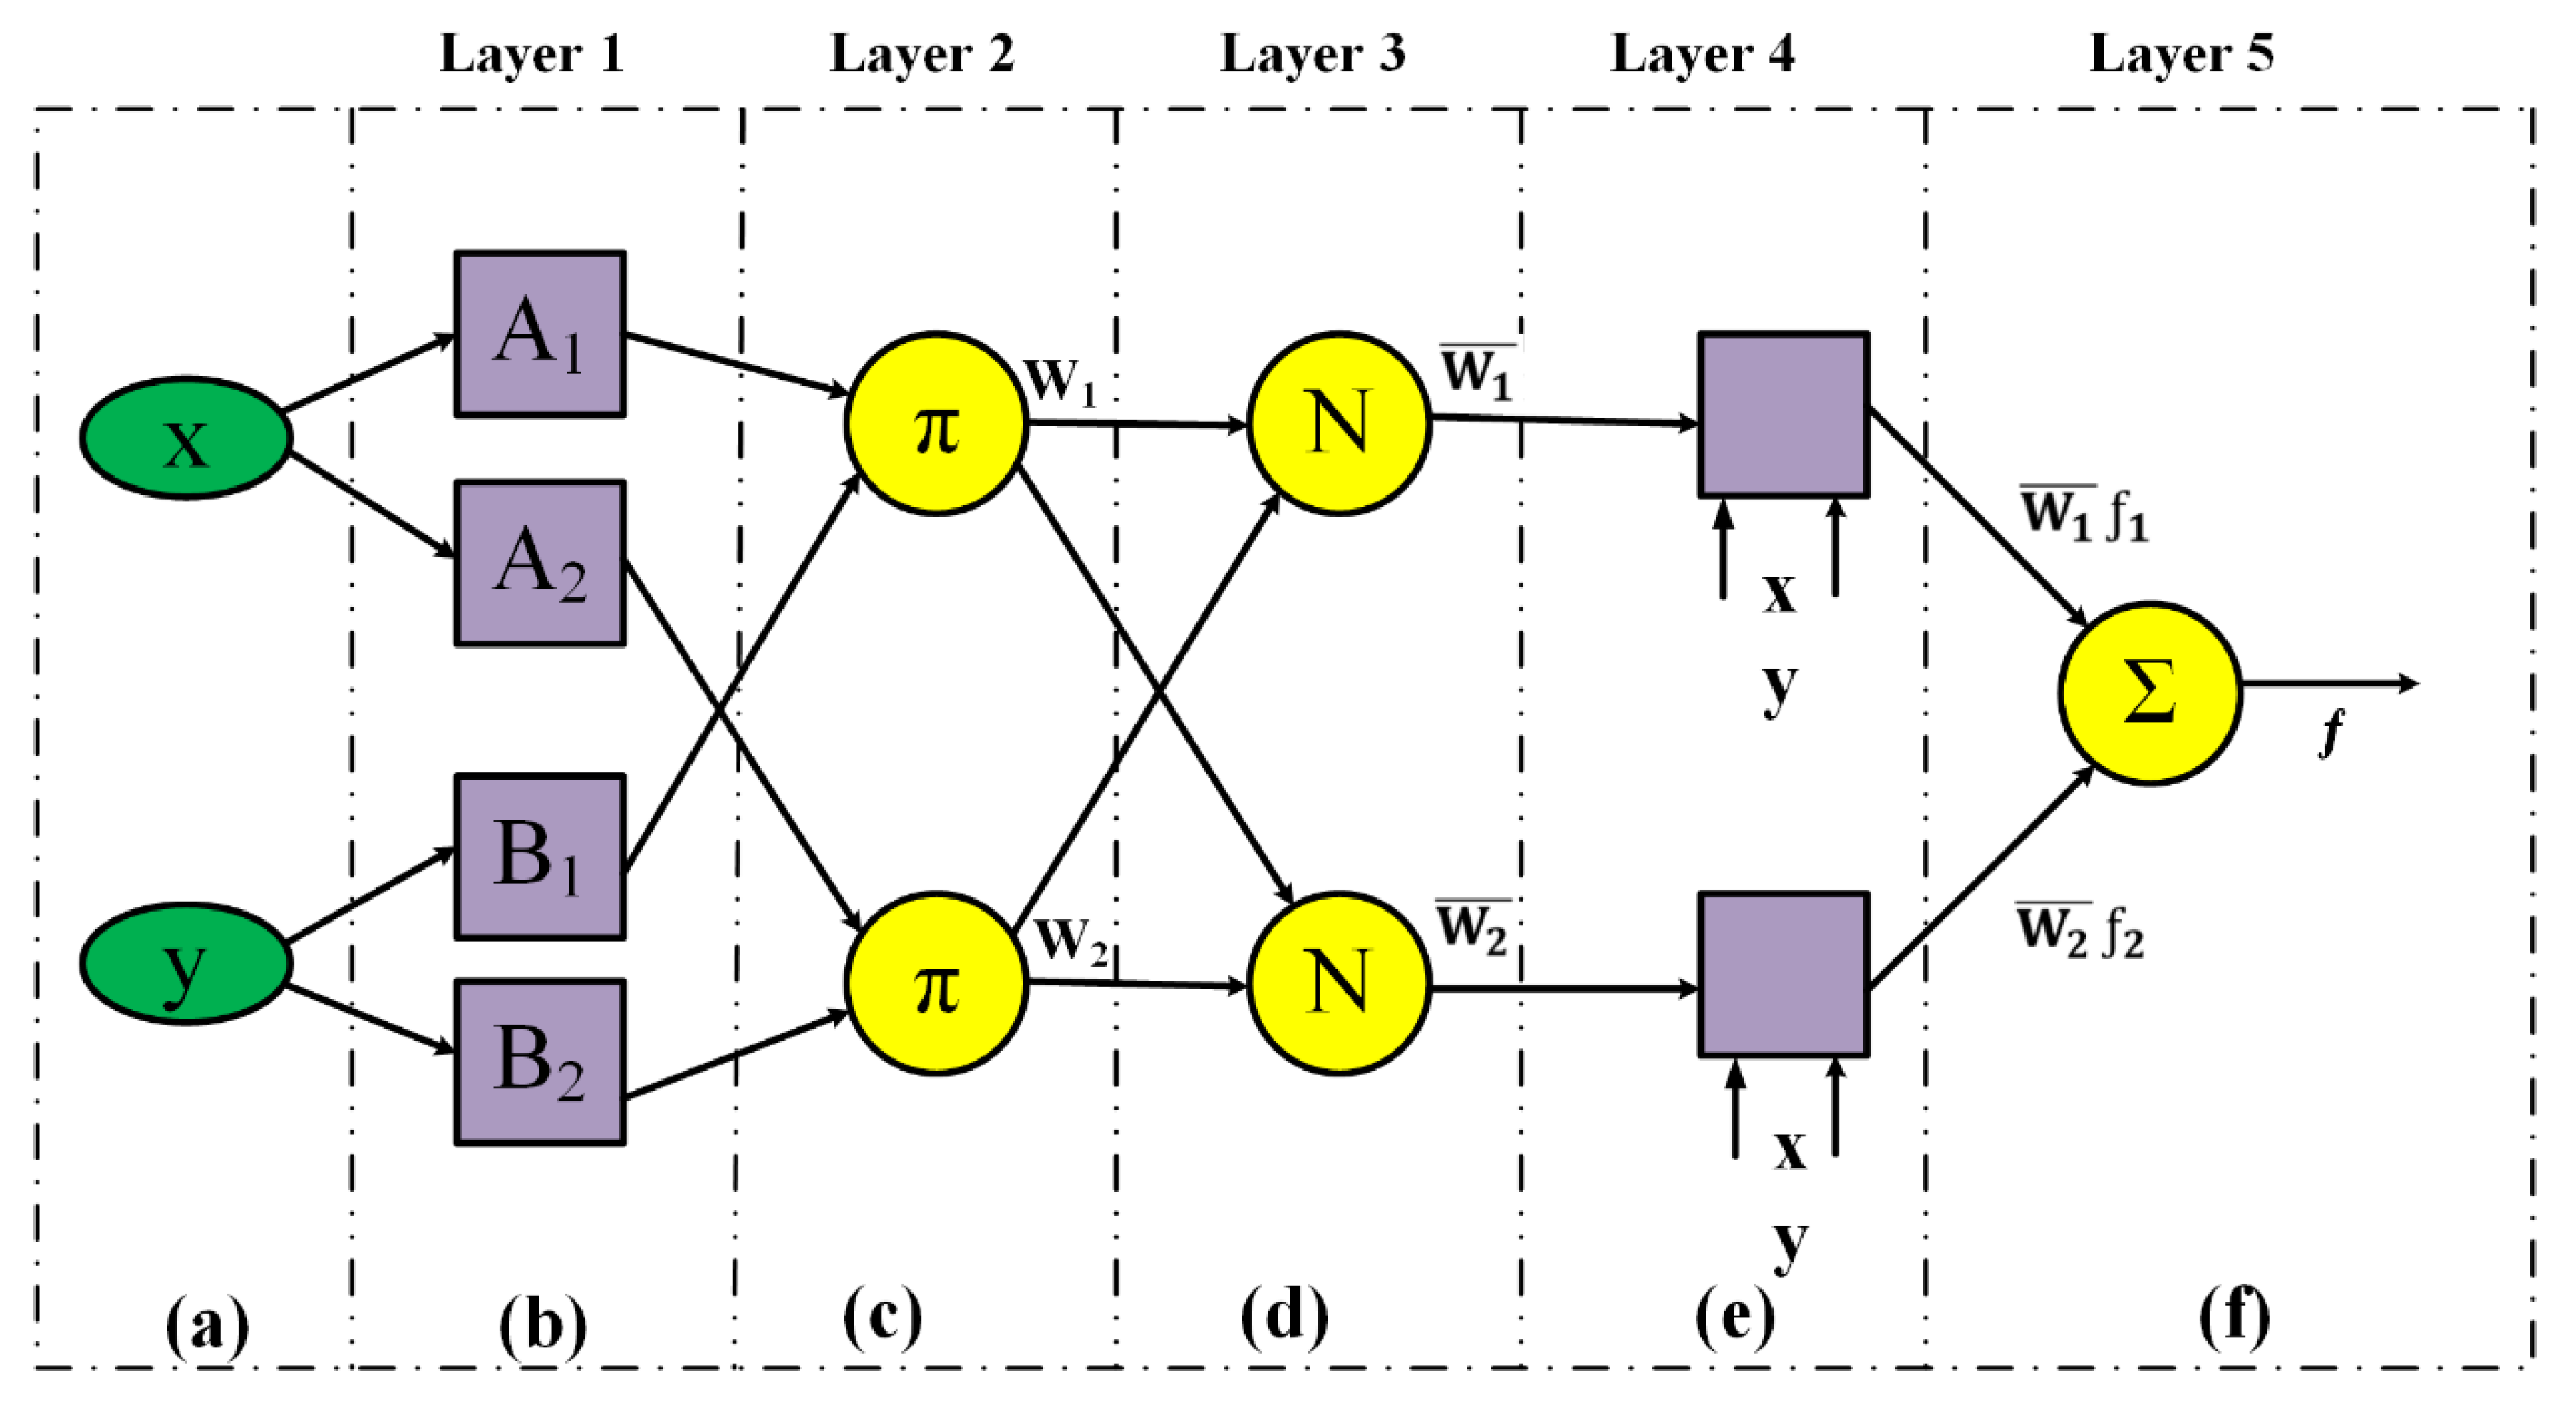
2.4.3. The ANFIS Algorithm
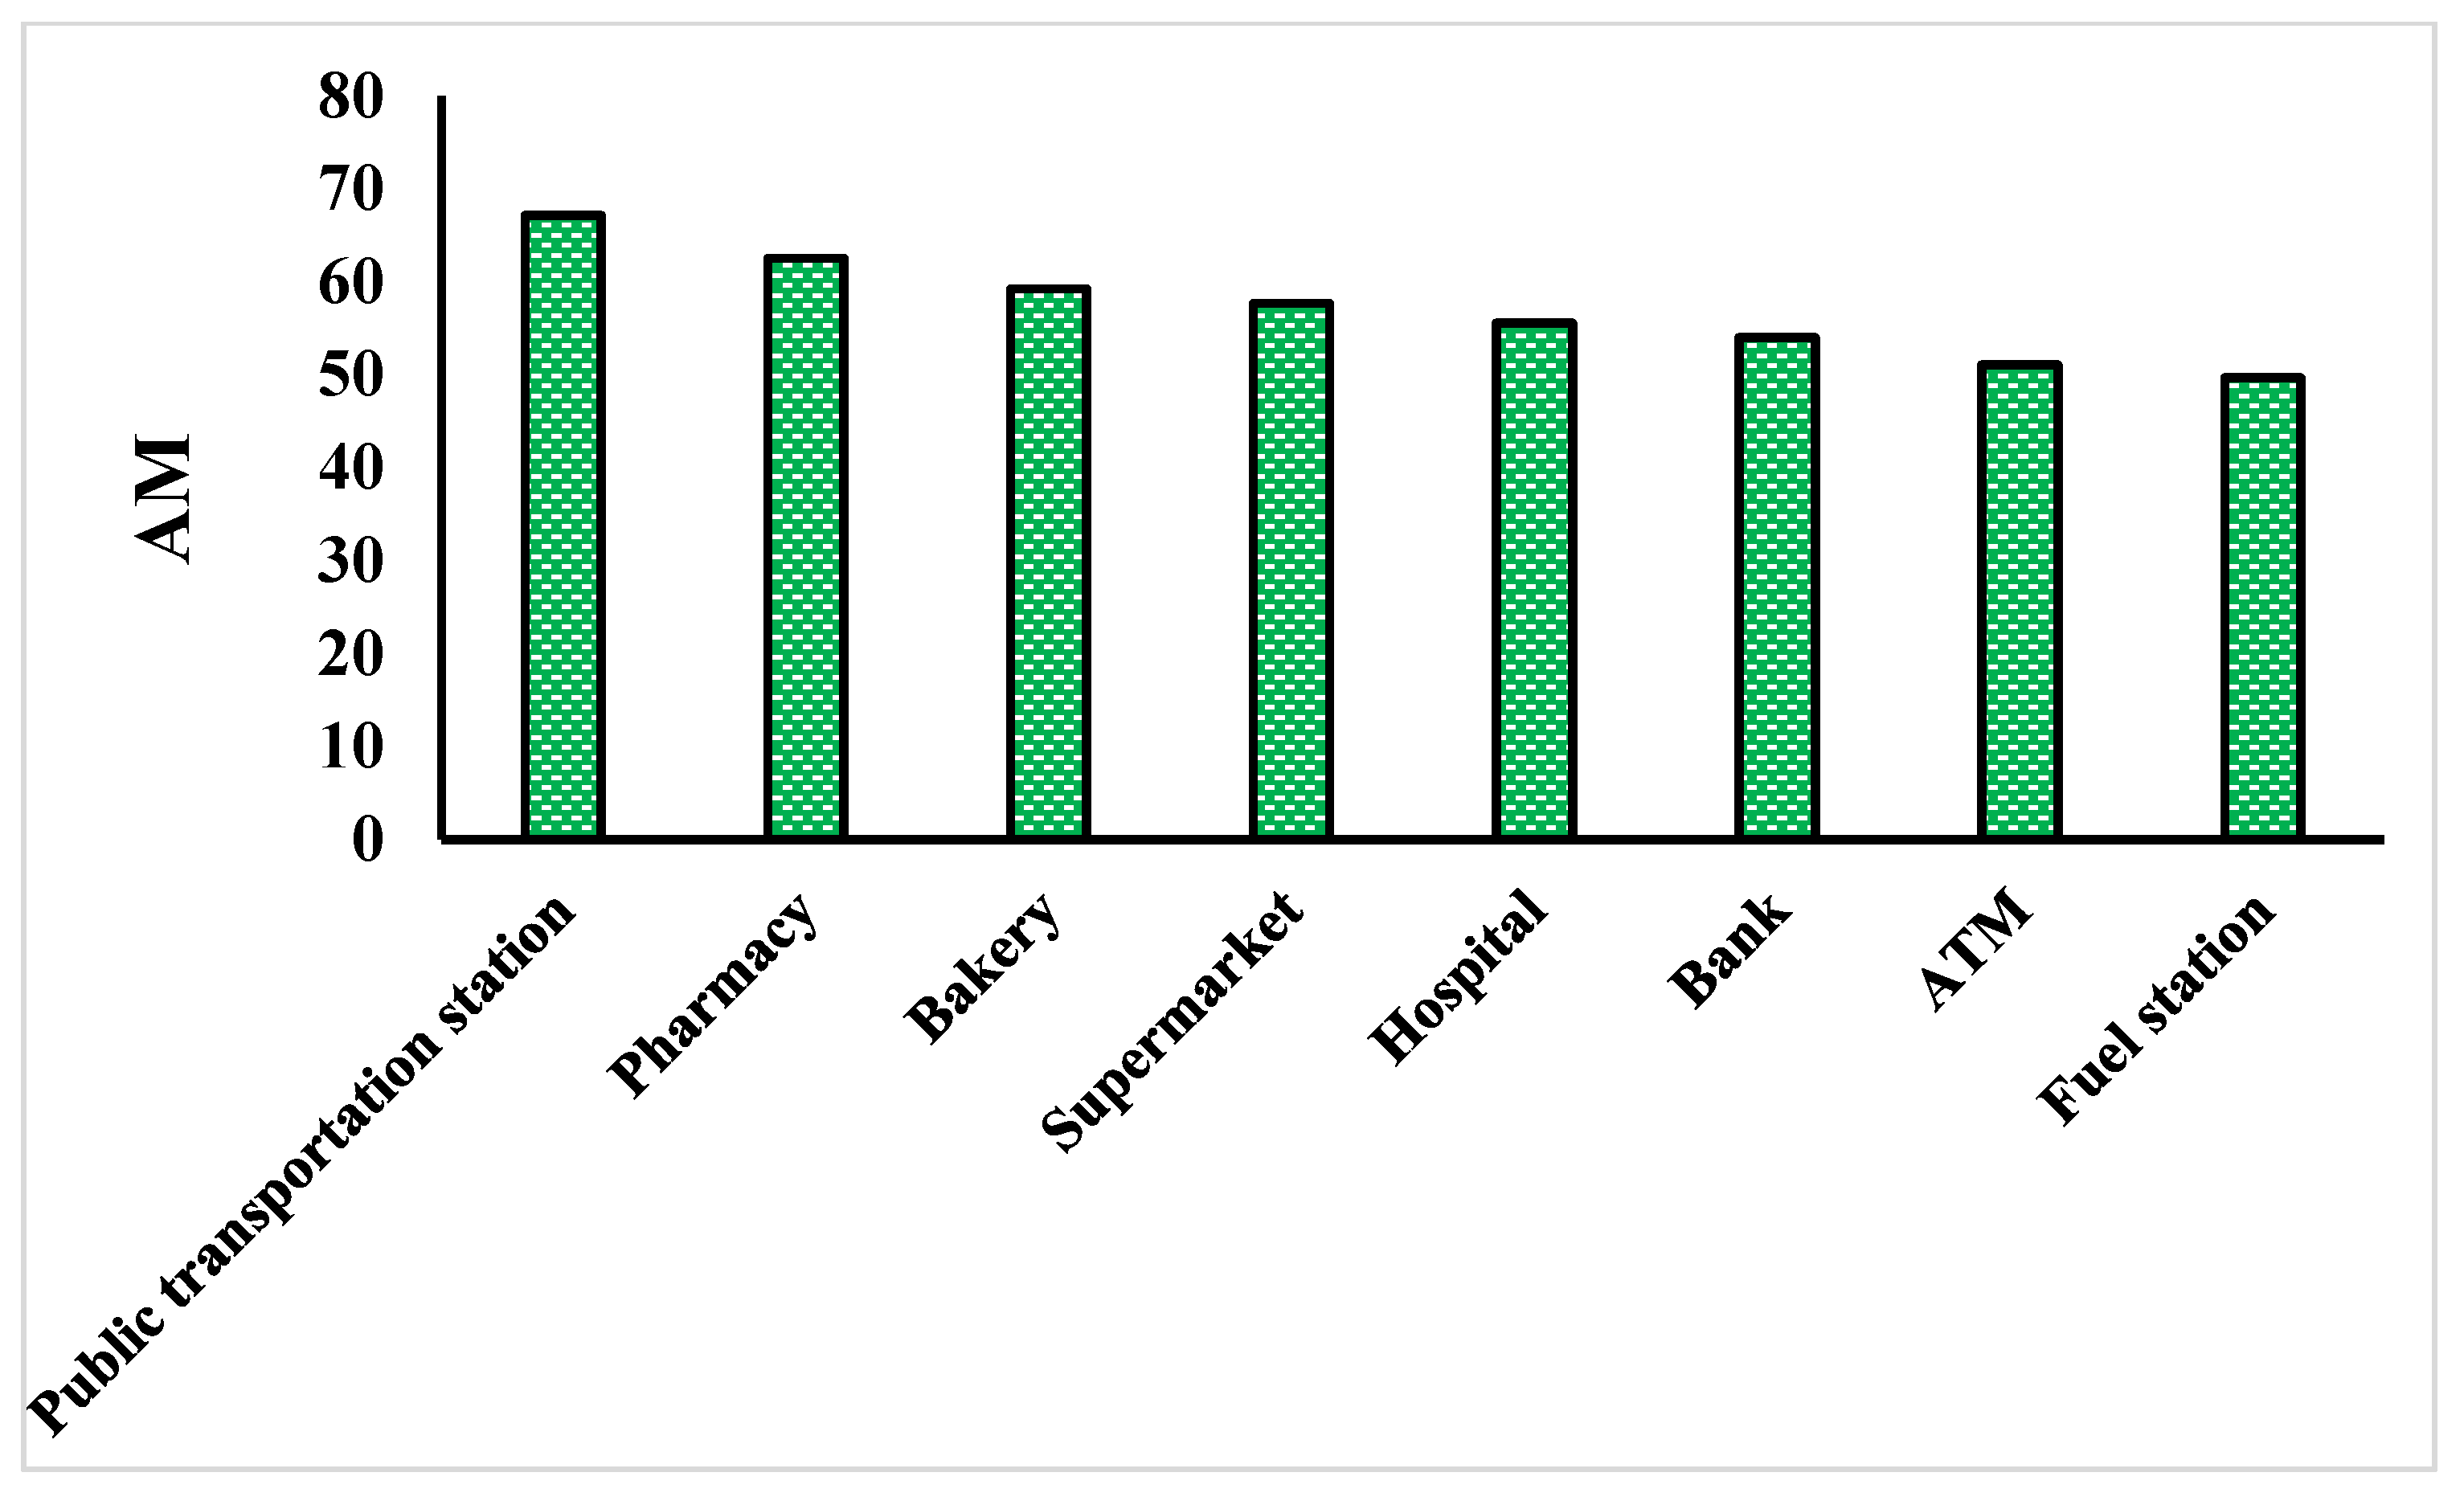
2.4.4. Feature Selection Using OneR Technique
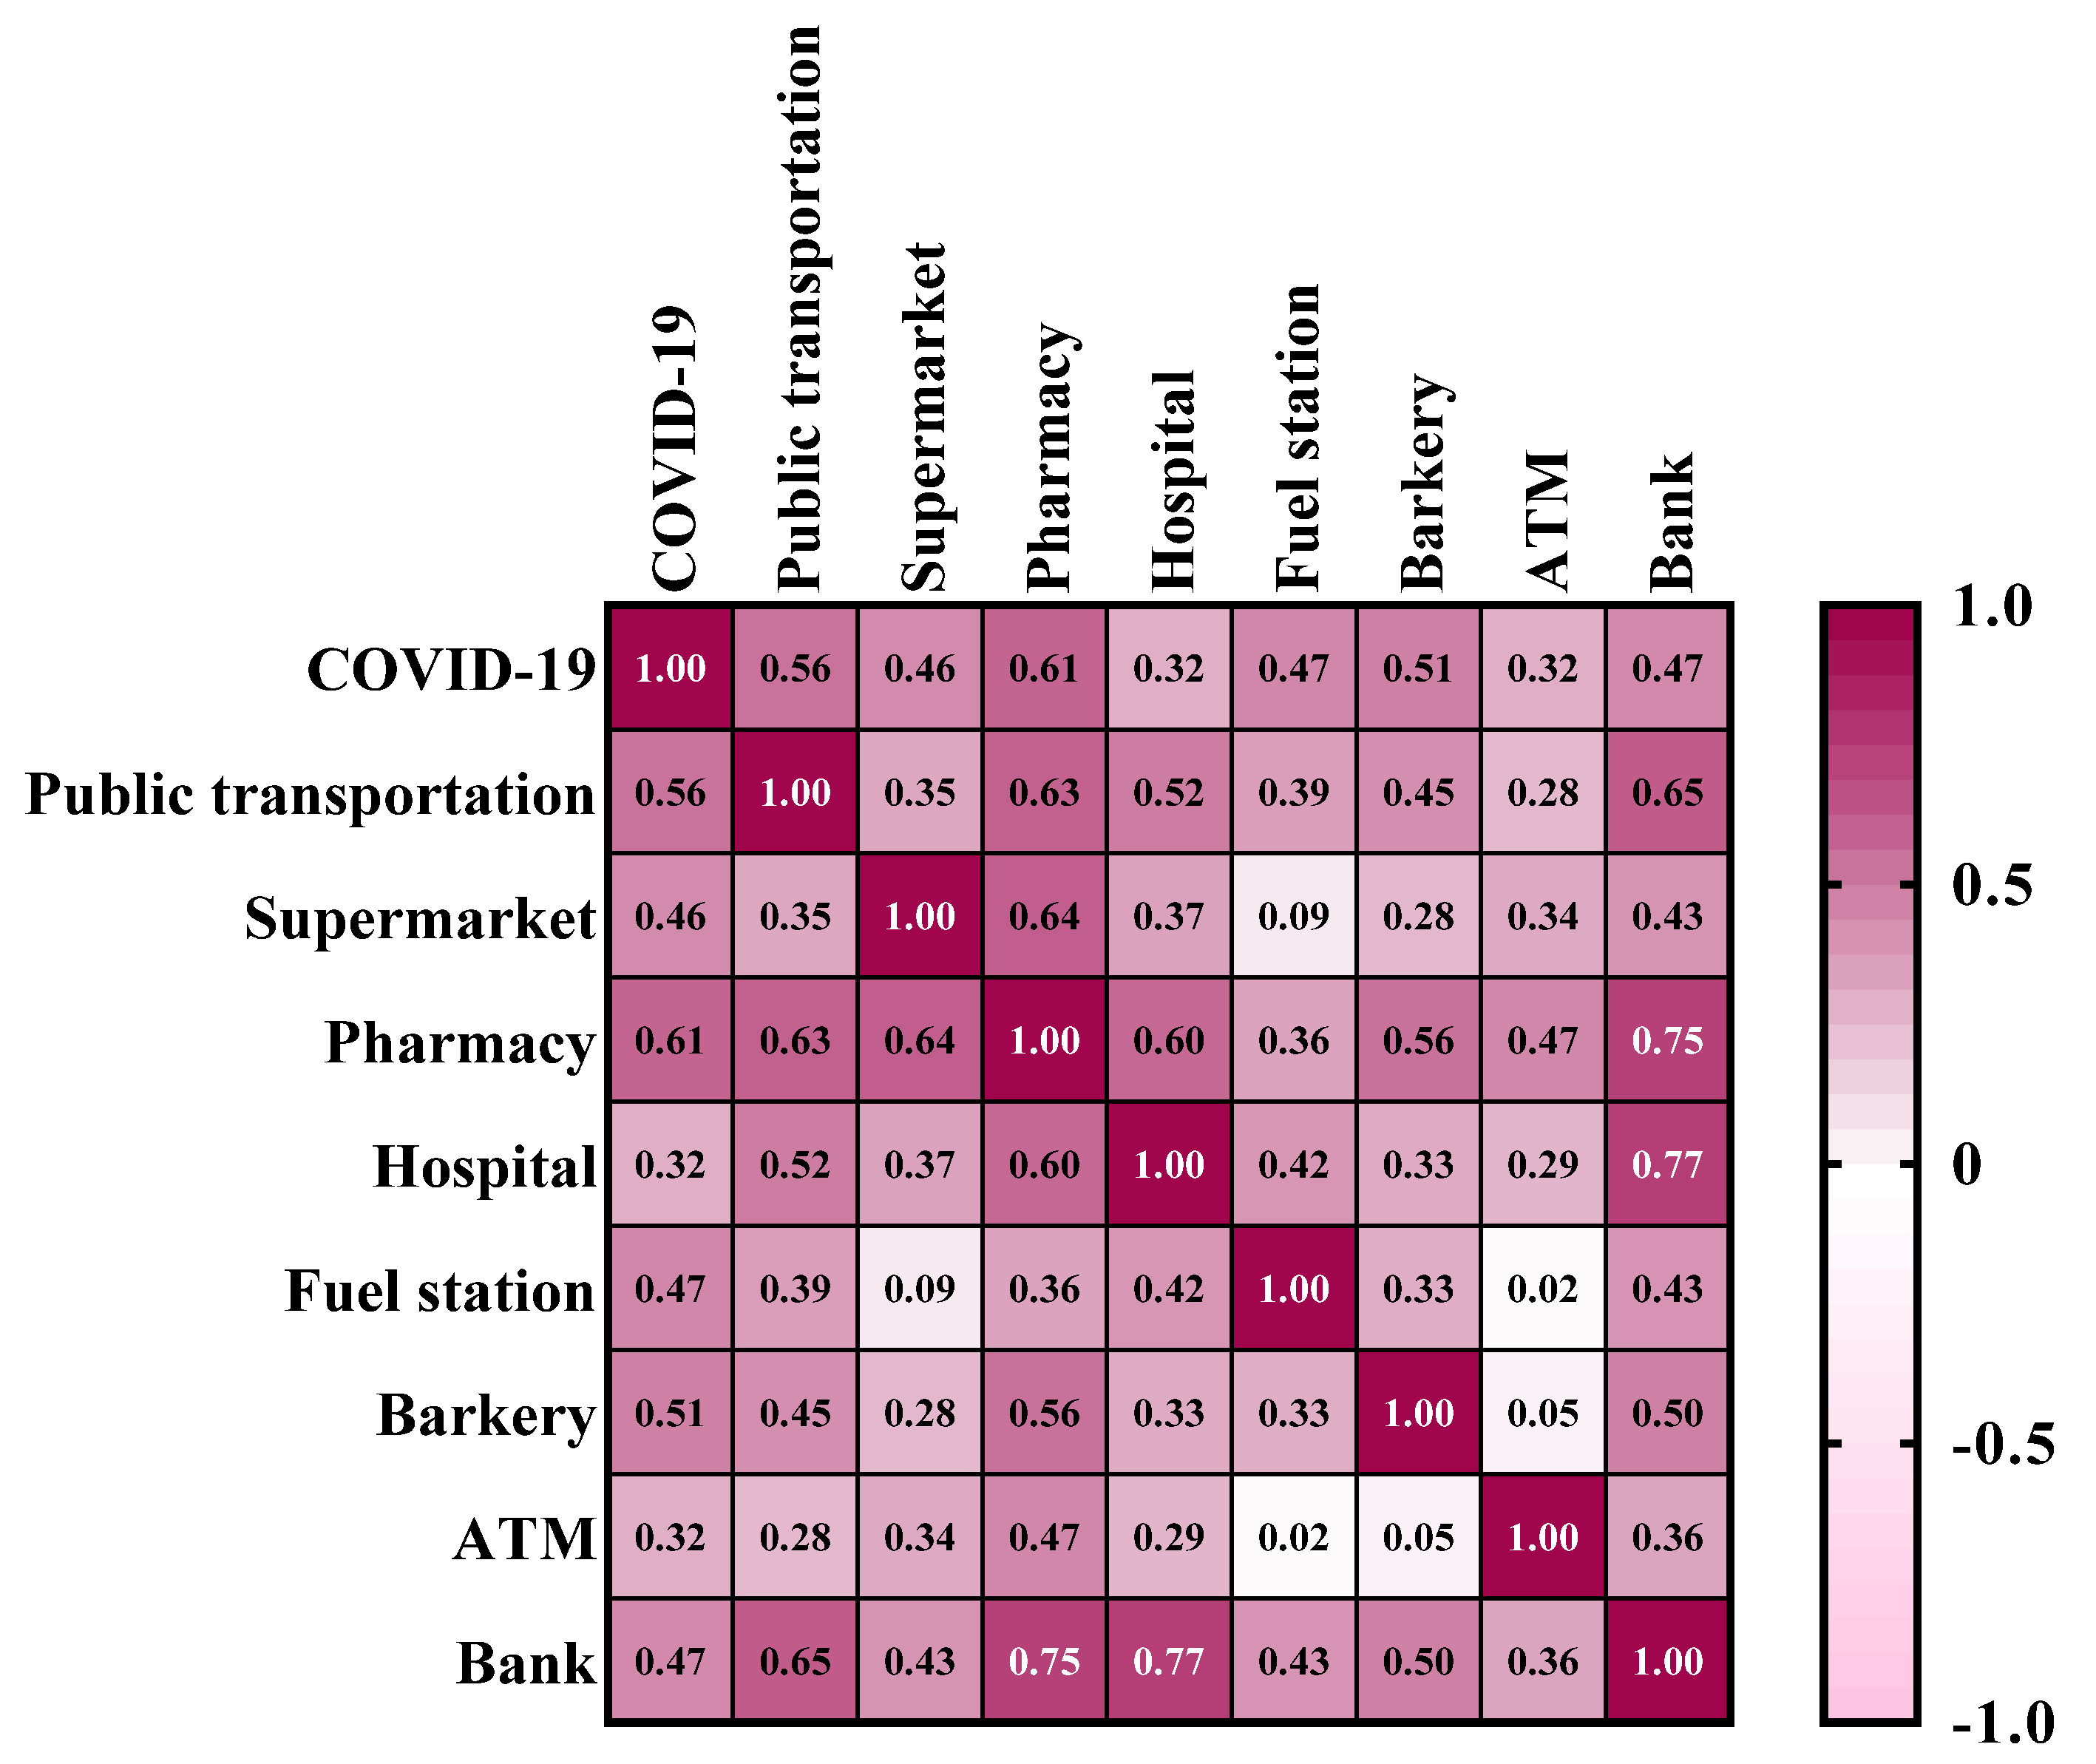
2.4.5. Pearson Correlation Technique
2.4.6. Validation
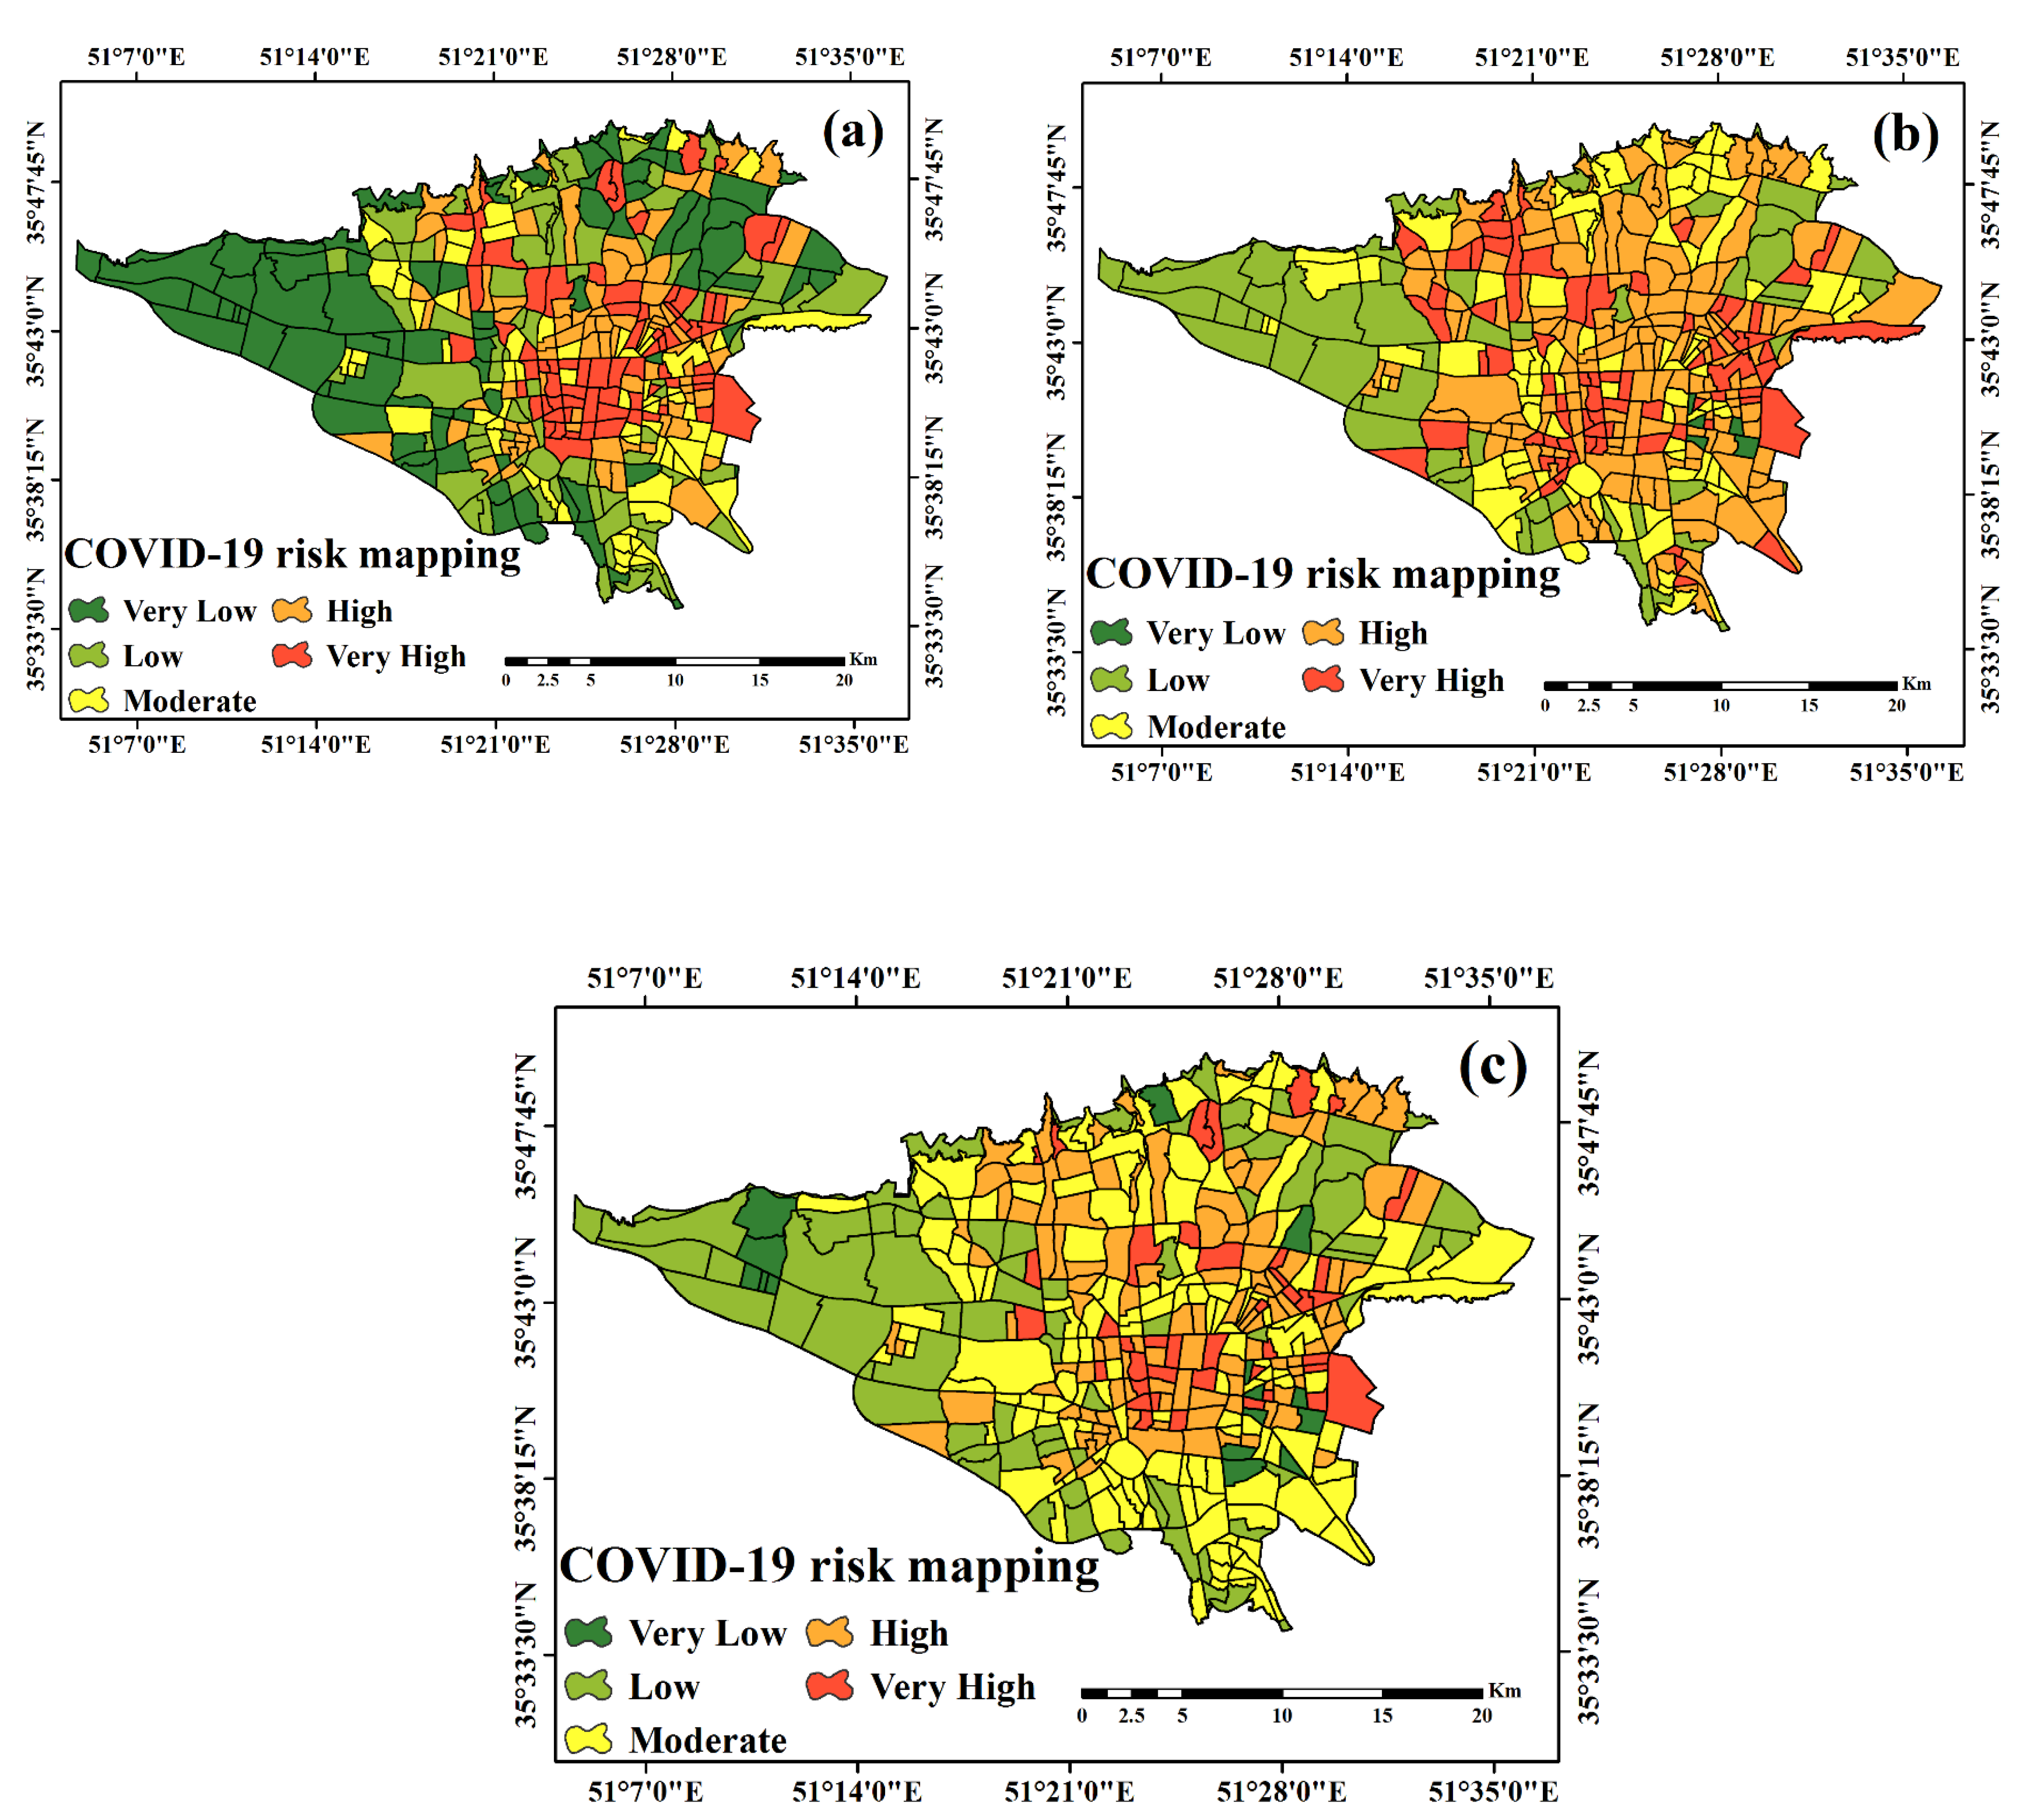
3. Results
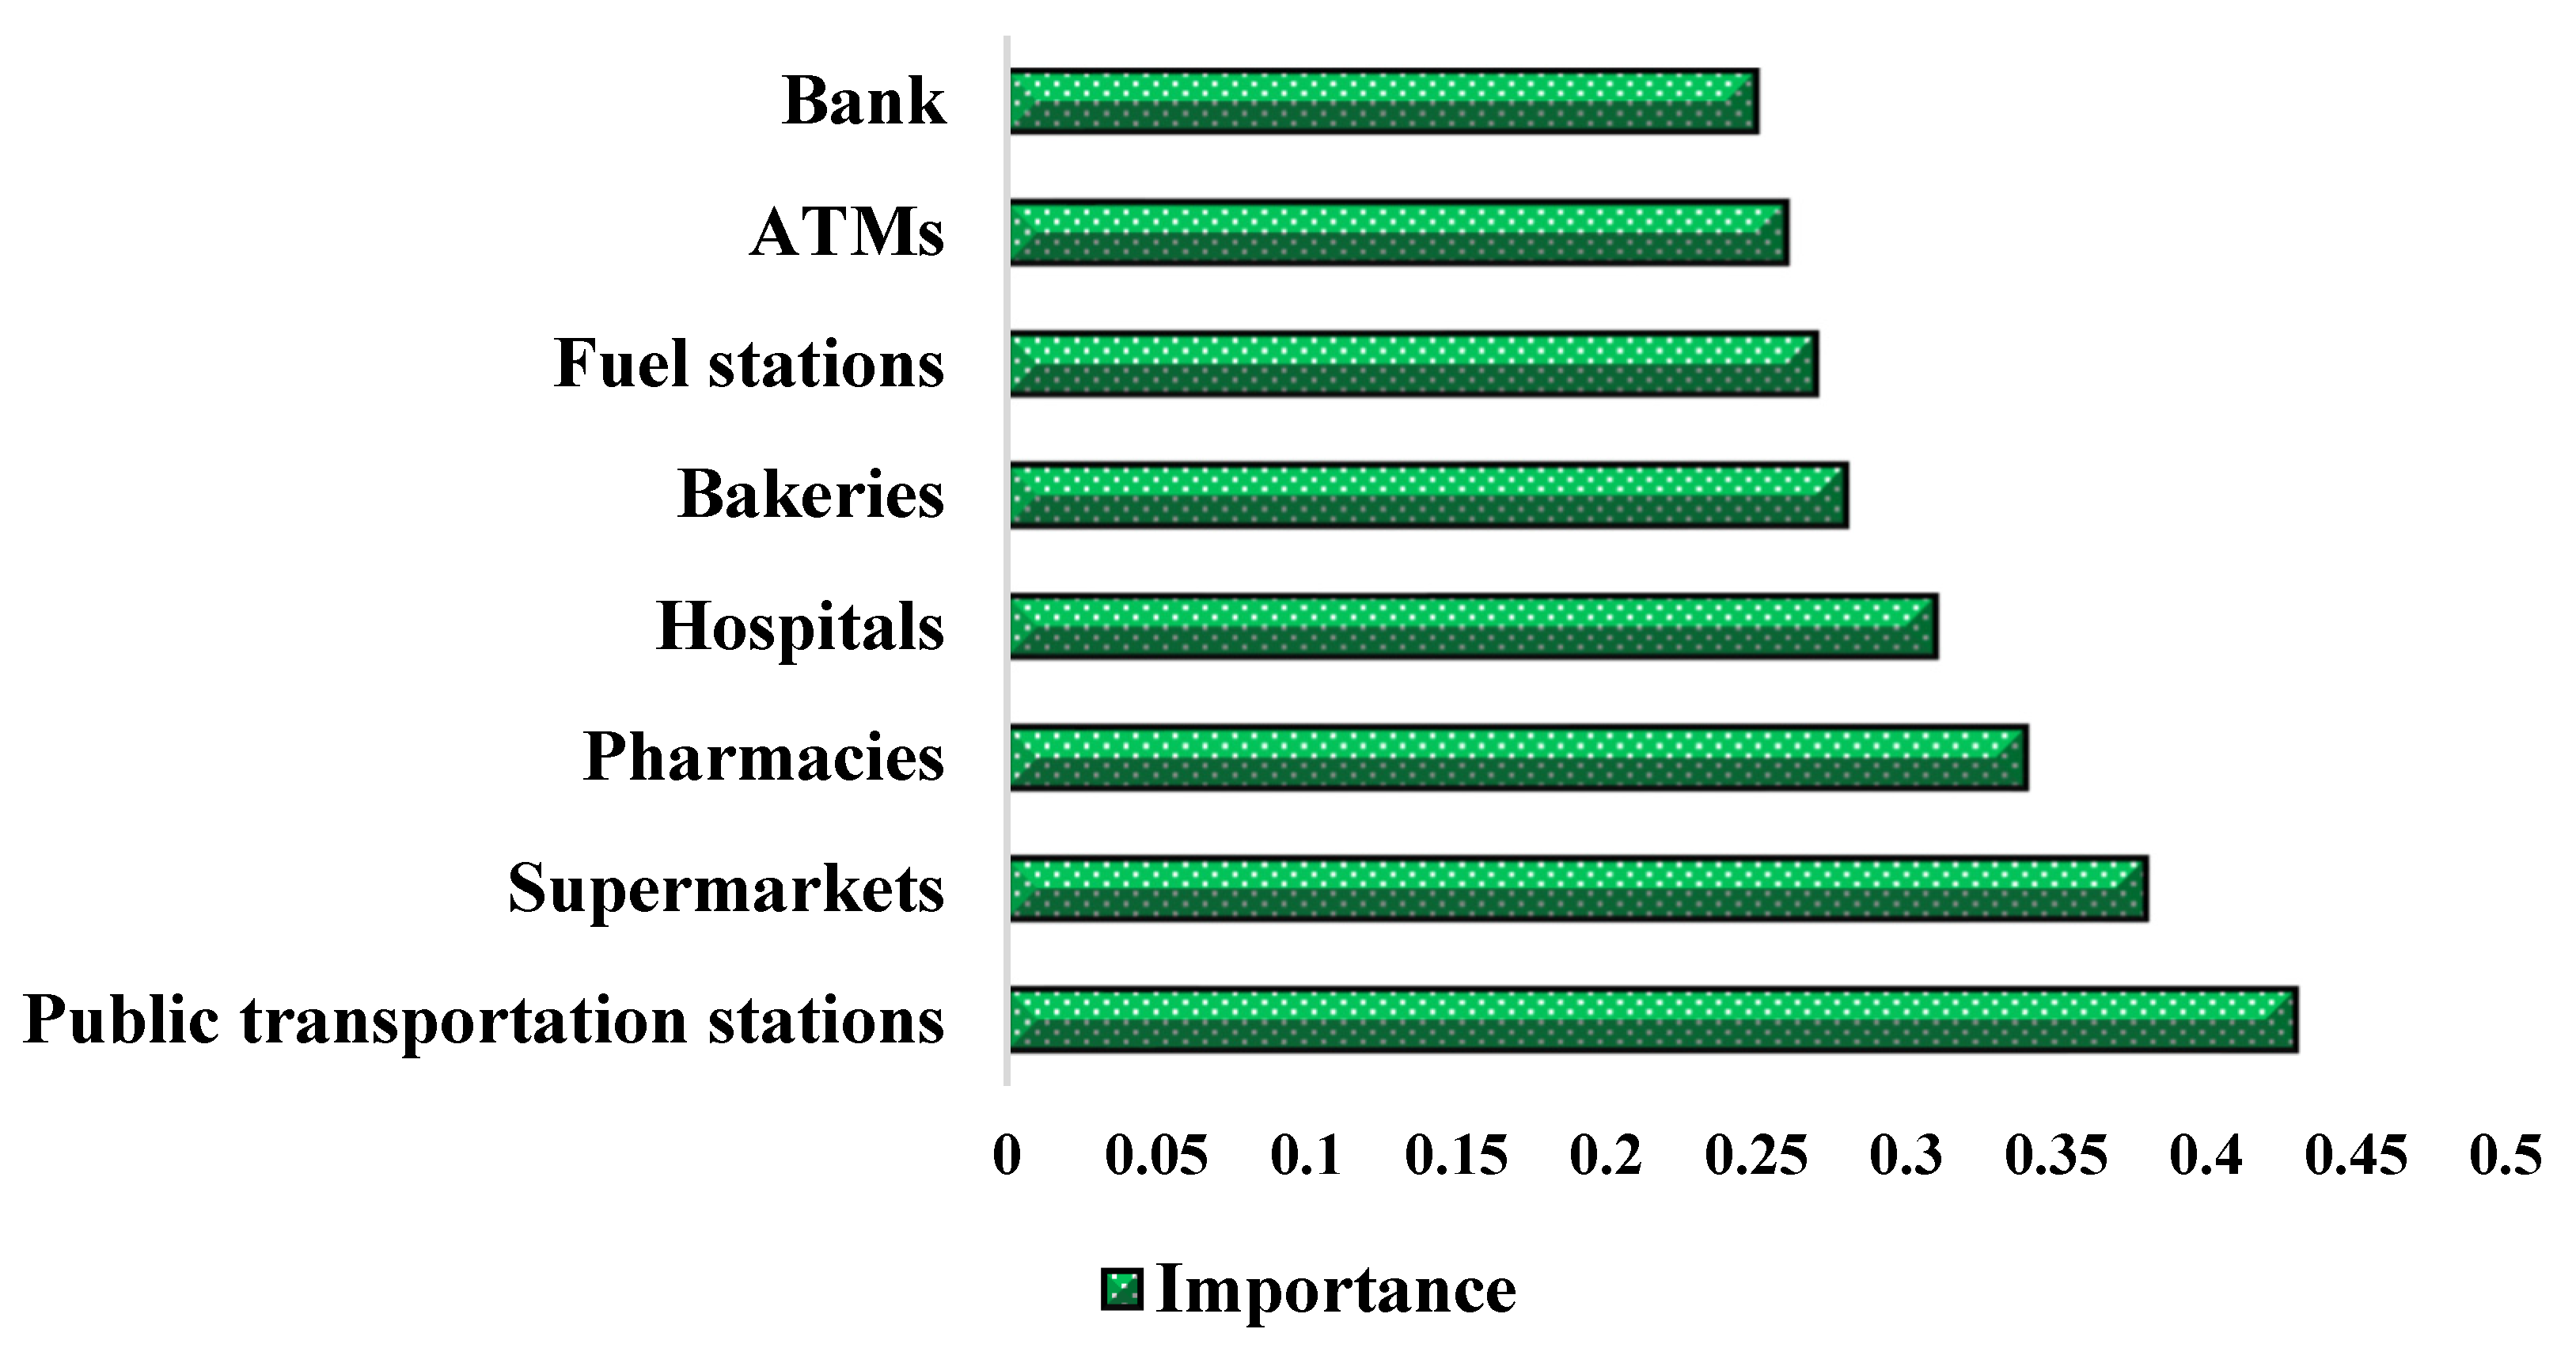
3.1. Feature Selection
3.2. Correlation between COVID-19 and Land Use
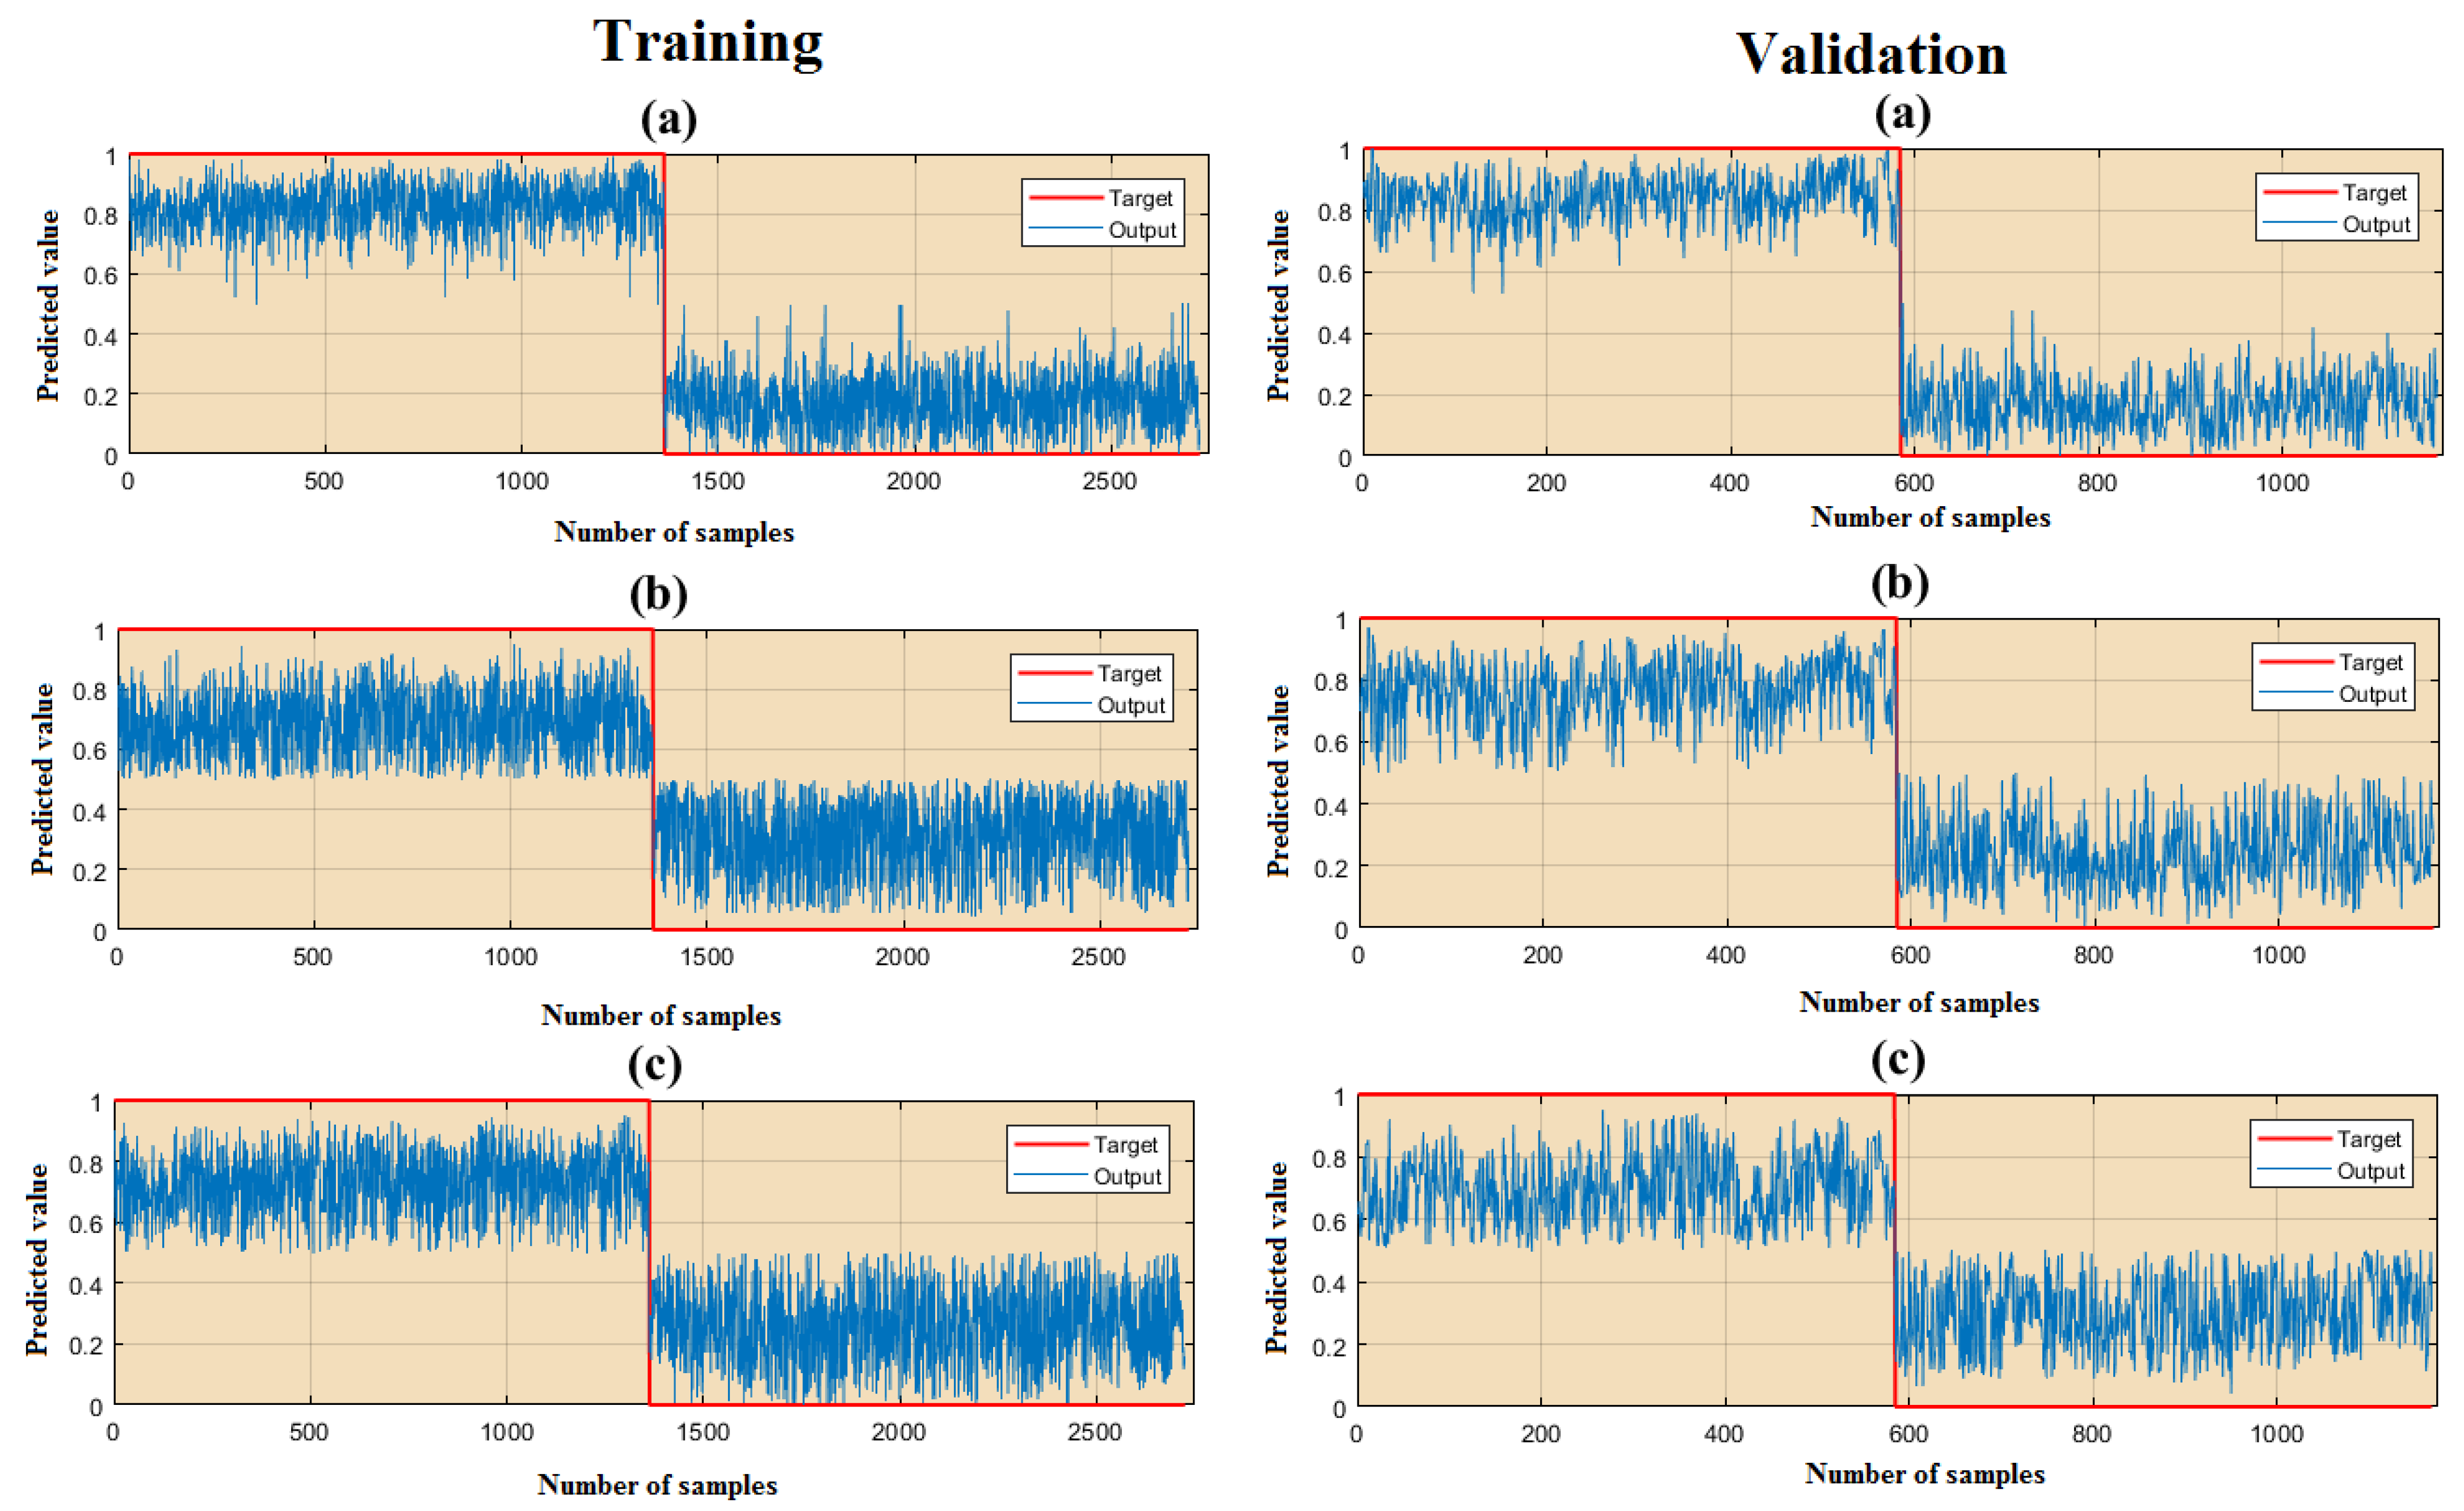
3.3. COVID-19 Modeling Process
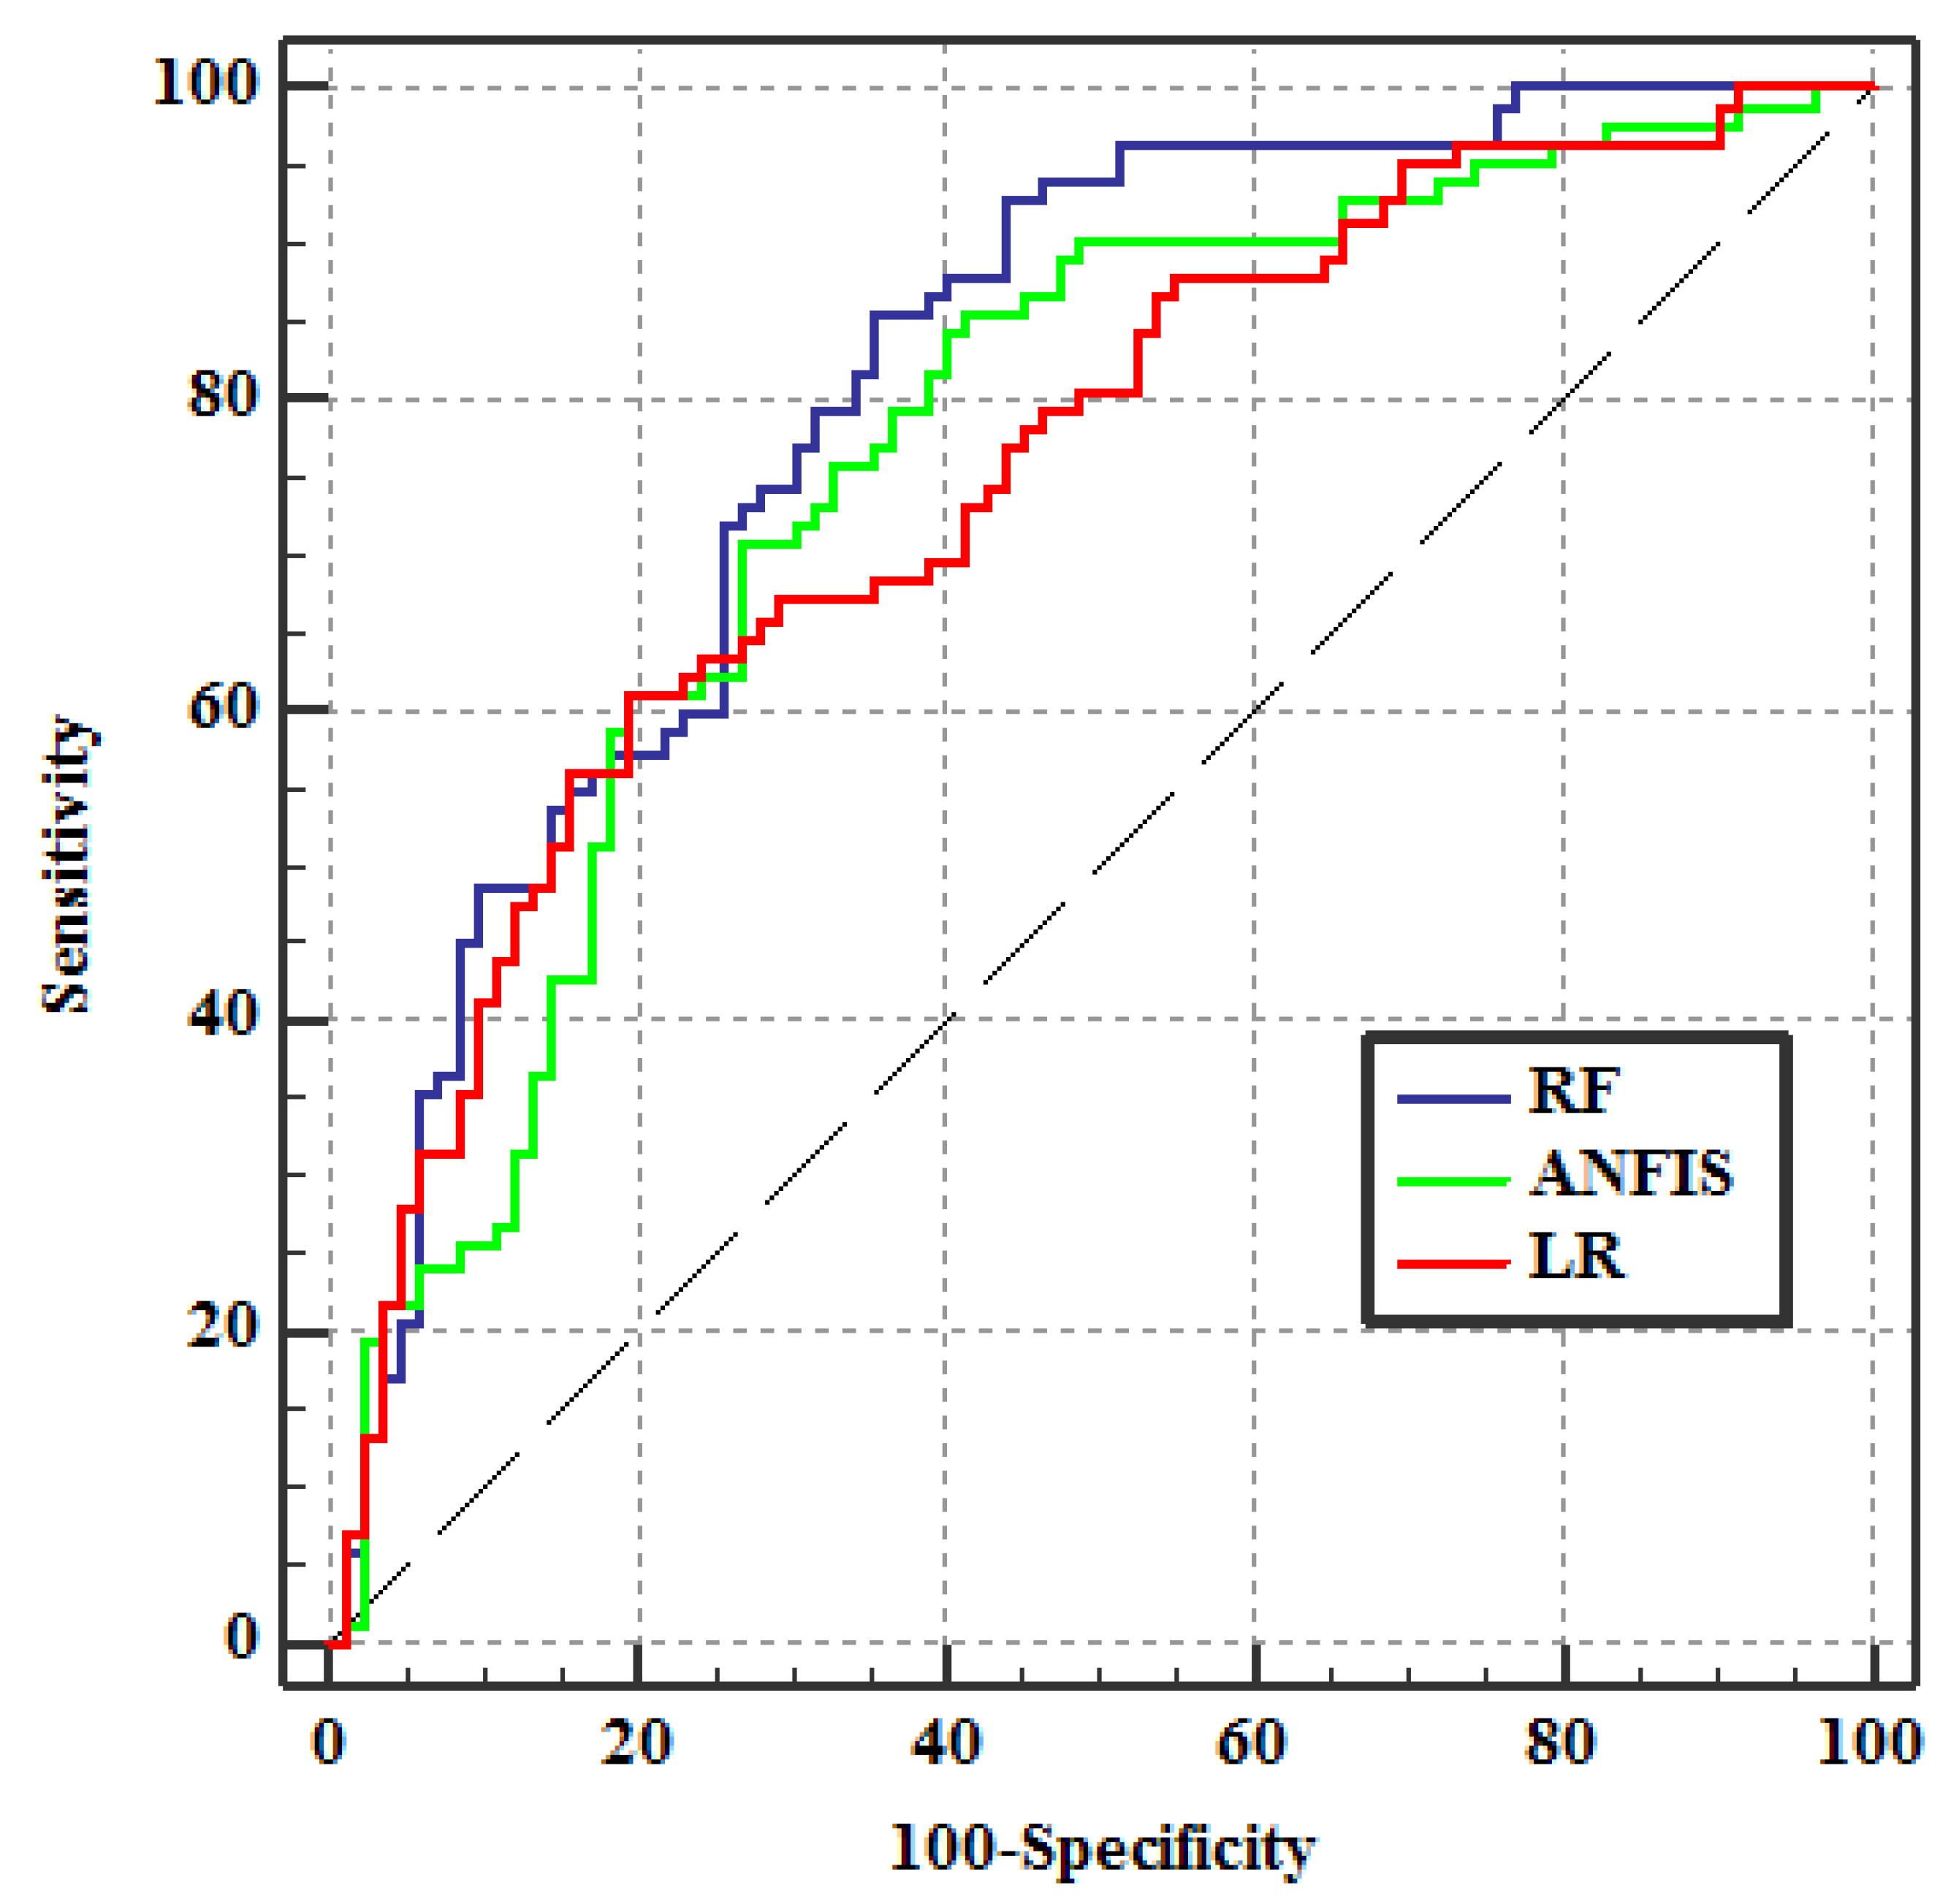
3.4. Validation of COVID-19 Risk Maps
4. Discussion
5. Conclusions
Author Contributions
Funding
Institutional Review Board Statement
Informed Consent Statement
Data Availability Statement
Conflicts of Interest
References
- Boulos, M.N.K.; Geraghty, E.M. Geographical tracking and mapping of coronavirus disease COVID-19/severe acute respiratory syndrome coronavirus 2 (sars-cov-2) epidemic and associated events around the world: How 21st century GIS technologies are supporting the global fight against outbreaks and epidemics. Int. J. Health Geogr. 2020, 19. [Google Scholar] [CrossRef] [Green Version]
- Briz-Redón, Á.; Serrano-Aroca, Á. A spatio-temporal analysis for exploring the effect of temperature on COVID-19 early evolution in Spain. Sci. Total Environ. 2020, 728, 138811. [Google Scholar] [CrossRef] [PubMed]
- World Health Organization. Coronavirus Disease 2019 (COVID-19); Situation Report, 105; World Health Organization: Geneva, Switzerland, 2020. [Google Scholar]
- Wu, D.; Wu, T.; Liu, Q.; Yang, Z. The Sars-cov-2 outbreak: What we know. Int. J. Infect. Dis. 2020, 94, 44–48. [Google Scholar] [CrossRef]
- Jia, L.; Li, K.; Jiang, Y.; Guo, X. Prediction and analysis of coronavirus disease 2019. arXiv 2020, arXiv:2003.05447. [Google Scholar]
- Ceylan, Z. Estimation of COVID-19 prevalence in Italy, Spain, and France. Sci. Total Environ. 2020, 729, 138817. [Google Scholar] [CrossRef] [PubMed]
- Ahmadi, M.; Sharifi, A.; Dorosti, S.; Ghoushchi, S.J.; Ghanbari, N. Investigation of effective climatology parameters on COVID-19 outbreak in Iran. Sci. Total Environ. 2020, 729, 138705. [Google Scholar] [CrossRef] [PubMed]
- Brizuela, N.G.; García-Chan, N.; Gutiérrez Pulido, H.; Chowell, G. Understanding the role of urban design in disease spreading. Proc. R. Soc. A 2021, 477, 20200524. [Google Scholar] [CrossRef]
- Zhou, C.; Su, F.; Pei, T.; Zhang, A.; Du, Y.; Luo, B.; Cao, Z.; Wang, J.; Yuan, W.; Zhu, Y. COVID-19: Challenges to GIS with big data. Geogr. Sustain. 2020, 1, 77–87. [Google Scholar] [CrossRef]
- Mollalo, A.; Vahedi, B.; Rivera, K.M. GIS-based spatial modeling of COVID-19 incidence rate in the continental United States. Sci. Total Environ. 2020, 728, 138884. [Google Scholar] [CrossRef]
- Kanga, S.; Meraj, G.; Farooq, M.; Nathawat, M.; Singh, S.K. Analyzing the risk to COVID-19 infection using remote sensing and gis. Risk Anal. 2021, 41, 801–813. [Google Scholar] [CrossRef]
- Urban, R.C.; Nakada, L.Y.K. GIS-based spatial modelling of COVID-19 death incidence in São Paulo, Brazil. Environ. Urban. 2021, 33, 229–238. [Google Scholar] [CrossRef]
- Bherwani, H.; Anjum, S.; Kumar, S.; Gautam, S.; Gupta, A.; Kumbhare, H.; Anshul, A.; Kumar, R. Understanding COVID-19 transmission through bayesian probabilistic modeling and GIS-based voronoi approach: A policy perspective. Environ. Dev. Sustain. 2021, 23, 5846–5864. [Google Scholar] [CrossRef]
- Bag, R.; Ghosh, M.; Biswas, B.; Chatterjee, M. Understanding the spatio-temporal pattern of COVID-19 outbreak in India using Gis and India’s response in managing the pandemic. Reg. Sci. Policy Pract. 2020, 12, 1063–1103. [Google Scholar] [CrossRef]
- Silalahi, F.E.S.; Hidayat, F.; Dewi, R.S.; Purwono, N.; Oktaviani, N. GIS-based approaches on the accessibility of referral hospital using network analysis and the spatial distribution model of the spreading case of COVID-19 in Jakarta, Indonesia. BMC Health Serv. Res. 2020, 20, 1–20. [Google Scholar] [CrossRef]
- Rahman, M.; Zafri, N.M.; Ashik, F.; Waliullah, M. GIS-based spatial modeling to identify factors affecting COVID-19 incidence rates in Bangladesh. medRxiv 2020. [Google Scholar] [CrossRef]
- Razavi-Termeh, S.V.; Sadeghi-Niaraki, A.; Choi, S.-M. Coronavirus Disease Vulnerability Map Using a Geographic Information System (GIS) from 16 April to 16 May 2020. Available online: https://www.sciencedirect.com/science/article/pii/S1474706521000863 (accessed on 3 August 2021).
- Ma, J.; Cheng, J.C.; Jiang, F.; Chen, W.; Zhang, J. Analyzing driving factors of land values in urban scale based on big data and non-linear machine learning techniques. Land Use Policy 2020, 94, 104537. [Google Scholar] [CrossRef]
- Tohidi, N.; Rustamov, R.B. A review of the machine learning in gis for megacities application. Geogr. Inf. Syst. Geospat. Intell. 2020, 29–53. [Google Scholar] [CrossRef]
- Jebastina, N.; Arulraj, G.P. Spatial prediction of nitrate concentration using gis and anfis modelling in groundwater. Bull. Environ. Contam. Toxicol. 2018, 101, 403–409. [Google Scholar] [CrossRef] [PubMed]
- Farhangi, F.; Sadeghi-Niaraki, A.; Nahvi, A.; Razavi-Termeh, S.V. Spatial modeling of accidents risk caused by driver drowsiness with data mining algorithms. Geocarto Int. 2020, 1–15. [Google Scholar] [CrossRef]
- Devkota, K.C.; Regmi, A.D.; Pourghasemi, H.R.; Yoshida, K.; Pradhan, B.; Ryu, I.C.; Dhital, M.R.; Althuwaynee, O.F. Landslide susceptibility mapping using certainty factor, index of entropy and logistic regression models in gis and their comparison at mugling–narayanghat road section in nepal himalaya. Nat. Hazards 2013, 65, 135–165. [Google Scholar] [CrossRef]
- Razavi-Termeh, S.V.; Sadeghi-Niaraki, A.; Choi, S.-M. Asthma-prone areas modeling using a machine learning model. Sci. Rep. 2021, 11, 1–16. [Google Scholar] [CrossRef] [PubMed]
- Shogrkhodaei, S.Z.; Razavi-Termeh, S.V.; Fathnia, A. Spatio-temporal modeling of pm2. 5 risk mapping using three machine learning algorithms. Environ. Pollut. 2021, 289, 117859. [Google Scholar] [CrossRef] [PubMed]
- Sjödin, H.; Wilder-Smith, A.; Osman, S.; Farooq, Z.; Rocklöv, J. Only strict quarantine measures can curb the coronavirus disease (COVID-19) outbreak in Italy, 2020. Eurosurveillance 2020, 25, 2000280. [Google Scholar] [CrossRef]
- Wilder-Smith, A.; Chiew, C.J.; Lee, V.J. Can we contain the COVID-19 outbreak with the same measures as for sars? Lancet Infect. Dis. 2020, 20, e102–e107. [Google Scholar] [CrossRef] [Green Version]
- Hou, C.; Chen, J.; Zhou, Y.; Hua, L.; Yuan, J.; He, S.; Guo, Y.; Zhang, S.; Jia, Q.; Zhao, C. The effectiveness of quarantine of wuhan city against the corona virus disease 2019 (COVID-19): A well-mixed seir model analysis. J. Med. Virol. 2020, 92, 841–848. [Google Scholar] [CrossRef] [Green Version]
- Silverman, B.W. Monographs on statistics and applied probability. Density Estim. Stat. Data Anal. 1986, 26, 1–22. [Google Scholar]
- Aquino, S.; de Lima, J.E.A.; da Silva, M.O.; de Sousa, G.F. Detection of pathogenic bacteria and fungi on biometric surface of automated teller machines located in brazilian public hospital. Afr. J. Microbiol. Res. 2019, 13, 219–231. [Google Scholar]
- Arastia, Z.; Hejazi, T.; Geilari, Z. Designing effective strategies to improve performance indicators of bread industry using system dynamics: A case study in Iran. J. Ind. Eng. Manag. Stud. 2015, 2, 74–94. [Google Scholar]
- Ralph, R.; Lew, J.; Zeng, T.; Francis, M.; Xue, B.; Roux, M.; Ostadgavahi, A.T.; Rubino, S.; Dawe, N.J.; Al-Ahdal, M.N. 2019-ncov (Wuhan virus), a novel coronavirus: Human-to-human transmission, travel-related cases, and vaccine readiness. J. Infect. Dev. Ctries. 2020, 14, 3–17. [Google Scholar] [CrossRef]
- Ren, Z.-L.; Hu, R.; Wang, Z.-W.; Zhang, M.; Ruan, Y.-L.; Wu, Z.-Y.; Wu, H.-B.; Hu, X.-P.; Hu, Z.-P.; Ren, W. Epidemiologic and clinical characteristics of heart transplant recipients during the 2019 coronavirus outbreak in Wuhan, China: A descriptive survey report. J. Heart Lung Transplant. 2020, 39, 412–417. [Google Scholar] [CrossRef] [Green Version]
- Wang, D.; Hu, B.; Hu, C.; Zhu, F.; Liu, X.; Zhang, J.; Wang, B.; Xiang, H.; Cheng, Z.; Xiong, Y. Clinical characteristics of 138 hospitalized patients with 2019 novel coronavirus—Infected pneumonia in Wuhan, China. JAMA 2020, 323, 1061–1069. [Google Scholar] [CrossRef]
- Graham, C. NHS england advises pharmacies to prepare ‘isolation space’ for patients with suspected COVID-19. Pharm. J. 2020. [Google Scholar]
- Sohrabi, C.; Alsafi, Z.; O’neill, N.; Khan, M.; Kerwan, A.; Al-Jabir, A.; Iosifidis, C.; Agha, R. World Health Organization declares global emergency: A review of the 2019 novel coronavirus (COVID-19). Int. J. Surg. 2020, 76, 71–76. [Google Scholar] [CrossRef] [PubMed]
- Yang, H.; Xu, J.; Li, Y.; Liang, X.; Jin, Y.; Chen, S.; Zhang, R.; Zhang, W.; Duan, G. The preliminary analysis on the characteristics of the cluster for the corona virus disease. Zhonghua Liu Xing Bing Xue Za Zhi Zhonghua Liuxingbingxue Zazhi 2020, 41, 623–628. [Google Scholar] [PubMed]
- Shaik, A.B.; Srinivasan, S. A Brief Survey on Random Forest Ensembles in Classification Model. In International Conference on Innovative Computing and Communications; Springer: Singapore, 2019; pp. 253–260. [Google Scholar]
- Kulkarni, V.Y.; Sinha, P.K. Pruning of random forest classifiers: A survey and future directions. In Proceedings of the 2012 International Conference on Data Science & Engineering (ICDSE), Cochin, India, 18–20 July 2012; pp. 64–68. [Google Scholar]
- Razavi-Termeh, S.V.; Sadeghi-Niaraki, A.; Choi, S.-M. Effects of air pollution in spatio-temporal modeling of asthma-prone areas using a machine learning model. Environ. Res. 2021, 200, 111344. [Google Scholar] [CrossRef] [PubMed]
- Solaimani, K.; Mousavi, S.Z.; Kavian, A. Landslide susceptibility mapping based on frequency ratio and logistic regression models. Arab. J. Geosci. 2013, 6, 2557–2569. [Google Scholar] [CrossRef]
- Razavi-Termeh, S.V.; Sadeghi-Niaraki, A.; Choi, S.-M. Gully erosion susceptibility mapping using artificial intelligence and statistical models. Geomat. Nat. Hazards Risk 2020, 11, 821–844. [Google Scholar] [CrossRef]
- Razavi-Termeh, S.V.; Khosravi, K.; Sadeghi-Niaraki, A.; Choi, S.-M.; Singh, V.P. Improving groundwater potential mapping using metaheuristic approaches. Hydrol. Sci. J. 2020, 65, 2729–2749. [Google Scholar] [CrossRef]
- Walia, N.; Singh, H.; Sharma, A. Anfis: Adaptive neuro-fuzzy inference system—A survey. Int. J. Comput. Appl. 2015, 123, 32–38. [Google Scholar] [CrossRef]
- Ranjgar, B.; Razavi-Termeh, S.V.; Foroughnia, F.; Sadeghi-Niaraki, A.; Perissin, D. Land subsidence susceptibility mapping using persistent scatterer sar interferometry technique and optimized hybrid machine learning algorithms. Remote Sens. 2021, 13, 1326. [Google Scholar] [CrossRef]
- Muda, Z.; Yassin, W.; Sulaiman, M.N.; Udzir, N.I. Intrusion detection based on k-means clustering and oner classification. In Proceedings of the 2011 7th International Conference on Information Assurance and Security (IAS), Malacca, Malaysia, 5–8 December 2011; pp. 192–197. [Google Scholar]
- Benesty, J.; Chen, J.; Huang, Y.; Cohen, I. Pearson Correlation Coefficient. In Noise Reduction in Speech Processing; Springer: Berlin/Heidelberg, Germany, 2009; pp. 1–4. [Google Scholar]
- Razavi-Termeh, S.V.; Shirani, K.; Pasandi, M. Mapping of landslide susceptibility using the combination of neuro-fuzzy inference system (anfis), ant colony (anfis-acor), and differential evolution (anfis-de) models. Bull. Eng. Geol. Environ. 2021, 80, 2045–2067. [Google Scholar] [CrossRef]
- Razavi-Termeh, S.V.; Sadeghi-Niaraki, A.; Choi, S.-M. Spatial modeling of asthma-prone areas using remote sensing and ensemble machine learning algorithms. Remote Sens. 2021, 13, 3222. [Google Scholar] [CrossRef]
- Nhu, V.-H.; Mohammadi, A.; Shahabi, H.; Ahmad, B.B.; Al-Ansari, N.; Shirzadi, A.; Clague, J.J.; Jaafari, A.; Chen, W.; Nguyen, H. Landslide susceptibility mapping using machine learning algorithms and remote sensing data in a tropical environment. Int. J. Environ. Res. Public Health 2020, 17, 4933. [Google Scholar] [CrossRef]
- Vafakhah, M.; Mohammad Hasani Loor, S.; Pourghasemi, H.; Katebikord, A. Comparing performance of random forest and adaptive neuro-fuzzy inference system data mining models for flood susceptibility mapping. Arab. J. Geosci. 2020, 13, 1–16. [Google Scholar]
- Chang, K.-T.; Merghadi, A.; Yunus, A.P.; Pham, B.T.; Dou, J. Evaluating scale effects of topographic variables in landslide susceptibility models using gis-based machine learning techniques. Sci. Rep. 2019, 9, 1–21. [Google Scholar] [CrossRef] [Green Version]


| Land Use | Number of Land Uses | Format |
|---|---|---|
| ATM | 1084 | Point |
| Bank | 2378 | Point |
| Bakery | 900 | Point |
| Fuel station | 102 | Point |
| Hospital | 196 | Point |
| Pharmacy | 661 | Point |
| Supermarket | 443 | Point |
| Public transportation station | 2113 | Point |
| RF | ANFIS | LR | ||||
|---|---|---|---|---|---|---|
| Train | Test | Train | Test | Train | Test | |
| RMSE | 0.1963 | 0.549 | 0.277 | 0.557 | 0.365 | 0.571 |
| MAE | 0.176 | 0.511 | 0.2511 | 0.520 | 0.33 | 0.526 |
| Variable | Coefficient | Std. Error |
|---|---|---|
| Public transportation stations | 0.794 | 0.434 |
| Banks | 0.075 | 0.42 |
| Pharmacies | 0.899 | 0.276 |
| Fuel stations | 0.747 | 0.214 |
| Bakeries | 0.4 | 0.397 |
| Hospitals | 0.515 | 0.413 |
| ATMs | 0.057 | 0.316 |
| Supermarkets | 0.499 | 0.352 |
| Constant | 0.586 | - |
| Algorithms | AUC | SE | 95% CI |
|---|---|---|---|
| RF | 0.803 | 0.0343 | 0.734–0.861 |
| ANFIS | 0.758 | 0.0381 | 0.685–0.821 |
| LR | 0.747 | 0.0381 | 0.673–0.812 |
| Pair-Wise Algorithm | Z Value | p-Value | Significant |
|---|---|---|---|
| RF-ANFIS | 6.3 | <0.0001 | Yes |
| RF-LR | 5.8 | <0.0001 | Yes |
| LR-ANFIS | 3.7 | <0.0001 | Yes |
Publisher’s Note: MDPI stays neutral with regard to jurisdictional claims in published maps and institutional affiliations. |
© 2021 by the authors. Licensee MDPI, Basel, Switzerland. This article is an open access article distributed under the terms and conditions of the Creative Commons Attribution (CC BY) license (https://creativecommons.org/licenses/by/4.0/).
Share and Cite
Razavi-Termeh, S.V.; Sadeghi-Niaraki, A.; Farhangi, F.; Choi, S.-M. COVID-19 Risk Mapping with Considering Socio-Economic Criteria Using Machine Learning Algorithms. Int. J. Environ. Res. Public Health 2021, 18, 9657. https://doi.org/10.3390/ijerph18189657
Razavi-Termeh SV, Sadeghi-Niaraki A, Farhangi F, Choi S-M. COVID-19 Risk Mapping with Considering Socio-Economic Criteria Using Machine Learning Algorithms. International Journal of Environmental Research and Public Health. 2021; 18(18):9657. https://doi.org/10.3390/ijerph18189657
Chicago/Turabian StyleRazavi-Termeh, Seyed Vahid, Abolghasem Sadeghi-Niaraki, Farbod Farhangi, and Soo-Mi Choi. 2021. "COVID-19 Risk Mapping with Considering Socio-Economic Criteria Using Machine Learning Algorithms" International Journal of Environmental Research and Public Health 18, no. 18: 9657. https://doi.org/10.3390/ijerph18189657