
Physical Characteristics and Physical Fitness Profiles of Korean Taekwondo Athletes: A Systematic Review


Abstract
1. Introduction
2. Materials and Methods
2.1. Search Strategy
2.2. Inclusion and Exclusion Criteria
2.3. Data Extraction
2.4. Data Calculation and Statistical Analysis
2.4.1. Pooled Mean Calculation
2.4.2. Pooled Standard Deviation Calculation
2.4.3. Estimated Physical Characteristic and Physical Fitness Value Calculation
2.4.4. Estimation Error Calculation
3. Results
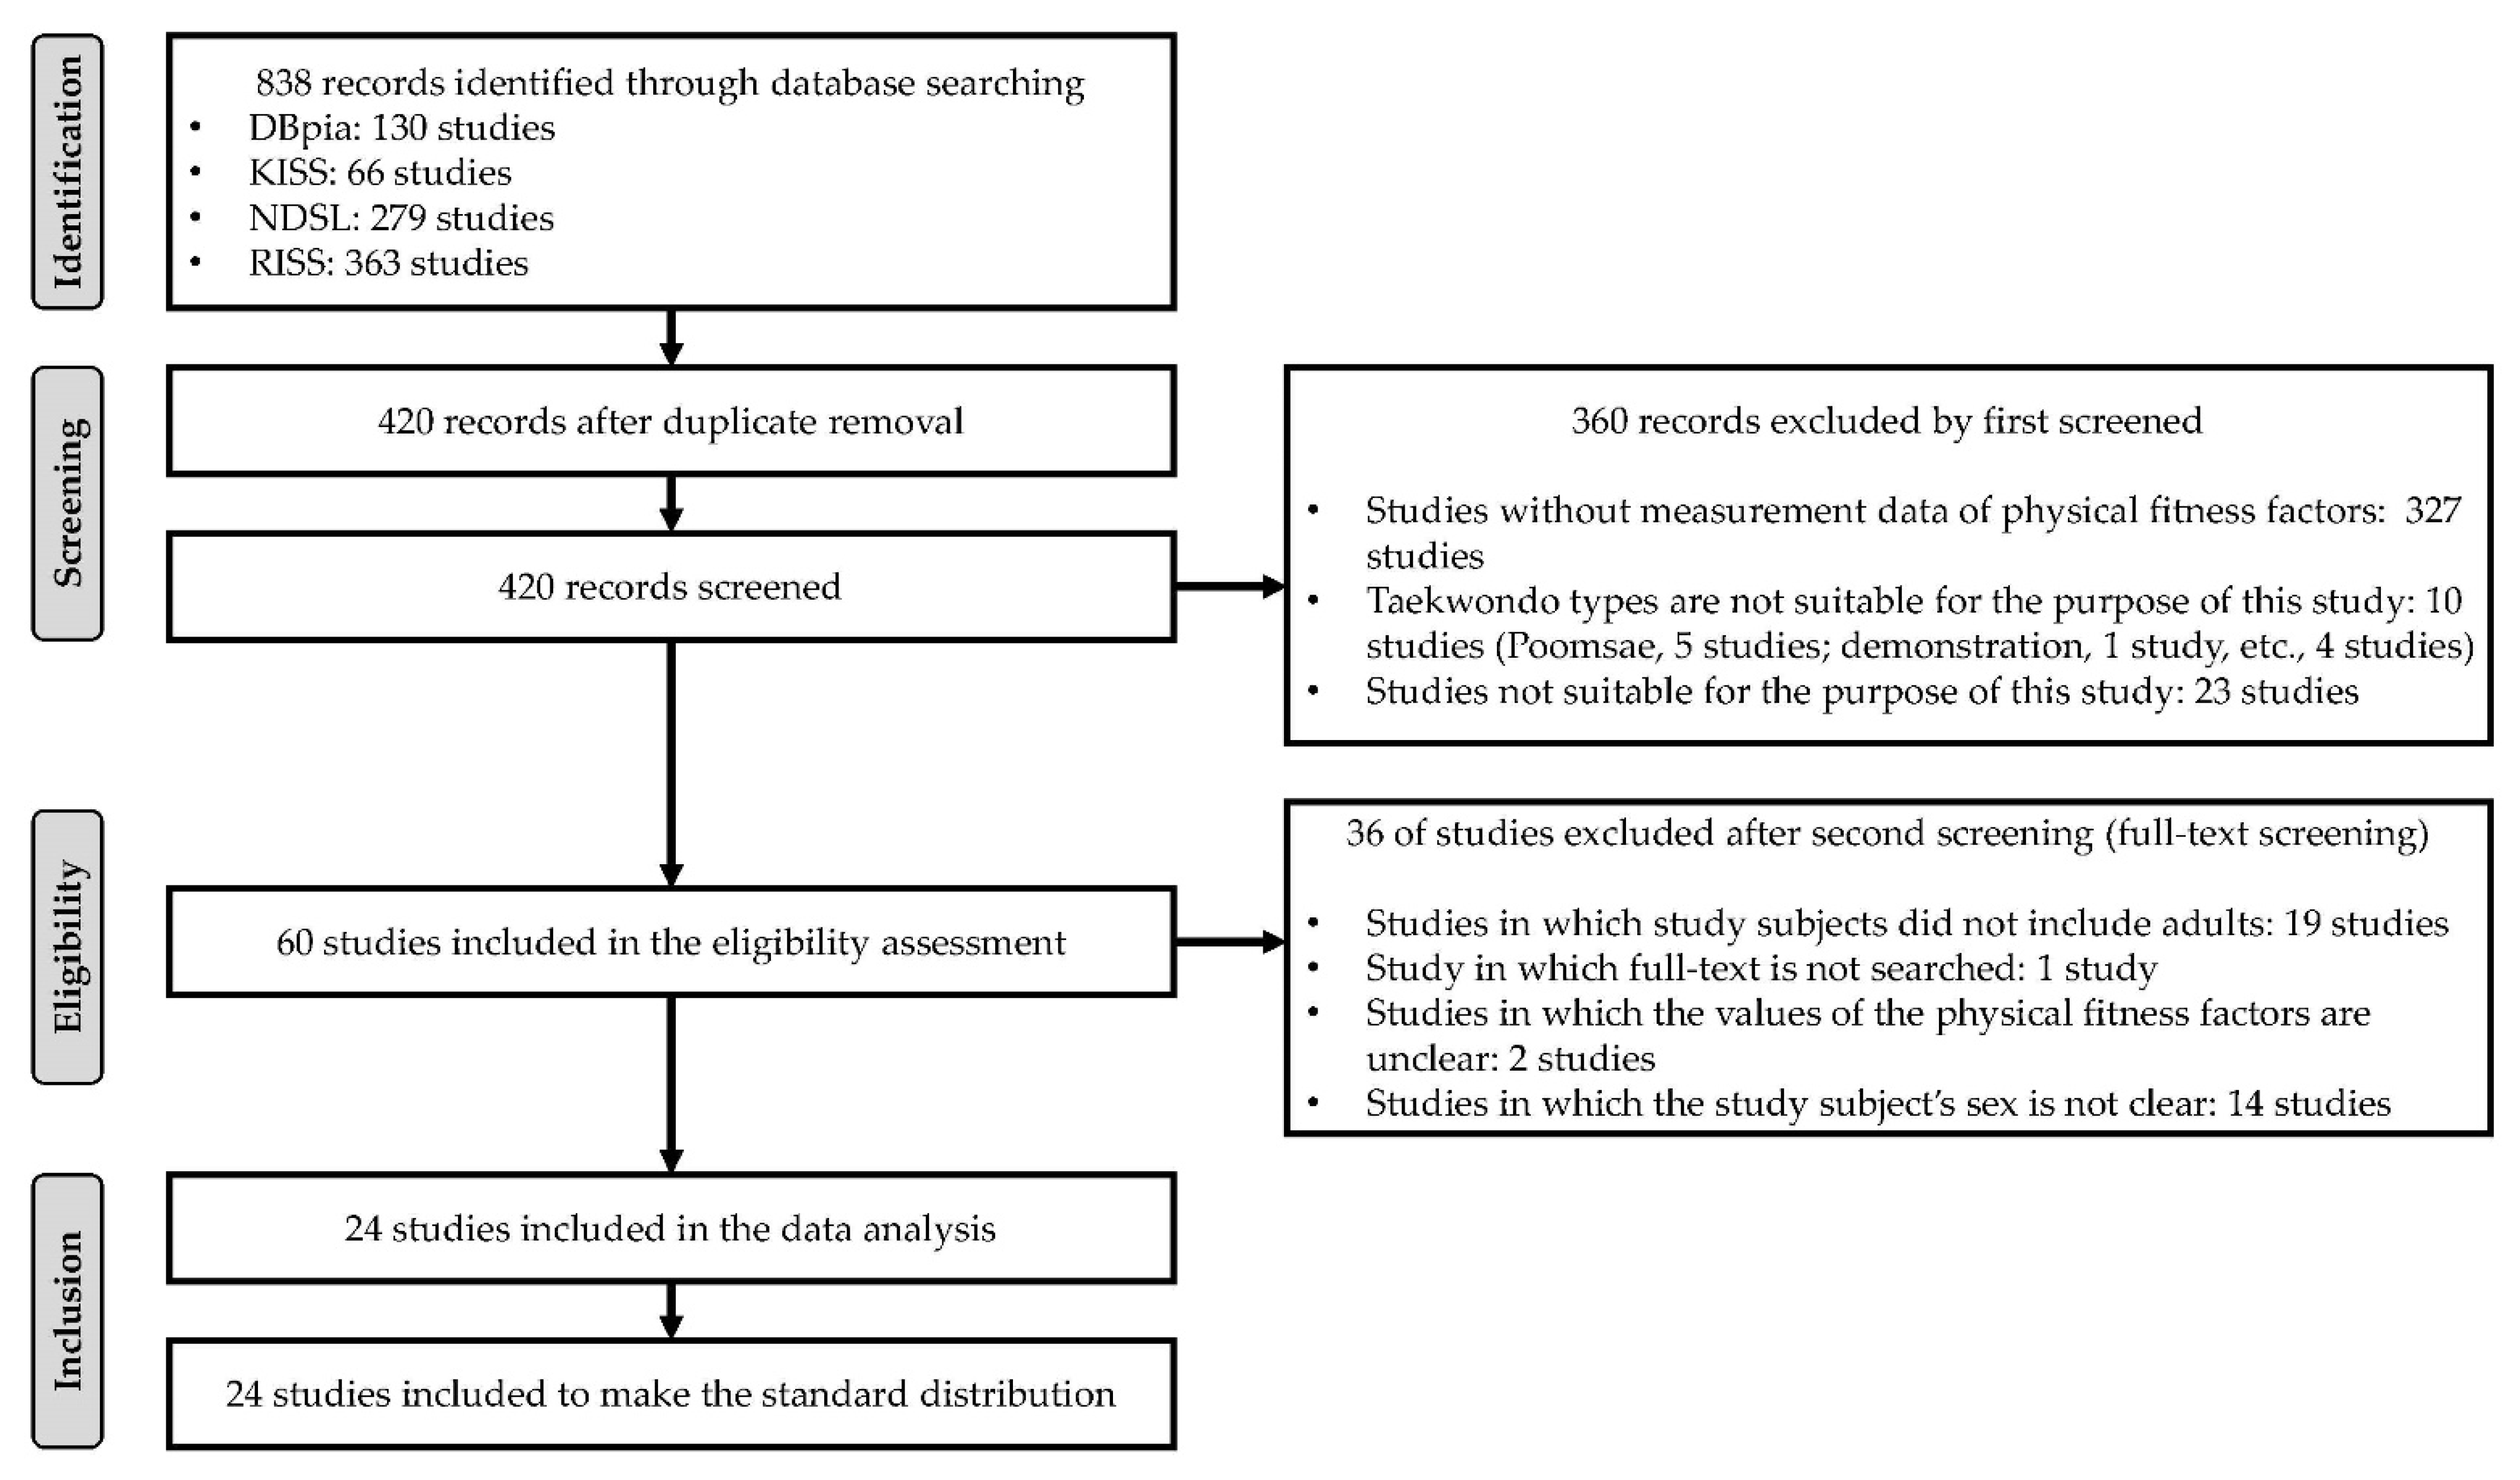
3.1. Study Selection
3.2. Study Characteristics
3.3. Pooled Mean Value and Estimated Error
3.3.1. Physical Characteristics
3.3.2. Physical Fitness Variables
3.4. Estimated Normal Distribution and 95% Confidence Interval
3.4.1. Physical Characteristics
3.4.2. Physical Fitness Variables
4. Discussion
5. Conclusions
Author Contributions
Funding
Institutional Review Board Statement
Informed Consent Statement
Data Availability Statement
Conflicts of Interest
References
- Janiszewska, K.; Przybyłowicz, K. Pre-competition weight loss among Polish taekwondo competitors–occurrence, methods and health consequences. Arch. Budo 2015, 11, 41–45. [Google Scholar]
- Kazemi, M.; Waalen, J.; Morgan, C.; White, A.R. A profile of olympic taekwondo competitors. J. Sports Sci. Med. 2006, 5, 114–121. [Google Scholar]
- Kim, H.-B.; Jung, H.-C.; Song, J.-K.; Chai, J.-H.; Lee, E.-J. A follow-up study on the physique, body composition, physical fitness, and isokinetic strength of female collegiate Taekwondo athletes. J. Exerc. Rehabil. 2015, 11, 57–64. [Google Scholar] [CrossRef]
- Campos, F.A.; Bertuzzi, R.; Dourado, A.C.; Santos, V.G.; Franchini, E. Energy demands in taekwondo athletes during combat simulation. Graefe’s Arch. Clin. Exp. Ophthalmol. 2011, 112, 1221–1228. [Google Scholar] [CrossRef] [PubMed]
- Ball, N.; Nolan, E.; Wheeler, K. Anthropometrical, Physiological, and Tracked Power Profiles of Elite Taekwondo Athletes 9 Weeks before the Olympic Competition Phase. J. Strength Cond. Res. 2011, 25, 2752–2763. [Google Scholar] [CrossRef] [PubMed]
- Zar, A.; Gilani, A.; Ebrahim, K.; Gorbani, M. A survey of the physical fitness of the male taekwondo athletes of the Iranian national team. Facta Univ. Ser. Phys. Educ. Sport 2008, 6, 21–29. [Google Scholar]
- Seo, M.-W.; Jung, H.-C.; Song, J.-K.; Kim, H.-B. Effect of 8 weeks of pre-season training on body composition, physical fitness, anaerobic capacity, and isokinetic muscle strength in male and female collegiate taekwondo athletes. J. Exerc. Rehabil. 2015, 11, 101–107. [Google Scholar] [CrossRef]
- Andreato, L.V.; Lara, F.J.D.; Andrade, A.; Branco, B.H.M. Physical and Physiological Profiles of Brazilian Jiu-Jitsu Athletes: A Systematic Review. Sports Med. Open 2017, 3, 9. [Google Scholar] [CrossRef]
- Heller, J.; Peric, T.; Dlouha, R.; Kohlikova, E.; Melichna, J.; Nováková, H. Physiological profiles of male and female taekwon-do (ITF) black belts. J. Sports Sci. 1998, 16, 243–249. [Google Scholar] [CrossRef]
- Marković, G.; Misigoj-Duraković, M.; Trninić, S. Fitness profile of elite Croatian female taekwondo athletes. Coll. Antropol. 2005, 29, 93–99. [Google Scholar] [PubMed]
- Mathunjwa, M.; Mugandani, S.; Djarova-Daniels, T.; Ngcobo, M.; Ivanov, S. Physical, anthropometric and physiological profiles of experienced junior male and female South African Taekwondo athletes. Afr. J. Phys. Health Educ. Recreat. Danc. 2015, 21, 1402–1416. [Google Scholar]
- Bridge, C.A.; da Silva Santos, J.F.; Chaabene, H.; Pieter, W.; Franchini, E. Physical and Physiological Profiles of Taekwondo Athletes. Sports Med. 2014, 44, 713–733. [Google Scholar] [CrossRef]
- da Silva Santos, J.F.; Wilson, V.D.; Herrera-Valenzuela, T.; Machado, F.S.M. Time-Motion Analysis and Physiological Responses to Taekwondo Combat in Juvenile and Adult Athletes: A Systematic Review. Strength Cond. J. 2020, 42, 103–121. [Google Scholar] [CrossRef]
- Krithikadatta, J. Normal distribution. J. Conserv. Dent. 2014, 17, 96–97. [Google Scholar] [CrossRef]
- Impellizzeri, F.M.; Bizzini, M. SYSTEMATIC REVIEW AND META-ANALYSIS: A PRIMER. Int. J. Sports Phys. Ther. 2012, 7, 493–503. [Google Scholar] [PubMed]
- Cho, C.-H.; Choi, C.-Y.; Lee, S.-E.; Shin, K.-C.; Song, E.-K.; Hyun, S.-J.; Lee, C.-Y.; Park, M.-S. Respiratory Circulatory Function and Knee Joint Equi-Speed Kinetic Capacity of College Taekwondo Athletes. J. World Soc. Taekwondo Cult. 2011, 2, 1–11. [Google Scholar]
- Cho, H.-C. The Characteristics and Correlations of ACE and ACTN-3 Gene Polymorphism between Aerobic and Anaerobic Power, and Bone Density in Martial Arts Athletic. J. Korean Alliance Martial Arts 2020, 22, 191–203. [Google Scholar]
- Feng, H.W.; Wang, J.-M.; Qian, C.; Cho, I.-H.; Cho, H.-C. The Relations between ACE Gene Polymorphism and Aerobic, Anaerobic Performance as Well as BMD of Taekwondo Athletes in Different Competition Types. Taekwondo J. Kukkiwon 2020, 11, 255–272. [Google Scholar] [CrossRef]
- Hong, C.-B.; Lee, S.-J.; Park, J.-S. Comparative Analysis of Physical Fitness Factors, Anaerobic Exercise Capacity, and Isokinetic Muscle Function of Male College Taekwondo Excellent Players and Non-excellent Players. J. Coach. Dev. 2020, 22, 123–131. [Google Scholar] [CrossRef]
- Jang, J.-E.; Park, E.H. Comparison of Anaerobic Capacity and Physical Ability of Athletes by Specific Events in Taekwondo. Taekwondo J. Kukkiwon 2020, 11, 91–102. [Google Scholar] [CrossRef]
- Jang, J.-E. Comparison of Anaerobic Exercise Performance, Fatigue Factors and Physical Capacity of Taekwondo Kyorugi and Poomsae Athletes. Graduate School of Sungshin Women’s University. 2020. Available online: http://dcollection.sungshin.ac.kr/public_resource/pdf/000000013822_20210910091946.pdf (accessed on 10 September 2021).
- Jung, J.-S. Isokinetic Strength Capacity between Elite Athletes and Taekwondo Player. J. Learn. Curric. Instr. 2015, 15, 649–664. [Google Scholar]
- Kim, S.-J.; Lee, H.-S. A Comparative Analysis of Body Types, Strength Traits between Excellent Players and Non-excellent Players: Centering on Boxing Players and Taekwon-do Players. Yongln Unlverslty J. Martlal Arts Instltute 2011, 22, 125–137. [Google Scholar]
- Kim, A.-N.; Yoon, O.-N.; Cho, W.-J. The Effects of Plyometric Training on Physical Fitness and Isokinetic Muscular Strength in Male Taekwondo Players. Korean J. Sport 2012, 10, 201–211. [Google Scholar]
- Kwon, T.-W.; Cho, H.-S. A Study on the Way of Training for physical fitness for players of Tae Kwon Do Demonstration and Gyurugi(Competition). Korean J. Sports Sci. 2017, 26, 1217–1225. [Google Scholar] [CrossRef]
- Kwon, T.-W.; Cho, H.-S. Professional physical strength according to the level of training of university Taekwondo competition player and a comparative analysis of Trumk”s isokinetic myofunction. Korean J. Sports Sci. 2019, 28, 885–896. [Google Scholar] [CrossRef]
- Lee, Y.-H.; Ham, W.-T. The effect of the short period high intensity winter training program on improvement of physical fitness in male university Taekwondo competition players. Korean J. Sports Sci. 2018, 27, 1127–1137. [Google Scholar] [CrossRef]
- Monks, L. The Effects of 4 Weeks of High Intensity Interval Training on the Body Composition, Physical Fitness, Aerobic and Anaerobic Capacity and Isokinetic Muscle Strength of Collegiate Taekwondo Athletes. Graduate School of Kyunghee University. 2016. Available online: http://khu.dcollection.net/public_resource/pdf/200000056139_20210910092132.pdf (accessed on 10 September 2021).
- Moon, H.-W.; Park, H.-Y.; Sunoo, S.; Nam, S.-S. The effect of short-term normobaric hypoxic training on maximal oxygen consumption, erythropoietin and blood lactate level in Taekwondo players. Korean J. Sports Sci. 2016, 25, 793–803. [Google Scholar]
- Noh, J.-W. Analysis of Physical Characteristics of Elite Athletes in Martial Arts and Combat Sports for Orthopedic Manipulative Physical Therapy Research. Graduate School of Rehabilitation & Welfare Yongin University. 2015. Available online: http://yongin.dcollection.net/public_resource/pdf/000001952556_20210910092410.pdf (accessed on 10 September 2021).
- Park, E.-H.; Yang, Y.-K. Effects of anaerobic exercise on physical strength according to Taekwondo weight class. J. Converging Sport Exerc. Sci. 2020, 18, 73–81. [Google Scholar]
- Park, J.-H. The Effects of Caffeine Intake for 12 Weeks on Body Compositions, Physical Fitness, Stress, and Liver Functions of Elite Taekwondo Athletes. Graduate School of Physical Education Kyunghee University. 2016. Available online: http://khu.dcollection.net/public_resource/pdf/200000056132_20210910092541.pdf (accessed on 10 September 2021).
- Song, J.-K.; Jung, H.-C.; Kang, H.-J.; Kim, H.-B. Gender-related Difference of Body Composition, Aerobic, Anaerobic Capacity and Isokinetic Muscle Strength in Collegiate Taekwondo Athletes. J. Sport Leis. Stud. 2010, 40, 699–708. [Google Scholar] [CrossRef]
- Tak, H.-K.; Jang, J.-O.; Kim, J.-W.; Choi, H.-M. A Study on the Improvement of Competitiveness by Comparing Physical Fitness Factors among Demonstrators in Taekwondo Competition. Taekwondo J. Kukkiwon 2019, 10, 283–299. [Google Scholar] [CrossRef]
- Yoo, D.-S.; Park, H.-Y.; Kim, H.-J.; Lee, M.-G. Effects of Types of Recovery Treatment and Glucose Supplementation on Physical Fitness in Male Collegiate Taekwondo Athletes. J. Korean Alliance Martial Arts 2015, 17, 33–44. [Google Scholar]
- Yoo, D.-S.; Park, H.-Y.; Lee, M.-G. Effects of type of recovery treatment on fatigue-related blood variables and physical fitness in male collegiate taekwondo players. Exerc. Sci. 2011, 20, 261–272. [Google Scholar]
- Han, D.-J. The Effects of 6 Week Conditioning Training on Body Composition, Physical Fitness, and Isokinetic Muscle Strength in Collegiate Female Taekwondo Athletes. Graduate School of Education Kyung Hee University. 2014. Available online: http://khu.dcollection.net/public_resource/pdf/200000055310_20210910092637.pdf (accessed on 10 September 2021).
- Song, J.-K.; Han, D.-J.; Jung, H.-C.; Kang, H.-J.; Seo, M.-W.; Clarke, J.A.; Kim, H.-B. Does Pre-season Training Improve Body Composition, Physical Fitness, and Isokinetic Muscle Strength in Female Taekwondo Athletes? Acta Taekwondo et Martialis Artium (JIATR) 2015, 2, 6–15. Available online: https://preview.kstudy.com/kiss61/paperSearchPreview.asp?a_code=8091001073000v01&code=8639290019580013102&isDownLoad=0 (accessed on 10 September 2021).
- Pieter, W. Performance characteristics of elite taekwondo athletes. Korean J. Sport Sci. 1991, 3, 94–117. [Google Scholar]
- Bouhlel, E.; Jouini, A.; Gmada, N.; Nefzi, A.; Abdallah, K.B.; Tabka, Z. Heart rate and blood lactate responses during Taekwondo training and competition. Sci. Sports 2006, 21, 285–290. [Google Scholar] [CrossRef]
- Cao, Z.-B.; Miyatake, N.; Higuchi, M.; Ishikawa-Takata, K.; Miyachi, M.; Tabata, I. Prediction of VO2max with daily step counts for Japanese adult women. Graefe’s Arch. Clin. Exp. Ophthalmol. 2009, 105, 289–296. [Google Scholar] [CrossRef]
- McArdle, W.D.; Katch, F.I.; Katch, V.L. Exercise physiology: Nutrition, Energy, and Human Performance. Lippincott Williams & Wilkins: Philadelphia, PA, USA, 2010. [Google Scholar]
- Wier, L.T.; Jackson, A.S.; Ayers, G.W.; Arenare, B. Nonexercise models for estimating VO2max with waist girth, percent fat, or BMI. Med. Sci. Sports Exerc. 2006, 38, 555–561. [Google Scholar] [CrossRef]
- Chun, S.-Y. Comparative of Angle of Calcaneus, Balance, Circumference of Calf and Isokinetic Strength of Ankle on Athletic Performances in Soccer Players. Korean J. Sports Sci. 2015, 24, 1101–1110. [Google Scholar]
- Choi, D.-S.; Park, M.-H.; Kim, Y.-Y.; Kim, J.-G.; Chae, W.-S. Effects of 12-week core exercise program on isokinetic muscular function, balance and basic physical fitness of female high school volleyball players. Korean J. Sports Sci. 2019, 28, 1251–1263. [Google Scholar] [CrossRef]
- Park, E. Overestimation and Underestimation: Adolescents’ Weight Perception in Comparison to BMI-Based Weight Status and How It Varies Across Socio-Demographic Factors. J. Sch. Health 2011, 81, 57–64. [Google Scholar] [CrossRef]
- Provencher, M.T.; Chahla, J.; Sanchez, G.; Cinque, M.E.; Kennedy, N.I.; Whalen, J.; Price, M.D.; Moatshe, G.; LaPrade, R.F. Body Mass Index Versus Body Fat Percentage in Prospective National Football League Athletes: Overestimation of Obesity Rate in Athletes at the National Football League Scouting Combine. J. Strength Cond. Res. 2018, 32, 1013–1019. [Google Scholar] [CrossRef]
- Chiodo, S.; Tessitore, A.; Lupo, C.; Ammendolia, A.; Cortis, C.; Capranica, L. Effects of official youth taekwondo competitions on jump and strength performance. Eur. J. Sport Sci. 2012, 12, 113–120. [Google Scholar] [CrossRef]
- Bridge, C.A.; Jones, M.A.; Hitchen, P.; Sanchez, X. Heart rate responses to Taekwondo training in experienced practitioners. J. Strength Cond. Res. 2007, 21, 718. [Google Scholar]
- Ke-tien, Y. Training periodization in lower limb performance and neuromuscular controlling in taekwondo athletes. Life Sci. J. 2012, 9, 850–857. [Google Scholar]
- Bridge, C.A.; Jones, M.A.; Drust, B. Physiological Responses and Perceived Exertion during International Taekwondo Competition. Int. J. Sports Physiol. Perform. 2009, 4, 485–493. [Google Scholar] [CrossRef]
- Casolino, E.; Cortis, C.; Lupo, C.; Chiodo, S.; Minganti, C.; Capranica, L. Physiological Versus Psychological Evaluation in Taekwondo Elite Athletes. Int. J. Sports Physiol. Perform. 2012, 7, 322–331. [Google Scholar] [CrossRef] [PubMed][Green Version]
- Kim, H.-B.; Stebbins, C.L.; Chai, J.-H.; Song, J.-K. Taekwondo training and fitness in female adolescents. J. Sports Sci. 2011, 29, 133–138. [Google Scholar] [CrossRef]


| p(%) | 1% | 5% | 10% | 20% | 30% | 40% | 50% | 60% | 70% | 80% | 90% | 95% | 99% |
|---|---|---|---|---|---|---|---|---|---|---|---|---|---|
| Z | −2.33 | −1.64 | −1.28 | −0.84 | −0.52 | −0.25 | 0.00 | 0.25 | 0.52 | 0.84 | 1.28 | 1.64 | 2.33 |
| Sex | Study | Sample Size | Age (y) | Career (y) | Weight (kg) | Outcome Variables |
|---|---|---|---|---|---|---|
| Male | Cho et al., 2011 [16] | 40 | 20.56 ± 1.25 | >5 | 75.33 ± 8.68 | Physiques (height, body fat); Cardiorespiratory endurance (VO2max, HRmax); Isokinetic muscular strength (left knee joint flexion at 60°/s, left knee joint extension at 60°/s, right knee joint flexion at 60°/s, right knee joint extension at 60°/s) |
| Cho, 2020 [17] | 67 | 19.69 ± 1.13 | NR | 70.48 ± 7.56 | Physiques (height, BMI) | |
| Feng et al., 2020 [18] | 27 | 19.7 ± 1.03 | NR | 70.5 ± 8.73 | Physiques (height, BMI); Cardiorespiratory endurance (VO2max); Isokinetic muscular strength (peak anaerobic power) | |
| Hong et al., 2020 [19] | 28 | 20.18 ± 10.8 | 9.61 ± 2.27 | 74.01 ± 8.29 | Physiques (height, BMI, body fat, fat mass, LBM, thigh circumference); Muscular strength (back strength); Muscular endurance (sit-up per 60 s); Muscular power (standing long jump, vertical jump); Flexibility (backward flexion, sit and reach); Balance (eyes-closed single-leg stance); Agility (whole-body reaction time to light, whole-body reaction time to sound); Isokinetic muscular strength (average power, relative peak anaerobic power, absolute peak anaerobic, peak drop, total energy, left knee joint flexion at 60°/s, left knee joint extension at 60°/s, right knee joint flexion at 60°/s, right knee joint extension at 60°/s) | |
| Jang and Park, 2020 [20] | 10 | 20.7 ± 0.95 | NR | 69.8 ± 1.17 | Physiques (height, BMI, body fat); Muscular endurance (sit-up per 30 s, sit-up per 60 s); Muscular power (standing long jump); Flexibility (sit and reach); Isokinetic muscular strength (average power, relative peak anaerobic power, absolute peak anaerobic power, peak drop) | |
| Jang, 2020 [21] | 10 | 20.7 ± 0.95 | NR | 69.8 ± 4.93 | Physiques (height, BMI, body fat); Muscular endurance (sit-up per 30 s, sit-up per 60 s); Muscular power (standing long jump); Flexibility (sit and reach); Isokinetic muscular strength (average power, relative peak anaerobic power, absolute peak anaerobic power, peak drop) | |
| Jung, 2015 [22] | 16 | 22.44 ± 0.96 | NR | 70.23 ± 6.28 | Physiques (height); Muscular strength (back strength, hand grip); Muscular endurance (push-up per 60 s, sit-up per 60 s); Muscular power (vertical jump); Flexibility (sit and reach); Isokinetic muscular strength (left knee joint flexion at 60°/s, left knee joint extension at 60°/s, right knee joint flexion at 60°/s, right knee joint extension at 60°/s, left knee joint flexion at 180°/s, left knee joint extension at 180°/s, right knee joint flexion at 180°/s, right knee joint extension at 180°/s, left hip joint flexion at 60°/s, left hip joint extension at 60°/s, right hip joint flexion at 60°/s, right hip joint extension at 60°/s, left hip joint flexion at 180°/s, left hip joint extension at 180°/s, right hip joint flexion at 180°/s, right hip joint extension at 180°/s, trunk joint flexion at 60°/s, and trunk joint extension at 60°/s | |
| Male | Kim and Lee, 2011 [23] | 14 | NR | ≥10 | 71.01 ± 11.15 | Physiques (height, BMI, body fat, LBM, and thigh circumference); muscular strength (back strength, left hand grip, and right hand grip); muscular power (vertical jump); flexibility (backward flexion, sit and reach); agility (whole-body reaction time to light, whole-body reaction time to sound); and isokinetic muscular strength (relative peak anaerobic power, peak drop) |
| Kim et al., 2012 [24] | 20 | NR | NR | 68.80 ± 8.29 | Physiques (height, body fat); muscular strength (back strength); muscular endurance (sit-up per 30 s); muscular power (vertical jump); flexibility (sit and reach); and cardiorespiratory endurance (VO2max) | |
| Kwon and Cho, 2017 [25] | 8 | 21.70 ± 1.50 | ≥10 | 66.50 ± 3.15 | Physiques (height, body fat, and thigh circumference); muscular strength (hand grip); muscular endurance (sit-up per 60 s); muscular power (standing long jump, vertical jump); cardiorespiratory endurance (Harvard step test); flexibility (sit and reach); and balance (eyes-closed single-leg stance) | |
| Kwon and Cho, 2019 [26] | 14 | 22.50 ± 1.56 | 10.45 ± 2.63 | 72.57 ± 2.20 | Physiques (height); agility (eyes-closed single-leg stance); muscular strength (left hand grip, right hand grip); muscular endurance (sit-up per 30 s); muscular power (standing long jump, vertical jump); flexibility (sit and reach); and agility (whole-body reaction time to sound) | |
| Lee and Ham, 2018 [27] | 13 | 20.00 ± 1.08 | 6.23 ± 1.23 | 72.57 ± 11.12 | Physiques (height) | |
| Monks, 2016 [28] | 17 | 19.78 ± 0.58 | 7.98 ± 2.13 | 74.46 ± 10.47 | Physiques (height, body fat, and LBM); muscular endurance (sit-up per 60 s); muscular power (vertical jump); cardiorespiratory endurance (VO2max, HRmax, and all-out duration time); flexibility (sit and reach); and isokinetic muscular strength (average power, relative peak anaerobic power, absolute peak anaerobic power, peak drop, left knee joint flexion at 60°/s, left knee joint extension at 60°/s, right knee joint flexion at 60°/s, right knee joint extension at 60°/s, left knee joint flexion at 180°/s, left knee joint extension at 180°/s, right knee joint flexion at 180°/s, and right knee joint extension at 180°/s) | |
| Moon et al., 2016 [29] | 11 | 19.64 ± 0.92 | NR | 74.29 ± 10.56 | Physiques (height) | |
| Noh, 2015 [30] | 31 | 19.60 ± 0.20 | 7.80 ± 0.30 | 72.50 ± 1.70 | Physiques (height, BMI) | |
| Park & Yang, 2020 [31] | 8 | 20.9 ± 1.06 | NR | 69.65 ± 2.35 | Physiques (height, BMI, body fat); muscular endurance (sit-up per 30 s, sit-up per 60 s); muscular power (standing long jump); isokinetic muscular strength (average power, relative peak anaerobic power, absolute peak anaerobic power, and peak drop) | |
| Park, 2016 [32] | 29 | 18.87 ± 0.24 | NR | 70.09 ± 4.11 | Physiques (height, BMI, body fat, fat mass, and LBM); muscular strength (hand grip); muscular endurance (sit-up per 60 s); muscular power (standing long jump); cardiorespiratory endurance (20-m MST); flexibility (sit and reach); and agility (10-m two repeated run test) | |
| Seo et al., 2015 [7] | 22 | 19.40 ± 0.95 | 9.50 ± 1.91 | 69.80 ± 9.46 | Physiques (height, body fat, fat mass, and LBM); muscular power (standing long jump); cardiorespiratory endurance (20-m MST); flexibility (sit and reach); and isokinetic muscular strength (relative peak anaerobic power, and peak drop) | |
| Male | Song et al., 2010 [33] | 10 | 19.40 ± 1.20 | NR | 69.30 ± 3.80 | Physiques (height, body fat, and fat mass); cardiorespiratory endurance (VO2max, HRmax); isokinetic muscular strength (relative peak anaerobic power, peak drop, left knee joint flexion at 60°/s, left knee joint extension at 60°/s, right knee joint flexion at 60°/s, right knee joint extension at 60°/s, left knee joint flexion at 180°/s, left knee joint extension at 180°/s, right knee joint flexion at 180°/s, and right knee joint extension at 180°/s) |
| Tak et al., 2019 [34] | 15 | 19.20 ± 0.78 | >6 | 74.87 ± 10.28 | Physiques (height); muscular strength (left hand grip, right hand grip); muscular endurance (sit-up per 60 s); muscular power (standing long jump); cardiorespiratory endurance (VO2max); flexibility (sit and reach); and agility (eyes-closed single-leg stance) | |
| Yoo et al., 2015 [35] | 12 | 20.58 ± 0.79 | 11.08 ± 2.27 | 72.42 ± 9.96 | Physiques (height, body fat, and muscle mass); muscular power (standing long jump) | |
| Yoo et al., 2011 [36] | 8 | 21.87 ± 1.12 | NR | 78.03 ± 8.80 | Physiques (height, body fat, and muscle mass); muscular power (standing long jump) | |
| Female | Feng et al., 2020 [18] | 7 | 20.00 ± 0.82 | NR | 62.67 ± 6.35 | Physiques (height, BMI); cardiorespiratory endurance (VO2max); and isokinetic muscular strength (relative peak anaerobic power) |
| Monks, 2016 [28] | 16 | 20.00 ± 0.83 | 8.16 ± 1.91 | 64.15 ± 8.49 | Physiques (height, body fat, and LBM); muscular endurance (sit-up per 60 s); muscular power (vertical jump); cardiorespiratory endurance (VO2max, HRmax, and all-out duration time); flexibility (sit and reach); and isokinetic muscular strength (average power, peak anaerobic power, peak drop, left knee joint flexion at 60°/s, left knee joint extension at 60°/s, right knee joint flexion at 60°/s, right knee joint extension at 60°/s, left knee joint flexion at 180°/s, left knee joint extension at 180°/s, right knee joint flexion at 180°/s, and right knee joint extension at 180°/s) | |
| Han, 2014 [37] | 22 | 19.13 ± 1.29 | 6.81 ± 1.78 | 59.86 ± 3.27 | Physiques (height, body fat, fat mass, and LBM); muscular endurance (sit-up per 60 s); muscular power (standing long jump); cardiorespiratory endurance (20-m MST); flexibility (sit and reach); isokinetic muscular strength (left knee joint flexion at 60°/s, left knee joint extension at 60°/s, right knee joint flexion at 60°/s, right knee joint extension at 60°/s, left knee joint flexion at 120°/s, left knee joint extension at 120°/s, right knee joint flexion at 120°/s, right knee joint extension at 120°/s, left knee joint flexion at 240°/s, left knee joint extension at 240°/s, right knee joint flexion at 240°/s, right knee joint extension at 240°/s, left hip joint flexion at 30°/s, left hip joint extension at 30°/s, right hip joint flexion at 30°/s, right hip joint extension at 30°/s, left hip joint flexion at 60°/s, left hip joint extension at 60°/s, right hip joint flexion at 60°/s, right hip joint extension at 60°/s, trunk joint flexion at 60°/s, trunk joint extension at 60°/s, trunk joint flexion at 120°/s, and trunk joint extension at 120°/s) | |
| Moon et al., 2016 [29] | 10 | 19.50 ± 1.10 | NR | 61.95 ± 8.73 | Physiques (height) | |
| Female | Seo et al., 2015 [7] | 12 | 18.90 ± 1.24 | 8.90 ± 2.23 | 59.80 ± 6.56 | Physiques (height, body fat, fat mass, and LBM); muscular power (standing long jump); cardiorespiratory endurance (20-m MST); flexibility (sit and reach); and isokinetic muscular strength (relative peak anaerobic power, peak drop) |
| Song et al., 2010 [33] | 10 | 19.60 ± 1.30 | NR | 62.50 ± 7.20 | Physiques (height, body fat, and fat mass); cardiorespiratory endurance (VO2max, HRmax); and isokinetic muscular strength (relative peak anaerobic power, peak drop, left knee joint flexion at 60°/s, left knee joint extension at 60°/s, right knee joint flexion at 60°/s, right knee joint extension at 60°/s, left knee joint flexion at 180°/s, left knee joint extension at 180°/s, right knee joint flexion at 180°/s, and right knee joint extension at 180°/s) | |
| Song et al., 2015 [38] | 22 | 19.16 ± 1.33 | NR | 55.96 ± NR | Physiques (height, body fat, fat mass, LBM); muscular strength (hand grip); muscular endurance (sit-up per 60 s); muscular power (standing long jump); cardiorespiratory endurance (20-m MST); flexibility (sit and reach); and isokinetic muscular strength (left knee joint flexion at 60°/s, left knee joint extension at 60°/s, right knee joint flexion at 60°/s, right knee joint extension at 60°/s, left knee joint flexion at 120°/s, left knee joint extension at 120°/s, right knee joint flexion at 120°/s, right knee joint extension at 120°/s, left knee joint flexion at 240°/s, left knee joint extension at 240°/s, right knee joint flexion at 240°/s, right knee joint extension at 240°/s, trunk joint flexion at 60°/s, trunk joint extension at 60°/s, trunk joint flexion at 120°/s, trunk joint extension at 120°/s, trunk joint flexion at 240°/s, and trunk joint extension at 240°/s) |
| Sex | Variables | Total Sample Size | Pooled Mean ± SD | Estimated Error (%) |
|---|---|---|---|---|
| Male | Height | 430 | 178.00 ± 5.27 (cm) | ±0.28 |
| Weight | 430 | 71.76 ± 11.84 (kg) | ±1.56 | |
| Percentage of body fat | 236 | 12.67 ± 2.77 (%) | ±2.79 | |
| BMI | 224 | 22.16 ± 1.51 (kg/m2) | ±0.89 | |
| Female | Height | 99 | 168.49 ± 5.48 (cm) | ±0.64 |
| Weight | 99 | 60.30 ± 5.88 (kg) | ±1.92 | |
| Percentage of body fat | 82 | 23.25 ± 3.28 (%) | ±3.05 |
| Sex | Variables | Total Sample Size | Pooled Mean ± SD | Estimated Error (%) |
|---|---|---|---|---|
| Male | Hand-grip strength | 53 | 44.68 ± 4.38 (kg) | ±2.64 |
| Back strength | 78 | 120.13 ± 19.59 (kg) | ±3.62 | |
| Sit-up per 30 s | 62 | 30.52 ± 4.50 (times) | ±3.67 | |
| Sit-up per 60 s | 141 | 57.41 ± 6.09 (times) | ±1.75 | |
| Sit and reach | 203 | 15.95 ± 6.52 (cm) | ±5.63 | |
| Backward flexion | 42 | 58.61 ± 6.87 (cm) | ±3.54 | |
| VO2max | 129 | 52.71 ± 7.62 (mL/kg/min) | ±2.49 | |
| HRmax | 67 | 179.95 ± 9.51 (bpm) | ±1.26 | |
| 20-m MST | 51 | 97.75 ± 6.63 (times) | ±1.86 | |
| Standing long jump | 164 | 242.97 ± 13.90 (cm) | ±0.88 | |
| Vertical jump | 117 | 54.54 ± 5.23 (cm) | ±1.74 | |
| Whole-body reaction time (light) | 42 | 0.283 ± 0.027 (ms) | ±2.89 | |
| Whole-body reaction time (sound) | 56 | 0.280 ± 0.032 (ms) | ±3.01 | |
| Eyes-closed single leg stance | 65 | 35.70 ± 23.06 (s) | ±15.71 | |
| Anaerobic average power | 73 | 534.70 ± 76.09 (watt) | ±3.26 | |
| Peak anaerobic power (relative value) | 146 | 11.07 ± 1.31 (watt/kg) | ±1.92 | |
| Peak anaerobic power (absolute value) | 73 | 720.08 ± 115.17 (watt) | ±3.67 | |
| Peak drop | 119 | 48.71 ± 7.78 (%) | ±2.87 | |
| Isokinetic flexion muscle strength of the left knee joint (60°/s) | 94 | 127.30 ± 23.66 (Nm) | ±3.76 | |
| Isokinetic extension muscle strength of the left knee joint (60°/s) | 94 | 208.27 ± 33.26 (Nm) | ±3.23 | |
| Isokinetic flexion muscle strength of the right knee joint (60°/s) | 94 | 131.13 ± 24.35 (Nm) | ±3.75 | |
| Isokinetic extension muscle strength of the right knee joint (60°/s) | 94 | 214.13 ± 32.24 (Nm) | ±3.04 |
| Sex | Variables | Total Sample Size | Pooled Mean ± SD | Estimated Error (%) |
|---|---|---|---|---|
| Female | Sit-up per 60 s | 60 | 54.20 ± 6.84 (times) | ±3.19 |
| Sit and reach | 72 | 21.33 ± 6.87 (cm) | ±7.44 | |
| VO2max | 33 | 48.28 ± 5.68 (mL/km/min) | ±4.01 | |
| 20-m MST | 56 | 81.04 ± 12.32 (times) | ±3.98 | |
| Standing long jump | 56 | 192.47 ± 14.25 (cm) | ±1.94 | |
| Peak anaerobic power (relative value) | 45 | 9.22 ± 1.08 (watt/kg) | ±3.43 | |
| Peak drop | 38 | 52.16 ± 6.14 (%) | ±3.74 | |
| Isokinetic flexion muscle strength of the left knee joint (60°/s) | 70 | 97.77 ± 14.84 (Nm) | ±3.56 | |
| Isokinetic extension muscle strength of the left knee joint (60°/s) | 70 | 172.82 ± 24.80 (Nm) | ±3.36 | |
| Isokinetic flexion muscle strength of the right knee joint (60°/s) | 70 | 97.38 ± 15.93 (Nm) | ±3.83 | |
| Isokinetic extension muscle strength of the right knee joint (60°/s) | 70 | 167.01 ± 25.70 (Nm) | ±3.61 | |
| Isokinetic flexion muscle endurance of the left knee joint (120°/s) | 44 | 75.77 ± 6.95 (Nm/s) | ±2.71 | |
| Isokinetic extension muscle endurance of the left knee joint (120°/s) | 44 | 125.80 ± 15.84 (Nm) | ±3.72 | |
| Isokinetic flexion muscle endurance of the right knee joint (120°/s) | 44 | 73.62 ± 8.79 (Nm) | ±3.53 | |
| Isokinetic extension muscle endurance of the right knee joint (120°/s) | 44 | 125.12 ± 15.65 (Nm) | ±3.70 | |
| Isokinetic flexion muscle power of the left knee joint (240°/s) | 44 | 58.30 ± 7.41 (Nm) | ±3.76 | |
| Isokinetic extension muscle power of the left knee joint (240°/s) | 44 | 90.90 ± 11.91 (Nm) | ±3.87 | |
| Isokinetic flexion muscle power of the right knee joint (240°/s) | 44 | 56.36 ± 6.32 (Nm) | ±3.31 | |
| Isokinetic extension muscle power of the right knee joint (240°/s) | 44 | 90.53 ± 11.42 (Nm) | ±3.73 | |
| Isokinetic flexion muscle strength of the trunk joint (60°/s) | 44 | 143.45 ± 23.46 (Nm) | ±4.83 | |
| Isokinetic extension muscle strength of the trunk joint (60°/s) | 44 | 154.62 ± 30.41 (Nm) | ±5.81 | |
| Isokinetic flexion muscle endurance of the trunk joint (120°/s) | 44 | 143.08 ± 29.51 (Nm) | ±6.09 | |
| Isokinetic extension muscle endurance of the trunk joint (120°/s) | 44 | 140.91 ± 27.78 (Nm) | ±5.83 |
| Sex | Variables | 95% CI | 1% | 5% | 10% | 20% | 30% | 40% | 50% | 60% | 70% | 80% | 90% | 95% | 99% |
|---|---|---|---|---|---|---|---|---|---|---|---|---|---|---|---|
| Male | Height (cm) | 95% LV | 165.2 | 168.8 | 170.7 | 173.1 | 174.7 | 176.2 | 177.5 | 178.8 | 180.3 | 181.9 | 184.3 | 186.2 | 189.8 |
| 95% UV | 166.2 | 169.8 | 171.7 | 174.1 | 175.7 | 177.2 | 178.5 | 179.8 | 181.3 | 182.9 | 185.3 | 187.2 | 190.8 | ||
| Weight (kg) | 95% LV | 43.1 | 51.2 | 55.5 | 60.7 | 64.4 | 67.6 | 70.6 | 73.6 | 76.9 | 80.6 | 85.8 | 90.1 | 98.2 | |
| 95% UV | 45.3 | 53.4 | 57.7 | 62.9 | 66.7 | 69.9 | 72.9 | 75.9 | 79.1 | 82.8 | 88.1 | 92.4 | 100.4 | ||
| Percentage of body fat (%) | 95% LV | 18.8 | 16.9 | 15.9 | 14.7 | 13.8 | 13.0 | 12.3 | 11.6 | 10.9 | 10.0 | 8.8 | 7.8 | 5.9 | |
| 95% UV | 19.5 | 17.6 | 16.6 | 15.4 | 14.5 | 13.7 | 13.0 | 12.3 | 11.6 | 10.7 | 9.5 | 8.5 | 6.6 | ||
| BMI (kg/m2) | 95% LV | 25.5 | 24.5 | 23.9 | 23.2 | 22.8 | 22.3 | 22.0 | 21.6 | 21.2 | 20.7 | 20.0 | 19.5 | 18.5 | |
| 95% UV | 25.9 | 24.8 | 24.3 | 23.6 | 23.2 | 22.7 | 22.4 | 22.0 | 21.6 | 21.1 | 20.4 | 19.9 | 18.8 | ||
| Female | Height (cm) | 95% LV | 154.7 | 158.4 | 160.4 | 162.8 | 164.5 | 166.0 | 167.4 | 168.8 | 170.3 | 172.0 | 174.4 | 176.4 | 180.2 |
| 95% UV | 156.8 | 160.6 | 162.5 | 165.0 | 166.7 | 168.2 | 169.6 | 171.0 | 172.4 | 174.2 | 176.6 | 178.6 | 182.3 | ||
| Weight (kg) | 95% LV | 45.5 | 49.5 | 51.6 | 54.2 | 56.1 | 57.7 | 59.1 | 60.6 | 62.2 | 64.1 | 66.7 | 68.8 | 72.8 | |
| 95% UV | 47.8 | 51.8 | 53.9 | 56.5 | 58.4 | 60.0 | 61.5 | 63.0 | 64.5 | 66.4 | 69.0 | 71.1 | 75.2 | ||
| Percentage of body fat (%) | 95% LV | 30.2 | 27.9 | 26.7 | 25.3 | 24.3 | 23.4 | 22.5 | 21.7 | 20.8 | 19.8 | 18.3 | 17.1 | 14.9 | |
| 95% UV | 31.6 | 29.4 | 28.2 | 26.7 | 25.7 | 24.8 | 24.0 | 23.1 | 22.2 | 21.2 | 19.8 | 18.6 | 16.3 |
| Sex | Variables | 95% CI | 1% | 5% | 10% | 20% | 30% | 40% | 50% | 60% | 70% | 80% | 90% | 95% | 99% |
|---|---|---|---|---|---|---|---|---|---|---|---|---|---|---|---|
| Male | Hand-grip strength (kg) | 95% LV | 33.3 | 36.3 | 37.9 | 39.8 | 41.2 | 42.4 | 43.5 | 44.6 | 45.8 | 47.2 | 49.1 | 50.7 | 53.7 |
| 95% UV | 35.7 | 38.7 | 40.3 | 42.2 | 43.6 | 44.8 | 45.9 | 47.0 | 48.2 | 49.5 | 51.5 | 53.1 | 56.0 | ||
| Back strength (kg) | 95% LV | 70.2 | 83.5 | 90.7 | 99.3 | 105.5 | 110.8 | 115.8 | 120.7 | 126.1 | 132.3 | 140.9 | 148.0 | 161.4 | |
| 95% UV | 78.9 | 92.2 | 99.4 | 108.0 | 114.2 | 119.5 | 124.5 | 129.4 | 134.8 | 141.0 | 149.6 | 156.7 | 170.1 | ||
| Sit-up per 30 s (times) | 95% LV | 18.9 | 22.0 | 23.6 | 25.6 | 27.0 | 28.3 | 29.4 | 30.5 | 31.8 | 33.2 | 35.2 | 36.8 | 39.9 | |
| 95% UV | 21.2 | 24.2 | 25.9 | 27.8 | 29.3 | 30.5 | 31.6 | 32.8 | 34.0 | 35.4 | 37.4 | 39.0 | 42.1 | ||
| Sit-up per 60 s (times) | 95% LV | 42.2 | 46.4 | 48.6 | 51.3 | 53.2 | 54.9 | 56.4 | 57.9 | 59.6 | 61.5 | 64.2 | 66.4 | 70.6 | |
| 95% UV | 44.2 | 48.4 | 50.6 | 53.3 | 55.2 | 56.9 | 58.4 | 60.0 | 61.6 | 63.5 | 66.2 | 68.4 | 72.6 | ||
| Sit and reach (cm) | 95% LV | −0.1 | 4.3 | 6.7 | 9.6 | 11.6 | 13.4 | 15.1 | 16.7 | 18.5 | 20.5 | 23.4 | 25.8 | 30.2 | |
| 95% UV | 1.7 | 6.1 | 8.5 | 11.4 | 13.4 | 15.2 | 16.8 | 18.5 | 20.3 | 22.3 | 25.2 | 27.6 | 32.0 | ||
| Backward flexion (cm) | 95% LV | 40.6 | 45.2 | 47.7 | 50.8 | 52.9 | 54.8 | 56.5 | 58.3 | 60.1 | 62.3 | 65.3 | 67.8 | 72.5 | |
| 95% UV | 44.7 | 49.4 | 51.9 | 54.9 | 57.1 | 59.0 | 60.7 | 62.4 | 64.3 | 66.5 | 69.5 | 72.0 | 76.7 | ||
| VO2max (mL/kg/min) | 95% LV | 33.7 | 38.9 | 41.6 | 45.0 | 47.4 | 49.5 | 51.4 | 53.3 | 55.4 | 57.8 | 61.2 | 63.9 | 69.1 | |
| 95% UV | 36.3 | 41.5 | 44.3 | 47.6 | 50.0 | 52.1 | 54.0 | 56.0 | 58.0 | 60.4 | 63.8 | 66.6 | 71.8 | ||
| HRmax (bpm) | 95% LV | 155.6 | 162.0 | 165.5 | 169.7 | 172.7 | 175.3 | 177.7 | 180.1 | 182.7 | 185.7 | 189.9 | 193.3 | 199.8 | |
| 95% UV | 160.1 | 166.6 | 170.0 | 174.2 | 177.2 | 179.8 | 182.2 | 184.6 | 187.2 | 190.2 | 194.4 | 197.9 | 204.3 | ||
| 20-m MST (times) | 95% LV | 80.5 | 85.0 | 87.4 | 90.4 | 92.5 | 94.3 | 95.9 | 97.6 | 99.4 | 101.5 | 104.4 | 106.8 | 111.4 | |
| 95% UV | 84.1 | 88.7 | 91.1 | 94.0 | 96.1 | 97.9 | 99.6 | 101.3 | 103.0 | 105.2 | 108.1 | 110.5 | 115.0 | ||
| Standing long jump (cm) | 95% LV | 208.5 | 218.0 | 223.0 | 229.1 | 233.6 | 237.3 | 240.8 | 244.4 | 248.1 | 252.5 | 258.7 | 263.7 | 273.2 | |
| 95% UV | 212.8 | 222.2 | 227.3 | 233.4 | 237.8 | 241.6 | 245.1 | 248.6 | 252.4 | 256.8 | 262.9 | 268.0 | 277.4 | ||
| Vertical jump (cm) | 95% LV | 41.4 | 45.0 | 46.9 | 49.2 | 50.8 | 52.3 | 53.6 | 54.9 | 56.3 | 58.0 | 60.3 | 62.2 | 65.8 | |
| 95% UV | 43.3 | 46.9 | 48.8 | 51.1 | 52.7 | 54.2 | 55.5 | 56.8 | 58.2 | 59.9 | 62.2 | 64.1 | 67.7 | ||
| Whole-body reaction time (light, ms) | 95% LV | 0.338 | 0.320 | 0.310 | 0.298 | 0.289 | 0.282 | 0.275 | 0.268 | 0.261 | 0.252 | 0.240 | 0.231 | 0.212 | |
| 95% UV | 0.355 | 0.336 | 0.326 | 0.314 | 0.306 | 0.298 | 0.292 | 0.285 | 0.277 | 0.269 | 0.257 | 0.247 | 0.229 | ||
| Whole-body reaction time (sound, ms) | 95% LV | 0.346 | 0.324 | 0.313 | 0.299 | 0.288 | 0.280 | 0.272 | 0.263 | 0.255 | 0.245 | 0.230 | 0.219 | 0.197 | |
| 95% UV | 0.363 | 0.341 | 0.330 | 0.315 | 0.305 | 0.297 | 0.288 | 0.280 | 0.272 | 0.261 | 0.247 | 0.236 | 0.214 | ||
| Eyes-closed single-leg stance (s) | 95% LV | −23.6 | −7.8 | 0.5 | 10.7 | 18.0 | 24.2 | 30.1 | 35.9 | 42.2 | 49.5 | 59.6 | 68.0 | 83.7 | |
| 95% UV | −12.3 | 3.4 | 11.7 | 21.9 | 29.2 | 35.5 | 41.3 | 47.1 | 53.4 | 60.7 | 70.9 | 79.2 | 95.0 | ||
| Male | Anaerobic average power (watt) | 95% LV | 340.2 | 392.1 | 419.7 | 453.2 | 477.3 | 498.0 | 517.2 | 536.5 | 557.1 | 581.3 | 614.8 | 642.4 | 694.3 |
| 95% UV | 375.1 | 427.0 | 454.6 | 488.1 | 512.3 | 532.9 | 552.2 | 571.4 | 592.1 | 616.2 | 649.7 | 677.3 | 729.2 | ||
| Peak anaerobic power (relative value, watt/kg) | 95% LV | 7.8 | 8.7 | 9.2 | 9.8 | 10.2 | 10.5 | 10.9 | 11.2 | 11.5 | 12.0 | 12.5 | 13.0 | 13.9 | |
| 95% UV | 8.2 | 9.1 | 9.6 | 10.2 | 10.6 | 11.0 | 11.3 | 11.6 | 12.0 | 12.4 | 13.0 | 13.4 | 14.3 | ||
| Peak anaerobic power (absolute value, watt) | 95% LV | 425.7 | 504.2 | 546.1 | 596.7 | 633.3 | 664.5 | 693.7 | 722.8 | 754.1 | 790.6 | 841.3 | 883.1 | 961.6 | |
| 95% UV | 478.6 | 557.1 | 598.9 | 649.6 | 686.1 | 717.3 | 746.5 | 775.7 | 806.9 | 843.4 | 894.1 | 935.9 | 1014.4 | ||
| Peak drop (%) | 95% LV | 29.2 | 34.5 | 37.3 | 40.8 | 43.2 | 45.3 | 47.3 | 49.3 | 51.4 | 53.9 | 57.3 | 60.1 | 65.4 | |
| 95% UV | 32.0 | 37.3 | 40.1 | 43.6 | 46.0 | 48.1 | 50.1 | 52.1 | 54.2 | 56.7 | 60.1 | 62.9 | 68.2 | ||
| Left knee joint flexion (60°/s, Nm) a | 95% LV | 67.5 | 83.6 | 92.2 | 102.6 | 110.1 | 116.5 | 122.5 | 128.5 | 134.9 | 142.4 | 152.8 | 161.4 | 177.6 | |
| 95% UV | 77.0 | 93.2 | 101.8 | 112.2 | 119.7 | 126.1 | 132.1 | 138.1 | 144.5 | 152.0 | 162.4 | 171.0 | 187.1 | ||
| Left knee joint extension (60°/s, Nm) a | 95% LV | 124.2 | 146.8 | 158.9 | 173.5 | 184.1 | 193.1 | 201.5 | 210.0 | 219.0 | 229.5 | 244.2 | 256.3 | 278.9 | |
| 95% UV | 137.6 | 160.3 | 172.4 | 187.0 | 197.5 | 206.6 | 215.0 | 223.4 | 232.4 | 243.0 | 257.6 | 269.7 | 292.4 | ||
| Right knee joint flexion (60°/s, Nm) a | 95% LV | 69.5 | 86.1 | 95.0 | 105.7 | 113.4 | 120.0 | 126.2 | 132.4 | 139.0 | 146.7 | 157.4 | 166.3 | 182.9 | |
| 95% UV | 79.4 | 96.0 | 104.8 | 115.6 | 123.3 | 129.9 | 136.1 | 142.2 | 148.8 | 156.6 | 167.3 | 176.1 | 192.7 | ||
| Right knee joint extension (60°/s, Nm) a | 95% LV | 132.6 | 154.6 | 166.3 | 180.5 | 190.7 | 199.4 | 207.6 | 215.8 | 224.5 | 234.8 | 248.9 | 260.6 | 282.6 | |
| 95% UV | 145.6 | 167.6 | 179.3 | 193.5 | 203.7 | 212.5 | 220.7 | 228.8 | 237.6 | 247.8 | 262.0 | 273.7 | 295.7 | ||
| Female | Sit-up per 60 s (times) | 95% LV | 36.6 | 41.2 | 43.7 | 46.7 | 48.9 | 50.7 | 52.5 | 54.2 | 56.1 | 58.2 | 61.2 | 63.7 | 68.4 |
| 95% UV | 40.0 | 44.7 | 47.2 | 50.2 | 52.3 | 54.2 | 55.9 | 57.7 | 59.5 | 61.7 | 64.7 | 67.2 | 71.8 | ||
| Sit and reach (cm) | 95% LV | 3.8 | 8.4 | 10.9 | 14.0 | 16.1 | 18.0 | 19.7 | 21.5 | 23.3 | 25.5 | 28.5 | 31.0 | 35.7 | |
| 95% UV | 6.9 | 11.6 | 14.1 | 17.1 | 19.3 | 21.2 | 22.9 | 24.7 | 26.5 | 28.7 | 31.7 | 34.2 | 38.9 | ||
| VO2max (mL/kg/min) | 95% LV | 33.1 | 37.0 | 39.1 | 41.6 | 43.4 | 44.9 | 46.3 | 47.8 | 49.3 | 51.1 | 53.6 | 55.7 | 59.5 | |
| 95% UV | 37.0 | 40.9 | 42.9 | 45.4 | 47.2 | 48.8 | 50.2 | 51.7 | 53.2 | 55.0 | 57.5 | 59.6 | 63.4 | ||
| 20-m MST (times) | 95% LV | 49.2 | 57.6 | 62.0 | 67.4 | 71.4 | 74.7 | 77.8 | 80.9 | 84.3 | 88.2 | 93.6 | 98.1 | 106.5 | |
| 95% UV | 55.6 | 64.0 | 68.5 | 73.9 | 77.8 | 81.1 | 84.3 | 87.4 | 90.7 | 94.6 | 100.1 | 104.5 | 112.9 | ||
| Standing long jump (cm) | 95% LV | 155.6 | 165.3 | 170.5 | 176.7 | 181.3 | 185.1 | 188.7 | 192.3 | 196.2 | 200.7 | 207.0 | 212.2 | 221.9 | |
| 95% UV | 163.1 | 172.8 | 177.9 | 184.2 | 188.7 | 192.6 | 196.2 | 199.8 | 203.7 | 208.2 | 214.5 | 219.6 | 229.4 | ||
| Peak anaerobic power (relative value, watt/kg) | 95% LV | 6.4 | 7.1 | 7.5 | 8.0 | 8.3 | 8.6 | 8.9 | 9.2 | 9.5 | 9.8 | 10.3 | 10.7 | 11.4 | |
| 95% UV | 7.0 | 7.8 | 8.2 | 8.6 | 9.0 | 9.3 | 9.5 | 9.8 | 10.1 | 10.4 | 10.9 | 11.3 | 12.1 | ||
| Female | Peak drop (%) | 95% LV | 35.9 | 40.1 | 42.3 | 45.0 | 47.0 | 48.7 | 50.2 | 51.8 | 53.4 | 55.4 | 58.1 | 60.3 | 64.5 |
| 95% UV | 39.8 | 44.0 | 46.2 | 48.9 | 50.9 | 52.6 | 54.1 | 55.7 | 57.3 | 59.3 | 62.0 | 64.2 | 68.4 | ||
| Left knee joint flexion (60°/s, Nm) a | 95% LV | 59.8 | 69.9 | 75.3 | 81.8 | 86.5 | 90.5 | 94.3 | 98.1 | 102.1 | 106.8 | 113.3 | 118.7 | 128.8 | |
| 95% UV | 66.7 | 76.8 | 82.2 | 88.8 | 93.5 | 97.5 | 101.2 | 105.0 | 109.0 | 113.7 | 120.3 | 125.7 | 135.8 | ||
| Left knee joint extension (60°/s, Nm) a | 95% LV | 109.3 | 126.2 | 135.2 | 146.1 | 154.0 | 160.7 | 167.0 | 173.3 | 180.0 | 187.9 | 198.8 | 207.8 | 224.7 | |
| 95% UV | 120.9 | 137.8 | 146.8 | 157.8 | 165.6 | 172.3 | 178.6 | 184.9 | 191.6 | 199.5 | 210.4 | 219.4 | 236.3 | ||
| Right knee joint flexion (60°/s, Nm) a | 95% LV | 56.6 | 67.4 | 73.2 | 80.2 | 85.3 | 89.6 | 93.6 | 97.7 | 102.0 | 107.0 | 114.1 | 119.8 | 130.7 | |
| 95% UV | 64.1 | 74.9 | 80.7 | 87.7 | 92.8 | 97.1 | 101.1 | 105.1 | 109.5 | 114.5 | 121.5 | 127.3 | 138.2 | ||
| Right knee joint extension (60°/s, Nm) a | 95% LV | 101.2 | 118.7 | 128.0 | 139.4 | 147.5 | 154.5 | 161.0 | 167.5 | 174.5 | 182.6 | 193.9 | 203.3 | 220.8 | |
| 95% UV | 113.2 | 130.8 | 140.1 | 151.4 | 159.6 | 166.5 | 173.0 | 179.5 | 186.5 | 194.7 | 206.0 | 215.3 | 232.8 | ||
| Left knee joint flexion (120°/s, Nm) a | 95% LV | 57.5 | 62.3 | 64.8 | 67.9 | 70.1 | 72.0 | 73.7 | 75.5 | 77.4 | 79.6 | 82.6 | 85.1 | 89.9 | |
| 95% UV | 61.7 | 66.4 | 68.9 | 72.0 | 74.2 | 76.1 | 77.8 | 79.6 | 81.5 | 83.7 | 86.7 | 89.3 | 94.0 | ||
| Left knee joint extension (120°/s, Nm) a | 95% LV | 84.3 | 95.1 | 100.8 | 107.8 | 112.8 | 117.1 | 121.1 | 125.1 | 129.4 | 134.5 | 141.4 | 147.2 | 158.0 | |
| 95% UV | 93.6 | 104.4 | 110.2 | 117.2 | 122.2 | 126.5 | 130.5 | 134.5 | 138.8 | 143.8 | 150.8 | 156.5 | 167.3 | ||
| Right knee joint flexion (120°/s, Nm) a | 95% LV | 50.6 | 56.6 | 59.8 | 63.6 | 66.4 | 68.8 | 71.0 | 73.3 | 75.6 | 78.4 | 82.3 | 85.5 | 91.5 | |
| 95% UV | 55.8 | 61.8 | 65.0 | 68.8 | 71.6 | 74.0 | 76.2 | 78.4 | 80.8 | 83.6 | 87.5 | 90.7 | 96.7 | ||
| Right knee joint extension (120°/s, Nm) a | 95% LV | 84.1 | 94.8 | 100.4 | 107.3 | 112.3 | 116.5 | 120.5 | 124.5 | 128.7 | 133.7 | 140.5 | 146.2 | 156.9 | |
| 95% UV | 93.3 | 104.0 | 109.7 | 116.6 | 121.5 | 125.8 | 129.7 | 133.7 | 137.9 | 142.9 | 149.8 | 155.5 | 166.1 | ||
| Left knee joint flexion (240°/s, Nm) a | 95% LV | 38.9 | 43.9 | 46.6 | 49.9 | 52.2 | 54.2 | 56.1 | 58.0 | 60.0 | 62.4 | 65.6 | 68.3 | 73.4 | |
| 95% UV | 43.3 | 48.3 | 51.0 | 54.3 | 56.6 | 58.6 | 60.5 | 62.4 | 64.4 | 66.7 | 70.0 | 72.7 | 77.7 | ||
| Left knee joint extension (240°/s, Nm) a | 95% LV | 59.7 | 67.8 | 72.1 | 77.4 | 81.1 | 84.4 | 87.4 | 90.4 | 93.6 | 97.4 | 102.6 | 107.0 | 115.1 | |
| 95% UV | 66.7 | 74.8 | 79.2 | 84.4 | 88.2 | 91.4 | 94.4 | 97.4 | 100.7 | 104.4 | 109.7 | 114.0 | 122.1 | ||
| Right knee joint flexion (240°/s, Nm) a | 95% LV | 39.8 | 44.1 | 46.4 | 49.2 | 51.2 | 52.9 | 54.5 | 56.1 | 57.8 | 59.8 | 62.6 | 64.9 | 69.2 | |
| 95% UV | 43.5 | 47.8 | 50.1 | 52.9 | 54.9 | 56.6 | 58.2 | 59.8 | 61.5 | 63.5 | 66.3 | 68.6 | 72.9 | ||
| Right knee joint extension (240°/s, Nm) a | 95% LV | 60.6 | 68.4 | 72.5 | 77.5 | 81.2 | 84.3 | 87.2 | 90.0 | 93.1 | 96.8 | 101.8 | 105.9 | 113.7 | |
| 95% UV | 67.3 | 75.1 | 79.3 | 84.3 | 87.9 | 91.0 | 93.9 | 96.8 | 99.9 | 103.5 | 108.5 | 112.7 | 120.5 | ||
| Female | Trunk joint flexion (60°/s, Nm) a | 95% LV | 81.9 | 97.9 | 106.4 | 116.8 | 124.2 | 130.6 | 136.5 | 142.5 | 148.8 | 156.3 | 166.6 | 175.1 | 191.1 |
| 95% UV | 95.8 | 111.8 | 120.3 | 130.6 | 138.1 | 144.4 | 150.4 | 156.3 | 162.7 | 170.1 | 180.4 | 189.0 | 205.0 | ||
| Trunk joint extension (60°/s, Nm) a | 95% LV | 74.9 | 95.6 | 106.7 | 120.0 | 129.7 | 137.9 | 145.6 | 153.3 | 161.6 | 171.2 | 184.6 | 195.7 | 216.4 | |
| 95% UV | 92.8 | 113.6 | 124.6 | 138.0 | 147.7 | 155.9 | 163.6 | 171.3 | 179.6 | 189.2 | 202.6 | 213.6 | 234.4 | ||
| Trunk joint flexion (120°/s, Nm) a | 95% LV | 65.7 | 85.8 | 96.5 | 109.5 | 118.9 | 126.9 | 134.4 | 141.8 | 149.8 | 159.2 | 172.2 | 182.9 | 203.0 | |
| 95% UV | 83.2 | 103.3 | 114.0 | 127.0 | 136.3 | 144.3 | 151.8 | 159.3 | 167.3 | 176.6 | 189.6 | 200.3 | 220.4 | ||
| Trunk joint extension (120°/s, Nm) a | 95% LV | 68.1 | 87.0 | 97.1 | 109.3 | 118.1 | 125.7 | 132.7 | 139.7 | 147.3 | 156.1 | 168.3 | 178.4 | 197.3 | |
| 95% UV | 84.5 | 103.4 | 113.5 | 125.7 | 134.6 | 142.1 | 149.1 | 156.2 | 163.7 | 172.5 | 184.7 | 194.8 | 213.7 |
Publisher’s Note: MDPI stays neutral with regard to jurisdictional claims in published maps and institutional affiliations. |
© 2021 by the authors. Licensee MDPI, Basel, Switzerland. This article is an open access article distributed under the terms and conditions of the Creative Commons Attribution (CC BY) license (https://creativecommons.org/licenses/by/4.0/).
Share and Cite
Kim, J.-W.; Nam, S.-S. Physical Characteristics and Physical Fitness Profiles of Korean Taekwondo Athletes: A Systematic Review. Int. J. Environ. Res. Public Health 2021, 18, 9624. https://doi.org/10.3390/ijerph18189624
Kim J-W, Nam S-S. Physical Characteristics and Physical Fitness Profiles of Korean Taekwondo Athletes: A Systematic Review. International Journal of Environmental Research and Public Health. 2021; 18(18):9624. https://doi.org/10.3390/ijerph18189624
Chicago/Turabian StyleKim, Jeong-Weon, and Sang-Seok Nam. 2021. "Physical Characteristics and Physical Fitness Profiles of Korean Taekwondo Athletes: A Systematic Review" International Journal of Environmental Research and Public Health 18, no. 18: 9624. https://doi.org/10.3390/ijerph18189624
APA StyleKim, J.-W., & Nam, S.-S. (2021). Physical Characteristics and Physical Fitness Profiles of Korean Taekwondo Athletes: A Systematic Review. International Journal of Environmental Research and Public Health, 18(18), 9624. https://doi.org/10.3390/ijerph18189624