Article

Influence of Residence Area and Basic Livelihood Conditions on the Prevalence and Diagnosis Experience of Osteoporosis in Postmenopausal Women Aged over 50 Years: Evaluation Using Korea National Health and Nutrition Examination Survey Data

1
Department of Orthopedic Surgery, Pusan National University Yangsan Hospital, Yangsan 50612, Korea
2
Biomedical Research Institute, Pusan National University Yangsan Hospital, Yangsan 50612, Korea
3
Department of Orthopedic Surgery, Medical College, Pusan National University, Yangsan 50612, Korea
4
Department of Medicine, Medical College, Pusan National University, Yangsan 50612, Korea
5
Department of Preventive and Occupational & Environmental Medicine, Medical College, Pusan National University, Yangsan 50612, Korea
6
Office of Public Healthcare Service, Pusan National University Yangsan Hospital, Yangsan 50612, Korea
*
Author to whom correspondence should be addressed.
Int. J. Environ. Res. Public Health 2021, 18(18), 9478; https://doi.org/10.3390/ijerph18189478
Submission received: 3 August 2021 / Revised: 26 August 2021 / Accepted: 7 September 2021 / Published: 8 September 2021
(This article belongs to the Section Public Health Statistics and Risk Assessment)

Abstract

:
Patients with osteoporosis are asymptomatic and are at risk for fractures. Therefore, early detection and interventions are important. We found that a population with a low socioeconomic status living in rural areas was reported to have a high osteoporosis prevalence but a relatively low diagnosis rate. Research on the disparity of osteoporosis prevalence and treatment from the socioeconomic perspective was conducted. This study aimed to investigate the influence of residence area and basic livelihood conditions on osteoporosis prevalence and diagnosis in postmenopausal women aged over 50 years. The cross-sectional data of 1477 postmenopausal women aged over 50 years obtained from the Korea National Health and Nutrition Examination Survey V-2 were analyzed. Univariate analyses were performed to calculate the prevalence and diagnosis rate according to risk factor categories. A multivariate logistic regression analysis was performed to identify the influence of residence area and basic livelihood conditions after controlling for other factors. The osteoporosis prevalence in basic livelihood beneficiaries (53.7%) and rural area residents (41.9%) was higher than that in non-beneficiaries (33.1%) and urban area residents (31.8%). There was no significant difference in the diagnosis rates in relation to the basic livelihood conditions or residence areas. The adjusted odds ratio for the prevalence among the beneficiaries living in rural areas was 2.08 (95% confidence interval: 1.06–4.10). However, the odds ratio for diagnosis was not significantly different. Earlier screening examination policies for osteoporosis in postmenopausal women with a low socioeconomic status living in rural areas are needed.

1. Introduction

Osteoporosis is a systemic skeletal disease characterized by low bone quality owing to various causes [1,2]. The prevalence of osteoporosis in women aged >50 years has been reported to be 35.5% in Korea [3]. In addition, the prevalence of osteoporosis in women aged 50–79 years has been reported to be approximately 38% in China and 31.0% in Japan [4,5].
Many countries strive to achieve early detection. However, since osteoporosis is asymptomatic, many patients are not recognized or diagnosed until osteoporosis-related trauma, such as fracture, occurs [6,7,8]. In our previous study, the prevalence rate of osteoporosis was 34.8% in women aged over 50 years, and the diagnosis rate was as low as 22.1% [9]. Therefore, it is important to prevent osteoporosis and facilitate early diagnosis. Osteoporosis is asymptomatic and can only be recognized after a fracture occurs. If a hip or vertebral fracture occurs, the social costs are increased, and a great amount of effort must be put into early detection and treatment of osteoporosis [10].
Osteoporosis has various causative factors, such as age, sex, smoking, alcohol consumption, and systemic disease [2,11]. In addition, it is reported that socioeconomic factors at the individual level, such as educational level and income, are also indirect causes [12,13]. In our previous study, the difference between the cause of osteoporosis and the diagnosis at the socioeconomic level was reported [9].
In this respect, studies on osteoporosis between urban and rural areas have also been conducted [14,15]. According to Lai et al., there are more patients with undertreated osteoporosis in rural areas than in urban areas [16]. Moreover, the quality-adjusted life expectancy (QALE) was reported to be unequal according to income, especially in rural areas [17]. Many diseases, such as cancer, diabetes, kidney disease, and arthritis, are more prevalent in rural areas than in urban areas, and the accessibility and cure rates of diseases have decreased [18,19,20]. Moreover, the disparity between urban and rural areas in health screening and cancer screening rates has been reported [21,22]. In these studies, it was explained that the reason for the disparity between urban and rural areas may be due to differences in medical access due to differences in age structure, socioeconomic level, and distribution of medical resources.
In Korea, population groups with an income of 30% or less of the median income of that year are considered as having a basic livelihood, and a system for resolving various inequalities is being established. Each year, the basic income line is different, and the proportion of beneficiaries of the national basic livelihood security system is generally maintained at 2–3% of the total population [23]. Since basic living recipients experience many diseases and inequalities, various policies are in place to compensate for such. Medical expenses are also partially reduced; however, some uninsured medical expenses or screening tests that are not included in the mandatory examination items are less accessible owing to cost problems [24,25]. In particular, the population of basic living recipients in rural areas is larger than that in cities, and access to medical care is inferior owing to low income level.
Therefore, the purpose of this study was to: (1) calculate the prevalence and diagnosis rates of osteoporosis in menopausal women aged ≥50 years and compare them according to urban and rural areas; (2) determine the difference between the prevalence and diagnosis rate of osteoporosis among basic livelihood beneficiaries living in urban and rural areas; (3) analyze various socioeconomic factors (focusing on basic livelihood conditions) that affect osteoporosis; and (4) investigate the implications for osteoporosis management policies based on the evidence obtained.

2. Materials and Methods

2.1. Data and Study Population

The Korea National Health and Nutrition Examination Survey (KNHANES) was used in this study. It is conducted annually by the Korea Disease Control and Prevention Agency. Every year, approximately 8000 subjects are sampled to represent citizens over the age of one residing in 192 districts in Korea. Screening examinations for chronic diseases and interview surveys on health behaviors, food intake, and socioeconomic status are conducted among the participants of the KNHANES. The data from this survey were used to produce national official indices of health level, health behavior, food and nutrition intake, and prevalence of chronic diseases in Korea. The findings are used as the basis for establishing and implementing national health policies, such as the National Health Promotion Plan [26]. The KNHANES dataset is one of the largest and most representative datasets for research on the prevalence and risk factors of osteoporosis in the country. In our study, the data of 1476 postmenopausal women aged over 50 years who had undergone bone mineral density (BMD) testing among the participants of the KNHANES V-2 were used. The study was approved by the Institutional Review Board of Pusan National University Hospital (No. H-1901-019-075).

2.2. Variables

The outcome variables in this study were the prevalence and diagnosis of osteoporosis. Subjects with osteoporosis were considered as the basis of the T-score, as cases with a T-score of ≤−2.5. The T-score is most commonly used to identify osteoporosis and determine the fracture risk [27,28]. T-scores from the KNHANES data were obtained from the BMD measurements of the total femur, femoral neck, and spine using dual-energy X-ray absorptiometry (Hologic Discovery, Hologic, Marlborough, MA, USA). The precision of the equipment was evaluated by scanning 30 randomly selected subjects twice on the same day. The coefficient of variation of the equipment was 1.8% for the total femur, 2.5% for the femoral neck, and 1.9% for the spine. The diagnosis experience of osteoporosis was based on a “Yes” response to the question “Have you ever been diagnosed with osteoporosis by a medical doctor?” in the interview. The major socioeconomic variables in this study were basic livelihood conditions (non-beneficiaries or beneficiaries) and residence areas (urban or rural). Basic livelihood recipients belong to the groups with the lowest socioeconomic status in the country. The basic livelihood condition is useful as a representative indicator of socioeconomic status [25,29,30]. As for the residential area, “dong” was classified as urban, and “eup” and “myeon” were classified as rural. This category is mainly used in research to establish the health disparity between urban and rural areas and the impact of areas on health [31,32].
The general factors associated with the prevalence and diagnosis of osteoporosis were included as independent variables after reviewing studies that were previously reported for osteoporosis risk factors [31,32,33]. The independent factors of osteoporosis included age (50–59 years, 60–69 years, and ≥70 years), educational level (middle school or below and high school or above), physical activity (vigorous physical activity for ≥20 min 3 days a week or moderate physical activity for ≥30 min, 5 days in the last week), obesity (body mass index of ≥30 kg/m2), hypertension (systolic blood pressure of ≥140 mmHg, diastolic blood pressure of ≥90 mmHg, or hypertension medication), and diabetes (fasting blood sugar level of ≥126 mg/dL or diabetes medication).

2.3. Statistical Analysis

The prevalence of osteoporosis and rate of diagnosis for each independent variable category were calculated using a univariate analysis, and the χ2 test was performed to determine the statistical significance. In addition, the prevalence and diagnosis rate of osteoporosis among the basic living beneficiaries and non-beneficiaries were calculated for each residential area, and statistical significance between the two was determined using the χ2 test. Multivariate logistic regression analyses were performed to identify the associations between the factors after adjusting for other factors. In addition, multivariate logistic regression analyses stratified into rural and urban areas were performed to determine the association between basic livelihood conditions and osteoporosis prevalence and diagnosis. Statistical significance was set at p-value of <0.05. All statistical analyses were performed using STATA MP 15.1 (Stata Corporation, College Station, TX, USA).

3. Results

3.1. General Characteristics of the Study Population

Table 1 presents the baseline characteristics of the participants. Women aged 50–59 years were the most common subgroup population (37.4%), followed by those aged 60–69 and ≥70 years. Women who graduated from junior high school or lower formed most of the sample (80.1%). The proportion of basic living recipients was 8.2%. In addition, 20.1% of the participants were categorized into a group engaging in physical activity. The prevalence of hypertension and diabetes was 51.2% and 13.5%, respectively. The proportion of the samples living in urban and rural areas was 70.6% and 29.4%, respectively. The proportion of older or less educated groups of subjects living in rural areas was significantly higher than that of subjects living in urban areas (p < 0.001). In particular, the proportion of basic livelihood beneficiaries in the samples living in rural areas was 12.7%, which was significantly higher than that in the samples living in urban areas (6.3%) (p < 0.001).

3.2. Osteoporosis Prevalence and Diagnosis

Table 2 shows the prevalence and diagnosis rate of osteoporosis according to factors. The overall prevalence and diagnosis rates were 34.8% and 22.0%, respectively. Both the prevalence and diagnosis rates were significantly higher in the older and less educated groups. The prevalence of osteoporosis was higher in the patients with hypertension and physical inactivity than in the other patients. In addition, the prevalence was higher in the basic livelihood beneficiaries and rural area residents than in the non-beneficiaries and urban area residents. Conversely, there was no significant difference in the diagnosis rates in relation to the basic livelihood conditions and residence areas.
Figure 1 presents the prevalence and diagnosis rate of osteoporosis according to basic livelihood conditions between the urban and rural areas. In both urban and rural areas, the prevalence among the basic livelihood beneficiaries was 47.0% (95% confidence interval of 34.6~59.7) and 61.8% (95% confidence interval of 47.7~74.6), respectively, which was significantly higher than that among the non-beneficiaries (urban 30.7%, 95% confidence interval of 27.9~33.7) (rural 39.1%, 95% confidence interval 34.1~44.2). Meanwhile, the diagnosis rate was not significantly different.

3.3. Influence of the Factors on the Osteoporosis Prevalence and Diagnosis Rate in the Urban and Rural Areas

Table 3 shows the influence of the factors on the osteoporosis prevalence and diagnosis rate in all subjects. The factors that showed a significant impact on the prevalence were the age group, educational level, obesity, diabetes, and residence area. The adjusted odds ratios for the osteoporosis prevalence were significantly higher in the elderly (OR 8.83, p < 0.001 in those aged ≥70 years) and middle school or below categories (OR 2.47, p < 0.001) than in the other categories. Meanwhile, the risk of osteoporosis was significantly lower in the patients with obesity (OR 0.33, p = 0.001) and diabetes (OR 0.54, p = 0.001). In addition, residence in rural areas was associated with a significantly higher risk of osteoporosis than residence in urban areas (OR 1.41, p = 0.001). However, the only factor that significantly affected the diagnosis rate was age.

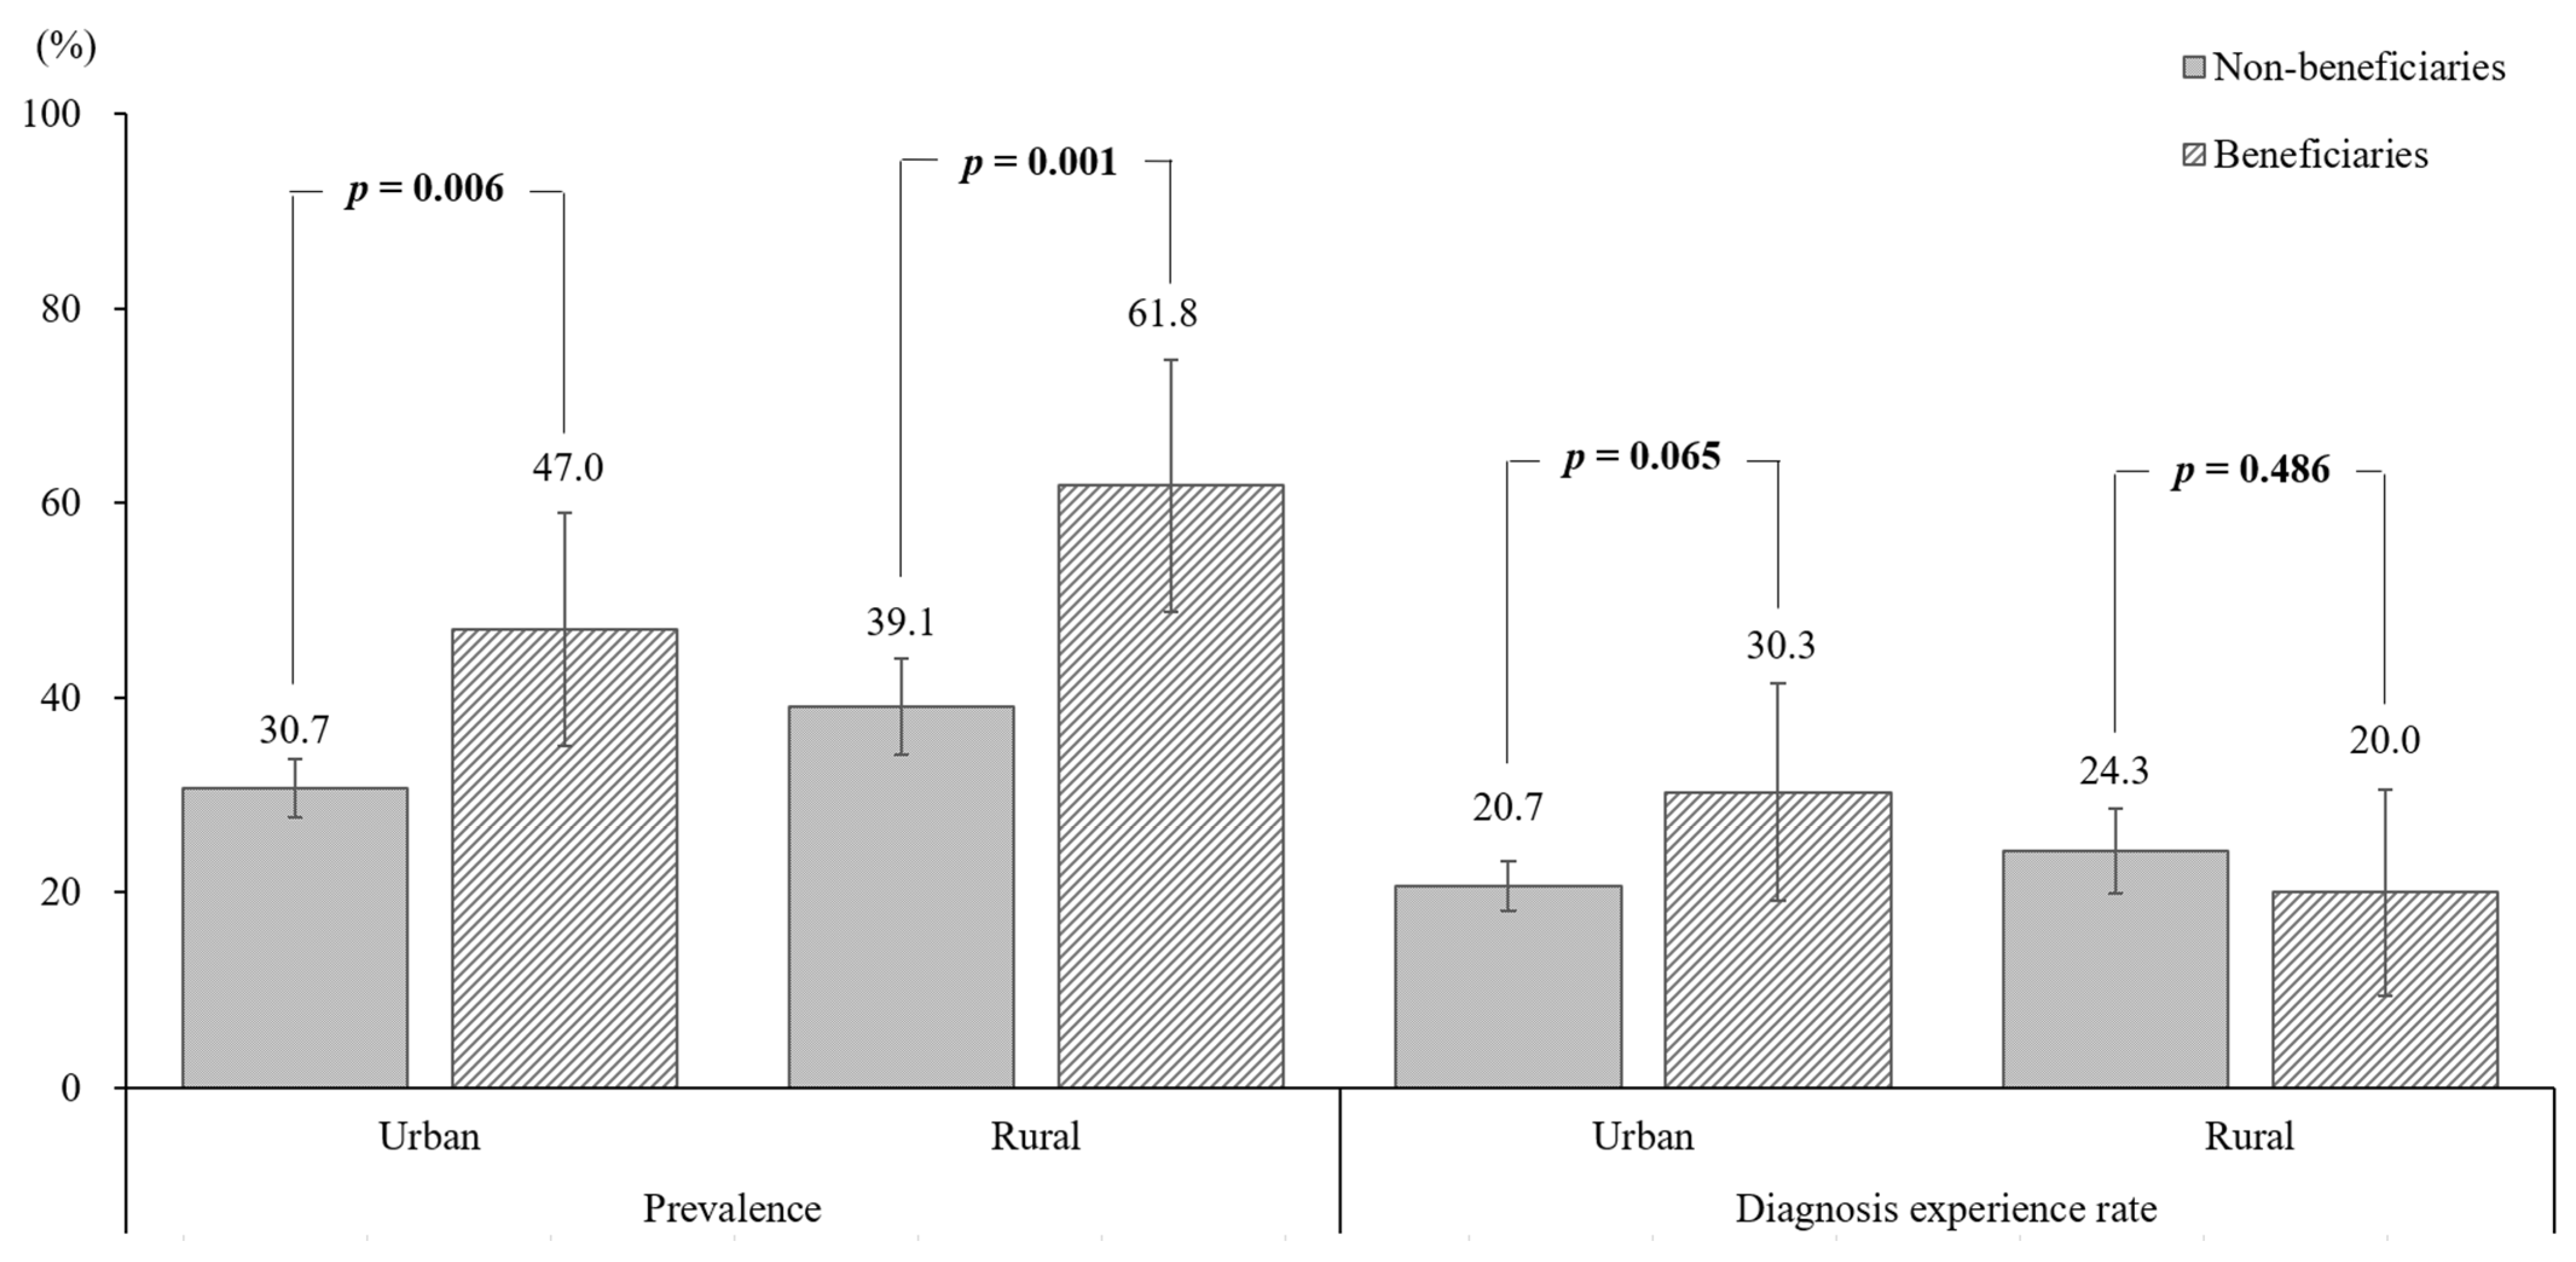
3.4. Influence of the Basic Livelihood Condition on the Osteoporosis Prevalence and Diagnosis Rate in the Rural and Urban Areas

Table 4 shows the influence of the basic livelihood condition on the osteoporosis prevalence and diagnosis rate by residence area. In the urban areas, the basic livelihood conditions were not significant factors for both prevalence and diagnosis rate after adjusting for the impacts of other factors (Model 1 and Model 2). However, in the rural areas, the odds ratio for the prevalence among the basic livelihood beneficiaries was 2.08 (95% confidence interval of 1.06~4.10, p = 0.033), which was significantly higher than that among the non-beneficiaries (Model 3). The influence of the basic livelihood conditions on the diagnosis rate was not significantly different, similar to the results for the urban areas.

4. Discussion

This study is the first to identify and compare the prevalence and diagnosis rate of osteoporosis between urban and rural areas and the influence of socioeconomic factors. In our analysis, the residents of rural areas and basic livelihood beneficiaries had a higher prevalence of osteoporosis than the residents of urban areas and non-beneficiaries; however, the diagnosis rate was not significantly different. In particular, in the analysis controlled for the influencing factors, the risk of osteoporosis was significantly higher among the basic livelihood beneficiaries in rural areas; however, the risk of diagnosis did not show a significant difference.
Many studies have investigated the risk factors of osteoporosis. Among these, age is considered the greatest risk factor [33,34,35]. In this study, both the prevalence and diagnosis rate of osteoporosis increased with age in all urban and rural areas. However, the adjusted odds ratio for the osteoporosis prevalence in the patients aged 60–69 years and ≥70 years was 2.62 and 8.83, respectively; meanwhile, the adjusted odds ratio for the diagnosis rate in the patients aged 60–69 years and ≥70 years was 2.81 and 4.33, respectively. These results indicate that osteoporosis is not detected early and that there are many undiagnosed elderly patients.
In the survey of the prevalence of osteoporosis, some studies have shown that the prevalence is higher in rural areas than in urban areas [14,36]. In particular, the proportion of women in households with economic difficulties is high [37]. Our study showed results similar to those of previous studies. However, there was no difference in the rate of diagnosis between the urban and rural areas. This means that diagnostic tests were not conducted in rural areas with a high prevalence. Ewald et al. reported that three-fold more osteoporosis tests were performed in urban areas than in rural areas [38]. In addition, Lai et al. reported that there were many undertreated patients in rural areas, and the prescription rate of osteoporosis drugs was low therein [16]. There are studies showing that there is a difference in the prevalence between urban and rural areas in chronic diseases such as cancer, diabetes, and kidney disease as well as osteoporosis [18,19,20]. In Han’s study on the rate of national screening, it was found that urban residents were 1.42 times more likely to receive health screenings than rural residents. In this study, it was reported that, for this reason, it is difficult for rural residents to access health examination institutions, and so the screening examination rate is low [21]. Additionally, in Vanasse’s study, access to professional services in non-metropolitan areas was significantly lower for myocardial infarction, osteoporosis, and diabetes [22]. In view of these results, chronic diseases such as osteoporosis are related not only to individual factors but also to various socioeconomic factors. Therefore, it is necessary to develop a screening service suitable for rural areas and find easily available national policies.
In our study, the prevalence of osteoporosis was high among the basic livelihood beneficiaries in rural areas; however, there was no difference in the diagnosis rate. With respect to low economic income levels, Korea is also implementing policies for basic livelihood beneficiaries. However, these basic recipients may have less access to medical care in hospitals than patients with private insurance [39,40]. In the case of basic recipients, there was also a report that as the level of education was low, the awareness of health was also low, and that they could neglect healthcare due to economic conditions [21]. Furthermore, in Korea, basic recipients must pay some costs for osteoporosis tests. If the osteoporosis test is not covered by health insurance, they must pay a greater amount, which yields a huge financial burden. Therefore, active prevention policies to prevent osteoporosis should be implemented for women aged over 50 years living in rural areas where medical access is difficult, especially basic livelihood beneficiaries who have economic difficulties.
In the multivariate logistic regression analysis of the risk factors for the prevalence of osteoporosis in our study, there were differences found in the educational level, obesity, and diabetes. Reid reported that obesity has many mechanisms for the adipose–bone relationship that can reduce osteoporosis [41]. These include the effect of soft tissue mass on skeletal load, the amount of bone-activating hormone and fat in pancreatic beta cells (e.g., insulin, amylin, and insulin), and secretion of bone-activating hormones (e.g., estrogen and leptin) from fat cells. In the study by Vestergaard [42], the hip fracture risk was reported to have increased in both type 1 and type 2 diabetes, whereas the BMD increased in type 2 diabetes and decreased in type 1 diabetes; however, the mechanism of the relationship between diabetes and BMD requires further study.
Our study has several limitations. The first was the cross-sectional nature of the study and the small sample size. Second, smoking and drinking history were not included as factors in the study. This is because the smoking rate is very low in the rural population, and statistical stability was not secured in the multivariate analysis. Third, men were not included. Although the prevalence of osteoporosis is low in men, future research will need to be conducted on the relationship between osteoporosis and socioeconomic factors including men as a study group. Fourth, hematological tests were not included in the examination for osteoporosis. Lastly, further prospective cohort studies, long-term follow-up studies, and studies on the fracture risk of patients with osteoporosis are needed.

5. Conclusions

The risk of osteoporosis was higher in the elderly subjects and basic living beneficiaries living in rural areas. The prevalence of osteoporosis among rural residents was higher than that among city dwellers. However, the osteoporosis diagnosis rate between the rural and urban areas was not significantly different. This indicates that there are many patients with undiagnosed osteoporosis. Therefore, it is necessary to establish a policy and conduct interventions for the early diagnosis of osteoporosis in a population with a low socioeconomic status living in rural areas. In addition, it is necessary to provide physical activity programs and medication for the prevention of osteoporosis.

Author Contributions

Conceptualization, S.-W.K., M.-H.C., and W.-C.S.; data curation, M.-H.C.; formal analysis, M.-H.C.; investigation, S.-W.K., M.-H.C., J.-H.Y., W.-C.S., and Y.-J.K.; methodology, S.-W.K., M.-H.C., and Y.-J.K.; supervision, S.-W.K. and M.-H.C.; visualization, S.-W.K. and M.-H.C.; writing—original draft, S.-W.K. and M.-H.C.; writing—review and editing, M.-H.C. All authors have read and agreed to the published version of the manuscript.

Funding

This research was funded by a 2021 Research Grant from Pusan National University Yangsan Hospital. The funders were not involved in the study design, analysis, interpretation of data, writing, or submission of this manuscript. The authors have no conflict of interest to declare.

Institutional Review Board Statement

Not applicable.

Informed Consent Statement

Not applicable.

Data Availability Statement

All data are available from the database of the Korea National Health and Nutrition Examination Survey (https://knhanes.cdc.go.kr/ (accessed on 5 June 2021)).

Acknowledgments

This research was supported by a 2021 Research Grant from Pusan National University Yangsan Hospital.

Conflicts of Interest

The authors declare no conflict of interest.

References

  1. Bouillon, R.; Burckhardt, P.; Christiansen, C.; Fleisch, H.A.; Fujita, T.; Gennari, C.; Marin, T.J.; Mazzuoli, G.; Melton, L.J.; Ringe, J.D.; et al. Consensus development conference: Prophylaxis and treatment of osteoporosis. Am. J. Med. 1991, 90, 107–110. [Google Scholar] [CrossRef]
  2. Meeta, M.; Harinarayan, C.V.; Marwah, R.; Sahay, R.; Kalra, S.; Babhulkar, S. Clinical practice guidelines on postmenopausal osteoporosis: An executive summary and recommendations–Update 2019–2020. J. Midlife Health 2020, 11, 96–112. [Google Scholar] [CrossRef] [PubMed]
  3. Choi, Y.J.; Oh, H.J.; Kim, D.J.; Lee, Y.; Chung, Y.S. The prevalence of osteoporosis in Korean adults aged 50 years or older and the higher diagnosis rates in women who were beneficiaries of a national screening program: The Korea National Health and Nutrition Examination Survey 2008–2009. J. Bone Miner. Res. 2012, 27, 1879–1886. [Google Scholar] [CrossRef] [PubMed]
  4. Wu, X.P.; Liao, E.Y.; Zhang, H.; Dai, R.C.; Shan, P.F.; Cao, X.Z.; Liu, S.P.; Jiang, Y. Determination of age-specific bone mineral density and comparison of diagnosis and prevalence of primary osteoporosis in Chinese women based on both Chinese and World Health Organization criteria. J. Bone Miner. Metab. 2004, 22, 382–391. [Google Scholar] [CrossRef] [PubMed]
  5. Iki, M.; Kagamimori, S.; Kagawa, Y.; Matsuzaki, T.; Yoneshima, H.; Marumo, F. Bone mineral density of the spine, hip and distal forearm in representative samples of the Japanese female population: Japanese Population-Based Osteoporosis (JPOS) Study. Osteoporos. Int. 2001, 12, 529–537. [Google Scholar] [CrossRef]
  6. Kiebzak, G.M.; Beinart, G.A.; Perser, K.; Ambrose, C.G.; Siff, S.J.; Heggeness, M.H. Undertreatment of osteoporosis in men with hip fracture. Arch. Intern. Med. 2002, 162, 2217–2222. [Google Scholar] [CrossRef] [Green Version]
  7. Morris, C.A.; Cabral, D.; Cheng, H.; Katz, J.N.; Finkelstein, J.S.; Avorn, J.; Solomon, D.H. Patterns of bone mineral density testing: Current guidelines, testing rates, and interventions. J. Gen. Intern. Med. 2004, 19, 783–790. [Google Scholar] [CrossRef] [PubMed] [Green Version]
  8. Gehlbach, S.H.; Fournier, M.; Bigelow, C. Recognition of osteoporosis by primary care physicians. Am. J. Public Health 2002, 92, 271–273. [Google Scholar] [CrossRef]
  9. Choi, M.H.; Yang, J.H.; Seo, J.S.; Kim, Y.J.; Kang, S.W. Prevalence and diagnosis experience of osteoporosis in postmenopausal women over 50: Focusing on socioeconomic factors. PLoS ONE 2021, 16, e0248020. [Google Scholar] [CrossRef]
  10. Johnell, O.; Kanis, J.A. An estimate of the worldwide prevalence and disability associated with osteoporotic fractures. Osteoporos. Int. 2006, 17, 1726–1733. [Google Scholar] [CrossRef]
  11. Sözen, T.; Özışık, L.; Başaran, N.Ç. An overview and management of osteoporosis. Eur. J. Rheumatol. 2017, 4, 46–56. [Google Scholar] [CrossRef]
  12. Roh, Y.H.; Lee, E.S.; Ahn, J.; Kim, H.S.; Gong, H.S.; Baek, K.H.; Chung, H.Y. Factors affecting willingness to get assessed and treated for osteoporosis. Osteoporos. Int. 2019, 30, 1395–1401. [Google Scholar] [CrossRef] [PubMed]
  13. Navarro, M.C.; Sosa, M.; Saavedra, P.; Lainez, P.; Marrero, M.; Torres, M.; Medina, C.D. Poverty is a risk factor for osteoporotic fractures. Osteoporos. Int. 2009, 20, 393–398. [Google Scholar] [CrossRef] [PubMed]
  14. Kim, S.W.; Bae, K.H.; Seo, J.B.; Jeon, J.H.; Lee, W.K.; Lee, I.K.; Kim, J.G.; Park, K.G. Association between household size, residential area, and osteoporosis: Analysis of 2008 to 2011 Korea National Health and Nutrition Examination Survey. Korean J. Intern. Med. 2016, 31, 712–721. [Google Scholar] [CrossRef] [PubMed] [Green Version]
  15. Hansen, L.; Judge, A.; Javaid, M.K.; Cooper, C.; Vestergaard, P.; Abrahamsen, B.; Harvey, N.C. Social inequality and fractures—Secular trends in the Danish population: A case-control study. Osteoporos. Int. 2018, 29, 2243–2250. [Google Scholar] [CrossRef] [PubMed] [Green Version]
  16. Lai, M.M.Y.; Ang, W.M.; McGuiness, M.; Larke, A.B. Undertreatment of osteoporosis in regional Western Australia. Australas. J. Ageing 2012, 31, 110–114. [Google Scholar] [CrossRef]
  17. Lim, D.; Bahk, J.; Ock, M.; Kim, I.; Kang, H.Y.; Kim, Y.Y.; Park, J.H.; Khang, Y.H. Income-related inequality in quality-adjusted life expectancy in Korea at the national and district levels. Health Qual. Life Outcomes 2020, 18, 1–8. [Google Scholar] [CrossRef] [Green Version]
  18. Harris, J.K.; Beatty, K.; Leider, J.P.; Knudson, A.; Anderson, B.L.; Meit, M. The double disparity facing rural local health departments. Annu. Rev. Public Health 2016, 37, 167–184. [Google Scholar] [CrossRef] [Green Version]
  19. Hong, J.W.; Noh, J.H.; Kim, D.J. The prevalence of and demographic factors associated with radiographic knee osteoarthritis in Korean adults aged ≥50 years: The 2010–2013 Korea national health and nutrition examination survey. PLoS ONE 2020, 15, e0230613. [Google Scholar] [CrossRef]
  20. Garcia, M.C.; Rossen, L.M.; Bastian, B.A.; Faul, M.; Dowling, N.F.; Thomas, C.C.; Schieb, L.; Hong, Y.; Yoon, P.W.; Iademarco, M.F. Potentially excess deaths from the five leading causes of death in metropolitan and nonmetropolitan counties—United States, 2010–2017. MMWR Surveill. Summ. 2019, 68, 1–16. [Google Scholar] [CrossRef] [Green Version]
  21. Han, S.H.; Jo, E.H.; Son, J.A.; So, E.S. Factors association national health screening programparticipation according to sex in Korean:Using the fifth Korea national health and nutrition examinationsurvey(KNHANES Ⅵ, 2013). Korean J. Health Educ. Prompt. 2016, 33, 37–48. [Google Scholar] [CrossRef] [Green Version]
  22. Vanasse, A.; Courteau, J.; Cohen, A.A.; Orzanco, M.G.; Drouin, C. Rural-urban disparities in the management and health issues of chronic diseases in Quebec (Canada) in the early 2000s. Rural Remote Health 2010, 10, 1548. [Google Scholar]
  23. Ministry of Health and Welfare. Korea Health Statistics. The Number of Beneficiaries of National Basic Livelihood Security System in Korea 2019. Available online: http://www.index.go.kr/potal/main/EachDtlPageDetail.do?idx_cd (accessed on 5 April 2021).
  24. Jeon, B.; Noguchi, H.; Kwon, S.; Ito, T.; Tamiya, N. Disability, poverty, and role of the basic livelihood security system on health services utilization among the elderly in South Korea. Soc. Sci. Med. 2017, 178, 175–183. [Google Scholar] [CrossRef] [Green Version]
  25. Choi, M.H. The impact of basic livelihoods condition on the current smoking: Applying the counterfactual model. Korean J. Health Educ. Promot. 2019, 36, 53–67. [Google Scholar] [CrossRef]
  26. Ministry of Health and Welfare. Korea Health Statistics. 2019 Korea National Health and Nutrition Examination Survey (KNHANHES VIII-1). Available online: https://knhanes.kdca.go.kr/knhanes/main.do (accessed on 5 April 2021).
  27. Kanis, J.A. Assessment of fracture risk and its application to screening for postmenopausal osteoporosis: Synopsis of a WHO report. Osteoporos. Int. 1994, 4, 368–381. [Google Scholar] [CrossRef]
  28. Kanis, J.A. Assessment of Osteoporosis at the Primary Health-Care Level: Technical Report; University of Sheffield Medical School and the World Health Organization Collaborating Centre for Metabolic Bone Diseases: Sheffield, UK, 2007; pp. 1–339. Available online: https://www.sheffield.ac.uk/FRAX/pdfs/WHO_Technical_Report.pdf (accessed on 5 April 2021).
  29. Hong, J.E.; Yoon, S.Y. A Study on factors associated with the patterns of alcohol use in recipients of national basic livelihood guarantees. J. Soc. Sci. 2016, 33, 73–104. [Google Scholar]
  30. Eom, J.R.; Moon, J.W. Relationship between depression and life satisfaction of social assistance recipients—Focusing on mediating effect of self-esteem and coping strategies for family conflict. Health Soc. Sci. 2016, 43, 85–113. [Google Scholar] [CrossRef]
  31. Jang, I.Y.; Jung, H.W.; Lee, C.K.; Lee, Y.S.; Kim, K.I.; Kim, K.W.; Oh, H.J.; Ji, M.Y.; Lee, E.J.; Kim, D.H. Rural and urban disparities in frailty and aging-related health conditions in Korea. J. Am. Geriatr. Soc. 2016, 64, 908–911. [Google Scholar] [CrossRef] [PubMed] [Green Version]
  32. Lee, Y.H. Socioeconomic differences among community-dwelling diabetic adults screened for diabetic retinopathy and nephropathy: The 2015 Korean Community Health Survey. PLoS ONE 2018, 13, e0191496. [Google Scholar] [CrossRef] [PubMed]
  33. Peck, W.A. Consensus development conference: Diagnosis, prophylaxis, and treatment of osteoporosis. Am. J. Med. 1993, 94, 646–650. [Google Scholar] [CrossRef]
  34. World Health Organization. Assessment of fracture risk and its application to screening for postmenopausal osteoporosis: Report of a WHO study group. World Health Organ. Tech. Rep. Ser. 1994, 843, 1–129. [Google Scholar]
  35. Cauley, J.A. Public health impact of osteoporosis. J. Gerontol. A Biol. Sci. Med. Sci. 2013, 68, 1243–1251. [Google Scholar] [CrossRef] [Green Version]
  36. Wang, J.; Zhang, W.; Wang, X.; Li, C.; Li, J.; Zhao, Y.; Chen, L.; Qi, X.; Qiao, L.; Da, W.; et al. Urban–rural differences in bone mineral density and its association with reproductive and menstrual factors among older women. Calcif. Tissue Int. 2020, 106, 637–645. [Google Scholar] [CrossRef]
  37. Kim, J.; Lee, J.; Shin, J.Y.; Park, B.J. Socioeconomic disparities in osteoporosis prevalence: Different results in the overall Korean adult population and single-person households. J. Prev. Med. Public Health 2015, 48, 84–93. [Google Scholar] [CrossRef] [PubMed] [Green Version]
  38. Ewald, D.P.; Eisman, J.A.; Ewald, B.D.; Winzenberg, T.M.; Seibel, M.J.; Ebeling, P.R.; Flicker, L.; Nash, P.T. Population rates of bone densitometry use in Australia, 2001–2005, by sex and rural versus urban location. Med. J. Aust. 2009, 190, 126–128. [Google Scholar] [CrossRef]
  39. Nguyen, J.; Anandasivam, N.S.; Cooperman, D.; Pelker, R.; Wiznia, D.H. Does Medicaid insurance provide sufficient access to pediatric orthopedic care under the affordable care act? Glob. Pediatr. Health 2019, 6, 1–7. [Google Scholar] [CrossRef] [PubMed] [Green Version]
  40. Wiznia, D.H.; Nwachuku, E.; Roth, A.; Kim, C.Y.; Save, A.; Anandasivam, N.S.; Medvecky, M.; Pelker, R. The influence of medical insurance on patient access to orthopaedic surgery sports medicine appointments under the Affordable Care Act. Orthop. J. Sports Med. 2017, 5, 1–7. [Google Scholar] [CrossRef] [PubMed] [Green Version]
  41. Reid, I.R. Relationships between fat and bone. Osteoporos. Int. 2008, 19, 595–606. [Google Scholar] [CrossRef]
  42. Vestergaard, P. Discrepancies in bone mineral density and fracture risk in patients with type 1 and type 2 diabetes—A meta-analysis. Osteoporos. Int. 2007, 18, 427–444. [Google Scholar] [CrossRef] [PubMed]
Figure 1. Osteoporosis prevalence and diagnosis experience rates by basic livelihood condition according to the areas of residence.
Ijerph 18 09478 g001
Table 1. General characteristics of the study population.
VariablesTotalUrbanRuralp-Values a
n%n%n%
Total1476100.01042100.0434100.0
Age group (year)50–5955237.442040.313230.4<0.001
60–6950534.236434.914132.5
≥7041928.425824.816137.1
Educational level≤Middle school118380.178175.040292.6<0.001
≥High school29319.926125.0327.4
Basic livelihood conditionNon-beneficiaries135591.897693.737987.3<0.001
Beneficiaries1218.2666.35512.7
Physical activity bNo117979.985081.632975.80.012
Yes29720.119218.410524.2
Obesity cNo140695.399895.840894.00.145
Yes704.7444.2266.0
Hypertension dNo72048.852049.920046.10.181
Yes75651.252250.123453.9
Diabetes eNo127786.589085.438789.20.054
Yes19913.515214.64710.8
Residence areaUrban104270.6
Rural43429.4
a Results of the χ2 test between the urban and rural areas. b Engaging in vigorous physical activity for >20 min, 3 times a week or moderate physical activity for >30 min, 5 days in the last week. c Body mass index of >30 kg/m2. d Systolic blood pressure of >140 mmHg, diastolic blood pressure of >90 mmHg, or hypertension medication. e Fasting blood sugar level of >126 mg/dL or diabetes medication.
Table 2. Osteoporosis prevalence and diagnosis rates according to factors.
VariablesPrevalenceDiagnosis
n%χ2 Test
p-Values
n%χ2 Test
p-Values
Total51334.8 32522.0
Age group (year)50–598214.9<0.0016111.1<0.001
60–6916532.712625.0
≥7026663.513832.9
Educational level≤Middle school47239.9<0.00132523.20.033
≥High school4114.05117.4
Basic livelihood conditionNon-beneficiaries44833.1<0.00129421.90.318
Beneficiaries6553.73125.6
Physical activityNo42636.10.02725221.40.234
Yes8729.37324.6
ObesityNo50035.60.00431422.30.192
Yes1318.61115.7
HypertensionNo22431.10.00415121.00.344
Yes28938.217423.0
DiabetesNo45335.50.14227221.30.091
Yes6030.25326.6
Residence areaUrban33131.8<0.00122221.30.305
Rural18241.910323.7
Table 3. Multivariate logistic regression analysis of the influence of the factors on the osteoporosis prevalence and diagnosis rate in the total population.
VariablesPrevalenceDiagnosis Rate
Adjusted OR95% CIp-ValuesAdjusted OR95% CIp-Values
Age group (year)50–59Ref.Ref.
60–692.62(1.92–3.57)<0.0012.81(1.99–3.98)<0.001
≥708.83(6.33–12.32)<0.0014.33(3.00–6.24)<0.001
Educational level≥High schoolRef.Ref.
≤Middle school2.47(1.69–3.62)<0.0010.92(0.64–1.32)0.637
Basic livelihood
condition
Non-beneficiariesRef.Ref.
Beneficiaries1.51(0.99–2.30)0.0570.96(0.61–1.50)0.847
Physical activityNoRef.Ref.
Yes0.77(0.56–1.04)0.0911.33(0.97–1.81)0.072
ObesityNoRef.Ref.
Yes0.33(0.17–0.63)0.0010.60(0.31–1.18)0.139
HypertensionNoRef.Ref.
Yes0.92(0.72–1.19)0.5290.86(0.66–1.12)0.269
DiabetesNoRef.Ref.
Yes0.54(0.37–0.77)0.0011.17(0.82–1.67)0.396
Residence areaUrbanRef.Ref.
Rural1.41(1.11–1.71)0.0011.01(0.76–1.34)0.927
Odds ratio adjusted for all other confounders (age, education level, basic livelihood condition, physical activity, obesity, hypertension, diabetes, residence area). CI, confidence interval.
Table 4. Multivariate logistic regression analysis of the influence of the basic livelihood condition on the osteoporosis prevalence and diagnosis rate in the rural and urban areas.
Models aResidence AreaDependent VariablesIndependent Variable
(Basic Livelihood Condition)
Adjusted OR95% CIp-Values
Model 1UrbanPrevalenceNon-beneficiariesRef.
Beneficiaries1.24(0.71–2.17)0.447
Model 2Diagnosis rateNon-beneficiariesRef.
Beneficiaries1.34(0.76–2.37)0.305
Model 3RuralPrevalenceNon-beneficiariesRef.
Beneficiaries2.08(1.06–4.10)0.033
Model 4Diagnosis rateNon-beneficiariesRef.
Beneficiaries0.56(0.27–1.17)0.120
a All models were adjusted for age group, educational level, physical activity, obesity, hypertension, and diabetes. OR, odds ratio; CI, confidence interval.
Publisher’s Note: MDPI stays neutral with regard to jurisdictional claims in published maps and institutional affiliations.

