
Does Climate Play Any Role in COVID-19 Spreading?—An Australian Perspective


Abstract
1. Introduction
2. Methodology
2.1. Data Collection
2.2. Statistical Analysis
3. Results
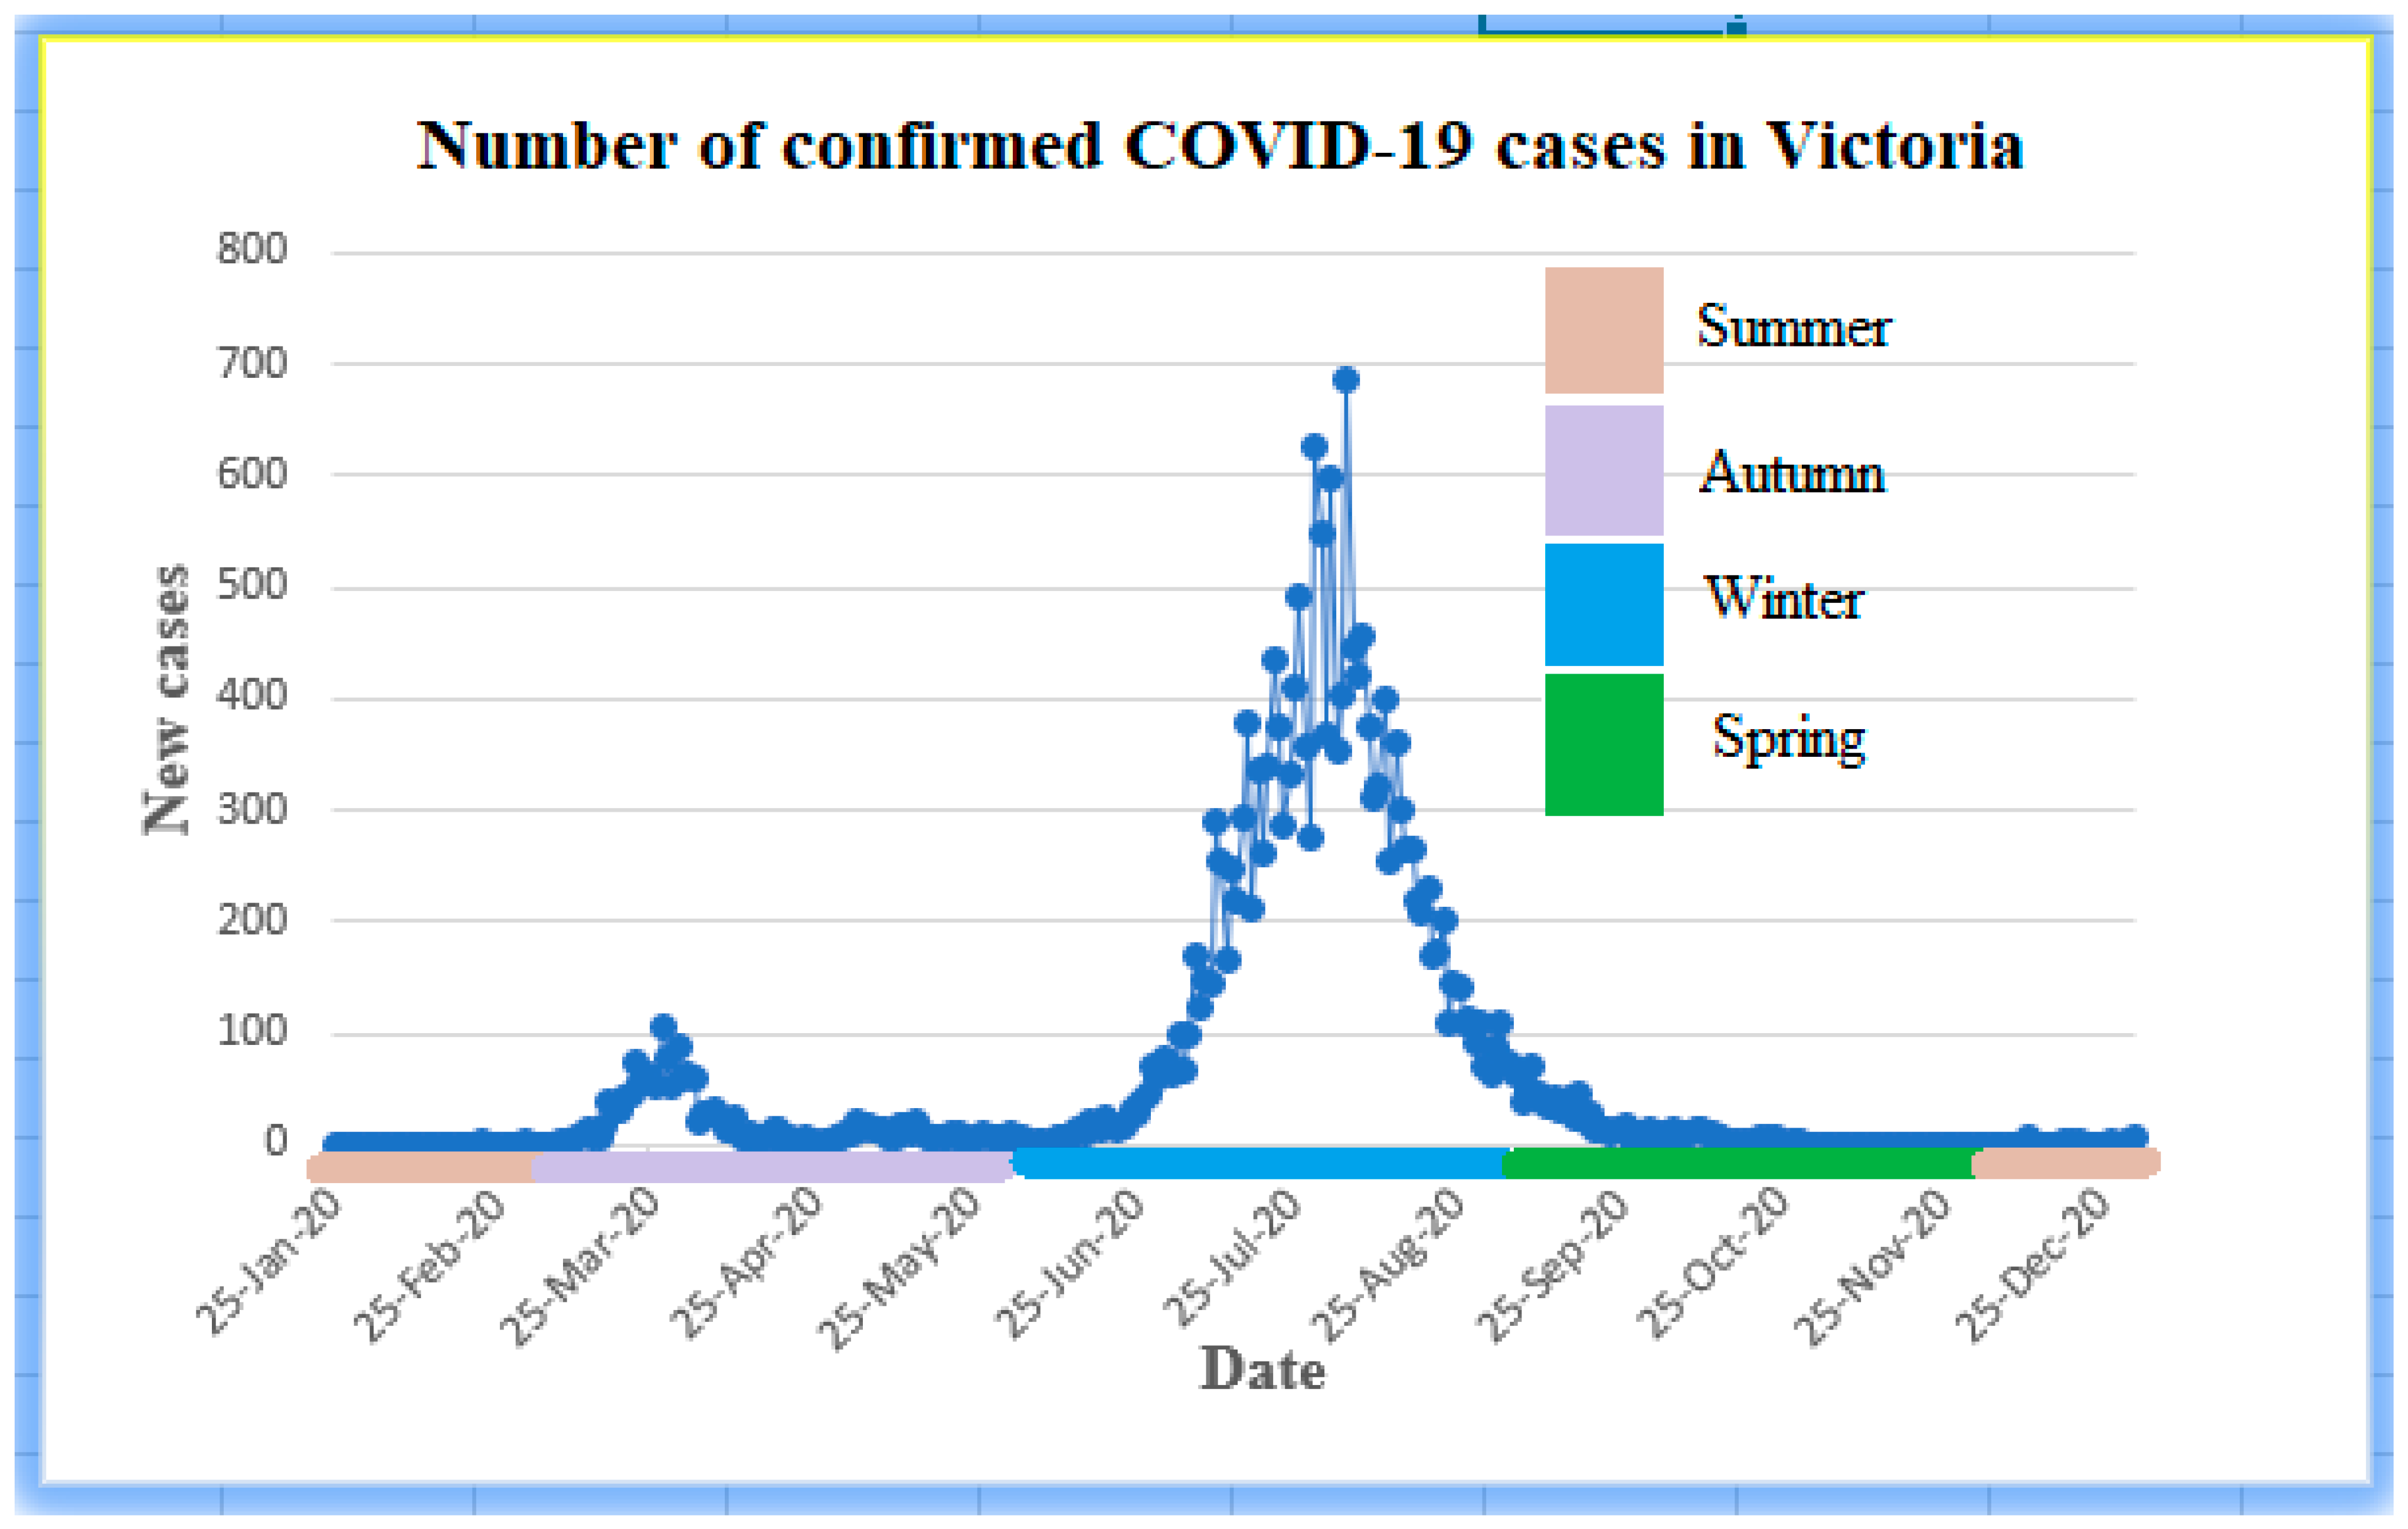
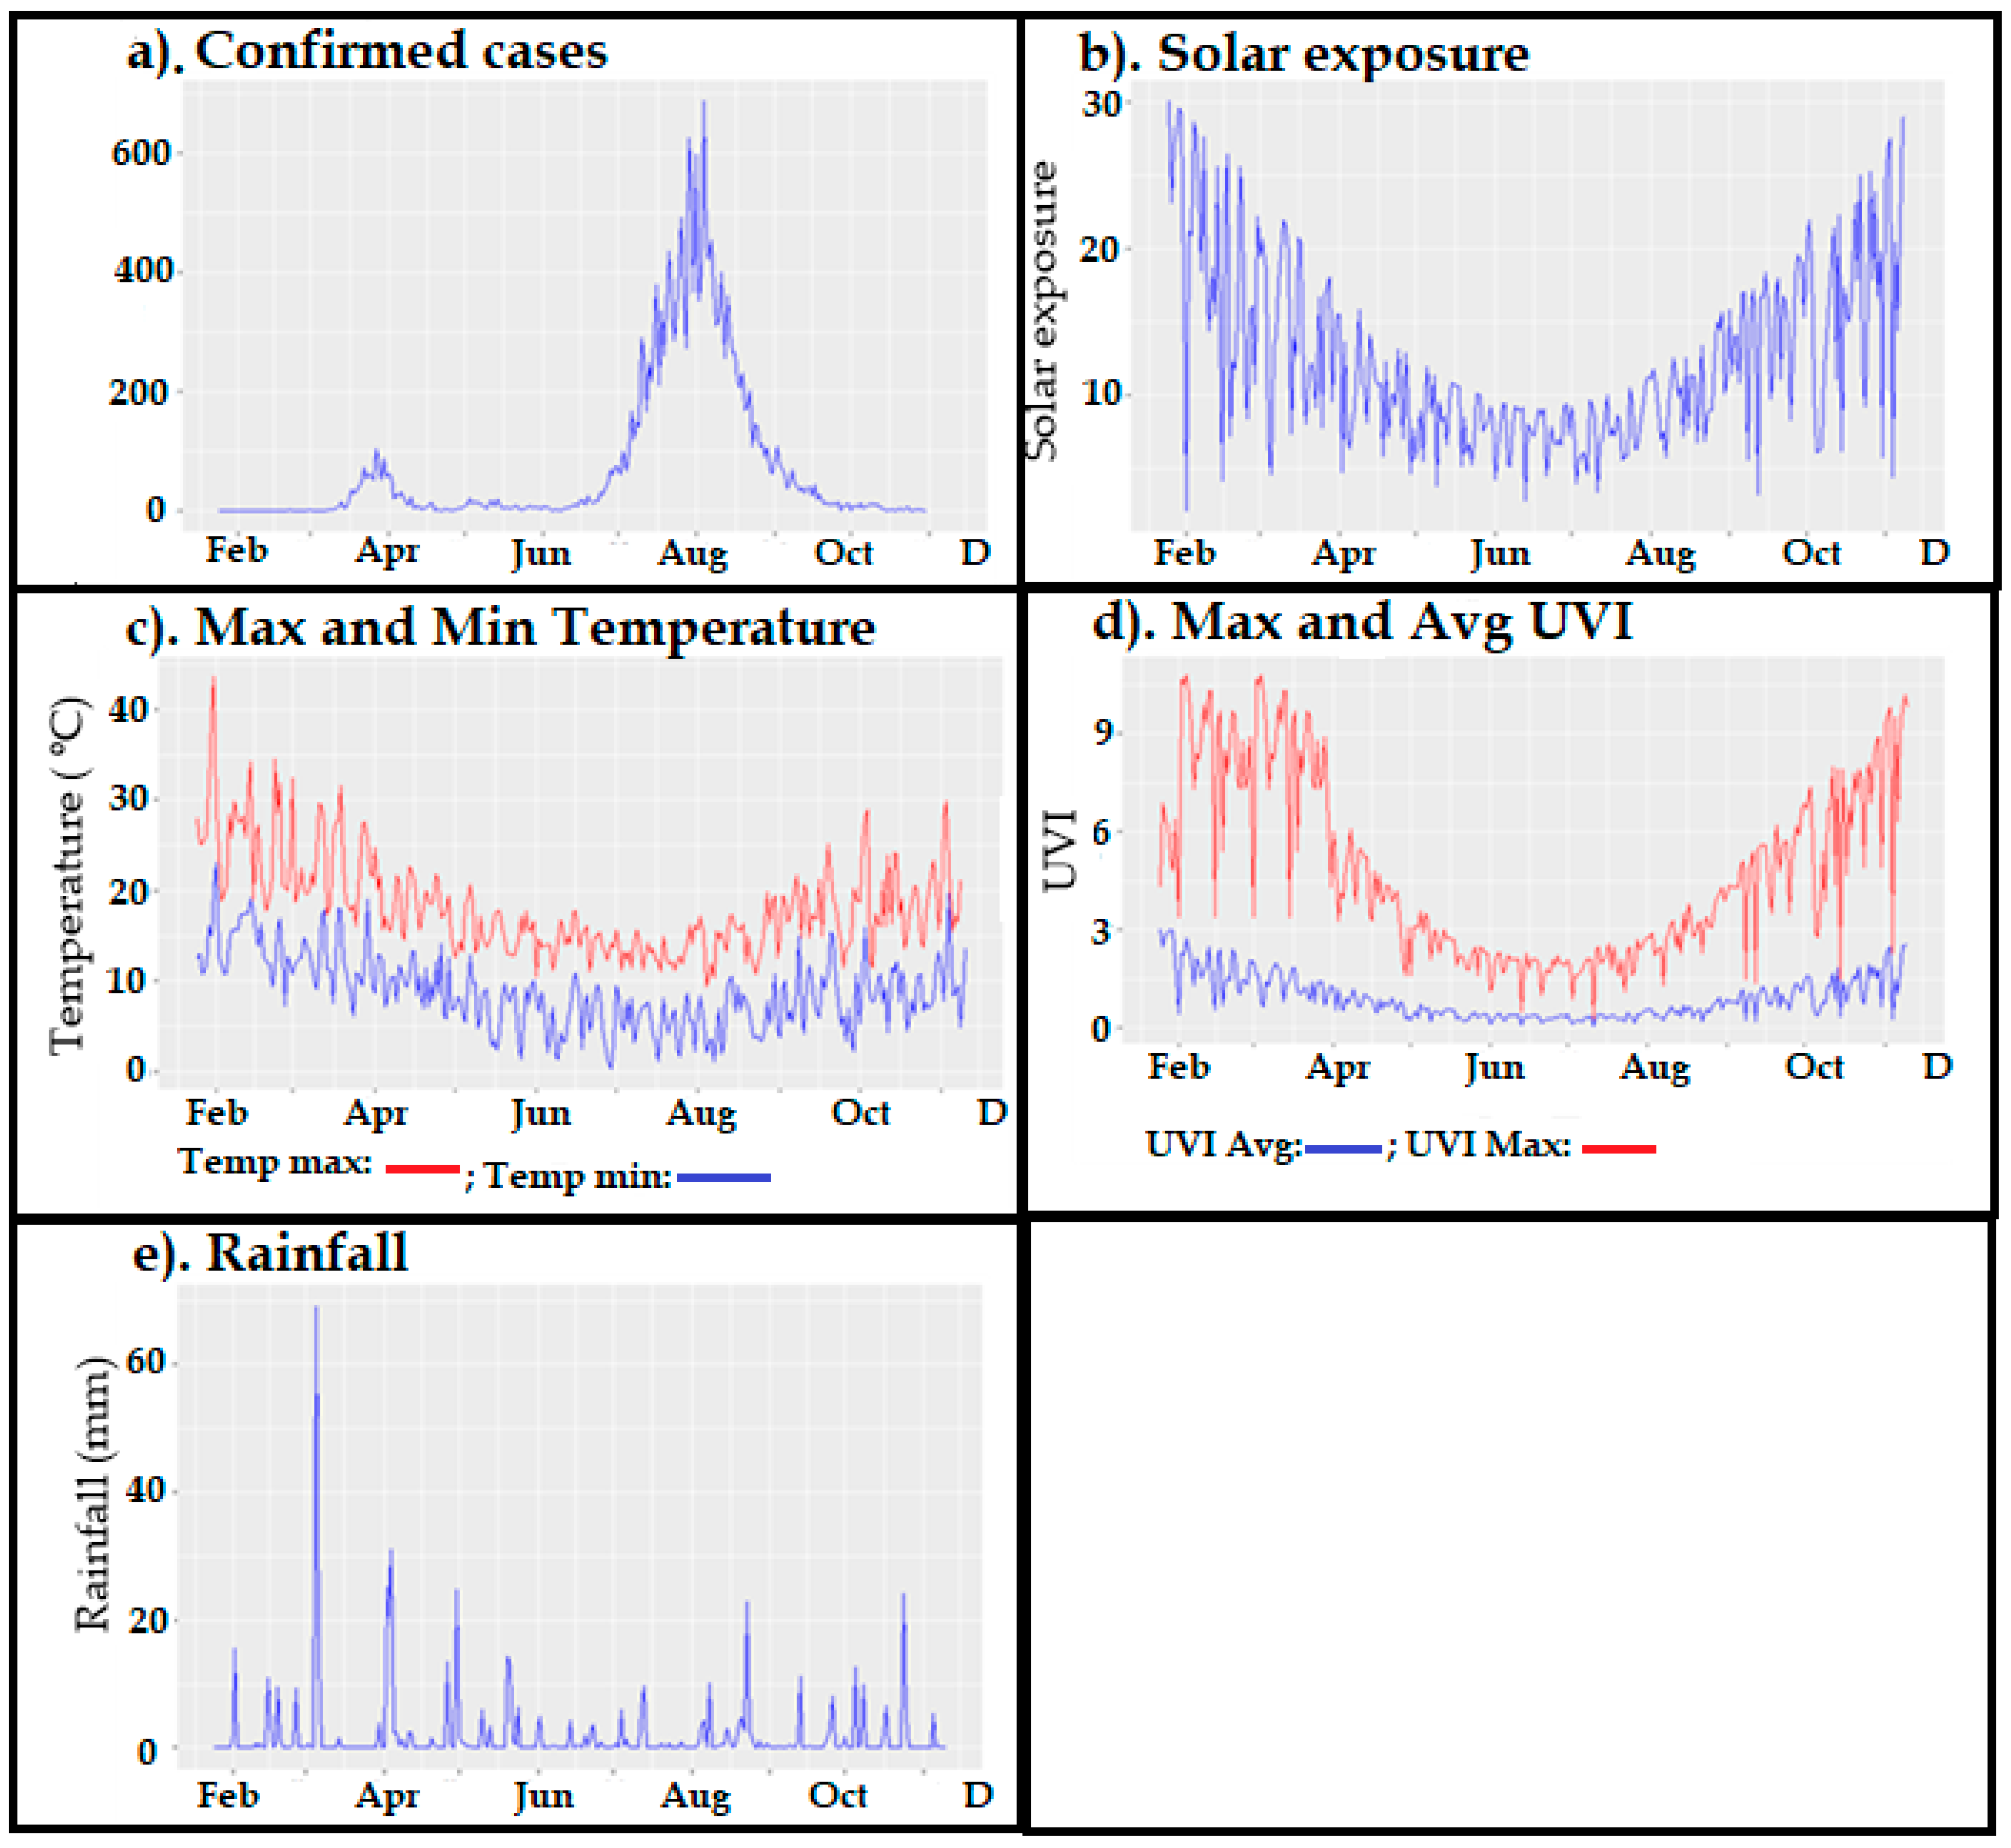
3.1. Descriptive Analyses
3.2. Correlation Analysis of Original and Stationary Times Series
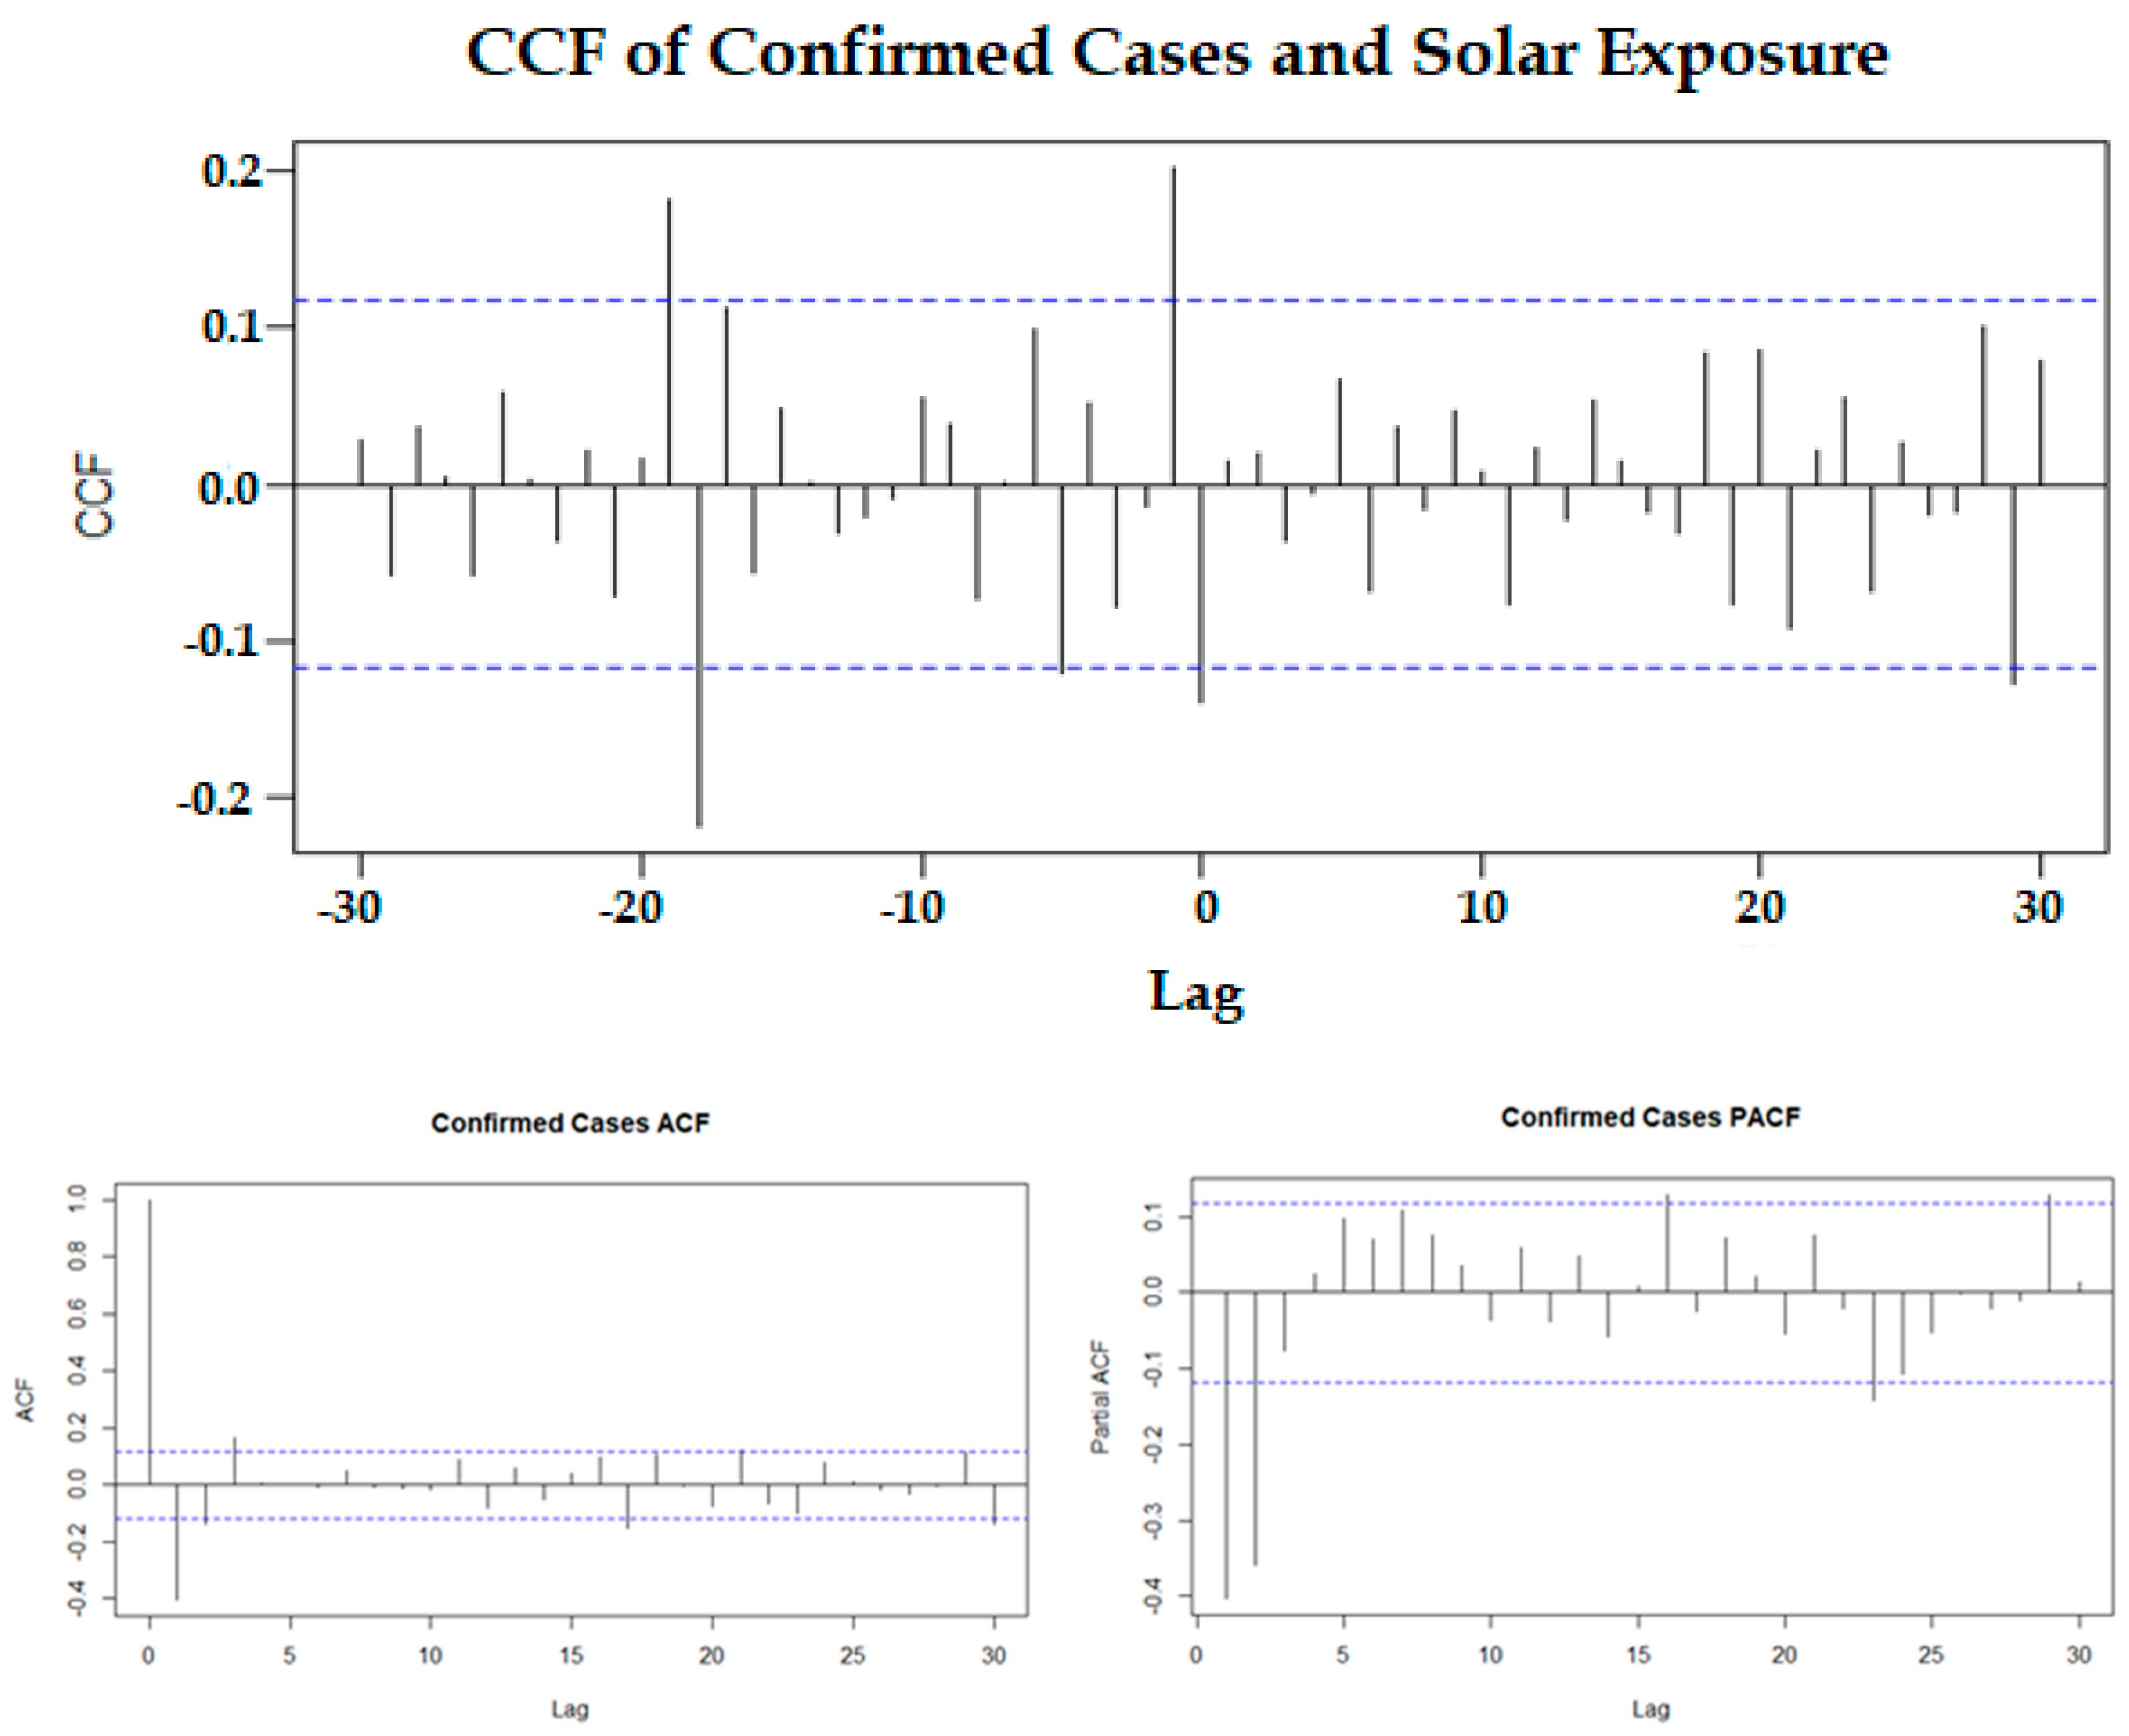
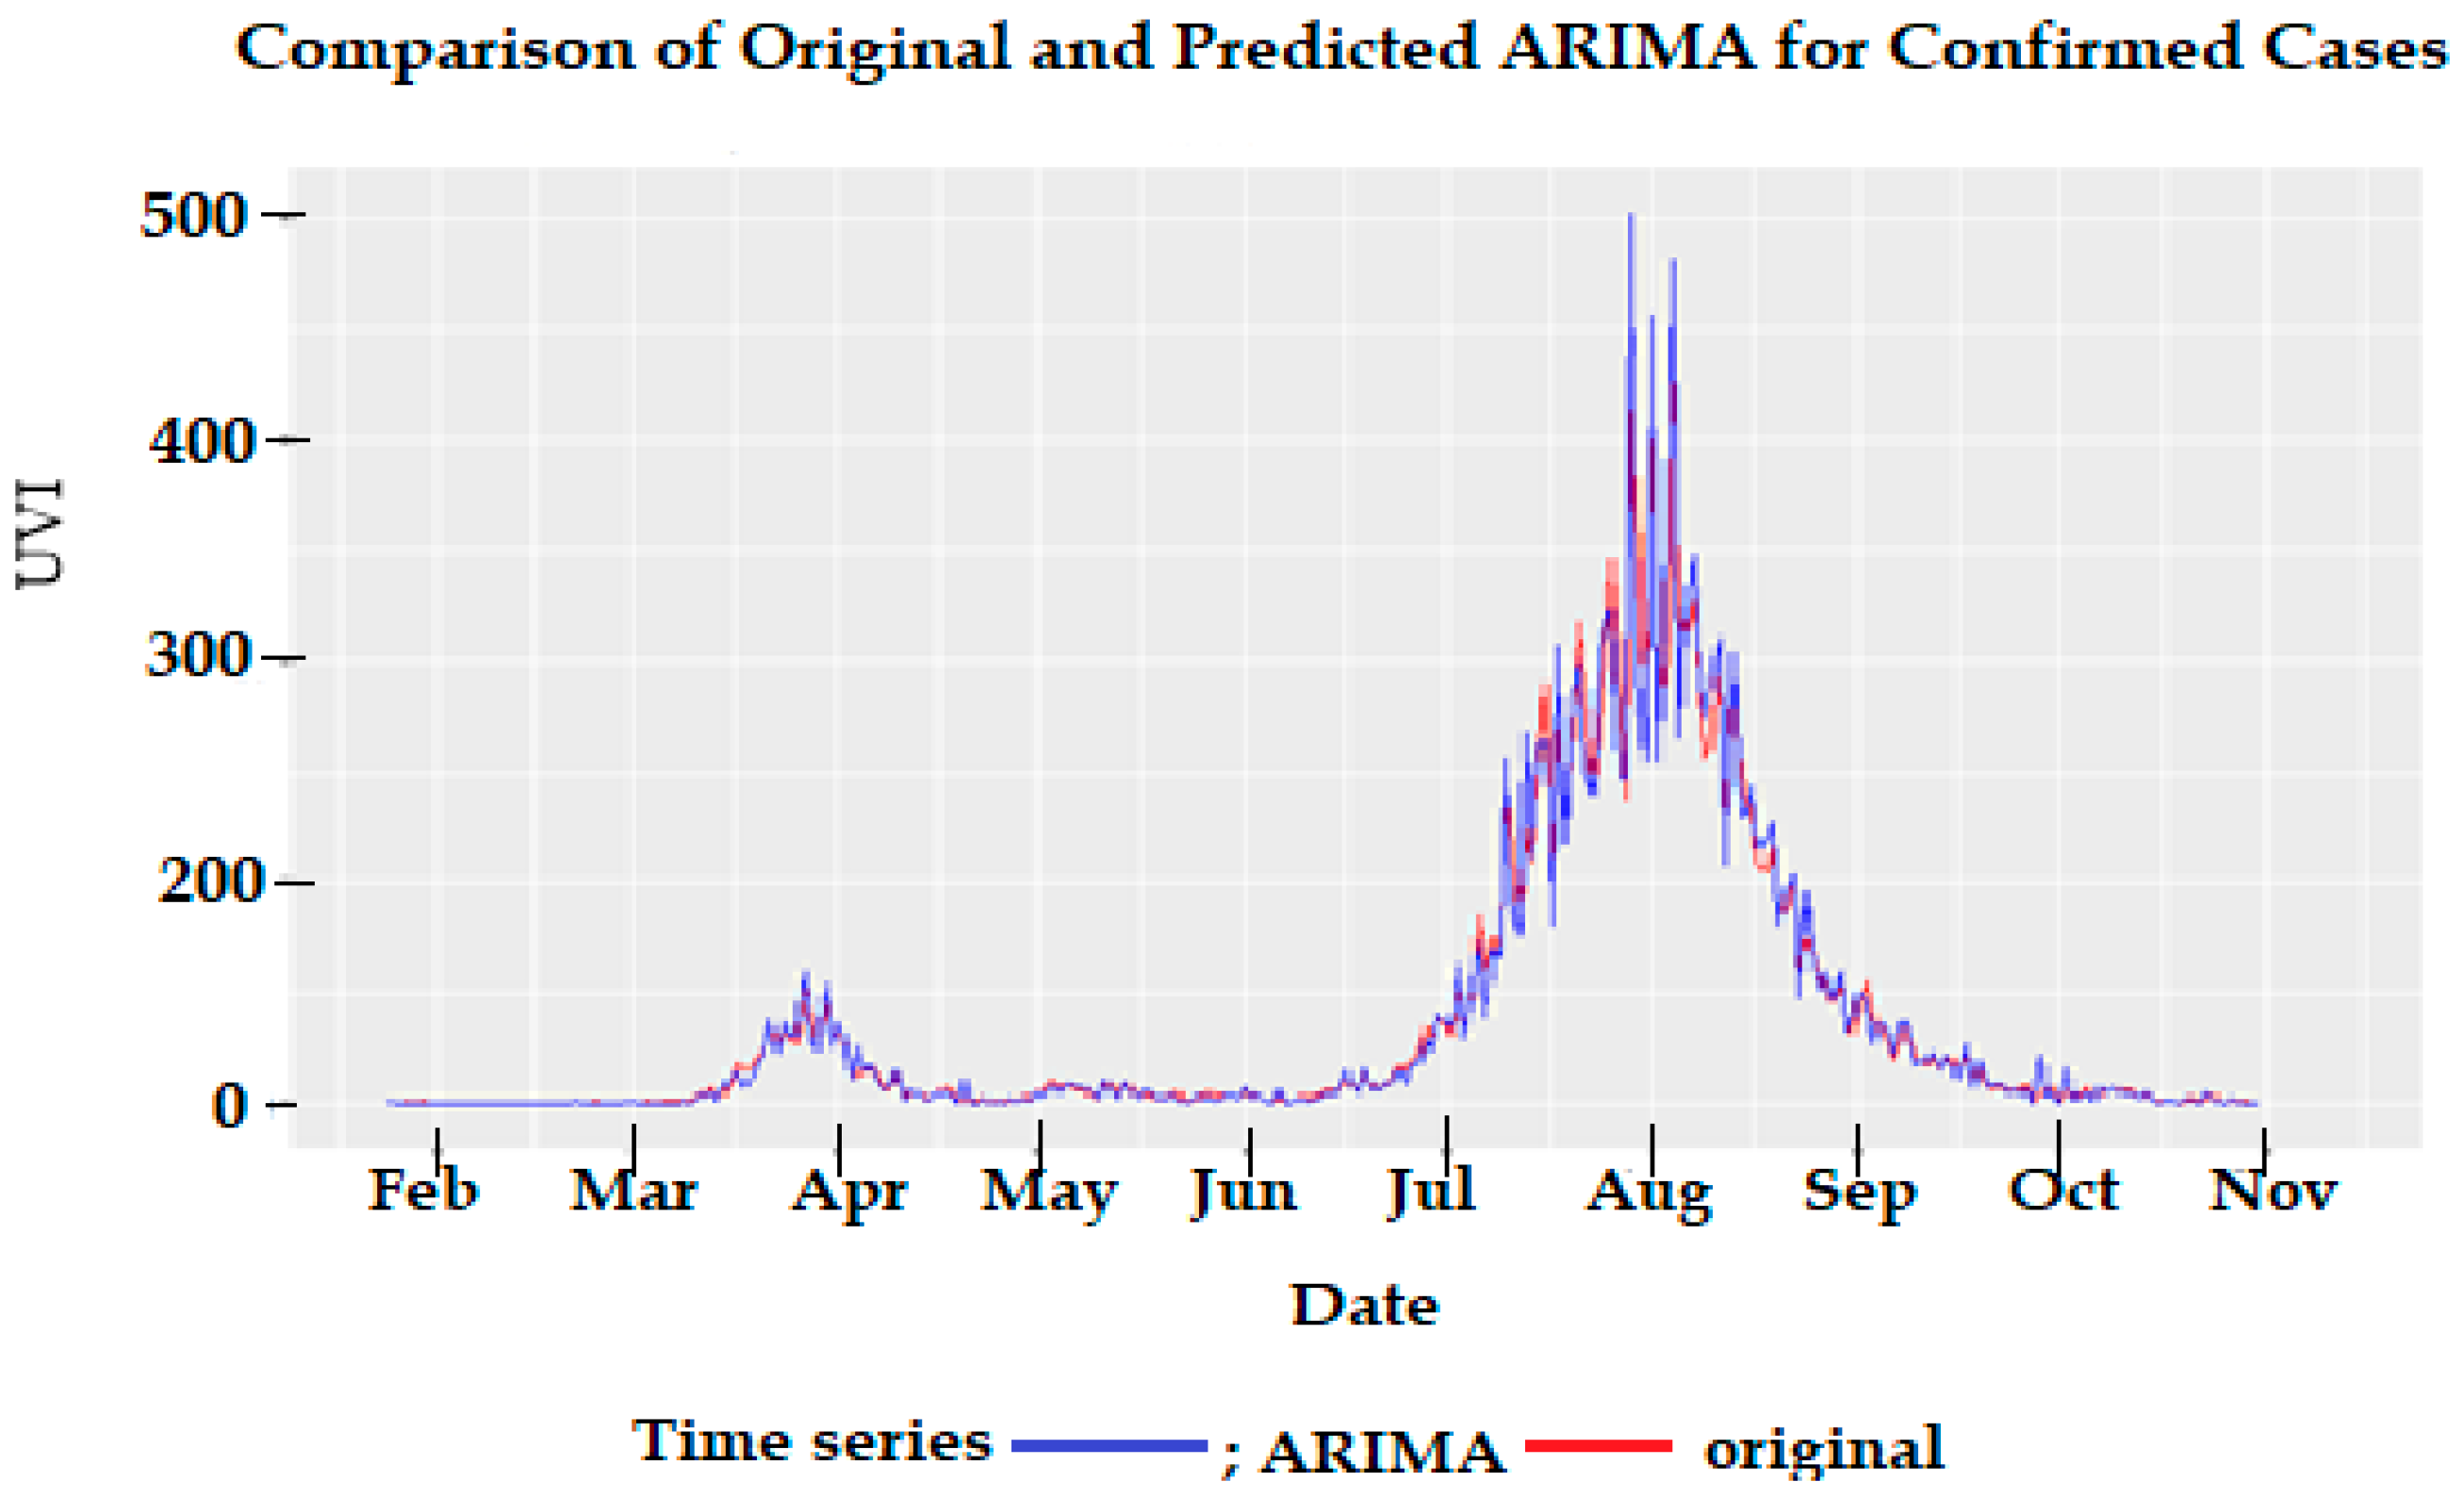
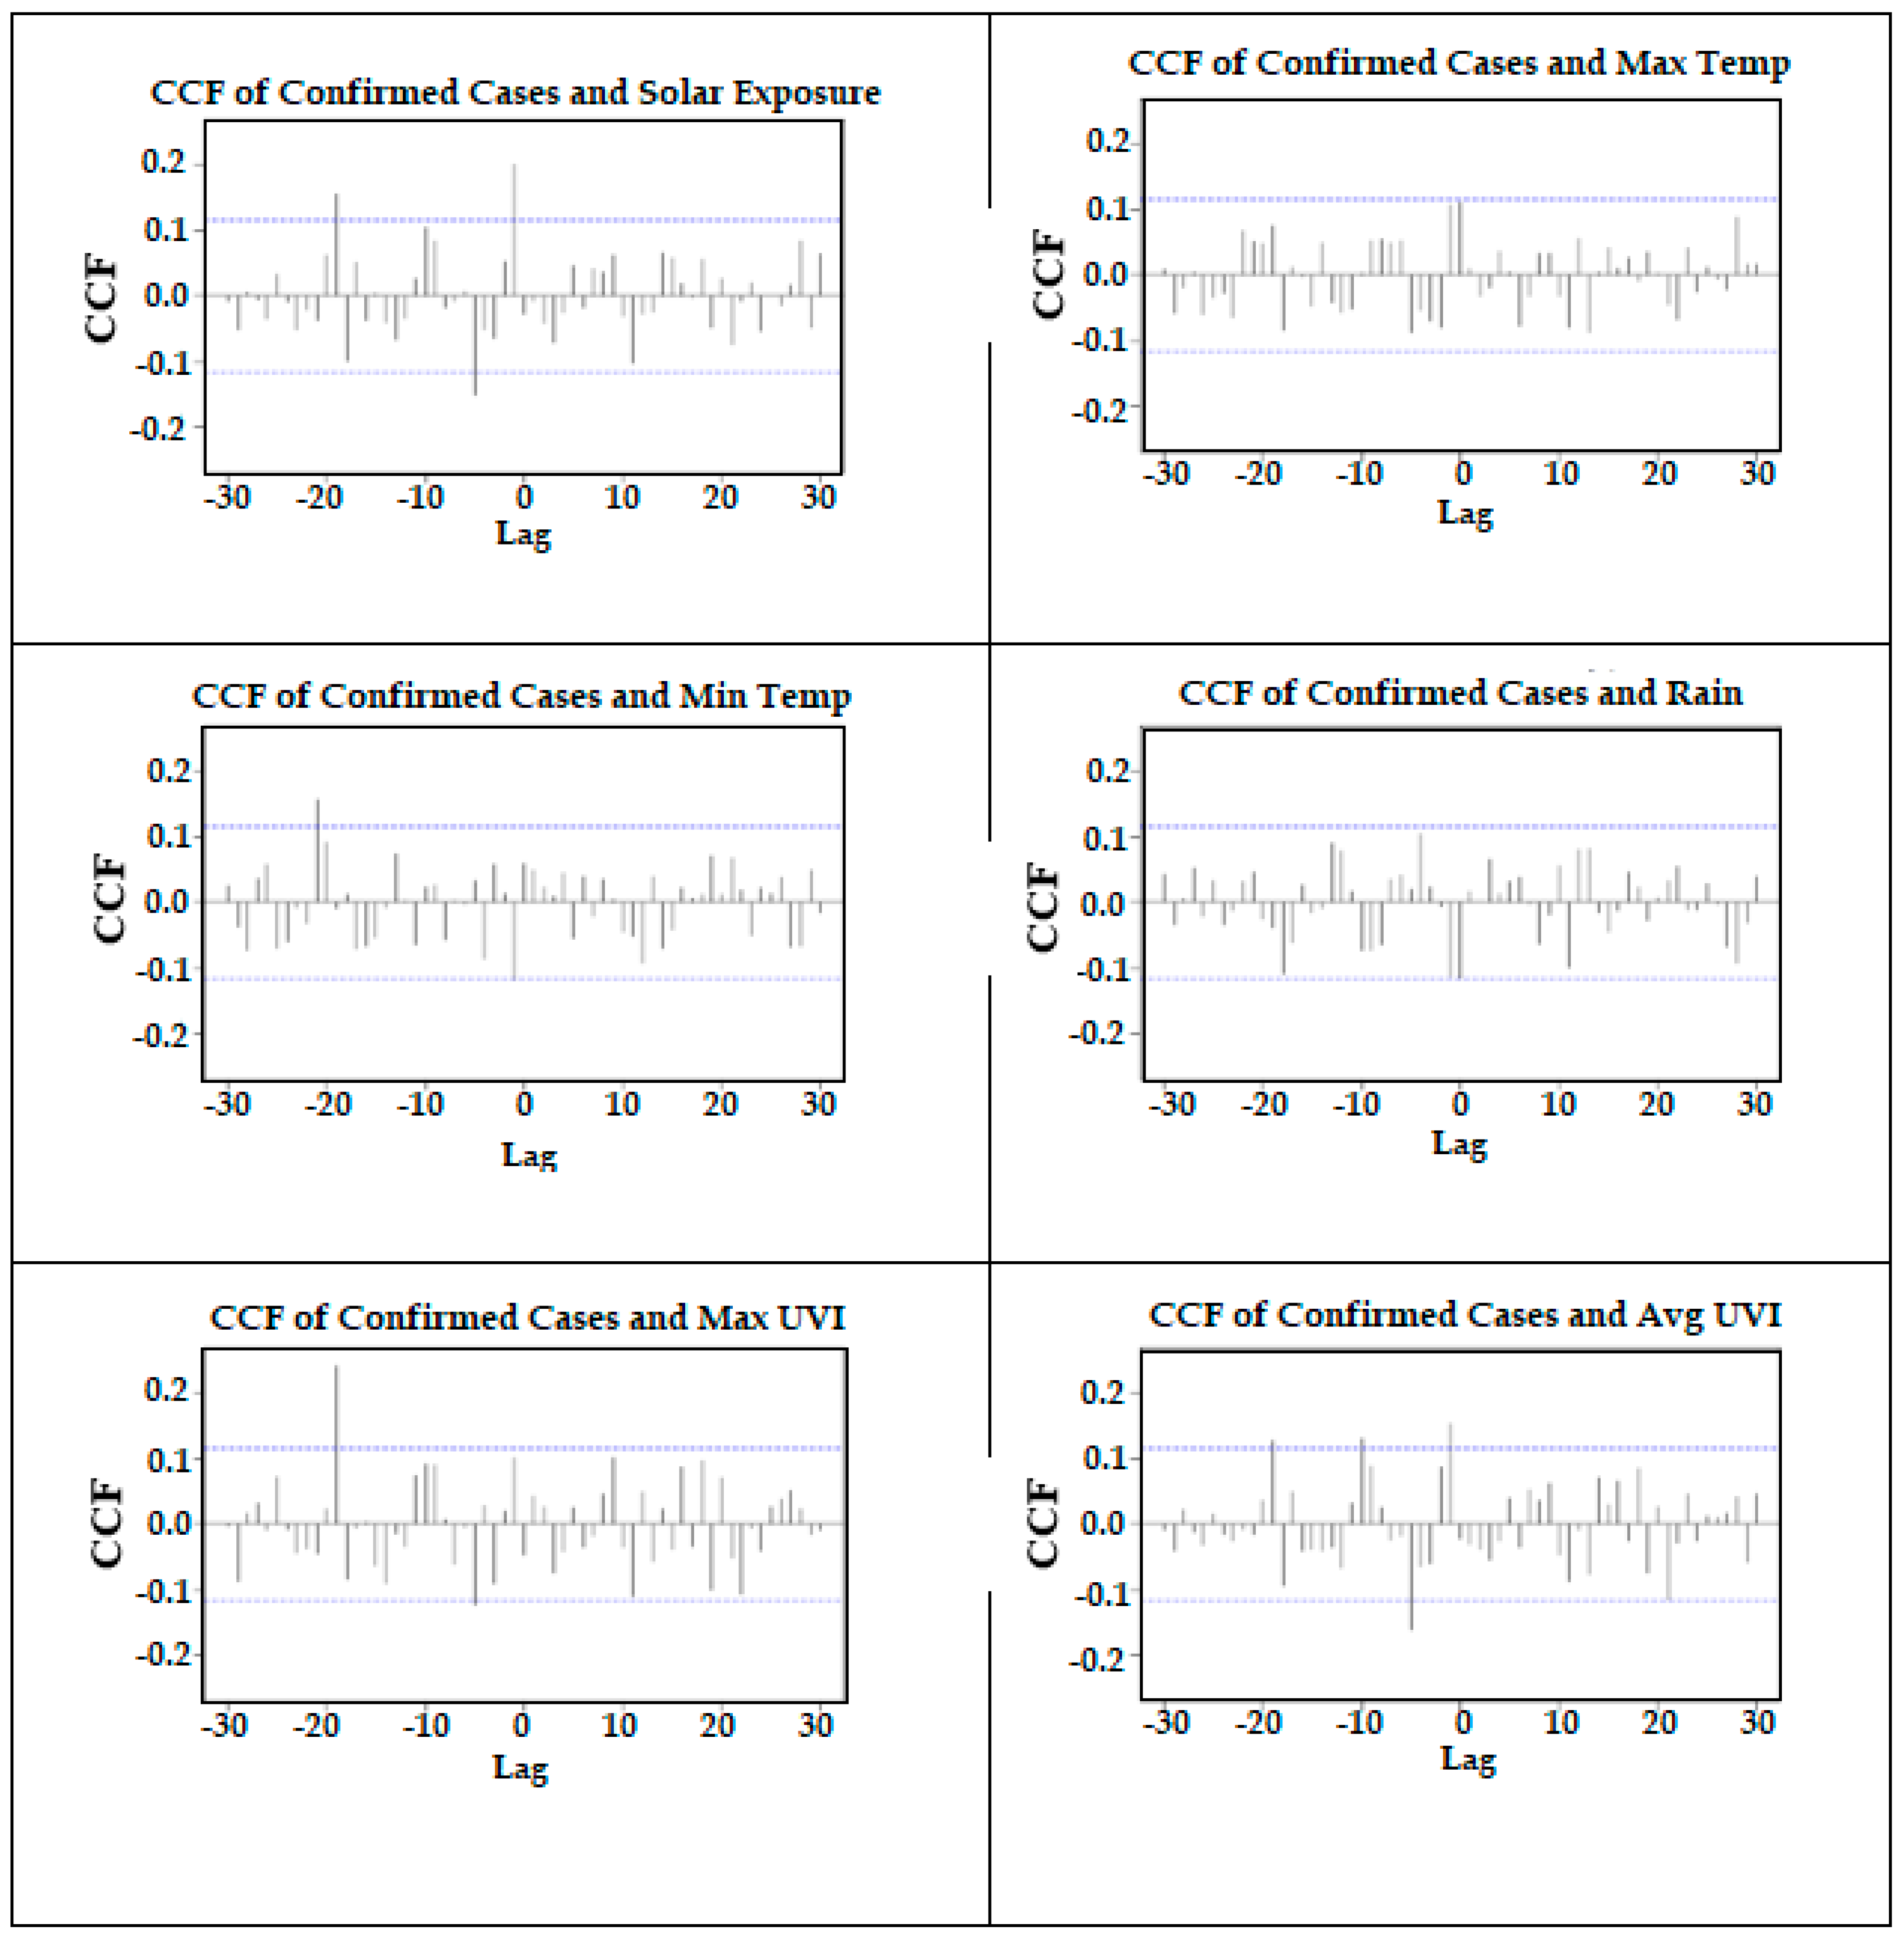
3.3. Correlation Analysis after Pre-Whitening the Time Series
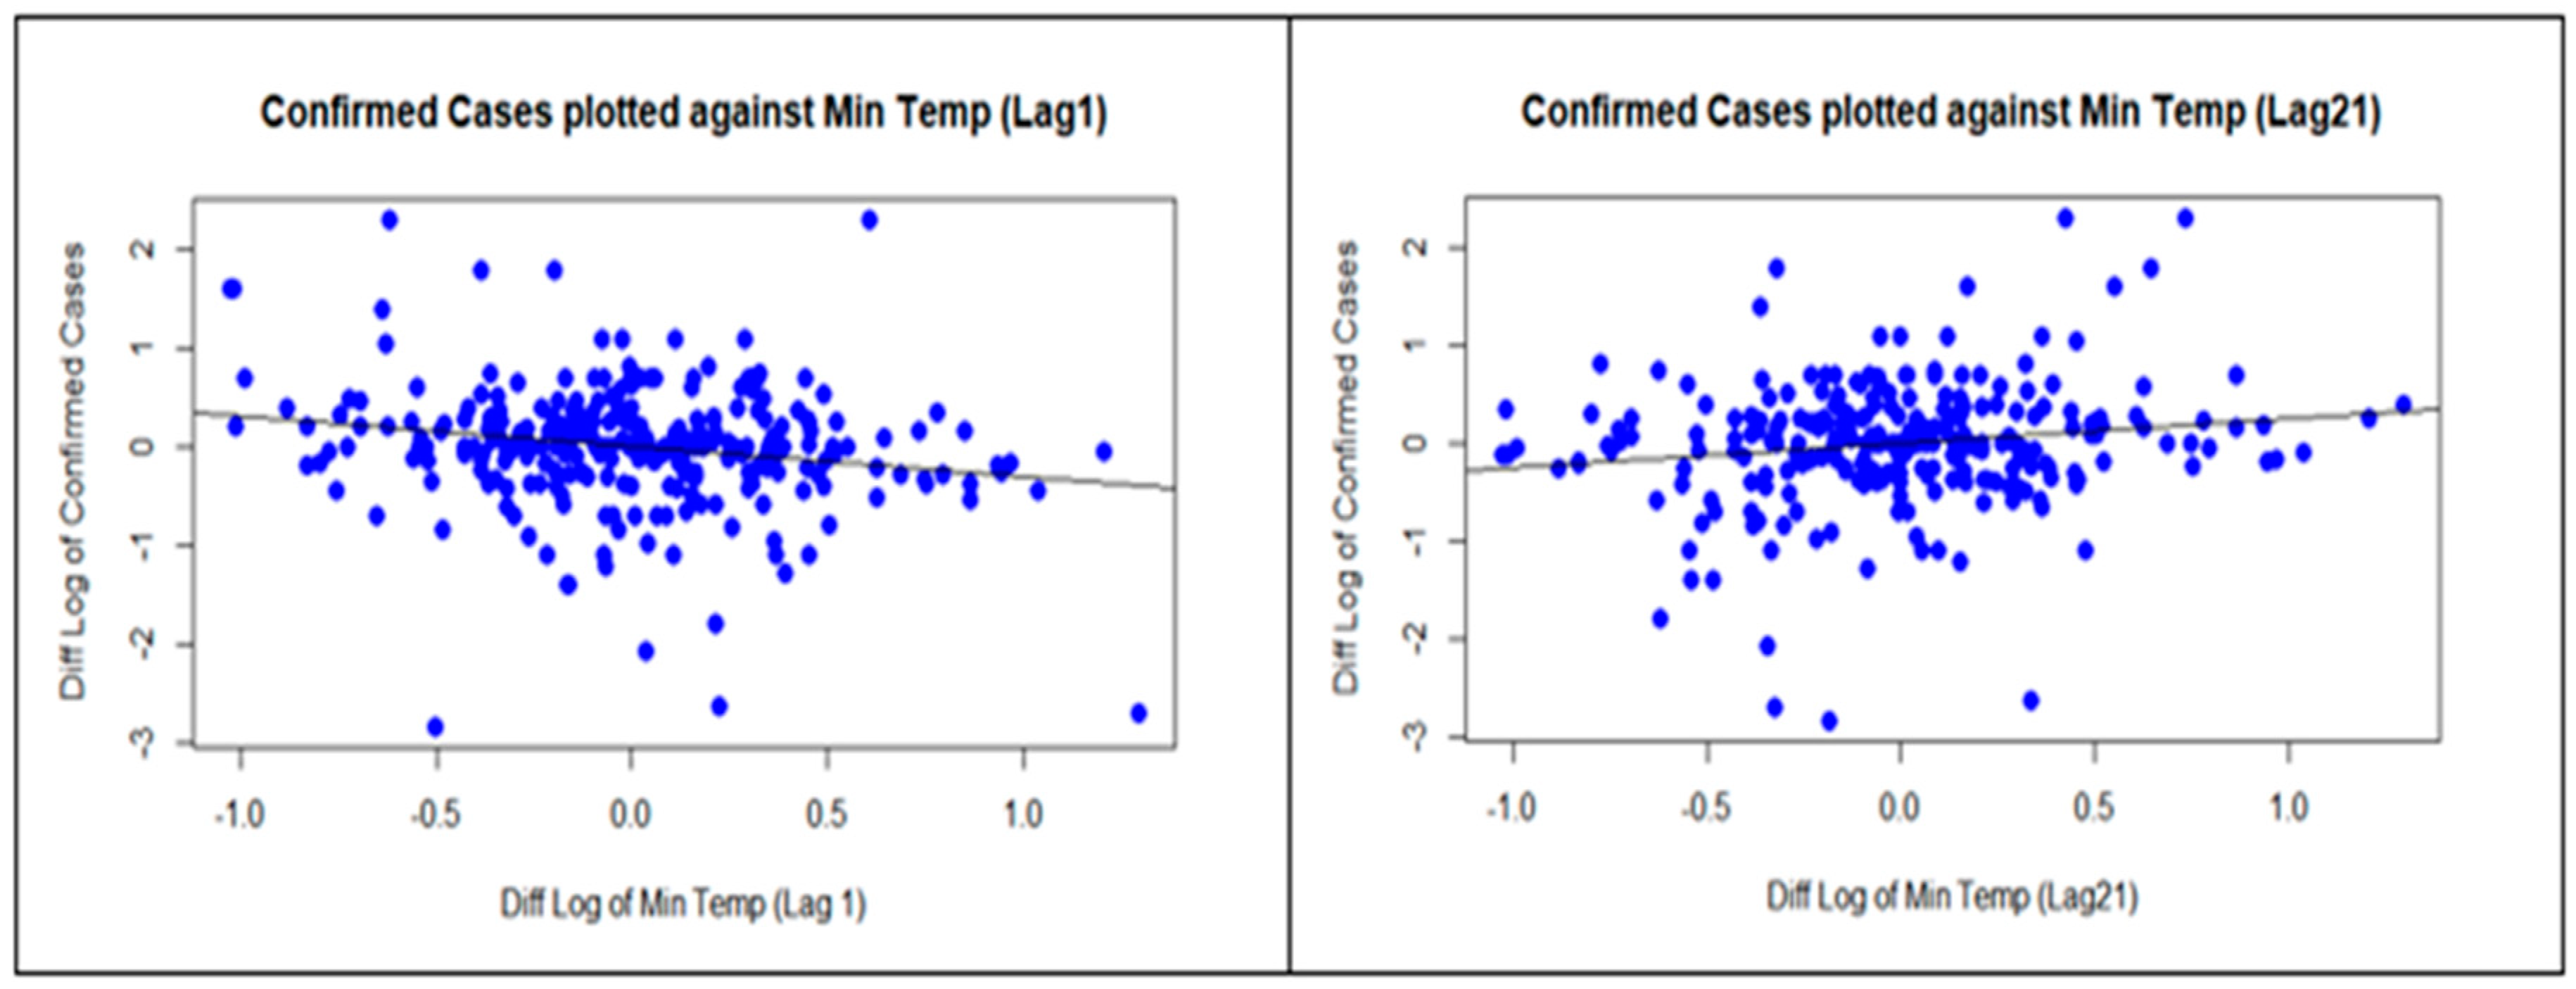
3.4. Regression on Significant Correlations
4. Discussion
5. Conclusions
Author Contributions
Funding
Institutional Review Board Statement
Informed Consent Statement
Acknowledgments
Conflicts of Interest
References
- Health Australia. Department of Health, Australian Government. Available online: www.health.gov.au (accessed on 12 January 2021).
- Roussel, M.; Pontier, D.; Cohen, J.-M.; Lina, B.; Fouchet, D. Quantifying the role of weather on seasonal influenza. BMC Public Health 2016, 16, 441. [Google Scholar] [CrossRef]
- Ianevski, A.; Zusinaite, E.; Shtaida, N.; Kallio-Kokko, H.; Valkonen, M.; Kantele, A.; Telling, K.; Lutsar, I.; Letjuka, P.; Metelitsa, N.; et al. Low temperature and low UV indexes correlated with peaks of influenza virus activity in Northern Europe during 2010–2018. Viruses 2019, 11, 207. [Google Scholar] [CrossRef] [PubMed]
- Quilodran, C.S.; Currat, M.; Montoya-Burgos, J.I. Climatic factors influence COVID-19 outbreak as revealed by worldwide mortality. MedRxiv 2020. [Google Scholar] [CrossRef]
- Dbouk, T.; Drikakis, D. Weather impact on airborne coronavirus survival. Phys. Fluids 2020, 32, 093312. [Google Scholar] [CrossRef] [PubMed]
- Ramírez, I.J.; Lee, J. Ecosyndemic vulnerability: Implications for El Niño-sensitive countries in Latin America. Int. J. Disaster Risk Sci. 2021, 12, 147–156. [Google Scholar] [CrossRef]
- Moozhipurath, R.K. Role of Weather Factors in COVID-19 Death Growth Rates in Tropical Climate: A Data-Driven Study Focused on Brazil. MedRXiv 2020. [Google Scholar] [CrossRef]
- Takagi, H.; Kuno, T.; Yokoyama, Y.; Ueyama, H.; Matsushiro, T.; Hari, Y.; Ando, T. The higher temperature and ultraviolet, the lower COVID-19 prevalence–meta-regression of data from large US cities. Am. J. Infect. Control 2020, 48, 1281–1285. [Google Scholar] [CrossRef]
- Rhodes, J.; Dunstan, F.; Laird, E.; Subramanian, S.; Kenny, R.A. COVID-19 mortality increases with northerly latitude after adjustment for age suggesting a link with ultraviolet and vitamin D. BMJ Nutr. Prev. Health 2020, 3, 118–120. [Google Scholar] [CrossRef]
- Islam, N.; Bukhari, Q.; Jameel, Y.; Shabnam, S.; Erzurumluoglu, A.; Siddique, M.A.; Massaro, J.M.; D’Agostino, R.B. COVID-19 and climatic factors: A global analysis. Environ. Res. 2021, 193, 110355. [Google Scholar] [CrossRef]
- Yao, Y.; Pan, J.; Liu, Z.; Meng, X.; Wang, W.; Kan, H.; Wang, W. No association of COVID-19 transmission with temperature or UV radiation in Chinese cities. Eur. Respir. J. 2020, 55, 2000517. [Google Scholar] [CrossRef]
- Blumthaler, M. UV monitoring for public health. Int. J. Environ. Res. Public Health 2018, 15, 1723. [Google Scholar] [CrossRef]
- Casini, B.; Tuvo, B.; Cristina, M.L.; Spagnolo, A.M.; Totaro, M.; Baggiani, A.; Privitera, G.P. Evaluation of an ultraviolet C (UVC) light-emitting device for disinfection of high touch surfaces in hospital critical areas. Int. J. Environ. Res. Public Health 2019, 16, 3572. [Google Scholar] [CrossRef] [PubMed]
- Hanel, A.; Carlberg, C. Skin colour and vitamin D: An update. Exp. Dermatol. 2020, 29, 864–875. [Google Scholar] [CrossRef] [PubMed]
- Hart, P.H.; Gorman, S.; Finlay-Jones, J.J. Modulation of the immune system by UV radiation: More than just the effects of vitamin D? Nat. Rev. Immunol. 2011, 11, 584–596. [Google Scholar] [CrossRef] [PubMed]
- Han, Y.; Lam, J.C.; Li, V.O.; Guo, P.; Zhang, Q.; Wang, A.; Downey, J. The effects of outdoor air pollution concentrations and lockdowns on COVID-19 infections in Wuhan and other provincial capitals in China. Preprints 2020. [Google Scholar] [CrossRef]
- Arunachalam, P.S.; Wimmers, F.; Mok, C.K.P.; Perera, R.A.P.M.; Scott, M.; Hagan, T.; Sigal, N.; Feng, Y.; Bristow, L.; Tsang, O.T.-Y.; et al. Systems biological assessment of immunity to mild versus severe COVID-19 infection in humans. Science 2020, 369, 1210–1220. [Google Scholar] [CrossRef]
- Fang, X.; Li, S.; Yu, H.; Wang, P.; Zhang, Y.; Chen, Z.; Li, Y.; Cheng, L.; Li, W.; Jia, H.; et al. Epidemiological, comorbidity factors with severity and prognosis of COVID-19: A systematic review and meta-analysis. Aging 2020, 12, 12493–12503. [Google Scholar] [CrossRef]
- WHO. Rational Use of Personal Protective Equipment for COVID-19 and Considerations during Severe Shortages: Interim Guidance, 23 December 2020 (No. WHO/2019-nCoV/IPC_PPE_use/2020.4); World Health Organization: Geneva, Switzerland, 2020. [Google Scholar]
- Gupta, S.; Raghuwanshi, G.S.; Chanda, A. Effect of weather on COVID-19 spread in the US: A prediction model for India in 2020. Sci. Total Environ. 2020, 728, 138860. [Google Scholar] [CrossRef]
- Şahin, M. Impact of weather on COVID-19 pandemic in Turkey. Sci. Total Environ. 2020, 728, 138810. [Google Scholar] [CrossRef]
- Tosepu, R.; Gunawan, J.; Effendy, D.S.; Lestari, H.; Bahar, H.; Asfian, P. Correlation between weather and COVID-19 pandemic in Jakarta, Indonesia. Sci. Total Environ. 2020, 725, 138436. [Google Scholar] [CrossRef] [PubMed]
- Department of Health. State Government of Victoria, Australia. Available online: www.vic.gov.au (accessed on 26 June 2021).
- BOM. Bureau of Meteorology, Australian Government. Available online: http://www.bom.gov.au/climate/data/?ref=ftr (accessed on 20 December 2020).
- Chatfield, C.; Xing, H. The Analysis of Time Series: An Introduction with R, 7th ed.; Chapman & Hall, CRC Press: Boca Raton, FL, USA, 2019. [Google Scholar]
- Douglas, E.; Vogel, R.; Kroll, C. Trends in floods and low flows in the United States: Impact of spatial correlation. J. Hydrol. 2000, 240, 90–105. [Google Scholar] [CrossRef]
- Briet, O.J.; Vounatsou, P.; Gunawardena, D.M.; Galappaththy, G.N.; Amerasinghe, P.H. Temporal correlation between malaria and rainfall in Sri Lanka. Malar. J. 2008, 7, 77. [Google Scholar] [CrossRef] [PubMed]
- Probst, W.N.; Stelzenmüller, V.; Fock, H.O. Using cross-correlations to assess the relationship between time-lagged pressure and state indicators: An exemplary analysis of North Sea fish population indicators. ICES J. Mar. Sci. 2012, 69, 670–681. [Google Scholar] [CrossRef]
- Dean, R.T.; Dunsmuir, W.T.M. Dangers and uses of Cross-Correlation in analyzing time series in perception, performance, movement, and neuroscience: The importance of constructing transfer function autoregressive models. Behav. Res. Methods 2015, 48, 783–802. [Google Scholar] [CrossRef]
- Earnest, A.; Chen, M.I.; Ng, D.; Sin, L.Y. Using autoregressive integrated moving average (ARIMA) models to predict and monitor the number of beds occupied during a SARS outbreak in a tertiary hospital in Singapore. BMC Health Serv. Res. 2005, 5, 36. [Google Scholar] [CrossRef] [PubMed]
- Chen, T.; Leng, K.; Lu, Y.; Wen, L.; Qi, Y.; Gao, W.; Chen, H.; Bai, L.; An, X.; Sun, B.; et al. Epidemiological features and time-series analysis of influenza incidence in urban and rural areas of Shenyang, China, 2010–2018. Epidem. Infect. 2020, 148, e29. [Google Scholar] [CrossRef] [PubMed]
- Lee, D.; Kim, Y.; Koh, Y.; Song, K.; Chang, I. Forecasting COVID-19 confirmed cases using empirical data analysis in Korea. Healthcare 2021, 9, 254. [Google Scholar] [CrossRef]
- Akaike, H. Information theory and an extension of the maximum likelihood principle. In Second International Symposium on Information Theory; Kotz, S., Johnson, N.L., Eds.; Academia Kiado: Budapest, Hungary, 1973; pp. 267–281. [Google Scholar]
- Casanova, L.M.; Jeon, S.; Rutala, W.A.; Weber, D.J.; Sobsey, M.D. Effects of air temperature and relative humidity on coronavirus survival on surfaces. Appl. Environ. Microbiol. 2010, 76, 2712–2717. [Google Scholar] [CrossRef]
- Chan, K.H.; Peiris, J.S.M.; Lam, S.Y.; Poon, L.L.M.; Yuen, K.-Y.; Seto, W.H. The effects of temperature and relative humidity on the viability of the SARS coronavirus. Adv. Virol. 2011, 2011, 734690. [Google Scholar] [CrossRef]
- Rehman, A.; Ashraf, F.; Javed, Z.; Hussain, M.; Farooq, T.H.; Shakoor, A.; Shahzad, S.M. The nexus between meteorological parameters and COVID-19 pandemic: Case of Islamabad, Pakistan. Environ. Sustain. 2020, 1–5. [Google Scholar] [CrossRef]
- Arumugam, M.; Menon, B.; Narayan, S.K. Ambient temperature and COVID-19 incidence rates: An opportunity for intervention? 2020. Available online: https://ojs.wpro.who.int/ojs/public/journals/1/covid19/wpsar.2020.11.5.012Arumugam.pdf (accessed on 20 March 2021).
- Caspi, G.; Shalit, U.; Kristensen, S.L.; Aronson, D.; Caspi, L.; Rossenberg, O.; Caspi, O. Climate effect on COVID-19 spread rate: An online surveillance tool. medRxiv 2020. [Google Scholar] [CrossRef]
- Wang, J.; Tang, K.; Feng, K.; Lv, W. High temperature and high humidity reduce the transmission of COVID-19. arXiv preprint 2020, arXiv:2003.05003v5. [Google Scholar] [CrossRef]
- Kubota, Y.; Shiono, T.; Kusumoto, B.; Fujinuma, J. Multiple drivers of the COVID-19 spread: The roles of climate, international mobility, and region-specific conditions. PLoS ONE 2020, 15, e0239385. [Google Scholar] [CrossRef] [PubMed]
- Asyary, A.; Veruswati, M. Sunlight exposure increased Covid-19 recovery rates: A study in the central pandemic area of Indonesia. Sci. Total. Environ. 2020, 729, 139016. [Google Scholar] [CrossRef] [PubMed]
- Cannell, J.J.; Vieth, R.; Umhau, J.C.; Holick, M.F.; Grant, W.B.; Madronich, S.; Garland, C.F.; Giovannucci, E. Epidemic influenza and vitamin D. Epidemiol. Infect. 2006, 134, 1129–1140. [Google Scholar] [CrossRef] [PubMed]
- Bergman, P. The link between vitamin D and COVID-19: Distinguishing facts from fiction. J. Intern. Med. 2021, 289, 131–133. [Google Scholar] [CrossRef]
- Grant, W.B.; Lahore, H.; McDonnell, S.L.; Baggerly, C.A.; French, C.B.; Aliano, J.L.; Bhattoa, H.P. Evidence that vitamin D supplementation could reduce risk of influenza and COVID-19 infections and deaths. Nutrients 2020, 12, 988. [Google Scholar] [CrossRef] [PubMed]
- Maghbooli, Z.; Sahraian, M.A.; Ebrahimi, M.; Pazoki, M.; Kafan, S.; Tabriz, H.M.; Hadadi, A.; Montazeri, M.; Nasiri, M.; Shirvani, A.; et al. Vitamin D sufficiency, a serum 25-hydroxyvitamin D at least 30 ng/mL reduced risk for adverse clinical outcomes in patients with COVID-19 infection. PLoS ONE 2020, 15, e0239799. [Google Scholar] [CrossRef]
- Cohen, J. Sick time. Science 2020, 367, 1294–1297. [Google Scholar] [CrossRef]
- Rosario, D.K.A.; Mutz, Y.S.; Bernardes, P.C.; Conte-Junior, C.A. Relationship between COVID-19 and weather: Case study in a tropical country. Int. J. Hyg. Environ. Health 2020, 229, 113587. [Google Scholar] [CrossRef]
- Moriyama, M.; Hugentobler, W.J.; Iwasaki, A. Seasonality of respiratory viral infections. Annu. Rev. Virol. 2020, 7, 83–101. [Google Scholar] [CrossRef] [PubMed]
- Abraham, J.; Dowling, K.; Florentine, S. Can Optimum Solar Radiation Exposure or Supplemented Vitamin D Intake Reduce the Severity of COVID-19 Symptoms? Int. J. Environ. Res. Public Health 2021, 18, 740. [Google Scholar] [CrossRef] [PubMed]
- Bilezikian, J.P.; Bikle, D.; Hewison, M.; Lazaretti-Castro, M.; Formenti, A.M.; Gupta, A.; Madhavan, M.V.; Nair, N.; Babalyan, V.; Hutchings, N.; et al. Mechanisms in endocrinology: Vitamin D and COVID-19. Eur. J. Endocrinol. 2020, 183, R133–R147. [Google Scholar] [CrossRef]
- Ratnesar-Shumate, S.; Williams, G.; Green, B.; Krause, M.; Holland, B.; Wood, S.; Bohannon, J.; Boydston, J.; Freeburger, D.; Hooper, I.; et al. Simulated sunlight rapidly inactivates SARS-CoV-2 on surfaces. J. Infect. Dis. 2020, 222, 214–222. [Google Scholar] [CrossRef] [PubMed]


| Variables | Mean | SD | Min | Max |
|---|---|---|---|---|
| Confirmed cases | 72.39 | 128.25 | 0 | 687 |
| Solar exposure (MJ/m2) | 12.16 | 5.88 | 2.1 | 30.1 |
| Maximum UVI | 4.64 | 2.71 | 0.3 | 10.8 |
| Average UVI | 0.89 | 0.64 | 0.40 | 3.03 |
| Maximum Temperature (°C) | 18.16 | 5.46 | 14.3 | 43.6 |
| Minimum Temperature (°C) | 8.75 | 4.12 | 0.2 | 23.0 |
| Rainfall (mm) | 1.91 | 5.96 | 0 | 69 |
| Meteorological Variable | Original Time Series | Stationary Time Series | ||
|---|---|---|---|---|
| Pearson | Spearman | Pearson | Spearman | |
| Solar Exposure (MJ/m2) | −0.265 (<0.001) | −0.349 (<0.001) | −0.139 (0.020) | −0.131 (0.028) |
| Max UVI | −0.374 (<0.001) | −0.472 (<0.001) | −0.131 (0.029) | −0.172 (0.004) |
| Average UVI | −0.357 (<0.001) | −0.506 (<0.001) | −0.104 (0.082) | −0.082 (0.170) |
| Max Temp (°C) | −0.379 (<0.001) | −0.490 (<0.001) | 0.076 (0.203) | 0.056 (0.355) |
| Min Temp (°C) | −0.388 (<0.001) | −0.464 (<0.001) | 0.112 (0.062) | 0.032 (0.595) |
| Rainfall (mm) | −0.062 (0.299) | −0.010 (0.861) | −0.071 (0.238) | −0.126 (0.035) |
| ar1 | ar2 | ma1 | ma2 | |
|---|---|---|---|---|
| Coefficient | 0.717 | −0.199 | −1.339 | 0.646 |
| SE | 0.159 | 0.089 | 0.144 | 0.094 |
| p-value | <0.001 | 0.024 | <0.001 | <0.001 |
| AIC | 447.49 |
| Meteorological Parameters | Sig. Lags from CCF | Correlation of Sig. Lags | p-Value of Sig. Lags |
|---|---|---|---|
| Solar exposure (MJ/m2) | 1 | 0.205 | <0.001 |
| 5 | −0.155 | 0.010 | |
| 19 | 0.166 | 0.007 | |
| Max UV | 5 | −0.126 | 0.038 |
| 19 | 0.267 | <0.001 | |
| Average UV | 1 | 0.158 | 0.008 |
| 5 | −0.165 | 0.006 | |
| 10 | 0.139 | 0.023 | |
| 19 | 0.141 | 0.023 | |
| Max Temp (°C) | Nil | ||
| Min Temp (°C) | 1 | −0.119 | 0.046 |
| 21 | 0.162 | 0.009 | |
| Rainfall (mm) | Nil |
| Meteorological Parameters | Sig. Lags from Regr | Regr Coeff | 95% CI | p-Value | R-sq |
|---|---|---|---|---|---|
| Solar exposure (MJ/m2) | 1 | 0.320 | 0.138, 0.502 | <0.001 | 10.9% |
| 5 | −0.269 | −0.457, −0.081 | 0.004 | ||
| 19 | 0.313 | 0.133, 0.505 | <0.001 | ||
| Max Temp (°C) | Nil | ||||
| Min Temp(°C) | 1 | −0.303 | −0.493, −0.113 | 0.002 | 6.3% |
| 21 | 0.238 | 0.044, 0.432 | 0.015 | ||
| Rainfall (mm) | Nil | ||||
| Max UV | 5 | −0.258 | −0.512, 0.004 | 0.044 | 10.7% |
| 19 | 0.706 | 0.434, 0.978 | <0.001 | ||
| Average UV | 1 | 0.468 | 0.042, 0.894 | 0.029 | 7.1% |
| 5 | −0.531 | −0.957, −0.105 | 0.013 | ||
| 19 | 0.631 | 0.201, 1.61 | 0.004 |
Publisher’s Note: MDPI stays neutral with regard to jurisdictional claims in published maps and institutional affiliations. |
© 2021 by the authors. Licensee MDPI, Basel, Switzerland. This article is an open access article distributed under the terms and conditions of the Creative Commons Attribution (CC BY) license (https://creativecommons.org/licenses/by/4.0/).
Share and Cite
Abraham, J.; Turville, C.; Dowling, K.; Florentine, S. Does Climate Play Any Role in COVID-19 Spreading?—An Australian Perspective. Int. J. Environ. Res. Public Health 2021, 18, 9086. https://doi.org/10.3390/ijerph18179086
Abraham J, Turville C, Dowling K, Florentine S. Does Climate Play Any Role in COVID-19 Spreading?—An Australian Perspective. International Journal of Environmental Research and Public Health. 2021; 18(17):9086. https://doi.org/10.3390/ijerph18179086
Chicago/Turabian StyleAbraham, Joji, Christopher Turville, Kim Dowling, and Singarayer Florentine. 2021. "Does Climate Play Any Role in COVID-19 Spreading?—An Australian Perspective" International Journal of Environmental Research and Public Health 18, no. 17: 9086. https://doi.org/10.3390/ijerph18179086
APA StyleAbraham, J., Turville, C., Dowling, K., & Florentine, S. (2021). Does Climate Play Any Role in COVID-19 Spreading?—An Australian Perspective. International Journal of Environmental Research and Public Health, 18(17), 9086. https://doi.org/10.3390/ijerph18179086