
Relationship between Green and Blue Spaces with Mental and Physical Health: A Systematic Review of Longitudinal Observational Studies


Abstract
:1. Introduction
- 1.
- Assess whether a significant relationship between exposures and outcomes exists.
- 2.
- Identify the type of environmental exposures, type of health conditions and behaviours studied together in longitudinal relationships.
- 3.
- Determine whether multimorbidity as a concept is studied in relation to different green/blue space exposures.
2. Materials and Methods
2.1. Selection Criteria
2.2. Data Extraction
2.3. Quality Appraisal
3. Results
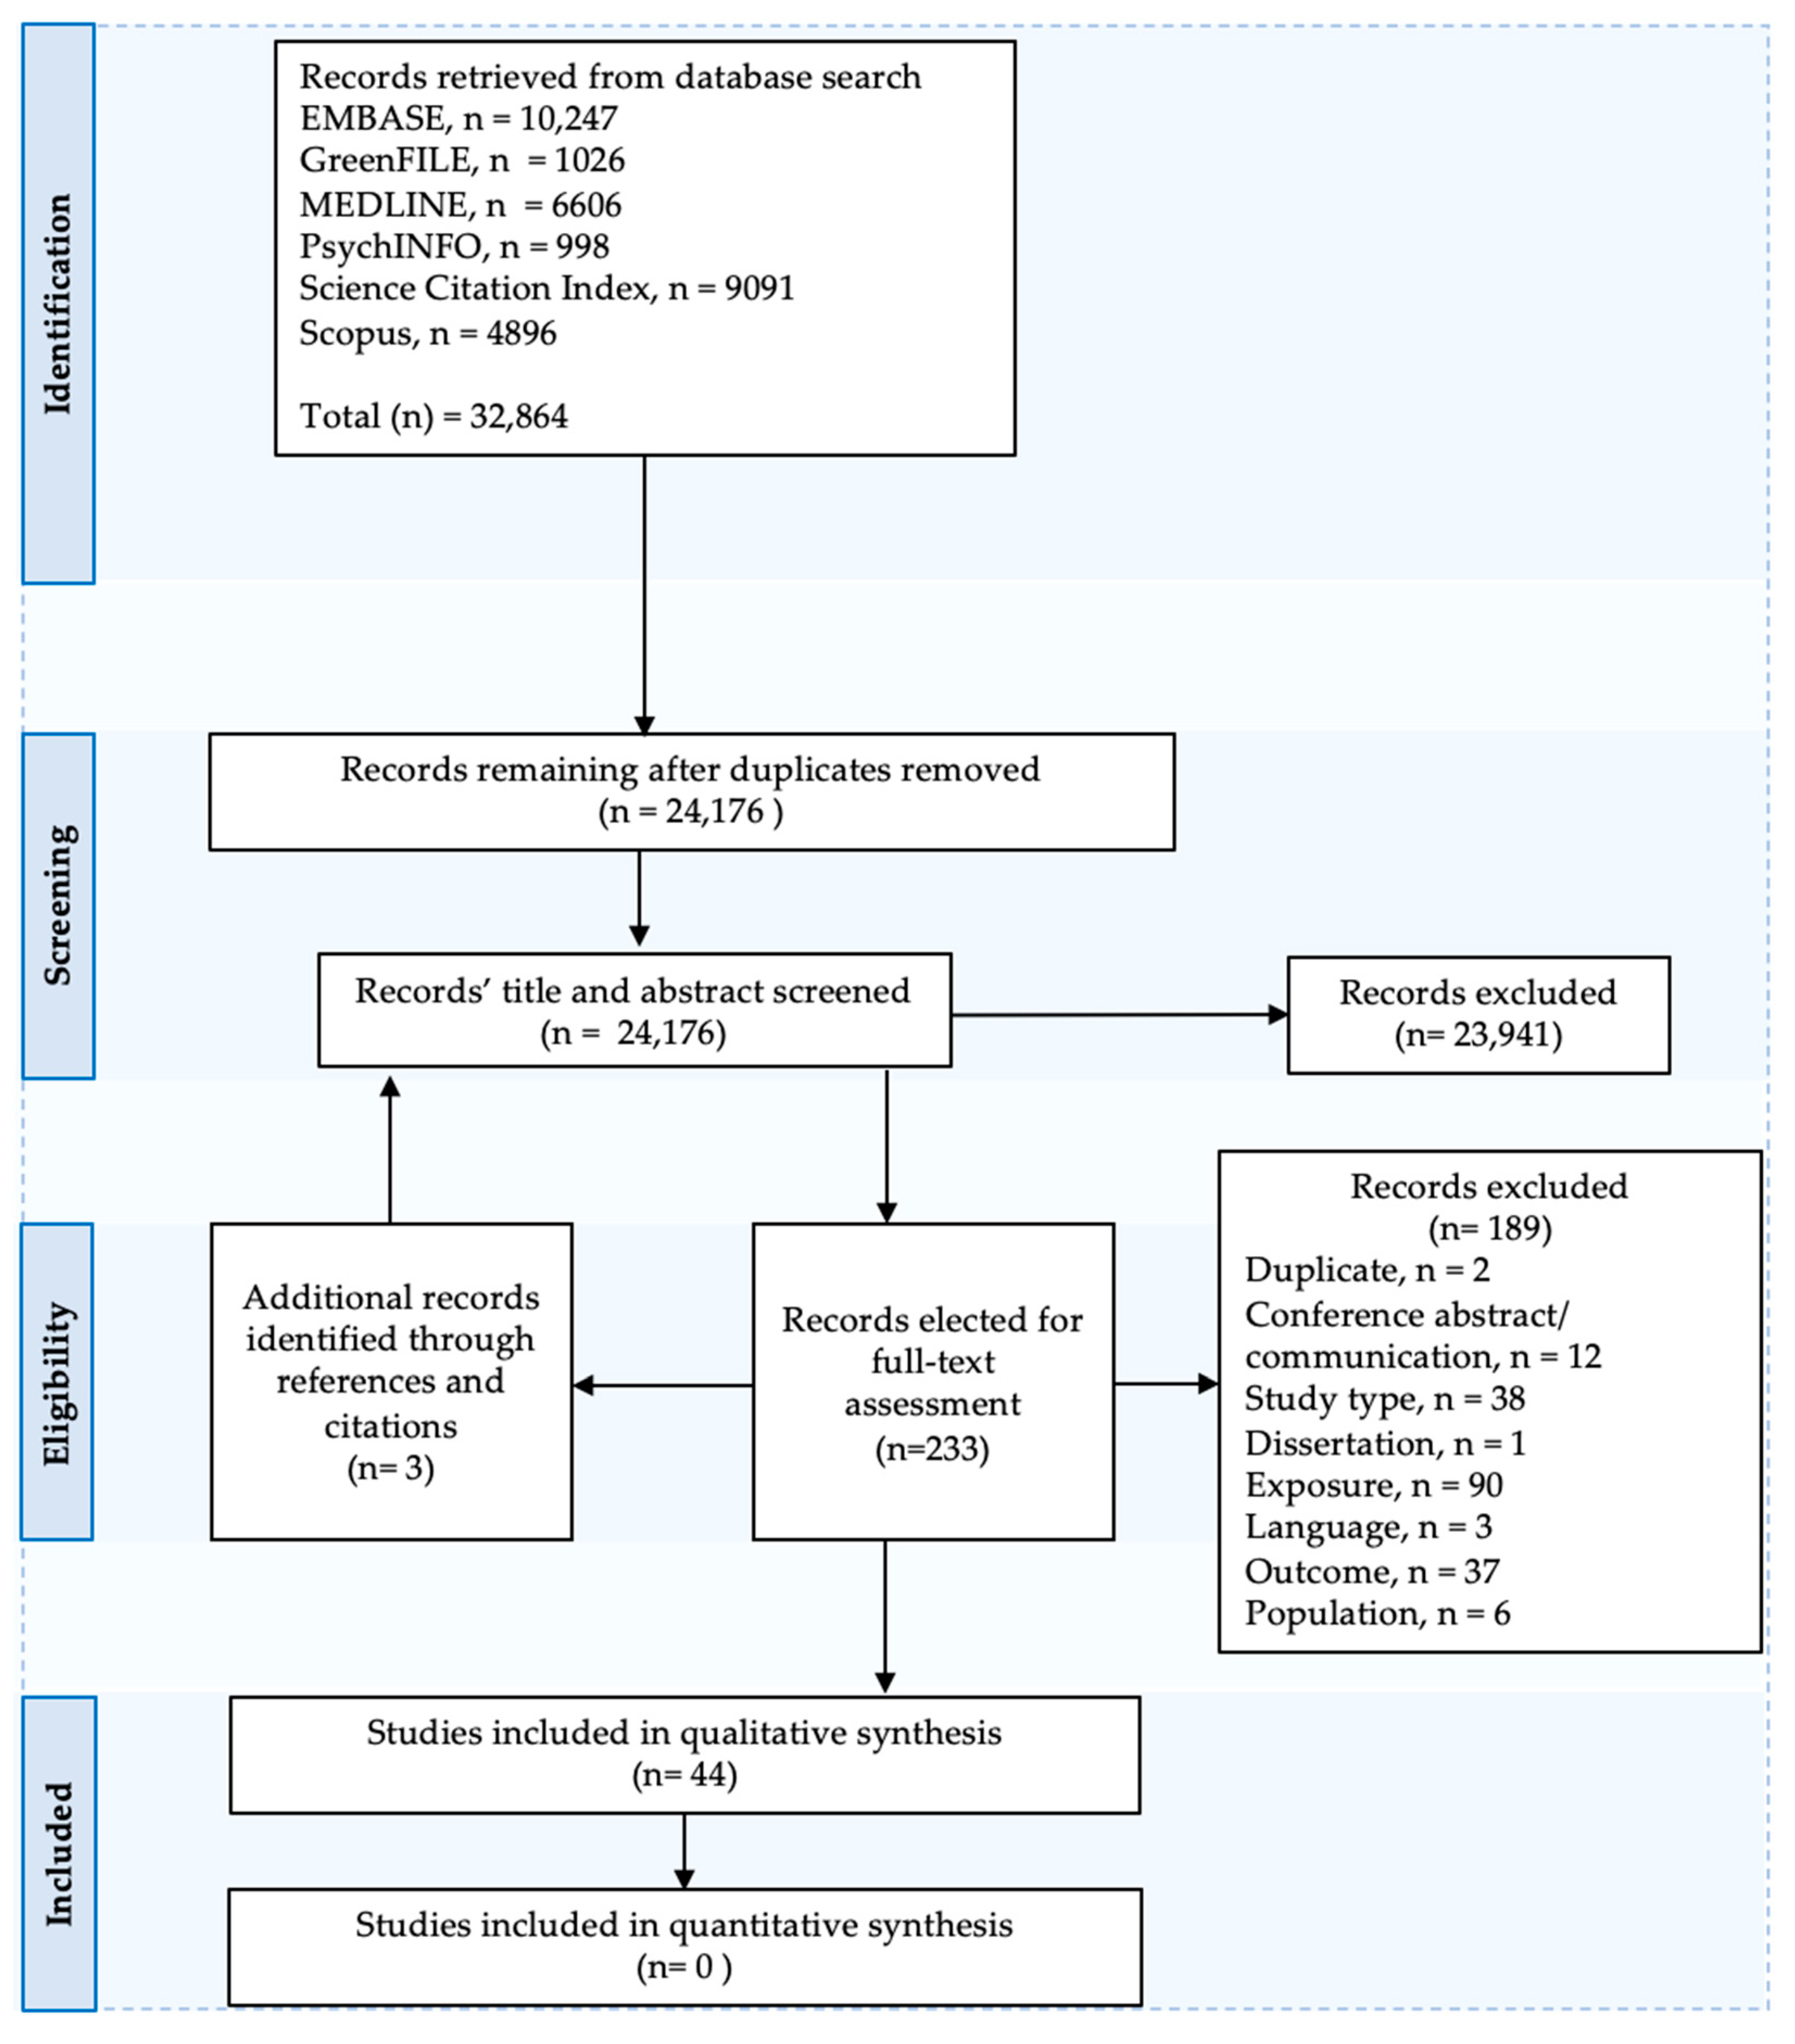
3.1. Overview
3.2. Quality Assessment
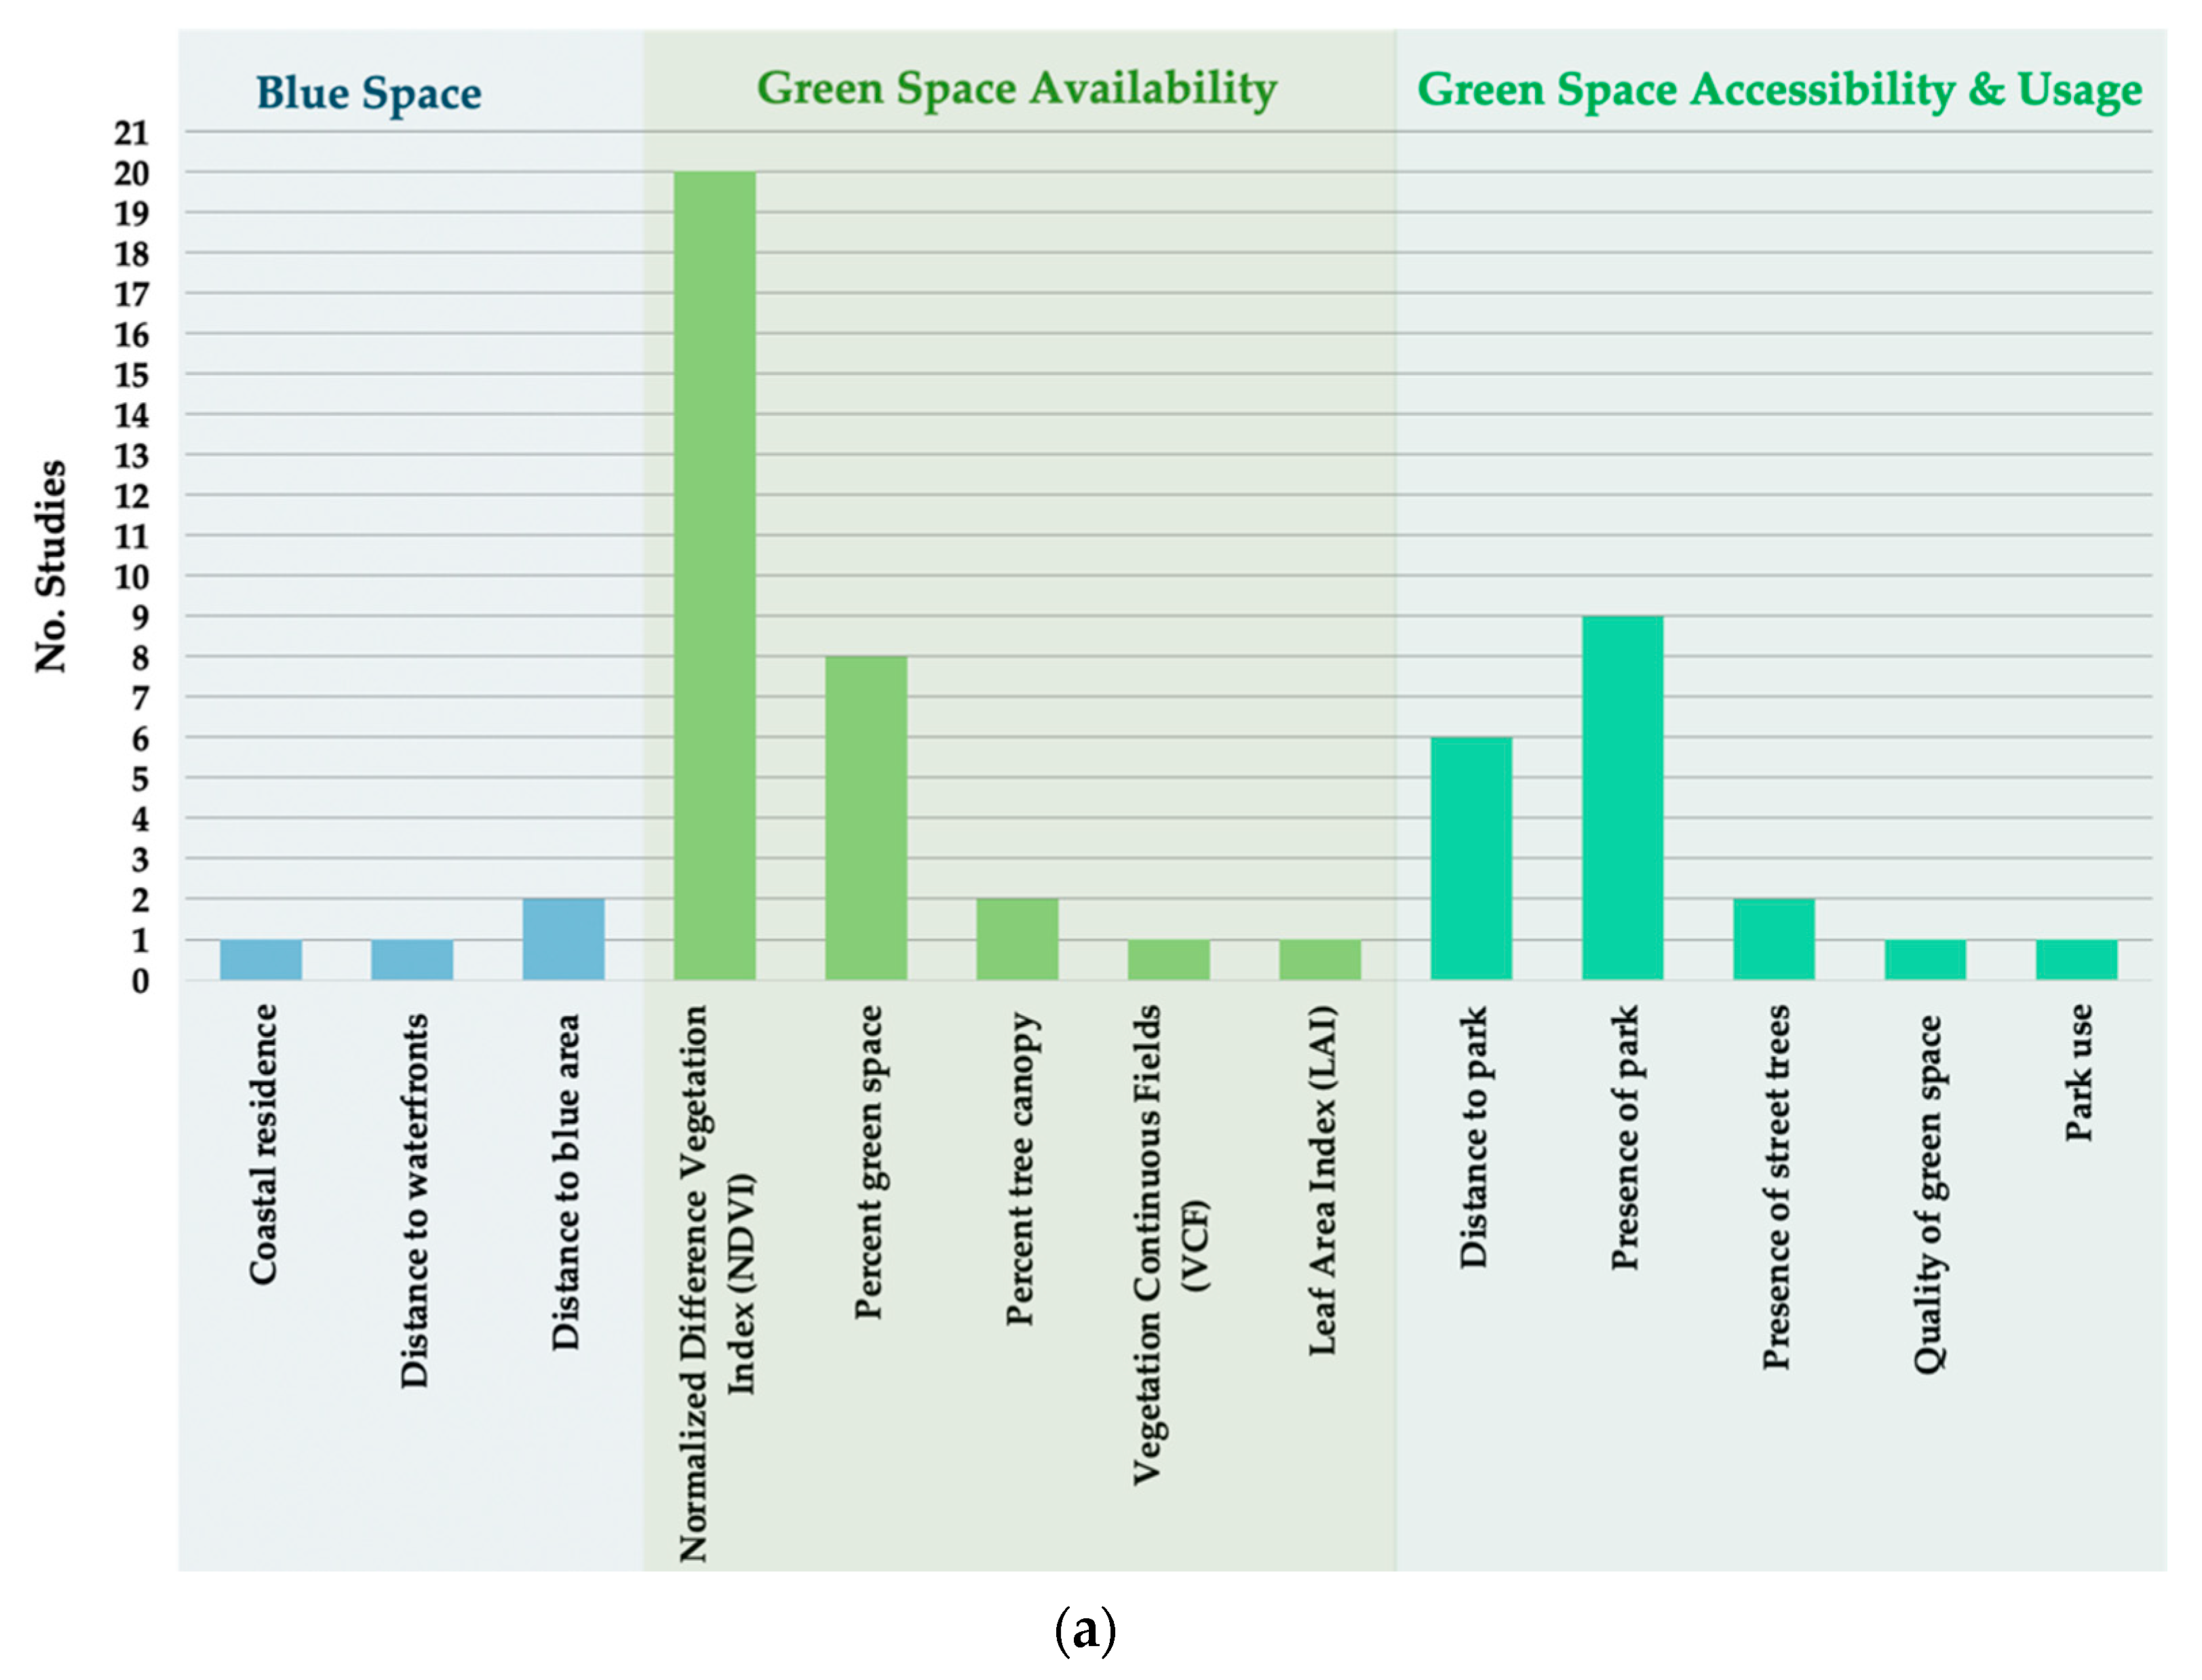
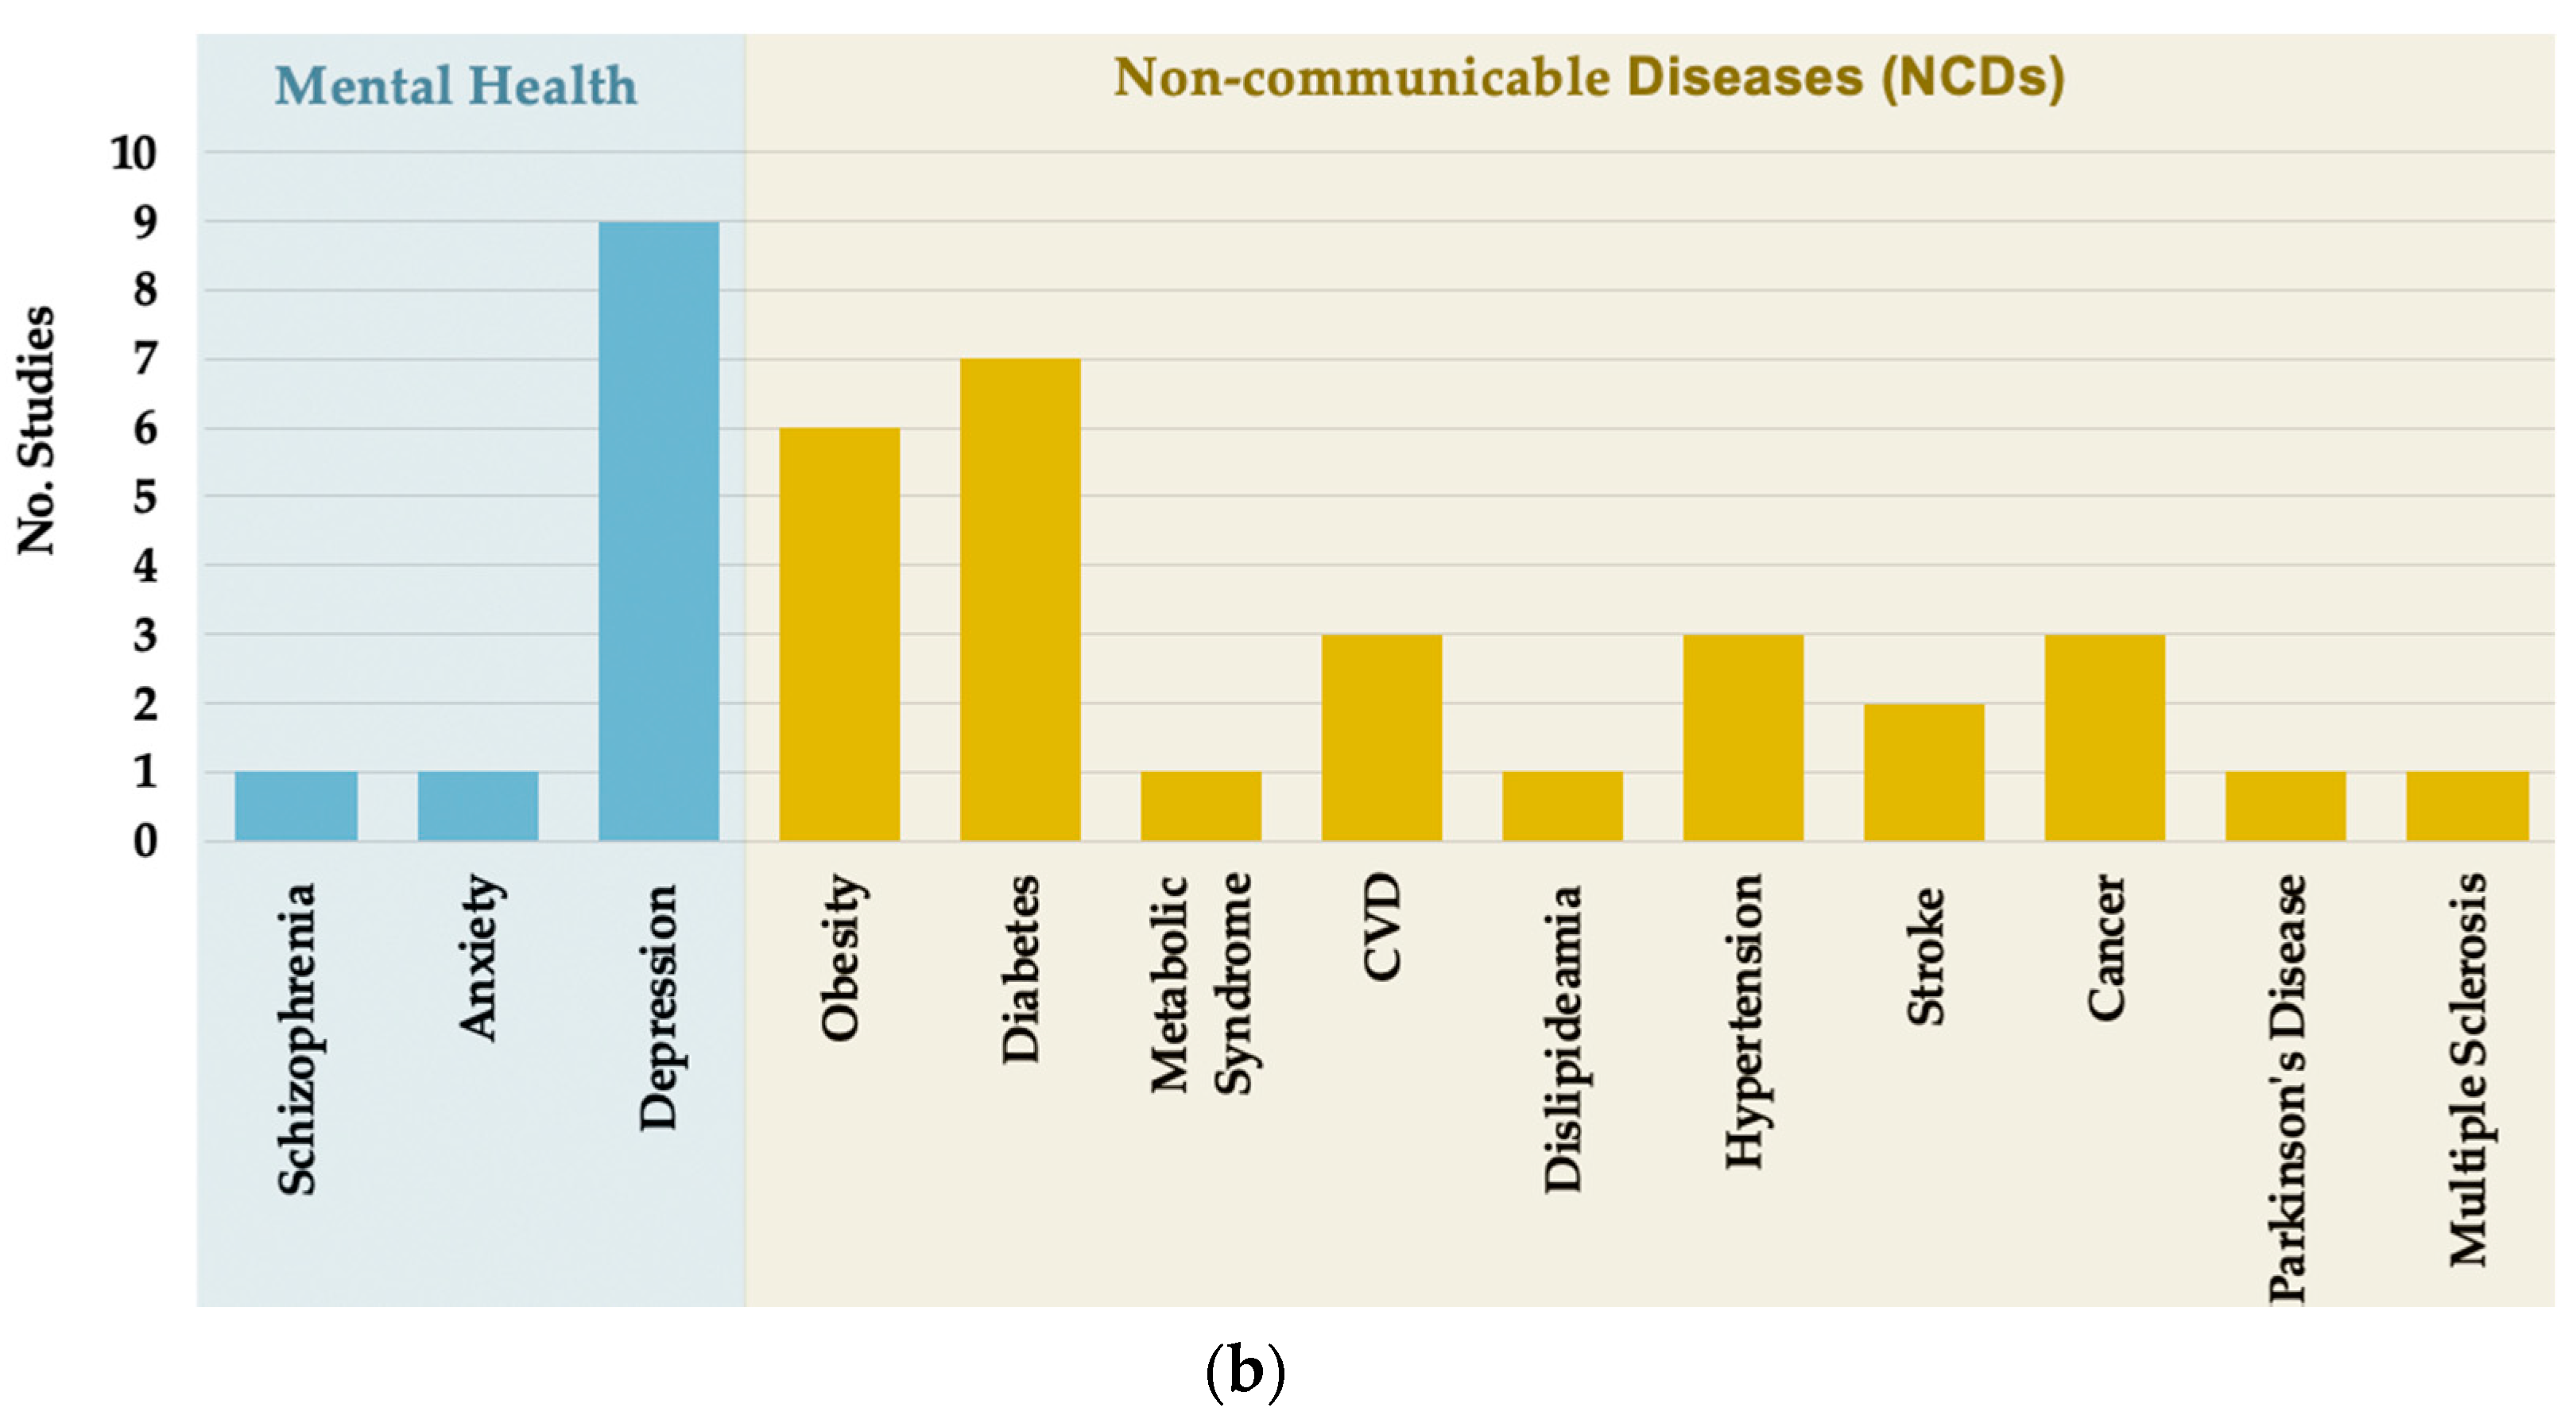
3.3. Exposures and Outcomes
3.4. Relationship between Exposure to Green and Blue Space and Mental and Physical Health
3.5. Relationship between Green Space and Physical Activity
3.6. Multimorbidity
4. Discussion
4.1. Relationship between the Natural Environment and Health
4.2. Strengths and Limitations
4.3. Review Implications
5. Conclusions
Supplementary Materials
Author Contributions
Funding
Institutional Review Board Statement
Informed Consent Statement
Data Availability Statement
Acknowledgments
Conflicts of Interest
References
- World Health Organization. Global Status Report on Noncommunicable Diseases 2014; World Health Organization: Geneva, Switzerland, 2014. [Google Scholar]
- Coates, M.M.; Kintu, A.; Gupta, N.; Wroe, E.B.; Adler, A.J.; Kwan, G.F.; Park, P.H.; Rajbhandari, R.; Byrne, A.L.; Casey, D.C.; et al. Burden of non-communicable diseases from infectious causes in 2017: A modelling study. Lancet Glob. Health 2020, 8, e1489–e1498. [Google Scholar] [CrossRef]
- Kim, H.C.; Oh, S.M. Noncommunicable diseases: Current status of major modifiable risk factors in Korea. J. Prev. Med. Public Health 2013, 46, 165. [Google Scholar] [CrossRef] [PubMed]
- Stein, D.J.; Benjet, C.; Gureje, O.; Lund, C.; Scott, K.M.; Poznyak, V.; van Ommeren, M. Integrating mental health with other non-communicable diseases. BMJ 2019, 28, 364. [Google Scholar] [CrossRef] [Green Version]
- Prince, M.; Patel, V.; Saxena, S.; Maj, M.; Maselko, J.; Phillips, M.R.; Rahman, A. No health without mental health. Lancet 2007, 370, 859–877. [Google Scholar] [CrossRef]
- Steinmo, S.; Hagger-Johnson, G.; Shahab, L. Bidirectional association between mental health and physical activity in older adults: Whitehall II prospective cohort study. Prev. Med. 2014, 66, 74–79. [Google Scholar] [CrossRef] [PubMed] [Green Version]
- Cohen, B.E.; Edmondson, D.; Kronish, I.M. State of the art review: Depression, stress, anxiety, and cardiovascular disease. Am. J. Hypertens. 2015, 28, 1295–1302. [Google Scholar] [CrossRef] [PubMed] [Green Version]
- Caruso, R.; GiuliaNanni, M.; Riba, M.B.; Sabato, S.; Grassi, L. Depressive spectrum disorders in cancer: Diagnostic issues and intervention. A critical review. Curr. Psychiatry Rep. 2017, 19, 1–10. [Google Scholar] [CrossRef] [Green Version]
- Patel, V.; Chatterji, S. Integrating mental health in care for noncommunicable diseases: An imperative for person-centered care. Health Aff. 2015, 34, 1498–1505. [Google Scholar] [CrossRef] [Green Version]
- Saxena, S.; Maj, M. Physical health of people with severe mental disorders: Leave no one behind. World Psychiatry 2017, 16, 1. [Google Scholar] [CrossRef] [Green Version]
- Prüss-Ustün, A.; van Deventer, E.; Mudu, P.; Campbell-Lendrum, D.; Vickers, C.; Ivanov, I.; Forastiere, F.; Gumy, S.; Dora, C.; Adair-Rohani, H.; et al. Environmental risks and non-communicable diseases. BMJ 2019, 364, l265. [Google Scholar] [CrossRef] [Green Version]
- Brulle, R.J.; Pellow, D.N. Environmental justice: Human health and environmental inequalities. Annu. Rev. Public Health 2006, 27, 103–124. [Google Scholar] [CrossRef] [Green Version]
- McDougall, C.W.; Quilliam, R.S.; Hanley, N.; Oliver, D.M. Freshwater blue space and population health: An emerging research agenda. Sci. Total Environ. 2020, 737, 140196. [Google Scholar] [CrossRef] [PubMed]
- Alcock, I.; White, M.P.; Lovell, R.; Higgins, S.L.; Osborne, N.J.; Husk, K.; Wheeler, B.W. What accounts for ‘England's green and pleasant land’? A panel data analysis of mental health and land cover types in rural England. Landsc. Urban Plan. 2015, 142, 38–46. [Google Scholar] [CrossRef] [Green Version]
- Wolch, J.R.; Byrne, J.; Newell, J.P. Urban green space, public health, and environmental justice: The challenge of making cities ‘just green enough’. Landsc. Urban Plan. 2014, 125, 234–244. [Google Scholar] [CrossRef] [Green Version]
- Lee, A.C.; Maheswaran, R. The health benefits of urban green spaces: A review of the evidence. J. Public Health 2011, 33, 212–222. [Google Scholar] [CrossRef]
- Nieuwenhuijsen, M.J.; Khreis, H.; Triguero-Mas, M.; Gascon, M.; Dadvand, P. Fifty shades of green. Epidemiology 2017, 28, 63–71. [Google Scholar] [CrossRef]
- Maas, J.; Van Dillen, S.M.; Verheij, R.A.; Groenewegen, P.P. Social contacts as a possible mechanism behind the relation between green space and health. Health Place 2009, 15, 586–595. [Google Scholar] [CrossRef] [Green Version]
- Van den Berg, M.M.; van Poppel, M.; van Kamp, I.; Ruijsbroek, A.; Triguero-Mas, M.; Gidlow, C.; Nieuwenhuijsen, M.J.; Gražulevičiene, R.; van Mechelen, W.; Kruize, H.; et al. Do physical activity, social cohesion, and loneliness mediate the association between time spent visiting green space and mental health? Environ. Behav. 2019, 51, 144–166. [Google Scholar] [CrossRef]
- Markevych, I.; Schoierer, J.; Hartig, T.; Chudnovsky, A.; Hystad, P.; Dzhambov, A.M.; De Vries, S.; Triguero-Mas, M.; Brauer, M.; Nieuwenhuijsen, M.J.; et al. Exploring pathways linking greenspace to health: Theoretical and methodological guidance. Environ. Res. 2017, 158, 301–317. [Google Scholar] [CrossRef] [PubMed]
- de Vries, S.; Verheij, R.A.; Groenewegen, P.P.; Spreeuwenberg, P. Natural environments—healthy environments? An exploratory analysis of the relationship between greenspace and health. Environ. Plan. A 2003, 35, 1717–1731. [Google Scholar] [CrossRef] [Green Version]
- Garrett, J.; White, M.P.; Huang, J.; Ng, S.; Hui, Z.; Leung, C.; Tse, S.; Fung, F.; Elliott, L.R.; Depledge, M.H.; et al. The association between blue space exposure, health and wellbeing in Hong Kong. Health Place 2019, 55, 100–110. [Google Scholar] [CrossRef]
- Maas, J.; Verheij, R.A.; de Vries, S.; Spreeuwenberg, P.; Schellevis, F.G.; Groenewegen, P.P. Morbidity is related to a green living environment. J. Epidemiol. Community Health 2009, 63, 967–973. [Google Scholar] [CrossRef] [PubMed] [Green Version]
- Villeneuve, P.J.; Jerrett, M.; Su, J.G.; Burnett, R.T.; Chen, H.; Wheeler, A.J.; Goldberg, M.S. A cohort study relating urban green space with mortality in Ontario, Canada. Environ. Res. 2012, 115, 51–58. [Google Scholar] [CrossRef]
- Rojas-Rueda, D.; Nieuwenhuijsen, M.J.; Gascon, M.; Perez-Leon, D.; Mudu, P. Green spaces and mortality: A systematic review and meta-analysis of cohort studies. Lancet Planet. Health 2019, 3, e469–e477. [Google Scholar] [CrossRef] [Green Version]
- Seo, S.; Choi, S.; Kim, K.; Kim, S.M.; Park, S.M. Association between urban green space and the risk of cardiovascular disease: A longitudinal study in seven Korean metropolitan areas. Environ. Int. 2019, 125, 51–57. [Google Scholar] [CrossRef] [PubMed]
- Mukherjee, D.; Safraj, S.; Tayyab, M.; Shivashankar, R.; Patel, S.A.; Narayanan, G.; Ajay, V.S.; Ali, M.K.; Narayan, K.V.; Tandon, N.; et al. Park availability and major depression in individuals with chronic conditions: Is there an association in urban India? Health Place 2017, 47, 54–62. [Google Scholar] [CrossRef]
- Roe, J.; Aspinall, P.A.; Ward Thompson, C. Understanding relationships between health, ethnicity, place and the role of urban green space in deprived urban communities. Int. J. Environ. Res. Public Health 2016, 13, 681. [Google Scholar] [CrossRef] [Green Version]
- Richardson, E.A.; Mitchell, R. Gender differences in relationships between urban green space and health in the United Kingdom. Soc. Sci. Med. 2010, 71, 568–575. [Google Scholar] [CrossRef] [PubMed] [Green Version]
- Gascon, M.; Triguero-Mas, M.; Martínez, D.; Dadvand, P.; Forns, J.; Plasència, A.; Nieuwenhuijsen, M.J. Mental health benefits of long-term exposure to residential green and blue spaces: A systematic review. Int. J. Environ. Res. Public Health 2015, 12, 4354–4379. [Google Scholar] [CrossRef] [PubMed] [Green Version]
- Gascon, M.; Zijlema, W.; Vert, C.; White, M.P.; Nieuwenhuijsen, M.J. Outdoor blue spaces, human health and well-being: A systematic review of quantitative studies. Int. J. Hyg. Environ. Health 2017, 220, 1207–1221. [Google Scholar] [CrossRef]
- Van den Berg, M.; Wendel-Vos, W.; Van Poppel, M.; Kemper, H.; van Mechelen, W.; Maas, J. Health benefits of green spaces in the living environment: A systematic review of epidemiological studies. Urban For. Urban Green. 2015, 14, 806–816. [Google Scholar] [CrossRef]
- Twohig-Bennett, C.; Jones, A. The health benefits of the great outdoors: A systematic review and meta-analysis of greenspace exposure and health outcomes. Environ. Res. 2018, 166, 628–637. [Google Scholar] [CrossRef] [PubMed]
- de Keijzer, C.; Gascon, M.; Nieuwenhuijsen, M.J.; Dadvand, P. Long-term green space exposure and cognition across the life course: A systematic review. Curr. Environ. Health Rep. 2016, 3, 468–477. [Google Scholar] [CrossRef] [PubMed]
- Kabisch, N.; van den Bosch, M.; Lafortezza, R. The health benefits of nature-based solutions to urbanization challenges for children and the elderly–A systematic review. Environ. Res. 2017, 159, 362–373. [Google Scholar] [CrossRef] [PubMed]
- Di Nardo, F.; Saulle, R.; La Torre, G. Green areas and health outcomes: A systematic review of the scientific literature. Ital. J. Public Health 2010, 7, 402–413. [Google Scholar]
- Caruana, E.J.; Roman, M.; Hernández-Sánchez, J.; Solli, P. Longitudinal studies. J. Thoracic Dis. 2015, 7, E537. [Google Scholar]
- Public Health England. Local Action on Health Inequalities: Improving Access to Green Spaces; Health Equity Briefing 8: Sep. 2014; Public Health England: London, UK, 2014. [Google Scholar]
- Pearson-Stuttard, J.; Ezzati, M.; Gregg, E.W. Multimorbidity—a defining challenge for health systems. Lancet Public Health 2019, 4, e599–e600. [Google Scholar] [CrossRef] [Green Version]
- Moher, D.; Shamseer, L.; Clarke, M.; Ghersi, D.; Liberati, A.; Petticrew, M.; Shekelle, P.; Stewart, L.A. Preferred reporting items for systematic review and meta-analysis protocols [PRISMA-P] 2015 statement. Syst. Rev. 2015, 4, 1–9. [Google Scholar] [CrossRef] [PubMed] [Green Version]
- National Institute for Health and Care Excellence. Getting Help and Support for Common Mental Health Problems; National Institute for Health and Care Excellence: London, UK, 2011. [Google Scholar]
- National Institute for Health and Care Excellence. NICEimpact Mental Health; National Institute for Health and Care Excellence: London, UK, 2018. [Google Scholar]
- Center for Disease Control and Prevention. 2021. Available online: https://www.cdc.gov/globalhealth/healthprotection/ncd/index.html (accessed on 23 May 2021).
- Kellermeyer, L.; Harnke, B.; Knight, S. Covidence and rayyan. J. Med Libr. Assoc. JMLA 2018, 106, 580. [Google Scholar] [CrossRef] [Green Version]
- Ouzzani, M.; Hammady, H.; Fedorowicz, Z.; Elmagarmid, A. Rayyan—A web and mobile app for systematic reviews. Syst. Rev. 2016, 5, 1–10. [Google Scholar] [CrossRef] [Green Version]
- Bero, L.; Rennie, D. The Cochrane Collaboration: Preparing, maintaining, and disseminating systematic reviews of the effects of health care. JAMA 1995, 274, 1935–1938. [Google Scholar] [CrossRef]
- Higgins, J.P.; Thomas, J.; Chandler, J.; Cumpston, M.; Li, T.; Page, M.J.; Welch, V.A. (Eds.) Cochrane Handbook for Systematic Reviews of Interventions; John Wiley & Sons: Hoboken, NJ, USA, 2019. [Google Scholar]
- Peterson, J.; Welch, V.; Losos, M.; Tugwell, P.J. The Newcastle-Ottawa Scale [NOS] for Assessing the Quality of Nonrandomised Studies in Meta-Analyses; Ottawa Hospital Research Institute: Ottawa, ON, Canada, 2011. [Google Scholar]
- Lo, C.K.; Mertz, D.; Loeb, M. Newcastle-Ottawa Scale: Comparing reviewers’ to authors’ assessments. BMC Med. Res. Methodol. 2014, 14, 1–5. [Google Scholar] [CrossRef] [PubMed] [Green Version]
- Banay, R.F.; James, P.; Hart, J.E.; Kubzansky, L.D.; Spiegelman, D.; Okereke, O.I.; Spengler, J.D.; Laden, F. Greenness and depression incidence among older women. Environ. Health Perspect. 2019, 127, 027001. [Google Scholar] [CrossRef] [PubMed]
- Fernández-Niño, J.A.; Bonilla-Tinoco, L.J.; Manrique-Espinoza, B.S.; Salinas-Rodríguez, A.; Santos-Luna, R.; Román-Pérez, S.; Morales-Carmona, E.; Duncan, D.T. Neighborhood features and depression in Mexican older adults: A longitudinal analysis based on the study on global AGEing and adult health [SAGE], waves 1 and 2 [2009–2014]. PLoS ONE 2019, 14, e0219540. [Google Scholar] [CrossRef] [Green Version]
- Gariepy, G.; Thombs, B.D.; Kestens, Y.; Kaufman, J.S.; Blair, A.; Schmitz, N. The neighbourhood built environment and trajectories of depression symptom episodes in adults: A latent class growth analysis. PLoS ONE 2015, 10, e0133603. [Google Scholar] [CrossRef] [PubMed]
- Gariepy, G.; Kaufman, J.S.; Blair, A.; Kestens, Y.; Schmitz, N. Place and health in diabetes: The neighbourhood environment and risk of depression in adults with Type 2 diabetes. Diabet. Med. 2015, 32, 944–950. [Google Scholar] [CrossRef] [PubMed]
- Melis, G.; Gelormino, E.; Marra, G.; Ferracin, E.; Costa, G. The effects of the urban built environment on mental health: A cohort study in a large northern Italian city. Int. J. Environ. Res. Public Health 2015, 12, 14898–14915. [Google Scholar] [CrossRef]
- Picavet, H.S.; Milder, I.; Kruize, H.; de Vries, S.; Hermans, T.; Wendel-Vos, W. Greener living environment healthier people?: Exploring green space, physical activity and health in the Doetinchem Cohort Study. Prev. Med. 2016, 89, 7–14. [Google Scholar] [CrossRef] [PubMed]
- Tomita, A.; Vandormael, A.M.; Cuadros, D.; Di Minin, E.; Heikinheimo, V.; Tanser, F.; Slotow, R.; Burns, J.K. Green environment and incident depression in South Africa: A geospatial analysis and mental health implications in a resource-limited setting. Lancet Planet. Health 2017, 1, e152–e162. [Google Scholar] [CrossRef]
- Astell-Burt, T.; Feng, X. Association of urban green space with mental health and general health among adults in Australia. JAMA Netw. Open 2019, 2, e198209. [Google Scholar] [CrossRef] [PubMed] [Green Version]
- Pun, V.C.; Manjourides, J.; Suh, H.H. Association of neighborhood greenness with self-perceived stress, depression and anxiety symptoms in older US adults. Environ. Health 2018, 17, 1. [Google Scholar] [CrossRef] [Green Version]
- Chang, H.T.; Wu, C.D.; Pan, W.C.; Lung, S.C.; Su, H.J. Association between surrounding greenness and schizophrenia: A taiwanese cohort study. Int. J. Environ. Res. Public Health 2019, 16, 1415. [Google Scholar] [CrossRef] [PubMed] [Green Version]
- Dalton, A.M.; Jones, A.P. Residential neighbourhood greenspace is associated with reduced risk of cardiovascular disease: A prospective cohort study. PLoS ONE 2020, 15, e0226524. [Google Scholar] [CrossRef] [Green Version]
- Tamosiunas, A.; Grazuleviciene, R.; Luksiene, D.; Dedele, A.; Reklaitiene, R.; Baceviciene, M.; Vencloviene, J.; Bernotiene, G.; Radisauskas, R.; Malinauskiene, V.; et al. Accessibility and use of urban green spaces, and cardiovascular health: Findings from a Kaunas cohort study. Environ. Health 2014, 13, 1–11. [Google Scholar] [CrossRef] [PubMed] [Green Version]
- Clark, C.; Sbihi, H.; Tamburic, L.; Brauer, M.; Frank, L.D.; Davies, H.W. Association of long-term exposure to transportation noise and traffic-related air pollution with the incidence of diabetes: A prospective cohort study. Environ. Health Perspect. 2017, 125, 087025. [Google Scholar] [CrossRef] [Green Version]
- Renzi, M.; Cerza, F.; Gariazzo, C.; Agabiti, N.; Cascini, S.; Di Domenicantonio, R.; Davoli, M.; Forastiere, F.; Cesaroni, G. Air pollution and occurrence of type 2 diabetes in a large cohort study. Environ. Int. 2018, 112, 68–76. [Google Scholar] [CrossRef] [PubMed]
- Dalton, A.M.; Jones, A.P.; Sharp, S.J.; Cooper, A.J.; Griffin, S.; Wareham, N.J. Residential neighbourhood greenspace is associated with reduced risk of incident diabetes in older people: A prospective cohort study. BMC Public Health 2016, 16, 1–10. [Google Scholar] [CrossRef] [Green Version]
- Liao, J.; Chen, X.; Xu, S.; Li, Y.; Zhang, B.; Cao, Z.; Zhang, Y.; Liang, S.; Hu, K.; Xia, W. Effect of residential exposure to green space on maternal blood glucose levels, impaired glucose tolerance, and gestational diabetes mellitus. Environ. Res. 2019, 176, 108526. [Google Scholar] [CrossRef] [PubMed]
- Hobbs, M.; Griffiths, C.; Green, M.A.; Christensen, A.; McKenna, J. Examining longitudinal associations between the recreational physical activity environment, change in body mass index, and obesity by age in 8864 Yorkshire Health Study participants. Soc. Sci. Med. 2019, 227, 76–83. [Google Scholar] [CrossRef] [PubMed]
- Persson, Å.; Pyko, A.; Lind, T.; Bellander, T.; Östenson, C.G.; Pershagen, G.; Eriksson, C.; Lõhmus, M. Urban residential greenness and adiposity: A cohort study in Stockholm County. Environ. Int. 2018, 121, 832–841. [Google Scholar] [CrossRef] [PubMed]
- Halonen, J.I.; Kivimäki, M.; Pentti, J.; Stenholm, S.; Kawachi, I.; Subramanian, S.V.; Vahtera, J. Green and blue areas as predictors of overweight and obesity in an 8-year follow-up study. Obesity 2014, 22, 1910–1917. [Google Scholar] [CrossRef]
- Lee, J.J.; Hwang, S.J.; Mutalik, K.; Corey, D.; Joyce, R.; Block, J.P.; Fox, C.S.; Powell-Wiley, T.M. Association of built environment characteristics with adiposity and glycaemic measures. Obes. Sci. Pract. 2017, 3, 333–341. [Google Scholar] [CrossRef] [PubMed] [Green Version]
- Astell-Burt, T.; Feng, X. Urban green space, tree canopy and prevention of cardiometabolic diseases: A multilevel longitudinal study of 46 786 Australians. Int. J. Epidemiol. 2020, 49, 926–933. [Google Scholar] [CrossRef] [Green Version]
- Paquet, C.; Coffee, N.T.; Haren, M.T.; Howard, N.J.; Adams, R.J.; Taylor, A.W.; Daniel, M. Food environment, walkability, and public open spaces are associated with incident development of cardio-metabolic risk factors in a biomedical cohort. Health Place 2014, 28, 173–176. [Google Scholar] [CrossRef]
- de Keijzer, C.; Basagana, X.; Tonne, C.; Valentin, A.; Alonso, J.; Antó, J.M.; Nieuwenhuijsen, M.J.; Kivimäki, M.; Singh-Manoux, A.; Sunyer, J.; et al. Long-term exposure to greenspace and metabolic syndrome: A Whitehall II study. Environ. Pollut. 2019, 255, 113231. [Google Scholar] [CrossRef]
- Datzmann, T.; Markevych, I.; Trautmann, F.; Heinrich, J.; Schmitt, J.; Tesch, F. Outdoor air pollution, green space, and cancer incidence in Saxony: A semi-individual cohort study. BMC Public Health 2018, 18, 1–10. [Google Scholar] [CrossRef]
- Conroy, S.M.; Clarke, C.A.; Yang, J.; Shariff-Marco, S.; Shvetsov, Y.B.; Park, S.Y.; Albright, C.L.; Hertz, A.; Monroe, K.R.; Kolonel, L.N.; et al. Contextual Impact of Neighborhood Obesogenic Factors on Postmenopausal Breast Cancer: The Multiethnic Cohort. Cancer Epidemiol. Biomark. Prev. 2017, 26, 480–489. [Google Scholar] [CrossRef] [Green Version]
- Haraldsdottir, A.; Steingrimsdottir, L.; Valdimarsdottir, U.A.; Aspelund, T.; Tryggvadottir, L.; Harris, T.B.; Launer, L.J.; Mucci, L.A.; Giovannucci, E.L.; Adami, H.O.; et al. Early life residence, fish consumption, and risk of breast cancer. Cancer Epidemiol. Prev. Biomark. 2017, 26, 346–354. [Google Scholar] [CrossRef] [Green Version]
- Orioli, R.; Antonucci, C.; Scortichini, M.; Cerza, F.; Marando, F.; Ancona, C.; Manes, F.; Davoli, M.; Michelozzi, P.; Forastiere, F.; et al. Exposure to residential greenness as a predictor of cause-specific mortality and stroke incidence in the Rome longitudinal study. Environ. Health Perspect. 2019, 127, 027002. [Google Scholar] [CrossRef] [PubMed] [Green Version]
- Paul, L.A.; Hystad, P.; Burnett, R.T.; Kwong, J.C.; Crouse, D.L.; van Donkelaar, A.; Tu, K.; Lavigne, E.; Copes, R.; Martin, R.V.; et al. Urban green space and the risks of dementia and stroke. Environ. Res. 2020, 186, 109520. [Google Scholar] [CrossRef]
- Yuchi, W.; Sbihi, H.; Davies, H.; Tamburic, L.; Brauer, M. Road proximity, air pollution, noise, green space and neurologic disease incidence: A population-based cohort study. Environ. Health 2020, 19, 8. [Google Scholar] [CrossRef] [Green Version]
- de Keijzer, C.; Tonne, C.; Sabia, S.; Basagaña, X.; Valentín, A.; Singh-Manoux, A.; Antó, J.M.; Alonso, J.; Nieuwenhuijsen, M.J.; Sunyer, J.; et al. Green and blue spaces and physical functioning in older adults: Longitudinal analyses of the Whitehall II study. Environ. Int. 2019, 122, 346–356. [Google Scholar] [CrossRef]
- Yu, R.; Wang, D.; Leung, J.; Lau, K.; Kwok, T.; Woo, J. Is neighborhood green space associated with less frailty? Evidence from the Mr. and Ms. Os [Hong Kong] study. J. Am. Med. Dir. Assoc. 2018, 19, 528–534. [Google Scholar] [CrossRef]
- Zhu, A.; Yan, L.; Wu, C.; Ji, J.S. Residential greenness and frailty among older adults: A longitudinal cohort in China. J. Am. Med. Dir. Assoc. 2020, 21, 759–765. [Google Scholar] [CrossRef] [PubMed]
- Chong, S.; Mazumdar, S.; Ding, D.; Morgan, G.; Comino, E.J.; Bauman, A.; Jalaludin, B. Neighbourhood greenspace and physical activity and sedentary behaviour among older adults with a recent diagnosis of type 2 diabetes: A prospective analysis. BMJ Open 2019, 9, e028947. [Google Scholar] [CrossRef]
- Cleland, V.J.; Timperio, A.; Crawford, D. Are perceptions of the physical and social environment associated with mothers' walking for leisure and for transport? A longitudinal study. Prev. Med. 2008, 47, 188–193. [Google Scholar] [CrossRef]
- Coogan, P.F.; White, L.F.; Adler, T.J.; Hathaway, K.M.; Palmer, J.R.; Rosenberg, L. Prospective study of urban form and physical activity in the Black Women's Health Study. Am. J. Epidemiol. 2009, 170, 1105–1117. [Google Scholar] [CrossRef] [PubMed] [Green Version]
- Dalton, A.M.; Wareham, N.; Griffin, S.; Jones, A.P. Neighbourhood greenspace is associated with a slower decline in physical activity in older adults: A prospective cohort study. SSM-Popul. Health 2016, 2, 683–691. [Google Scholar] [CrossRef] [PubMed] [Green Version]
- Faerstein, E.; da Silveira, I.H.; Boclin, K.D.; Curioni, C.C.; de Castro, I.R.; Junger, W.L. Associations of neighborhood socioeconomic, natural and built environmental characteristics with a 13-year trajectory of non-work physical activity among civil servants in Rio de Janeiro, Brazil: The Pro-Saude Study. Health Place 2018, 53, 110–116. [Google Scholar] [CrossRef]
- Hogendorf, M.; Groeniger, J.O.; Noordzij, J.M.; Beenackers, M.A.; van Lenthe, F.J. Longitudinal effects of urban green space on walking and cycling: A fixed effects analysis. Health Place 2020, 61, 102264. [Google Scholar] [CrossRef]
- Josey, M.J.; Moore, S. The influence of social networks and the built environment on physical inactivity: A longitudinal study of urban-dwelling adults. Health Place 2018, 54, 62–68. [Google Scholar] [CrossRef] [PubMed]
- Lin, J.S.; Chan, F.Y.; Leung, J.; Yu, B.; Lu, Z.H.; Woo, J.; Kwok, T.; Lau, K.K. Longitudinal Association of Built Environment Pattern with Physical Activity in a Community-Based Cohort of Elderly Hong Kong Chinese: A Latent Profile Analysis. Int. J. Environ. Res. Public Health 2020, 17, 4275. [Google Scholar] [CrossRef] [PubMed]
- Michael, Y.L.; Perdue, L.A.; Orwoll, E.S.; Stefanick, M.L.; Marshall, L.M. Osteoporotic Fractures in Men Study Group. Physical activity resources and changes in walking in a cohort of older men. Am. J. Public Health 2010, 100, 654–660. [Google Scholar] [CrossRef]
- Sugiyama, T.; Shibata, A.; Koohsari, M.J.; Tanamas, S.K.; Oka, K.; Salmon, J.; Dunstan, D.W.; Owen, N. Neighborhood environmental attributes and adults' maintenance of regular walking. Med. Sci. Sports Exerc. 2015, 47, 1204–1210. [Google Scholar] [CrossRef] [Green Version]
- Yang, L.; Griffin, S.; Khaw, K.T.; Wareham, N.; Panter, J. Longitudinal associations between built environment characteristics and changes in active commuting. BMC Public Health 2017, 17, 1–8. [Google Scholar]
- Meyer, K.A.; Boone-Heinonen, J.; Duffey, K.J.; Rodriguez, D.A.; Kiefe, C.I.; Lewis, C.E.; Gordon-Larsen, P. Combined measure of neighborhood food and physical activity environments and weight-related outcomes: The CARDIA study. Health Place 2015, 33, 9–18. [Google Scholar] [CrossRef] [Green Version]
- De la Fuente, F.; Saldías, M.A.; Cubillos, C.; Mery, G.; Carvajal, D.; Bowen, M.; Bertoglia, M.P. Green Space Exposure Association with Type 2 Diabetes Mellitus, Physical Activity, and Obesity: A Systematic Review. Int. J. Environ. Res. Public Health 2021, 18, 97. [Google Scholar] [CrossRef] [PubMed]
- Lachowycz, K.; Jones, A.P. Greenspace and obesity: A systematic review of the evidence. Obes. Rev. 2011, 12, e183–e189. [Google Scholar] [CrossRef] [PubMed]
- Müller, G.; Harhoff, R.; Rahe, C.; Berger, K. Inner-city green space and its association with body mass index and prevalent type 2 diabetes: A cross-sectional study in an urban German city. BMJ Open 2018, 8, e019062. [Google Scholar] [CrossRef] [Green Version]
- Feng, J.; Glass, T.A.; Curriero, F.C.; Stewart, W.F.; Schwartz, B.S. The built environment and obesity: A systematic review of the epidemiologic evidence. Health Place 2010, 16, 175–190. [Google Scholar] [CrossRef]
- Zhou, Y.; von Lengerke, T.; Dreier, M. Comparing different data sources by examining the associations between surrounding greenspace and children's weight status. Int. J. Health Geogr. 2021, 20, 1–3. [Google Scholar] [CrossRef]
- Xiao, Y.; Zhang, Y.; Sun, Y.; Tao, P.; Kuang, X. Does green space really matter for residents' obesity? A new perspective from Baidu Street View. Front. Public Health 2020, 8, 332. [Google Scholar] [CrossRef] [PubMed]
- Darkwah, R.M.; Cobbinah, P.B. Stewardship of urban greenery in an era of global urbanisation. Int. J. Environ. Ecol. Geol. Geophys. Eng. 2014, 8, 671–674. [Google Scholar]
- Jones, N.L.; Gilman, S.E.; Cheng, T.L.; Drury, S.S.; Hill, C.V.; Geronimus, A.T. Life course approaches to the causes of health disparities. Am. J. Public Health 2019, 109, S48–S55. [Google Scholar] [CrossRef] [PubMed]
- Zeanah, C.H.; Gunnar, M.R.; McCall, R.B.; Kreppner, J.M.; Fox, N.A., VI. Sensitive periods. Monogr. Soc. Res. Child Dev. 2011, 76, 147–162. [Google Scholar] [CrossRef] [Green Version]
- Pearce, J.; Shortt, N.; Rind, E.; Mitchell, R. Life course, green space and health: Incorporating place into life course epidemiology. Int. J. Environ. Res. Public Health 2016, 13, 331. [Google Scholar] [CrossRef]
- Engemann, K.; Pedersen, C.B.; Arge, L.; Tsirogiannis, C.; Mortensen, P.B.; Svenning, J.C. Childhood exposure to green space–a novel risk-decreasing mechanism for schizophrenia? Schizophr. Res. 2018, 199, 142–148. [Google Scholar] [CrossRef] [PubMed] [Green Version]
- Newbury, J.B.; Arseneault, L.; Beevers, S.; Kitwiroon, N.; Roberts, S.; Pariante, C.M.; Kelly, F.J.; Fisher, H.L. Association of air pollution exposure with psychotic experiences during adolescence. JAMA Psychiatry 2019, 76, 614–623. [Google Scholar] [CrossRef] [PubMed]
- Galea, S.; Ahern, J.; Rudenstine, S.; Wallace, Z.; Vlahov, D. Urban built environment and depression: A multilevel analysis. J. Epidemiol. Community Health 2005, 59, 822–827. [Google Scholar] [CrossRef] [PubMed] [Green Version]
- Saarloos, D.; Alfonso, H.; Giles-Corti, B.; Middleton, N.; Almeida, O.P. The built environment and depression in later life: The health in men study. Am. J. Geriatr. Psychiatry 2011, 19, 461–470. [Google Scholar] [CrossRef] [PubMed]
- Prince, S.A.; Kristjansson, E.A.; Russell, K.; Billette, J.M.; Sawada, M.; Ali, A.; Tremblay, M.S.; Prud’Homme, D. A multilevel analysis of neighbourhood built and social environments and adult self-reported physical activity and body mass index in Ottawa, Canada. Int. J. Environ. Res. Public Health 2011, 8, 3953–3978. [Google Scholar] [CrossRef] [PubMed]
- de Keijzer, C.; Bauwelinck, M.; Dadvand, P. Long-term exposure to residential greenspace and healthy ageing: A systematic review. Curr. Environ. Health Rep. 2020, 7, 65–88. [Google Scholar] [CrossRef] [PubMed]
- Vanaken, G.J.; Danckaerts, M. Impact of green space exposure on children’s and adolescents’ mental health: A systematic review. Int. J. Environ. Res. Public Health 2018, 15, 2668. [Google Scholar] [CrossRef] [Green Version]
- World Health Organisation. Urban Green Spaces and Health; WHO Regional Office for Europe: Copenhagen, Denmark, 2016. [Google Scholar]
- Kaczynski, A.T.; Potwarka, L.R.; Saelens, B.E. Association of park size, distance, and features with physical activity in neighborhood parks. Am. J. Public Health 2008, 98, 1451–1456. [Google Scholar] [CrossRef] [PubMed]
- Grilli, G.; Mohan, G.; Curtis, J. Public park attributes, park visits, and associated health status. Landsc. Urban Plan. 2020, 199, 103814. [Google Scholar] [CrossRef]
- Costigan, S.A.; Veitch, J.; Crawford, D.; Carver, A.; Timperio, A. A cross-sectional investigation of the importance of park features for promoting regular physical activity in parks. Int. J. Environ. Res. Public Health 2017, 14, 1335. [Google Scholar] [CrossRef] [PubMed] [Green Version]
- Moreira, T.C.; Polizel, J.L.; Santos, I.D.; Silva Filho, D.F.; Bensenor, I.; Lotufo, P.A.; Mauad, T. Green spaces, land cover, street trees and hypertension in the megacity of São Paulo. Int. J. Environ. Res. Public Health 2020, 17, 725. [Google Scholar] [CrossRef] [PubMed] [Green Version]
- Zhang, L.; Tan, P.Y. Associations between urban green spaces and health are dependent on the analytical scale and how urban green spaces are measured. Int. J. Environ. Res. Public Health 2019, 16, 578. [Google Scholar] [CrossRef] [Green Version]
- Craig, P.; Dieppe, P.; Macintyre, S.; Michie, S.; Nazareth, I.; Petticrew, M. Developing and evaluating complex interventions: The new Medical Research Council guidance. BMJ 2008, 337, a1655. [Google Scholar] [CrossRef] [PubMed] [Green Version]
- Ioannidis, J.P.; Lau, J. Pooling research results: Benefits and limitations of meta-analysis. Jt. Comm. J. Qual. Improv. 1999, 25, 462–469. [Google Scholar] [CrossRef]
- Sterne, J.A.; Hernán, M.A.; Reeves, B.C.; Savović, J.; Berkman, N.D.; Viswanathan, M.; Henry, D.; Altman, D.G.; Ansari, M.T.; Boutron, I.; et al. ROBINS-I: A tool for assessing risk of bias in non-randomised studies of interventions. BMJ 2016, 355, i4919. [Google Scholar] [CrossRef] [PubMed] [Green Version]
- Leslie, E.; Sugiyama, T.; Ierodiaconou, D.; Kremer, P. Perceived and objectively measured greenness of neighbourhoods: Are they measuring the same thing? Landsc. Urban Plan. 2010, 95, 28–33. [Google Scholar] [CrossRef]
- Kabisch, N.; Strohbach, M.; Haase, D.; Kronenberg, J. Urban green space availability in European cities. Ecol. Indic. 2016, 70, 586–596. [Google Scholar] [CrossRef]
- Lovell, R. Links between Natural Environments and Physical Activity: Evidence Briefing; Natural England: Exeter, UK, 2016. [Google Scholar]
- Grellier, J.; White, M.P.; Albin, M.; Bell, S.; Elliott, L.R.; Gascón, M.; Gualdi, S.; Mancini, L.; Nieuwenhuijsen, M.J.; Sarigiannis, D.A.; et al. BlueHealth: A study programme protocol for mapping and quantifying the potential benefits to public health and well-being from Europe’s blue spaces. BMJ Open 2017, 7, e016188. [Google Scholar] [CrossRef] [PubMed] [Green Version]
- Elliott, L.R.; White, M.P.; Grellier, J.; Rees, S.E.; Waters, R.D.; Fleming, L.E. Recreational visits to marine and coastal environments in England: Where, what, who, why, and when? Mar. Policy 2018, 97, 305–314. [Google Scholar] [CrossRef] [Green Version]
- Head, A.; Fleming, K.; Kypridemos, C.; Pearson-Stuttard, J.; O’Flaherty, M. Multimorbidity: The case for prevention. J. Epidemiol. Community Health 2021, 75, 242–244. [Google Scholar] [CrossRef] [PubMed]
- Pati, S.; Swain, S.; Knottnerus, J.A.; Metsemakers, J.F.; van den Akker, M. Health related quality of life in multimorbidity: A primary-care based study from Odisha, India. Health Qual. Life Outcomes 2019, 17, 1–11. [Google Scholar] [CrossRef] [PubMed]
- Lenzi, J.; Avaldi, V.M.; Rucci, P.; Pieri, G.; Fantini, M.P. Burden of multimorbidity in relation to age, gender and immigrant status: A cross-sectional study based on administrative data. BMJ Open 2016, 6, e012812. [Google Scholar] [CrossRef] [Green Version]

| Study Reference | Population Description | Sample Size | Cohort Name/Data Source | Follow-Up Duration | Exposure Indicator Description | Exposure Indicator Type | Outcome | Outcome Measure | Main Results Effect Estimate [95% CI 1] | Confounders | Study Quality * |
|---|---|---|---|---|---|---|---|---|---|---|---|
| Primary Outcomes | |||||||||||
| Mental Health | |||||||||||
| Banay et al. [50] | women nurses; ≥30–55 years [USA] | 121,701 | Nurses’ Health Study | 10 years | NDVI 1 averages for each year of follow-up; 250 m and 1250 m circular buffers | Availability | Depression | First self-report of physician/clinician diagnosis of depression or new regular use of antidepressants | 250m Buffer HR 1: 0.87 [0.78, 0.98] Highest NDVI quintile 1250 m Buffer HR: 0.90 [0.80, 1.02] Highest NDVI quintile | age, race, mental health, marital status, educational attainment, husband’s educational attainment, population density, income, median home value, PM 1 2:5 level, BMI 1, smoking status and pack-years of smoking, alcohol consumption, physical activity, physical function, bodily pain [baseline], social network strength, care to ill family members [baseline], difficulty sleeping [baseline] | Poor |
| Fernandez-Nino et al. [51] | men and women; ≥55 years [Mexico] | 1524 | Study on Global Ageing and Adult Health [SAGE] | 5 years | Street trees; total length of street covered in trees in a 950 m road network buffer | Accessibility | Depression | Self-report of physician diagnosis | OR 1: 0.90 [0.29, 2.83] Highest quintile of street length covered in trees | sex, age, income index, functional limitations, margination index of the municipality | Good |
| Gariepy et al. [52] | men and women; ≥18–80 years [Canada] | 13,618 | National Population Health Survey | 10 years | Presence of a park within a 500 m circular buffer | Accessibility | Depression | Self-reported instrument | Β 1: −0.4 [−1.4, 0.6] For answering “yes” to presence of a park | age, sex, marital status, education, income adequacy, childhood life events, chronic condition, family history of depression | Good |
| Gariepy et al. [53] | men and women; ≥18–80 years; with diabetes [any type] [Canada] | 2003 | Diabetes Health Study [DHS] | 5 years | NDVI | Availability | Depression | Self-reported instrument | HR: 0.94 [0.88, 1.01] Per decile increase in NDVI | sex, age, marital status, family income, educational level, employment | Good |
| Melis et al. [54] | men and women; ≥20–65 years [Italy] | 547,263 | Turin Longitudinal Study [TLS] | 2 years | Availability of green space measured via index by area units | Availability | Depression | Antidepressant use | Men IRR 1: 0.98 [0.92, 1.04] Highest index value quintile green Women IRR: 1.00 [0.96, 1.08] Highest index value quintile of green | sex, age, education level, activity status, citizenship, residential stability at same address | Good |
| Picavet et al. [55] | men and women; ≥18 to 55 years [Netherlands] | 4917 | Doetinchem Cohort Study | 15 years | Percent green space in 125 m and 1000 m circular buffer | Availability | Depression | Self-reported instruments | Per unit increase in percent green space 125 m OR: 0.97 [0.92, 1.04] 1000 m OR: 0.86 [0.79; 0.93] | age, sex, SES 1 | Poor |
| Tomita et al. [56] | men and women; mean 20 years [South Africa] | 11,156 | South African National Income Dynamics Study [SA-NIDS | 4 years | NDVI, 250 m resolution square | Availability | Depression | Self-reported instrument | OR: 1.01 [1.01, 1.02] Each unit increase in NDVI value | age, sex, marital status, race, household income, employment, rurality | Good |
| Astell-Burt and Feng [57] | men and women; ≥45 years [Australia] | 46,786 | 45 and Up Study | 6.2 [mean] years | Total percent green space; tree canopy in a 1600 m road network buffer | Availability | Depression or anxiety | Self-report of doctor diagnosed | OR: 1.26 [0.89, 1.63] Highest percent quintile total green OR: 0.86 [0.80, 1.01] Highest percent quintile tree canopy | age, sex income, education, economic status, couple status | Poor |
| Pun et al. [58] | men and women; ≥57–85 years [USA] | 3005 | National Social Life, Health, and Aging Project [NSHAP] | 6 years | NDVI seasonal changes in 1000 m circular buffer | Availability | Depression; anxiety | Self-reported instrument | Anxiety β: −0.104 [−0.322, 0.115] per unit increase in NDVI Depression β: −0.274 [−0.596, 0.048] per unit increase in NDVI | age, gender, questionnaire year, season, region, education attainment, 3-day moving average of temperature, 60-months moving average of PM2.5 | Good |
| Chang et al. [59] | men and women mean age: 43.36 [20.44] years [Taiwan] | 869,484 | Taiwan Longitudinal Health Insurance Database | 10 years | NDVI at baseline; 2000 m circular buffer around hospital most frequently visited | Availability | Schizophrenia | Physician-diagnosed | HR: 0.37 [0.25, 0.55] Highest NDVI quintile | age, sex, health insurance rate, classification of the insured, temperature, relative humidity, precipitation | Good |
| NCDs | |||||||||||
| Dalton and Jones [60] | men and women; mean 59.2 years [United Kingdom] | 25,639 | European Prospective Investigation of Cancer [EPIC] Norfolk | 14.5 [mean] years | Percent green space in 800 m circular buffer | Availability | CVD 1 | Health register | HR: 0.93 [ 0.88, 0.97] Highest percent quintile green | sex, age, BMI, diabetes, SES [individual and neighbourhood] | Good |
| Tamosiunas et al. [61] | men and women; ≥45–72 years [Lithuania] | 5112 | Health, Alcohol, and Psychosocial Factors in Eastern Europe [ HAPIEE] | 4.41 [mean] years | Distance to park and park use [self-reported] | Accessibility | CVD | Self-reported doctor diagnosed | User: HR: 1.58 [0.95, 2.63] Longest distance quintile Nonuser: HR: 1.66 [1.01, 2.73] Longest distance quintile | age, sex, education, smoking, arterial hypertension, physical activity, total cholesterol level, fasting glucose level, BMI, diabetes mellitus, cognitive function, symptoms of depression, self-rated health, and quality of life | Good |
| Clark et al. [62] | men and women; ≥45–84 years; urban residents [Canada] | 380,738 | British Columbia mandatory health insurance database | 4 years | NDVI yearly and seasonal; in 100 m circular buffer | Availability | Diabetes | Health register | OR: 0.90 [0.87, 0.92] IQR 1 increase in NDVI | sex, age, area-level household income, walkability, pollution | Good |
| Renzi et al. [63] | men and women; ≥35 years [Italy] | 1,459,671 | Rome Longitudinal Study | 5.2 [mean] years | NDVI and LAI in a 300 m circular buffer | Availability | Diabetes | Medical records | β: −1.87 [−7.40, 3.99] Per unit increase in NDVI | SES, marital status, educational level, occupation, place of birth, sex | Good |
| Dalton et al. [64] | men and women; ≥40–80 years [United Kingdom] | 25,633 | European Prospective Investigation into Cancer [EPIC] Norfolk | 11.3 [mean] years | Percent green space; in 800m circular buffer | Availability | Diabetes[T2] | Self-report of physician diagnosis or medication | HR: 0.81 [0.65, 0.99] Highest percent quintile green | sex, age, BMI, parental diabetes, SES | Good |
| Liao et al. [65] | pregnant women; 25–29 years mean age group [China] | 6,883 | Visitors of Wuhan’s Women and Children Medical and Healthcare Center | 9 months or until development of gestational diabetes | NDVI for conception years; 300 m circular buffer | Availability | Diabetes [genstational] | Clinical samples | RR1: 0.66 [0.52, 0.84] Highest quintile NDVI | age, education years, BMI, passive smoking during pregnancy, parity, season | Good |
| Hobbs et al. [66] | men and women; ≥18–89 years [United Kingdom] | 28,806 | Yorkshire Health Study | 3 years | Presence of park in a 2000 m circular buffer | Accessibility | Obesity | BMI, self-report | OR: 0.99 [0.98, 1.02] for answering “yes” to presence of park | age, sex, education, deprivation, population density | Fair |
| Persson et al. [67] | men and women, ≥35–65 years [Sweden] | 5712 | Stockholm Diabetes Prevention Program [SDPP] | 8.9 [mean] years | NDVI; time-weighted in a 100 m, 250 m, 500 m circular buffer | Availability | Obesity | Objective measures of BMI | IRR for IQR increase in NDVI 500 m Females: 1.05 [0.88, 1.26] Males: 1.06 [0.89, 1.26] | age, alcohol consumption, tobacco use, psychological distress, shift work, aircraft noise, railway noise, distance to water | Good |
| Halonen et al. [68] | men and women; public sector employees; mean: 47.7 years [nonmovers] and among the movers 41.8 [Finland] | 35,213 | Finnish Public Sector study | 8 years | Distance to green space; distance to blue space in meters, objectively measured | Accessibility | Obesity and overweight | Self-reported BMI | Green space OR: 1.50 [1.07, 2.11] Longest distance quintile Blue space OR: 1.15 [0.94, 1.39] Longest distance quintile | age, sex, education, chronic disease, neighbourhood socioeconomic disadvantage, BMI, smoking, heavy alcohol, physical inactivity | Poor |
| Lee et al. [69] | men and women; ≥19 years [48.6 years mean] [USA] | 5435 | Offspring and Generation Three Cohorts of the Framingham Heart Study | 6.4 years | Percent green space within a census block | Availability | Obesity; Diabetes | Blood samples; medication; objectively-measured BMI | Diabetes: OR: 0.70 [0.41, 1.19] Highest percent quintile green Obesity: no results | age, gender, smoking status, education, cohort status, fasting plasma glucose, BMI | Fair |
| Astell-Burt and Feng [70] | men and women; ≥45 years [Australia] | 53,196 | 45 and Up Study | 6 years | Percent green space; tree canopy in a 1600 m road network buffer | Availability | Diabetes, hypertension and CVD | Self-report of physician diagnosis | Diabetes OR: 1.10 [0.65, 1.95] Highest percent quintile total green OR: 0.71 [0.56, 0.91] Highest percent quintile tree canopy Hypertension OR: 0.72 [0.64, 1.12] Highest percent quintile total green OR: 0.82 [0.71, 0.95] Highest percent quintile tree canopy CVD OR: 0.89 [0.59, 1.13] Highest percent quintile total green OR: 0.79 [0.63, 0.92] Highest quintile tree canopy | age, sex income, education, economic status, couple status | Poor |
| Paquet et al. [71] | men and women; ≥18 years [Australia] | 4056 | North West Adelaide Health Study [NWAHS] | 3.5 [mean] years | NDVI in 1000 m road network buffer | Availability | Diabetes; hypertension; obesity; dyslipidaemia | Clinical samples | Per unit increase in NDVI Diabetes RR: 1.01 [0.90, 1.13] Hypertension RR: 0.97 [0.87, 1.07] Dyslipidaemia RR: 1.12 [1.00, 1.25] Obesity RR: 1.04 [0.92, 1.16] | age, gender, smoking status, education, cohort status, fasting plasma glucose, BMI | Good |
| de Keijzer et al. [72] | men and women; ≥35–55 years civil servants [United Kingdom] | 10,308 | Whitehall II | 14.1 [median] years | NDVI and VCF, 500 m and 1000 m circular buffers and LSOA | Availability | Metabolic Syndrome | Clinical samples | IQR increase in NDVI 500m HR: 0.87 [0.77, 0.99] 1000 m HR: 0.90 [0.79, 1.01] LSOA HR: 0.91 [0.79, 1.03] | age, sex, ethnicity, individual socioeconomic status [education and employment grade], neighbourhood socioeconomic status [income and employment deprivation] | Good |
| Datzman et al. [73] | men and women; mean 49.33 years; [Germany] | 1,918,449 | AOK Plus [health insurance database] | 4 years | NDVI; 115 images for 4 years; statistical area units | Availability | Cancer: colorectal; mouth and throat, prostate, breast; nonmelanoma skin | Health register | Per 10% increase in NDVI Colorectal: RR: 1.03 [0.98, 1.07] Mouth: RR: 0.89 [0.83, 0.96] Skin: RR: 0.84 [0.79, 0.90] Prostate: RR: 0.95 [0.90, 1.01] Breast: RR: 0.96 [0.92, 0.99] | age, sex, alcohol-related disorder, absolute number of physician contacts, proportion of short and long-term unemployment | Good |
| Conroy et al. [74] | women; ≥45–75 years; [African Americans, Japanese Americans, Latinos, Native Hawaiians, and White] [USA] | 48,247 | Multiethnic Cohort [MEC] | 17 years | Presence of a park; based on number in a residential block group | Accessibility | Breast cancer [invasive] | Health register | HR: 1.03 [0.92, 1.15] No park in area | age, clustering effect of block group, ethnicity, risk factors, baseline BMI and adult weight change, neighbourhood SES, all neighbourhood obesogenic factors | Good |
| Haraldsdottir et al. [75] | women; mean: 53.9 years [Iceland] | 10,049 | Reykjavik Study | 27.3 average | Coastal residence, self-reported | Availability | Breast cancer | Health registers | HR: 0.87 [0.72, 1.04] Coastal residence vs. city | age, birth cohort, education, physical activity, parity, height, BMI in midlife, age at menarche, age at first child | Good |
| Orioli et al. [76] | men and women; ≥30 years [Italy] | 1,265,058 | Rome Longitudinal Study | 13 years | NDVI average for 2015 in 300 m and 1000 m circular buffer | Availability | Stroke | Health register | NDVI highest quintile 300 m HR: 0.95 [0.91, 0.98] 1000 m HR: 0.97 [0.93, 1.00] | age, sex, educational level, marital status, occupational status, place of birth, area-level SES | Good |
| Paul et al. [77] | men and women; ≥35–100 years; urban residents Ontario [Canada] | 4,251,146 | Ontario Population Health and Environment Cohort [ONPHEC] | 13 years | NDVI annual values, 250 m circular buffer | Availability | Stroke | Health register | HR: 0.96 [95% CI: 0.95, 0.97] per IQR increase in NDVI | age, sex, SES, comorbidities, northern residence, population density, air pollution | Good |
| Yuchi et al. [78] | men and women; ≥45–84 years [Canada] | 634,432 [parkinson disease]; 7232 [multimple sclerosis] | Medical Services Plan [MSP] Vancouver, mandatory health insurance database | 4 years | NDVI; yearly average in 100 m circular buffer | Availability | Parkinson’s disease Multiple sclerosis | Health records | Per IQR increase in NDVI Parkinson’s Disease: OR: 0.97 [0.93, 1.01] Multiple Sclerosis: OR: 1.14 [1.00, 1.30] | Parkinson’s disease: age, sex, comorbidities, household income, education, ethnicity Multiple sclerosis: age, sex, comorbidities, household income, education and ethnicity, comorbidities, household income, education, ethnicity | Good |
| Picavet et al. [55] | men and women; ≥18 to 55 years [Netherlands] | 4,917 | Doetinchem Cohort Study | 15 years | Percent green space in 125 m and 1000 m circular buffer | Availability | Obesity; Hypertension | All self-reported instruments | Per unit increase in percent green space 125 m Obesity: OR: 1.04 [1.01, 1.07] Hypertension: OR: 0.99 [0.97, 1.02] 1000 m Obesity: OR: 1.00 [0.96; 1.05] Hypertension: OR: 1.02 [0.98; 1.05] | age, sex, SES | Poor |
| Secondary Outcomes | |||||||||||
| de Keijzer et al. [79] | men and women; ≥35–55 civil servants [United Kingdom] | 10,308 | Whitehall II study | 9 [median] years | NDVI and EVI; distance to blue space [any visible water]; distance to green or blue space in 500m and 1000 m circular buffer; distance in m | Availability Accessibility | Physical Functioning | Clinical measures | Walking speed [difference baseline and follow-up]: 500 m NDVI β: 0.02 [0.01, 0.04] per IQR increase 1000m NDVI β: 0.03 [0.01, 0.04] per IQR increase Blue space β: −0.01 [−0.02, 0.01] per IQR increase Grip strength [difference baseline and follow-up]: 500 m NDVI β: −0.01 [−0.03, 0.01] per IQR increase 1000 m NDVI β: −0.01 [−0.03, 0.01] per IQR increase Blue space β: −0.01 [−0.03, 0.01] per IQR increase | sex, ethnicity, marital status, height, alcohol use, intake of fruit and vegetables, smoking, rurality, education, employment grade, Index of Multiple Deprivation [IMD], income score and of the IMD, employment score | Fair |
| Yu et al. [80] | men and women; ≥65 years [Hong Kong] | 4000 | Mr and Ms Os Study | 2 years | NDVI at baseline in a 300 m circular buffer | Availability | Frailty | Self-reported instrument | OR: 1.29 [1.04, 1.60] Highest quintile NDVI | age, sex, marital status, SES, current smoking status, alcohol intake, diet quality, baseline frailty status, number of diseases, cognitive function, physical activity, depression | Good |
| Zhu et al. [81] | men and women; ≥65 years [China] | 34,342 | Chinese Longitudinal Healthy Longevity Survey [CLHLS] | 9 years | NDVI; annual averages for each year in 500 m buffer | Availability | Frailty | Self-reported instrument | OR: 1.02 [1.00, 1.04] Per unit increase in NDVI | age, sex, ethnicity, marital status, geographic region, urban or rural residence, education, occupation, financial support, social and leisure activity, smoking status, drinking status, physical activity | Good |
| Chong et al. [82] | men and women; ≥45 years with diabetes [T2] [Australia] | 60,404 | 45 and Up Study and the follow-up Social, Economic and Environmental Factors [SEEF] Study | 3.3 [mean] years | Percent green space in 500 m, 1000 m, and 2000 m road network buffer | Availability | Physical Activity | Self-reported instrument [MVPA: min/week] | Per highest percent quintile green 500 mMean: 0.61 [−0.26, 1.49] 1000 mMean: 0.94 [0.10, 1.79] 2000 mMean: 0.75 [0.03, 1.48] | age, sex, country of birth, education, disadvantage, physical functioning, BMI, psychological distress | Poor |
| Cleland et al. [83] | women parents; mean: 42.4 years;[Australia] | 698 | Children Living in Active Neighbourhoods [CLAN] | 2 years | Amount of greenery and quality of parks, self-reported satisfaction | Availability Accessibility | Physical activity | Self-reported instrument [walking: for leisure and transport [min/ week]] | Amount of greeneryPersistently high vs. persistently low PA: RR: 1.80 [1.04, 3.13] Increased vs. persistently low PA: RR: 1.39 [0.90, 2.17] Quality of parks Persistently high vs. persistently low PA: RR: 1.73 [1.17, 2.57] Increased vs. persistently low PA: RR: 1.20 [0.89, 1.62] | age, marital status, number of children in the household, highest level of schooling | Poor |
| Coogan et al. [84] | women; ≥21–69 years; Black ethnicity [USA] | 21,820 | Black Women’s Health Study | 2-6 years 98,280 person-years of follow-up. | Distance to park | Accessibility | Physical activity | Self-reported instrument [Walking for recreation and total walking: y/n]] | Recreation walking OR: 1.01 [0.89, 1.13] Shortest distance quintile Exercise walking OR: 1.01 [0.91, 1.12] Shortest distance quintile | age, region, BMI, smoking, alcohol, marital status, parity, caregiver status, residential moves, chronic conditions, history of cancer, moving residence, vacant housing, SES, crime | Poor |
| Dalton et al. [85] | men and women; mean age at baseline 62.2 [United Kingdom] | 25,639 | European Prospective Investigation into Cancer [EPIC] Norfolk | 7.5 [mean] years | Percent green space at baseline for nonmovers; 800 m | Availability | Physical Activity | Self-reported instrument [Change in overall PA [hr/week]] | β: 4.21 [1.60, 6.81] Highest percent quintile green | age, sex, marital status, waist to hip ratio, BMI, morbidity, urban/ rural location | Fair |
| Faerstein et al. [86] | men and women; ≥18 years; civil servants [Brazil] | 1731 | Pro-Saude study | 13 years | NDVI [800 m circular buffer]; presence of trees [visual inspection]; proximity to waterfronts; | Availability Accessibility | Physical activity | Self-reported instrument [nonwork PA: yes/no] | OR: 0.85 [0.44, 1.65] Highest quintile NDVI OR: 1.22 [0.62, 2.40] Highest percent quintile of trees OR: 2.46 [1.22, 4.93] Longest distance to waterfronts | sex, race, education, income, neighbourhood contextual variables | Poor |
| Hogendorf et al. [87] | men and women; mean: 53 years; [Netherlands] | 4758 | Gezondheid en Levens Omstandigheden Bevolking Eindhoven en omstreken [GLOBE] | 10 years | Area of green space within a 1000 m circular buffer; Distance to green space | Availability Accessibility | Physical activity | Self-reported instrument [total walking and cycling: min/week] | Total walking and cycling Per ha increase in area of green β: 0.82 [−178.84, 180.48] Distance per 100m increase in green β: −22.36 [−46.19, 1.48] | marital status, income, employment, smoking, self-rated health | Poor |
| Josey and Moore. [88] | men and women; ≥25years; urban residents [Canada] | 2707 | Montreal Neighborhood Networks and Healthy Aging Panel [MoNNET-HA] | 5 years | Distance to parks and green spaces | Accessibility | Physical Activity | Self-reported instrument [physical inactivity: y/n] | OR: 0.99 [0.99, 1.00] Per mile increase in distance | sex, age, self-reported health status, SES, household language, marriage status, residential duration, wave | Poor |
| Lin et al. [89] | men and women; ≥65–98 years [Hong Kong] | 4000 | OS and Ms. OS Study | 7.8 [mean] years | NDVI in 300 m circular buffer | Availability | Physical activity | Self-reported instrument [Total PA score] | No relevant results | age, sex, marital status, education level, alcohol consumption, smoking, living alone, self-rated health, chronic conditions, functional impairment | Fair |
| Michael et al. [90] | men; ≥65 years [USA] | 513 | Neighborhoods and Physical Activity in Elderly Men | 3.6 [mean] years | Distance to park | Accessibility | Physical activity | Self-reported instrument [walking: min/day] | RR for presence of park Low SES: 0.89 [0.70, 1.13] High SES: 1.34 [1.16, 1.55] | age, race education, occupation, marital status, self-reported health, BMI, smoking, drinking, chronic conditions | Fair |
| Sugiyama et al. [91] | men and women; mean: 54.4 years [Australia] | 4802 | AusDiab study | 7 years | Park or nature reserve in the neighbourhood, self-reported | Accessibility | Physical Activity | Self-reported instrument [meeting PA guidelines: y/n] | OR: 0.96 [0.80, 1.15] for having a park in neighbourhood | age, sex, education, work status change, child change, mobility, BMI | Poor |
| Yang et al. [92] | men and women; ≥40–79 years [United Kingdom] | 25,633 | European Prospective Investigation into Cancer [EPIC] Norfolk | 7 years | Presence of park or green space in 800 m circular buffer | Accessibility | Physical activity | Self-reported instrument [active commuting: y/n] | Park [yes]: OR: 1.30 [0.96, 1.74] Green space [yes]: OR: 1.12 [0.83, 1.53] | No adjustment | Poor |
| Meyer et al. [93] | men and women; ≥18–30 years; black and white [USA] | 5115 | Coronary Artery Risk Development in Young Adults [CARDIA] | 13 years | Number of parks within a 3000 m circular buffer | Accessibility | Physical activity; Diet Quality | Self-reported validated instruments [PA: frequency walking, biking, running/ week] | No relevant results | N/A | Poor |
| Picavet et al. [55] | men and women; ≥18 to 55 years [Netherlands] | 4917 | Doetinchem Cohort Study | 15 years | Percent green space in 125 m and 1000 m circular buffer | Availability | Physical activity; Quality of Life | All self-reported instruments [PA: meeting guidelines: y/n] | Per unit increase in NDVI 125 m Physical activity: OR: 1.02 [0.99; 1.04] Quality of Life: Mixed 1000 m Physical activity: OR: 1.01 [0.97; 1.05] Quality of Life: Mixed | age, sex, SES | Poor |
Publisher’s Note: MDPI stays neutral with regard to jurisdictional claims in published maps and institutional affiliations. |
© 2021 by the authors. Licensee MDPI, Basel, Switzerland. This article is an open access article distributed under the terms and conditions of the Creative Commons Attribution (CC BY) license (https://creativecommons.org/licenses/by/4.0/).
Share and Cite
Geneshka, M.; Coventry, P.; Cruz, J.; Gilbody, S. Relationship between Green and Blue Spaces with Mental and Physical Health: A Systematic Review of Longitudinal Observational Studies. Int. J. Environ. Res. Public Health 2021, 18, 9010. https://doi.org/10.3390/ijerph18179010
Geneshka M, Coventry P, Cruz J, Gilbody S. Relationship between Green and Blue Spaces with Mental and Physical Health: A Systematic Review of Longitudinal Observational Studies. International Journal of Environmental Research and Public Health. 2021; 18(17):9010. https://doi.org/10.3390/ijerph18179010
Chicago/Turabian StyleGeneshka, Mariya, Peter Coventry, Joana Cruz, and Simon Gilbody. 2021. "Relationship between Green and Blue Spaces with Mental and Physical Health: A Systematic Review of Longitudinal Observational Studies" International Journal of Environmental Research and Public Health 18, no. 17: 9010. https://doi.org/10.3390/ijerph18179010
APA StyleGeneshka, M., Coventry, P., Cruz, J., & Gilbody, S. (2021). Relationship between Green and Blue Spaces with Mental and Physical Health: A Systematic Review of Longitudinal Observational Studies. International Journal of Environmental Research and Public Health, 18(17), 9010. https://doi.org/10.3390/ijerph18179010