
The Anaerobic Power Assessment in CrossFit® Athletes: An Agreement Study

 ,
,  , ,
, ,  and
and 
Abstract
1. Introduction
2. Materials and Methods
2.1. Participants
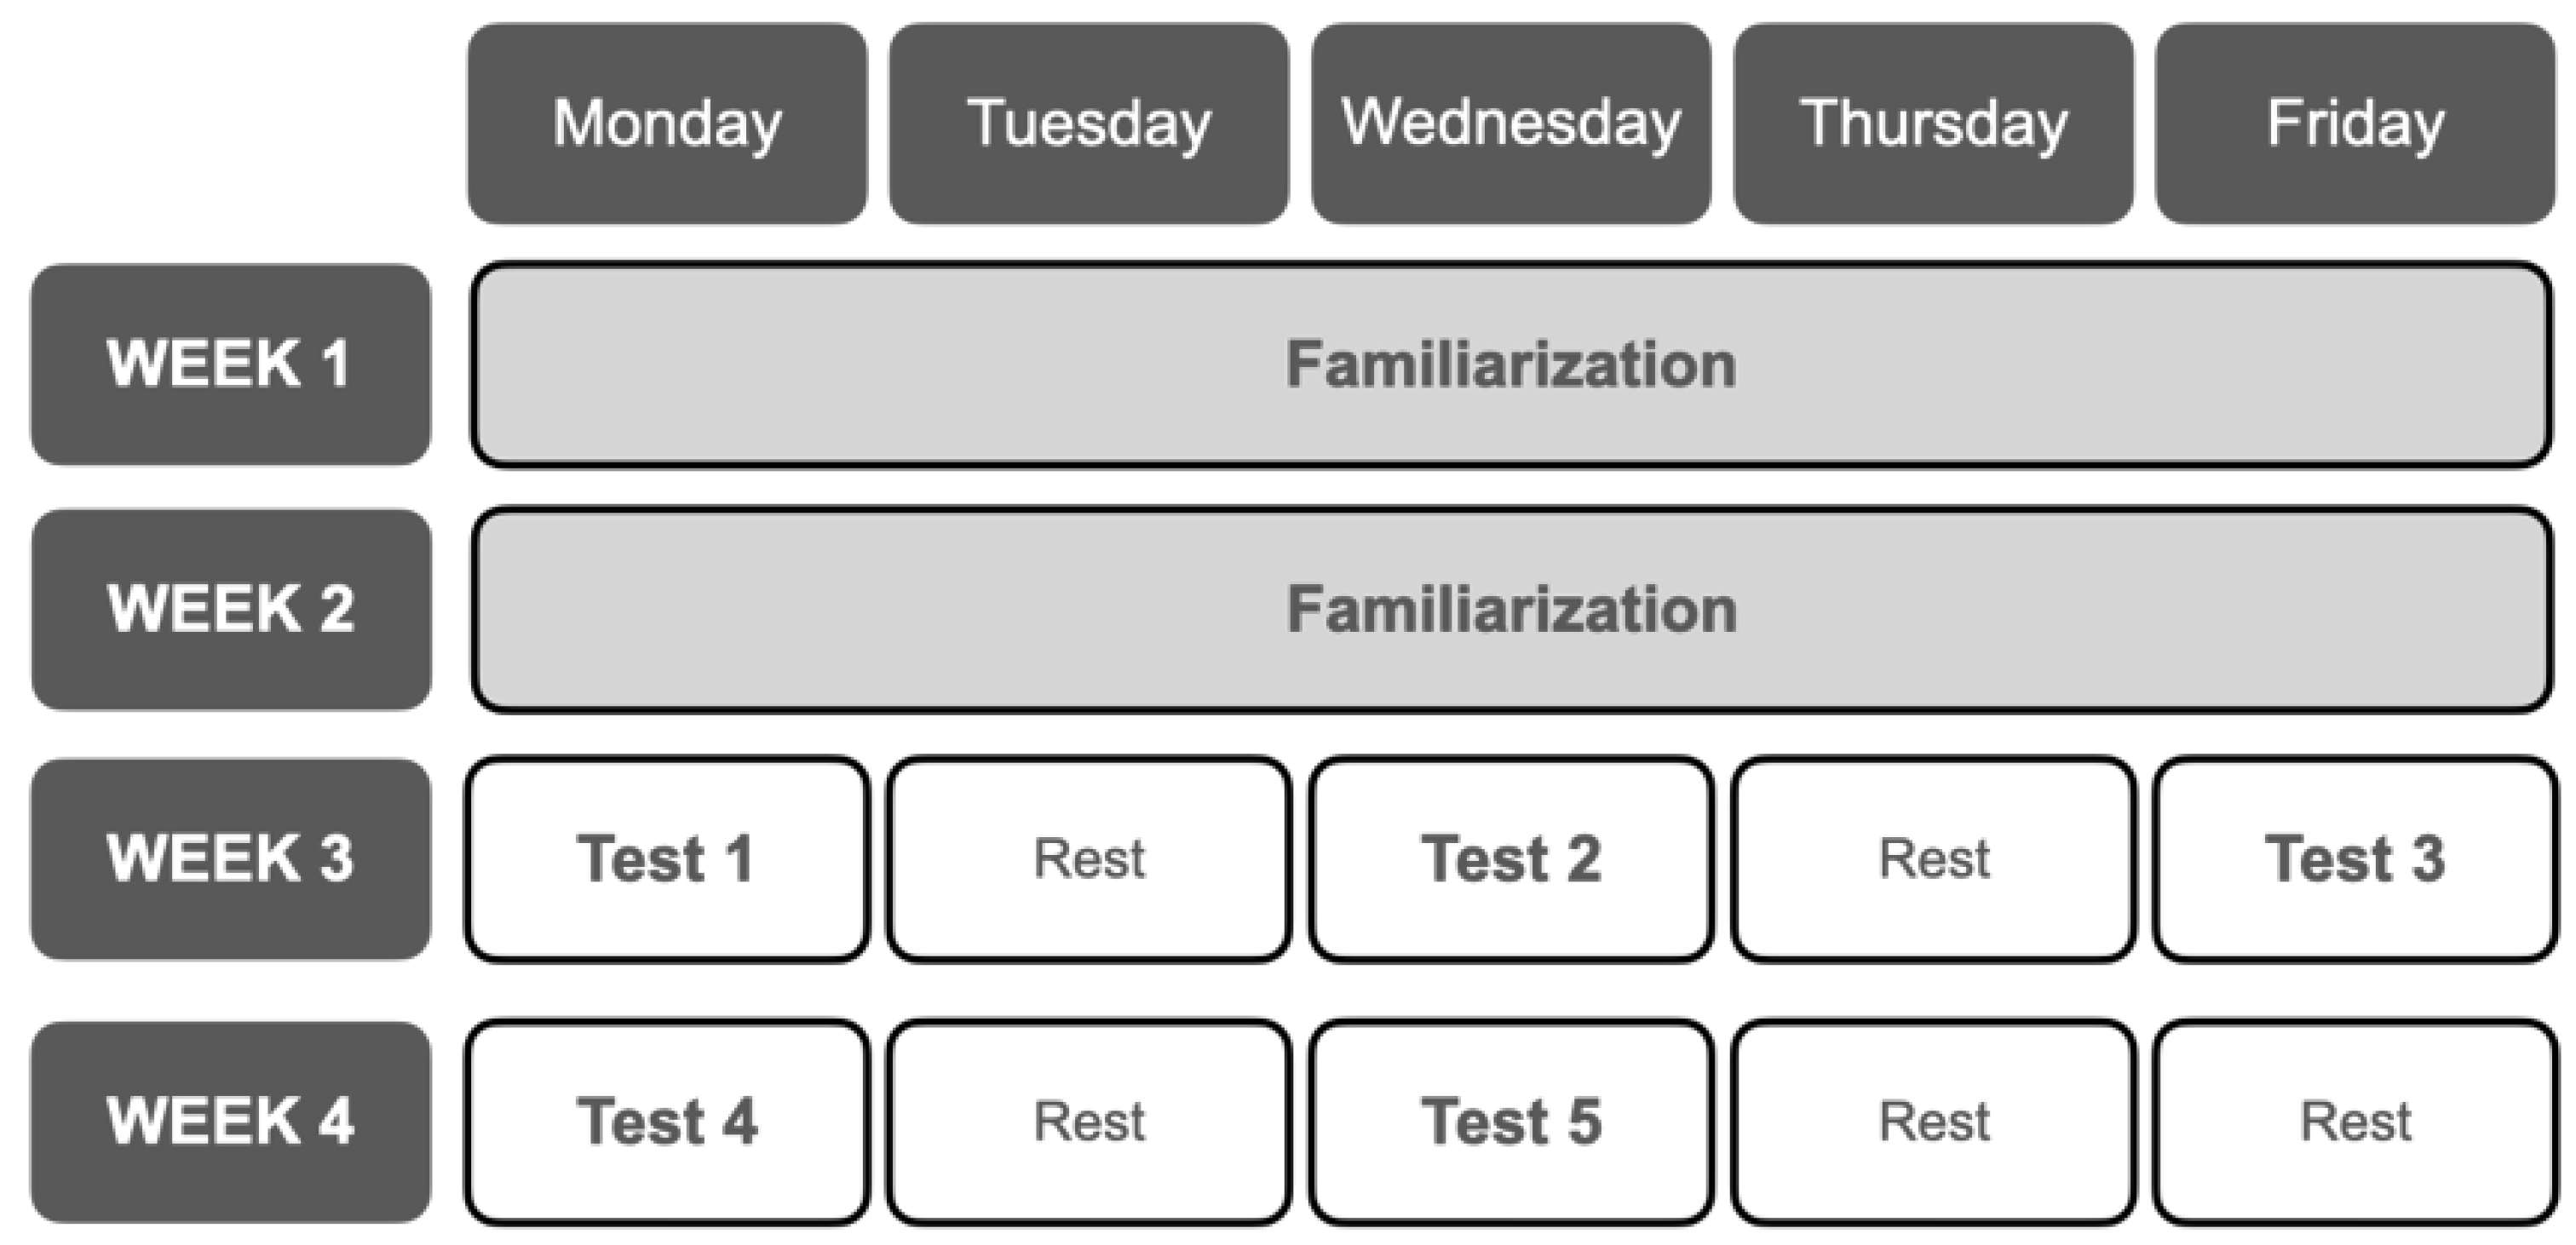
2.2. Study Design
2.3. Procedures
2.3.1. Anthropometry, Body Composition and Other Physiological Variables
2.3.2. All-Out Anaerobic Tests
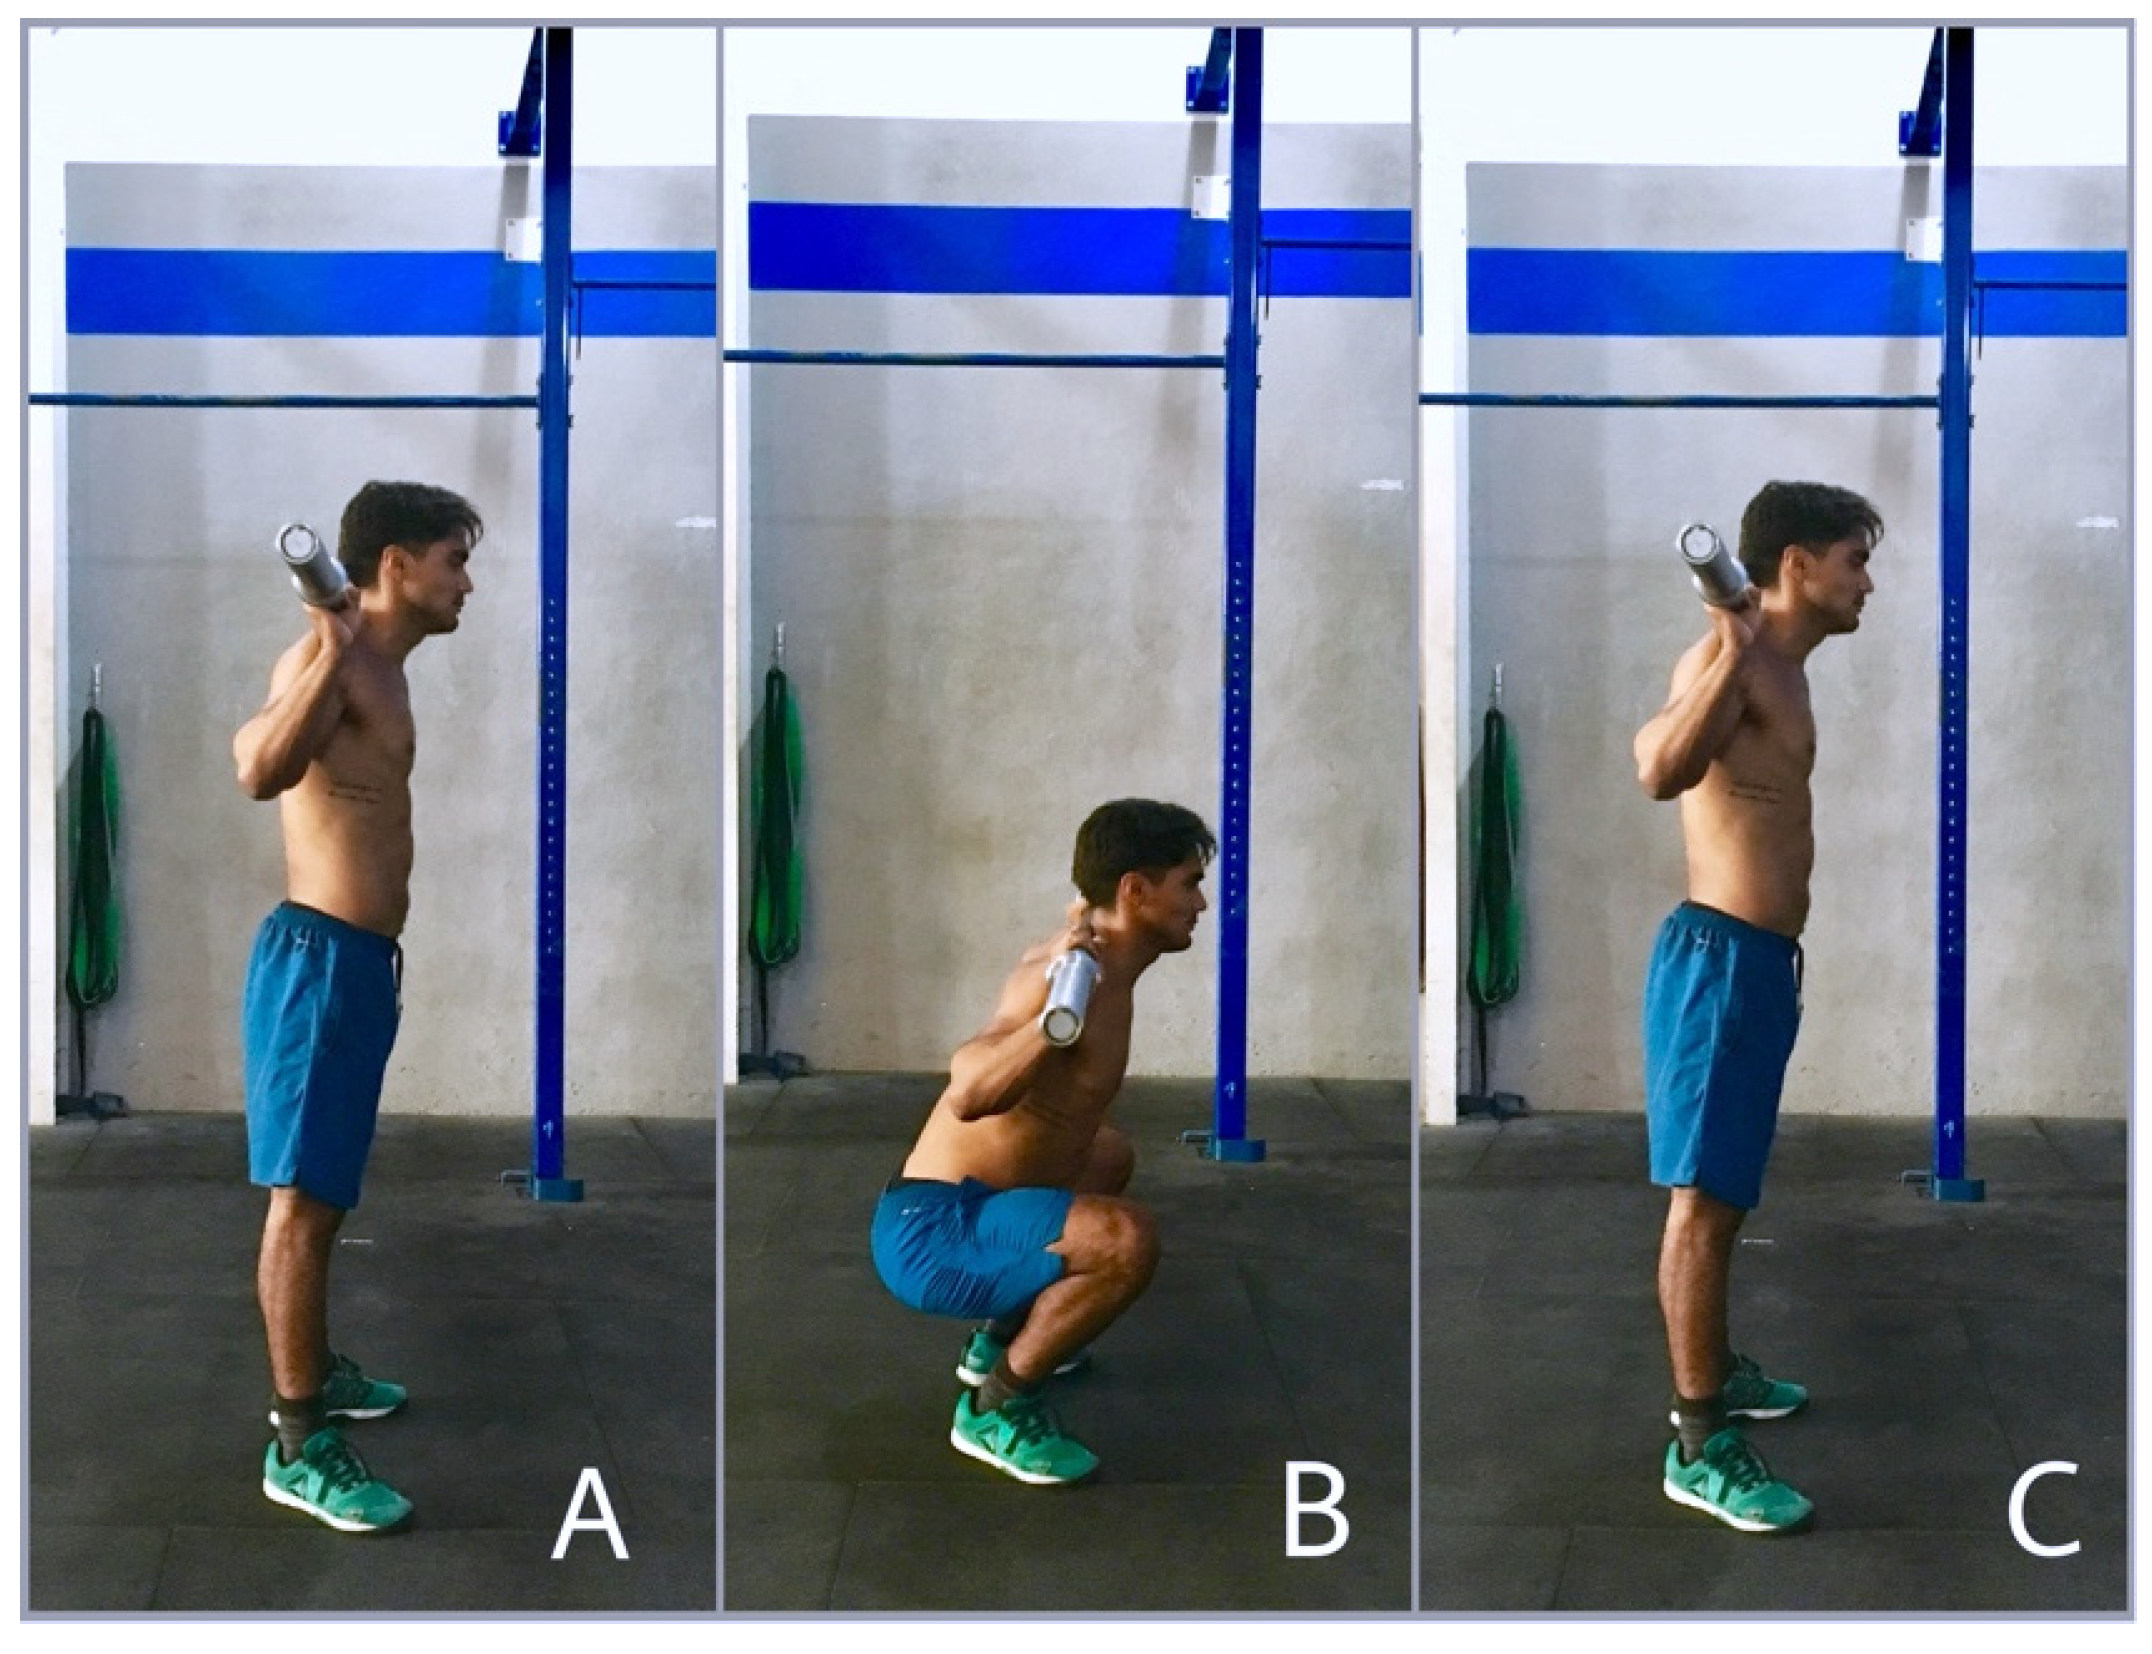
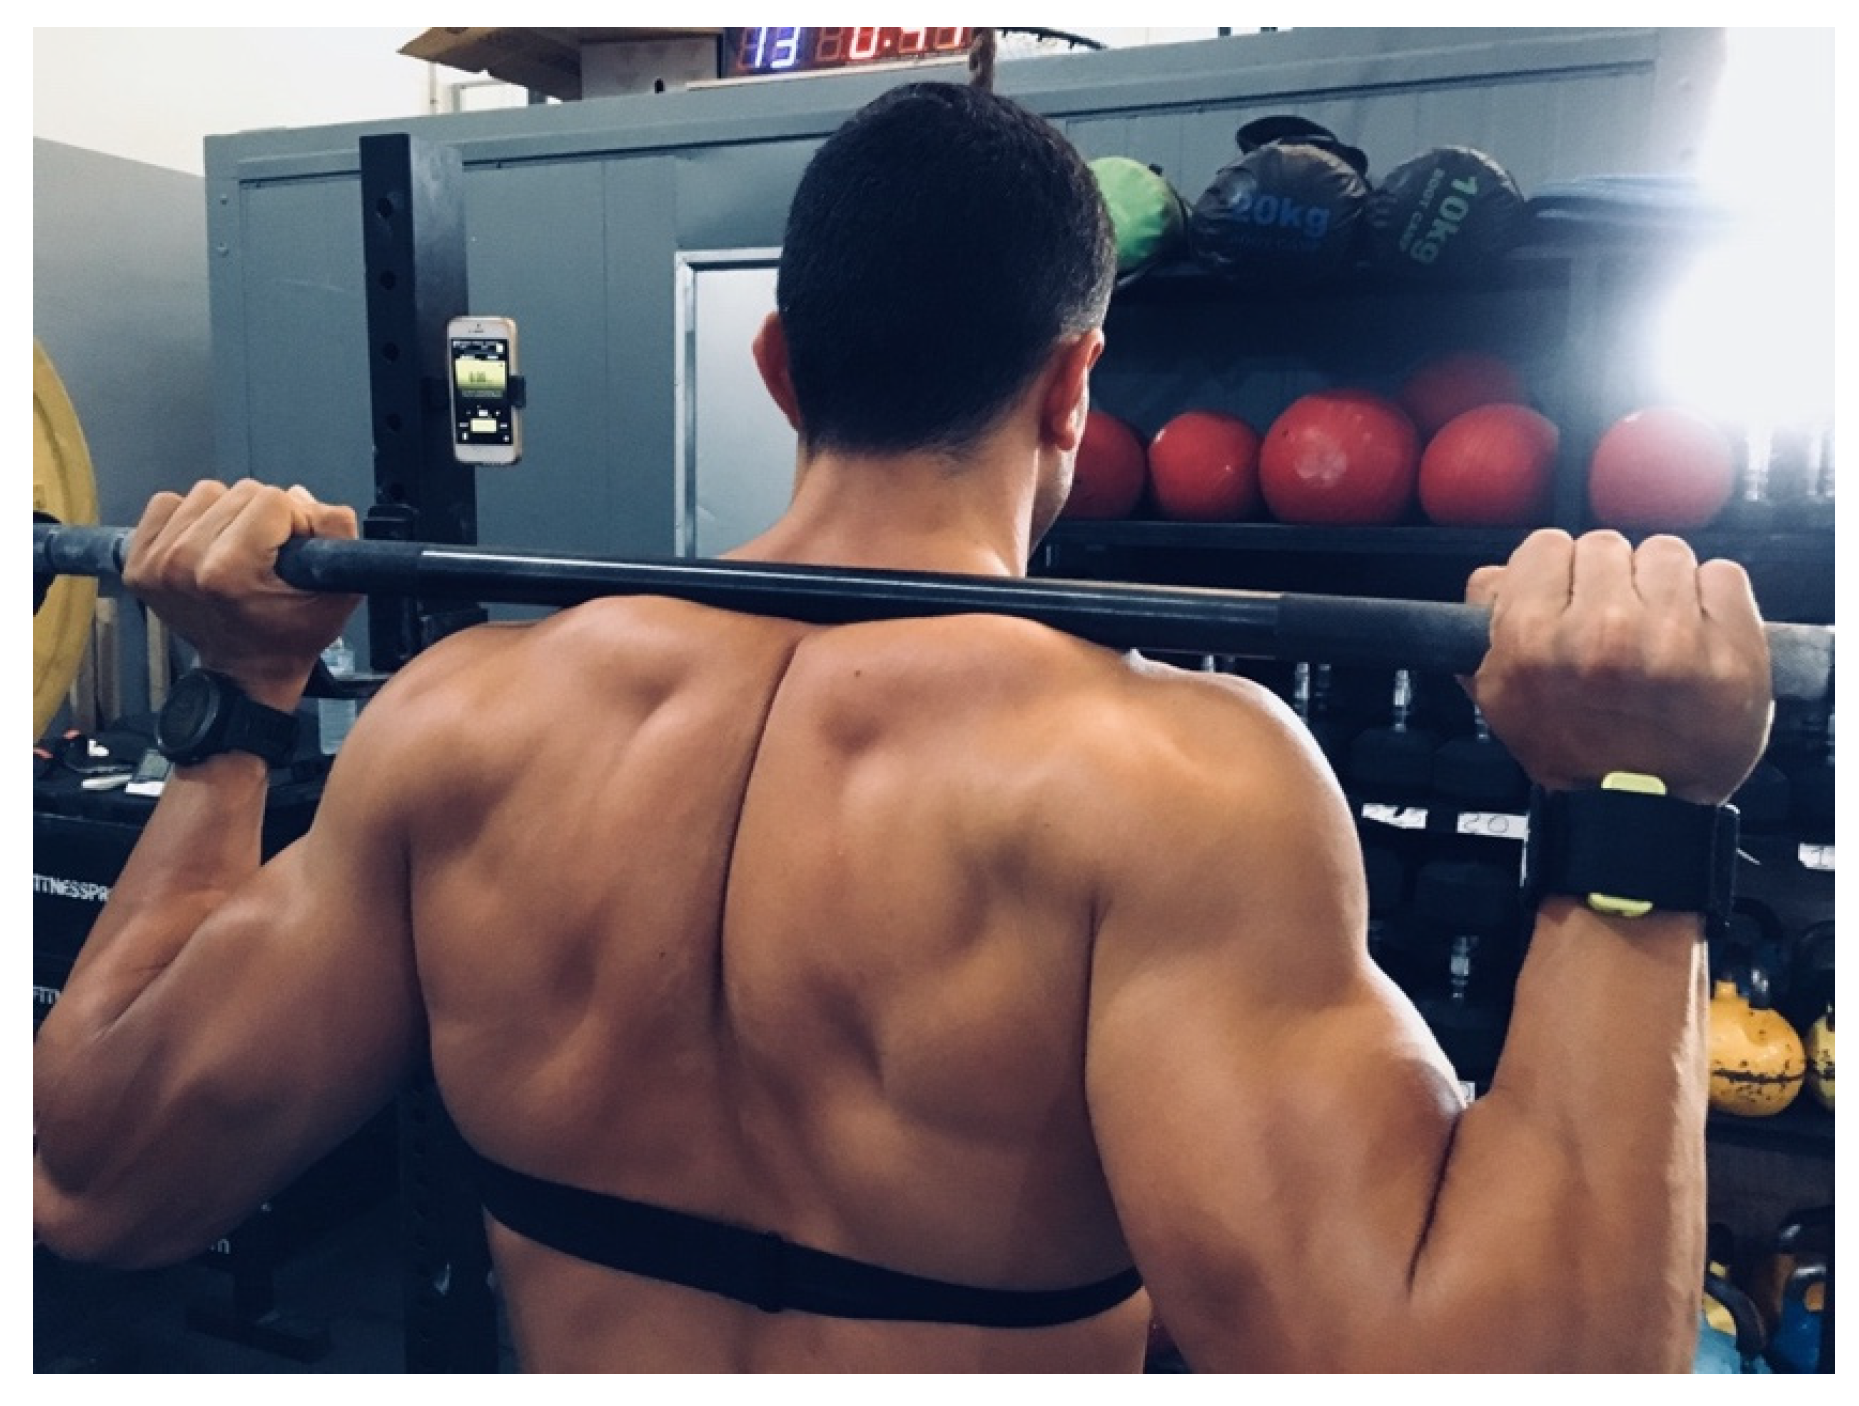
Anaerobic Squat Test (AST60 and AST70)
Repeated Jump Test (RJT)
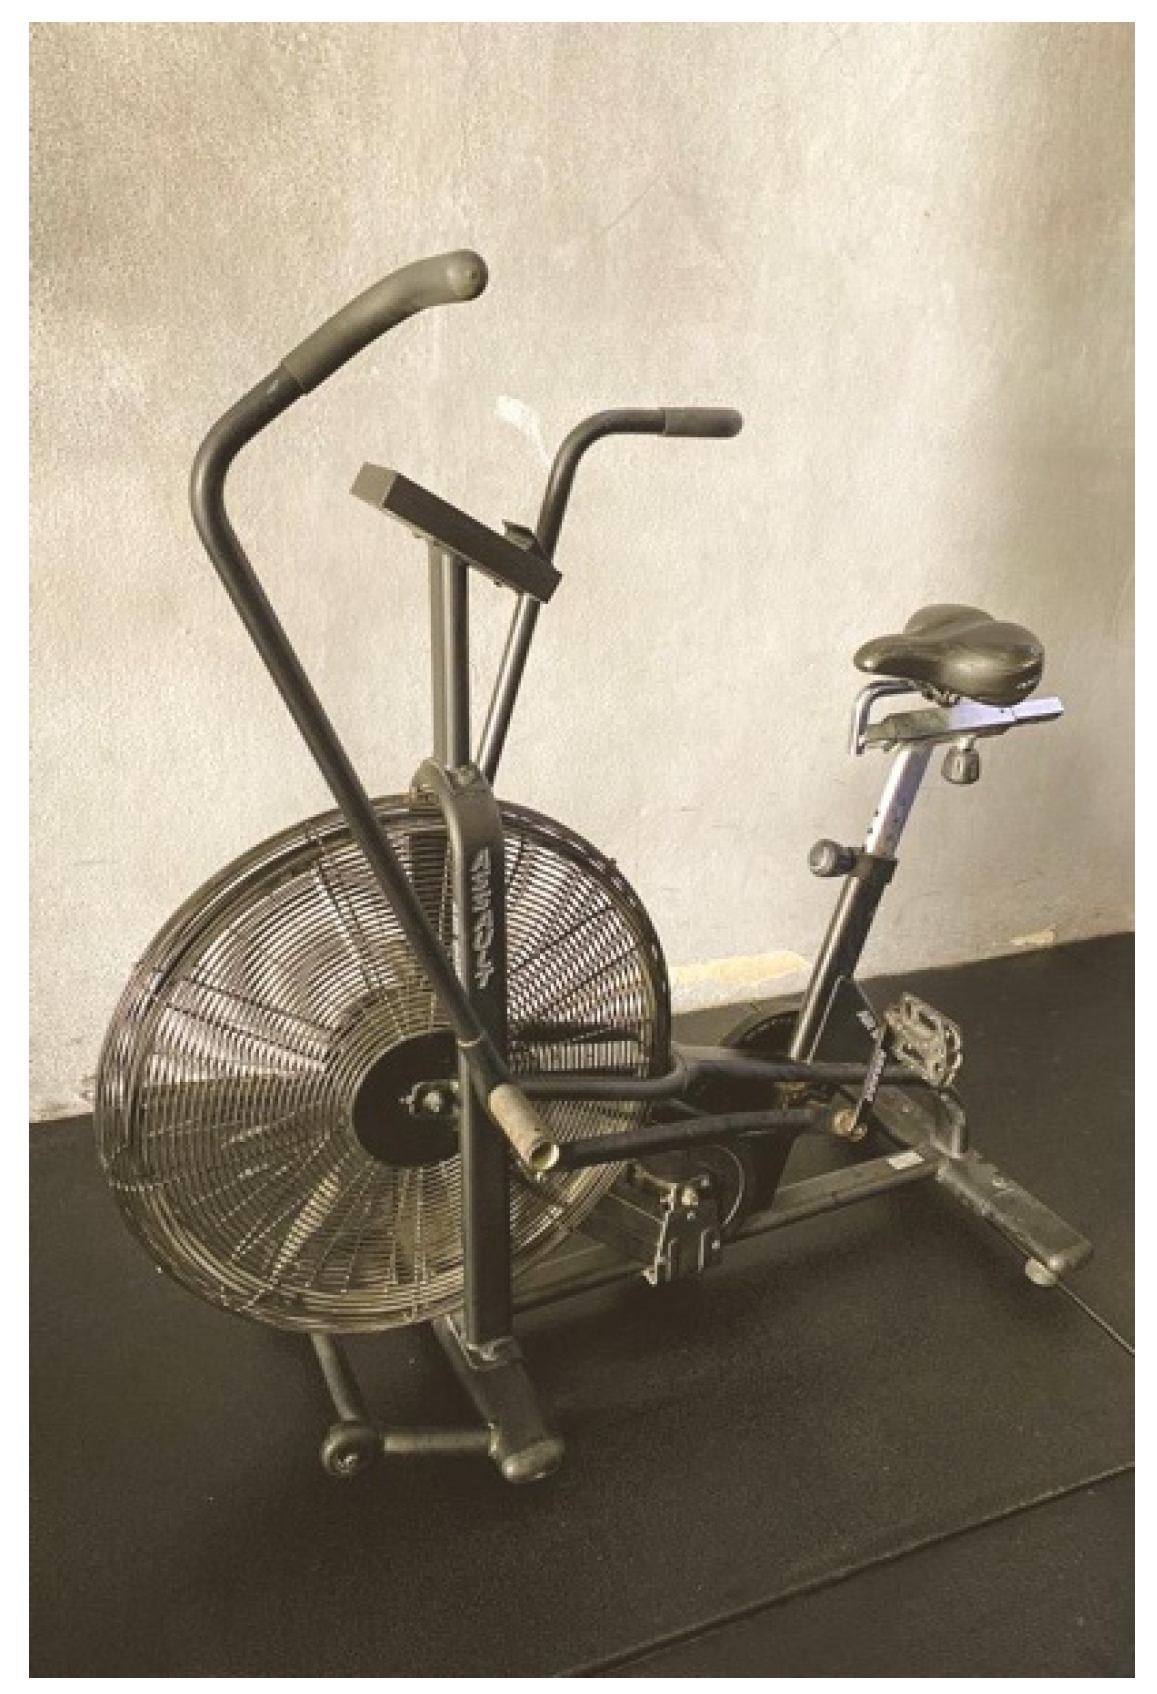
Assault Bike Test (ABT)
Wingate Anaerobic Test (WG)
2.4. Statistical Analysis
3. Results
4. Discussion
5. Conclusions
Author Contributions
Funding
Institutional Review Board Statement
Informed Consent Statement
Data Availability Statement
Acknowledgments
Conflicts of Interest
References
- Green, S. A definition and systems view of anaerobic capacity. J. Appl. Physiol. 1994, 69, 168–173. [Google Scholar] [CrossRef] [PubMed]
- Green, S. Measurement of Anaerobic Work Capacities in Humans. Sports Med. 1995, 19, 32–42. [Google Scholar] [CrossRef] [PubMed]
- Beneke, R.; Pollmann, C.; Bleif, I.; Leithäuser, R.M.; Hütler, H. How anaerobic is the Wingate Anaerobic Test for humans? Eur. J. Appl. Physiol. 2002, 87, 388–392. [Google Scholar] [CrossRef]
- Smith, J.C.; Hill, D.W. Contribution of energy systems during a Wingate power test. Br. J. Sports Med. 1991, 25, 196–199. [Google Scholar] [CrossRef]
- Pupo, J.D.; Gheller, R.G.; Ache-Dias, J.; Rodacki, A.; Moro, A.R.P.; Santos, S.G. Reliability and validity of the 30-s continuous jump test for anaerobic fitness evaluation. J. Sci. Med. Sport 2014, 17, 650–655. [Google Scholar] [CrossRef]
- Vandewalle, H.; Péerès, G.; Monod, H. Standard Anaerobic Exercise Tests. Sports Med. 1987, 4, 268–289. [Google Scholar] [CrossRef]
- Bar-Or, O. The Wingate Anaerobic Test: An Update on Methodology, Reliability and Validity. Sports Med. 1987, 4, 381–394. [Google Scholar] [CrossRef]
- Martínez-Gómez, R.; Valenzuela, P.L.; Alejo, L.B.; Gil-Cabrera, J.; Montalvo-Pérez, A.; Talavera, E.; Lucia, A.; Moral-González, S.; Barranco-Gil, D. Physiological Predictors of Competition Performance in CrossFit Athletes. Int. J. Environ. Res. Public Health 2020, 17, 3699. [Google Scholar] [CrossRef]
- Farley, O.R.L.; Abbiss, C.R.; Sheppard, J.M. Testing Protocols for Profiling of Surfers’ Anaerobic and Aerobic Fitness: A Review. Strength Cond. J. 2016, 38, 52–65. [Google Scholar] [CrossRef]
- Miura, T. Maximum Anaerobic Power in Adult Alpine Ski Racers. Int. J. Sport Health Sci. 2016, 13, 96–101. [Google Scholar] [CrossRef][Green Version]
- Sporis, G.; Jukic, I.; Ostojic, S.; Milanovic, D. Fitness Profiling in Soccer: Physical and Physiologic Characteristics of Elite Players. J. Strength Cond. Res. 2009, 23, 1947–1953. [Google Scholar] [CrossRef]
- Çakir-Atabek, H. Relationship between anaerobic power, vertical jump and aerobic performance in adolescent track and field athletes. J. Phys. Educ. Sport 2014, 14, 643–648. [Google Scholar] [CrossRef]
- Krishnan, A.; Sharma, D.; Bhatt, M.; Dixit, A.; Pradeep, P. Comparison between Standing Broad Jump test and Wingate test for assessing lower limb anaerobic power in elite sportsmen. Med. J. Armed. Forces India 2017, 73, 140–145. [Google Scholar] [CrossRef] [PubMed]
- López-Segovia, M.; Dellal, A.; Chamari, K.; González-Badillo, J.J. Importance of muscle power variables in repeated and single sprint performance in soccer players. J. Hum. Kinet. 2014, 40, 201–211. [Google Scholar] [CrossRef] [PubMed]
- Nikolaidis, P.T.; Afonso, J.; Clemente-Suarez, V.J.; Alvarado, J.R.P.; Driss, T.; Knechtle, B.; Torres-Luque, G. Vertical Jumping Tests versus Wingate Anaerobic Test in Female Volleyball Players: The Role of Age. Sports 2016, 4, 9. [Google Scholar] [CrossRef] [PubMed]
- Sands, W.A.; McNeal, J.R.; Ochi, M.T.; Urbanek, T.L.; Jemni, M.; Stone, M.H. Comparison of the Wingate and Bosco Anaerobic Tests. J. Strength Cond. Res. 2004, 18, 810–815. [Google Scholar] [CrossRef] [PubMed][Green Version]
- Baker, J.; Ramsbottom, R.; Hazeldine, R. Maximal shuttle running over 40 m as a measure of anaerobic performance. Br. J. Sports Med. 1993, 27, 228–232. [Google Scholar] [CrossRef]
- Kimura, I.F.; Stickley, C.D.; Lentz, M.A.; Wages, J.J.; Yanagi, K.; Hetzler, R.K. Validity and Reliability of the Hawaii Anaerobic Run Test. J. Strength Cond. Res. 2014, 28, 1386–1393. [Google Scholar] [CrossRef]
- Fry, A.C.; Kudrna, R.A.; Falvo, M.; Bloomer, R.J.; Moore, C.A.; Schilling, B.K.; Weiss, L.W. Kansas Squat Test: A reliable indicator of short-term anaerobic power. J. Strength Cond. Res. 2014, 28, 630–635. [Google Scholar] [CrossRef]
- Luebbers, P.E.; Fry, A.C. The Kansas Squat Test: A valid and practical measure of anaerobic power for track and field power athletes. J. Strength Cond. Res. 2015, 29, 2716–2722. [Google Scholar] [CrossRef]
- Theophilos, P.; Nikolaos, M.; Athanasia, S.; Georgios, Z.; Michail, P. Validity evaluation of a new anaerobic performance field test. J. Phys. Educ. Sport 2016, 16, 28–32. [Google Scholar] [CrossRef]
- Zagatto, A.; Beck, W.; Gobatto, C. Validity of the Running Anaerobic Sprint Test for Assessing Anaerobic Power and Predicting Short-Distance Performances. J. Strength Cond. Res. 2009, 23, 1820–1827. [Google Scholar] [CrossRef]
- Legaz-Arrese, A.; Izquierdo, D.M.; Carranza-García, L.E.; Torres-Dávila, C.G. Validity of the Wingate Anaerobic Test for the Evaluation of Elite Runners. J. Strength Cond. Res. 2011, 25, 819–824. [Google Scholar] [CrossRef] [PubMed]
- Inoue, A.; Filho, A.S.; Mello, F.C.; Santos, T. Relationship between Anaerobic Cycling Tests and Mountain Bike Cross-Country Performance. J. Strength Cond. Res. 2012, 26, 1589–1593. [Google Scholar] [CrossRef] [PubMed]
- Queiroga, M.R.; Cavazzotto, T.G.; Katayama, K.Y.; Portela, B.S.; Tartaruga, M.P.; Ferreira, S.A. Validity of the RAST for evaluating anaerobic power performance as compared to Wingate test in cycling athletes. Mot. Rev. Educ. Física 2013, 19, 696–702. [Google Scholar] [CrossRef][Green Version]
- Thompson, W.R. Worldwide survey of fitness trends for 2018: The CREP Edition. ACSM’s Health Fit. J. 2017, 21, 10–19. [Google Scholar] [CrossRef]
- Kercher, V.M.; Kercher, K.; Bennion, T.; Yates, B.A.; Feito, Y.; Alexander, C.; Amaral, P.C.; Soares, W.; Li, Y.-M.; Han, J.; et al. Fitness Trends from Around the Globe. ACSM’s Health Fit. J. 2021, 25, 20–31. [Google Scholar] [CrossRef]
- Feito, Y.; Heinrich, K.M.; Butcher, S.J.; Poston, W.S.C. High-Intensity Functional Training (HIFT): Definition and Research Implications for Improved Fitness. Sports 2018, 6, 76. [Google Scholar] [CrossRef]
- Mangine, G.T.; Stratton, M.T.; Almeda, C.G.; Roberts, M.D.; Esmat, T.A.; VanDusseldorp, T.A.; Feito, Y. Physiological differences between advanced CrossFit athletes, recreational CrossFit participants, and physically-active adults. PLoS ONE 2020, 15, e0223548. [Google Scholar] [CrossRef]
- Dexheimer, J.D.; Schroeder, E.T.; Sawyer, B.J.; Pettitt, R.W.; Aguinaldo, A.L.; Torrence, W.A. Physiological Performance Measures as Indicators of CrossFit® Performance. Sports 2019, 7, 93. [Google Scholar] [CrossRef] [PubMed]
- Zeitz, E.K.; Cook, L.F.; Dexheimer, J.D.; Lemez, S.; Leyva, W.D.; Terbio, I.Y.; Tran, J.R.; Jo, E. The Relationship between CrossFit® Performance and Laboratory-Based Measurements of Fitness. Sports 2020, 8, 112. [Google Scholar] [CrossRef]
- Shaw, S.B.; Dullabh, M.; Forbes, G.; Brandkamp, J.-L.; Shaw, I. Analysis of physiological determinants during a single bout of Crossfit. Int. J. Perform. Anal. Sport 2015, 15, 809–815. [Google Scholar] [CrossRef]
- Mangine, G.T.; Tankersley, J.E.; McDougle, J.M.; Velazquez, N.; Roberts, M.D.; Esmat, T.A.; VanDusseldorp, T.A.; Feito, Y. Predictors of CrossFit Open Performance. Sports 2020, 8, 102. [Google Scholar] [CrossRef]
- Butcher, S.; Neyedly, T.; Horvey, K.; Benko, C. Do physiological measures predict selected CrossFit® benchmark performance? Open Access J. Sports Med. 2015, 6, 241–247. [Google Scholar] [CrossRef] [PubMed]
- Escobar, K.A.; Morales, J.; VanDusseldorp, T.A. Metabolic profile of a crossfit training bout. J. Hum. Sport Exerc. 2017, 12, 1248–1255. [Google Scholar] [CrossRef]
- Souissi, N.; Driss, T.; Chamari, K.; Vandewalle, H.; Davenne, D.; Gam, A.; Fillard, J.-R.; Jousselin, E. Diurnal variation in Wingate test performances: Influence of active warm-up. Chronobiol. Int. 2010, 27, 640–652. [Google Scholar] [CrossRef]
- Alvero-Cruz, J.R.; Cabanas Armesilla, M.D.; Herrero De Lucas, A.; Martínez Riaza, L.; Moreno Pascual, C.; Porta Manzañido, J.; Sillero Quintana, M.; Sirvent Belando, J.E. Protocolo de Valoración de la Composición Corporal Para el Reconocimiento Médi-Co-Deportivo. Documento de Consenso del Grupo Español de Cineantropometría (Grec) de la Federación Española de Medicina del Deporte (Femede). Versión 2010. Arch. Med. Deport. 2010, 26, 330–344. Available online: https://www.academia.edu/download/40094596/A_JJ_2010_Documento_de_consenso_330_139.pdf (accessed on 25 September 2020).
- Kyle, U.G.; Bosaeus, I.; De Lorenzo, A.D.; Deurenberg, P.; Elia, M.; Gómez, J.M.; Heitmann, B.L.; Kent-Smith, L.; Melchior, J.-C.; Pirlich, M.; et al. Bioelectrical impedance analysis—Part II: Utilization in clinical practice. Clin. Nutr. 2004, 23, 1430–1453. [Google Scholar] [CrossRef] [PubMed]
- Segal, K.R.; Van Loan, M.; Fitzgerald, P.; Hodgdon, J.; Van Itallie, T.B. Lean body mass estimation by bioelectrical impedance analysis: A four-site cross-validation study. Am. J. Clin. Nutr. 1988, 47, 7–14. [Google Scholar] [CrossRef]
- Janssen, I.; Heymsfield, S.B.; Baumgartner, R.N.; Ross, R. Estimation of skeletal muscle mass by bioelectrical impedance analysis. J. Appl. Physiol. 2000, 89, 465–471. [Google Scholar] [CrossRef]
- Balsalobre-Fernández, C.; Marchante, D.; Baz-Valle, E.; Alonso-Molero, I.; Jimenez, S.L.; Muñóz-López, M. Analysis of Wearable and Smartphone-Based Technologies for the Measurement of Barbell Velocity in Different Resistance Training Exercises. Front. Physiol. 2017, 8, 649. [Google Scholar] [CrossRef] [PubMed]
- Garnacho-Castaño, M.V.; Faundez-Zanuy, M.; Serra-Payá, N.; Maté-Muñoz, J.L.; López-Xarbau, J.; Vila-Blanch, M. Reliability and Validity of the Polar V800 Sports Watch for Estimating Vertical Jump Height. J. Sports Sci. Med. 2021, 20, 149–157. [Google Scholar] [CrossRef]
- Bland, J.M.; Altman, D. Statistical methods for assessing agreement between two methods of clinical measurement. Lancet 1986, 327, 307–310. [Google Scholar] [CrossRef]
- Rocha, F.; Louro, H.; Matias, R.; Costa, A. Anaerobic fitness assessment in taekwondo athletes. A new perspective. Motricidade 2016, 12, 127. [Google Scholar] [CrossRef]
- Gacesa, J.Z.P.; Barak, O.; Grujic, N.G. Maximal Anaerobic Power Test in Athletes of Different Sport Disciplines. J. Strength Cond. Res. 2009, 23, 751–755. [Google Scholar] [CrossRef]
- Pojskić, H.; Šeparović, V.; Užičanin, E.; Muratović, M.; Mačković, S. Positional Role Differences in the Aerobic and Anaerobic Power of Elite Basketball Players. J. Hum. Kinet. 2015, 49, 219–227. [Google Scholar] [CrossRef] [PubMed]


| Mean | SD | |
|---|---|---|
| Age (years) | 28.63 | 6.62 |
| Height (cm) | 176.18 | 5.34 |
| Body Mass (kg) | 81.67 | 6.43 |
| Body Mass Index (kg/m2) | 26.29 | 1.34 |
| Fat Mass (kg) | 24.71 | 6.35 |
| Fat Mass (%) | 20.10 | 5.18 |
| Muscle Mass (kg) | 35.03 | 3.74 |
| Muscle Mass (%) | 42.87 | 2.69 |
| Lean Body Mass (kg) | 56.95 | 10.02 |
| Lean Body Mass (%) | 79.90 | 5.18 |
| PP | XP | MP | FI | |||||||||
|---|---|---|---|---|---|---|---|---|---|---|---|---|
| Mean (±SD) | p | d | Mean (±SD) | p | d | Mean (±SD) | p | d | Mean (±SD) | p | d | |
| AST60 | 668.84 (±98.05) | 0.001 | 1.11 | 563.59 (±91.06) | 0.001 | 1.20 | 447.63 (±98.64) | 0.007 | 0.94 | 33.47 (±8.78) | 1.0 | 0.30 |
| AST70 | 703.79 (±112.94) | 0.052 | 0.73 | 596.28 (±121.61) | 0.182 | 0.60 | 485.58 (±111.84) | 0.627 | 0.46 | 31.43 (±10.03) | 1.0 | 0.13 |
| RJT | 1122.11 (±97.70) | <0.001 | 5.40 | 1057.90 (±154.65) | <0.001 | 3.56 | 921.95 (±113.29) | <0.001 | 4.69 | 17.79 (±7.25) | <0.001 | 1.39 |
| ABT | 1242.47 (±249.82) | <0.001 | 2.68 | 950.71 (±151.36) | <0.001 | 2.82 | 803.84 (±89.51) | <0.001 | 3.99 | 33.73 (±9.98) | 0.570 | 0.47 |
| WG | 778.89 (±102.30) | 664.66 (±73.08) | 541.74 (±50.42) | 29.71 (±8.39) | ||||||||
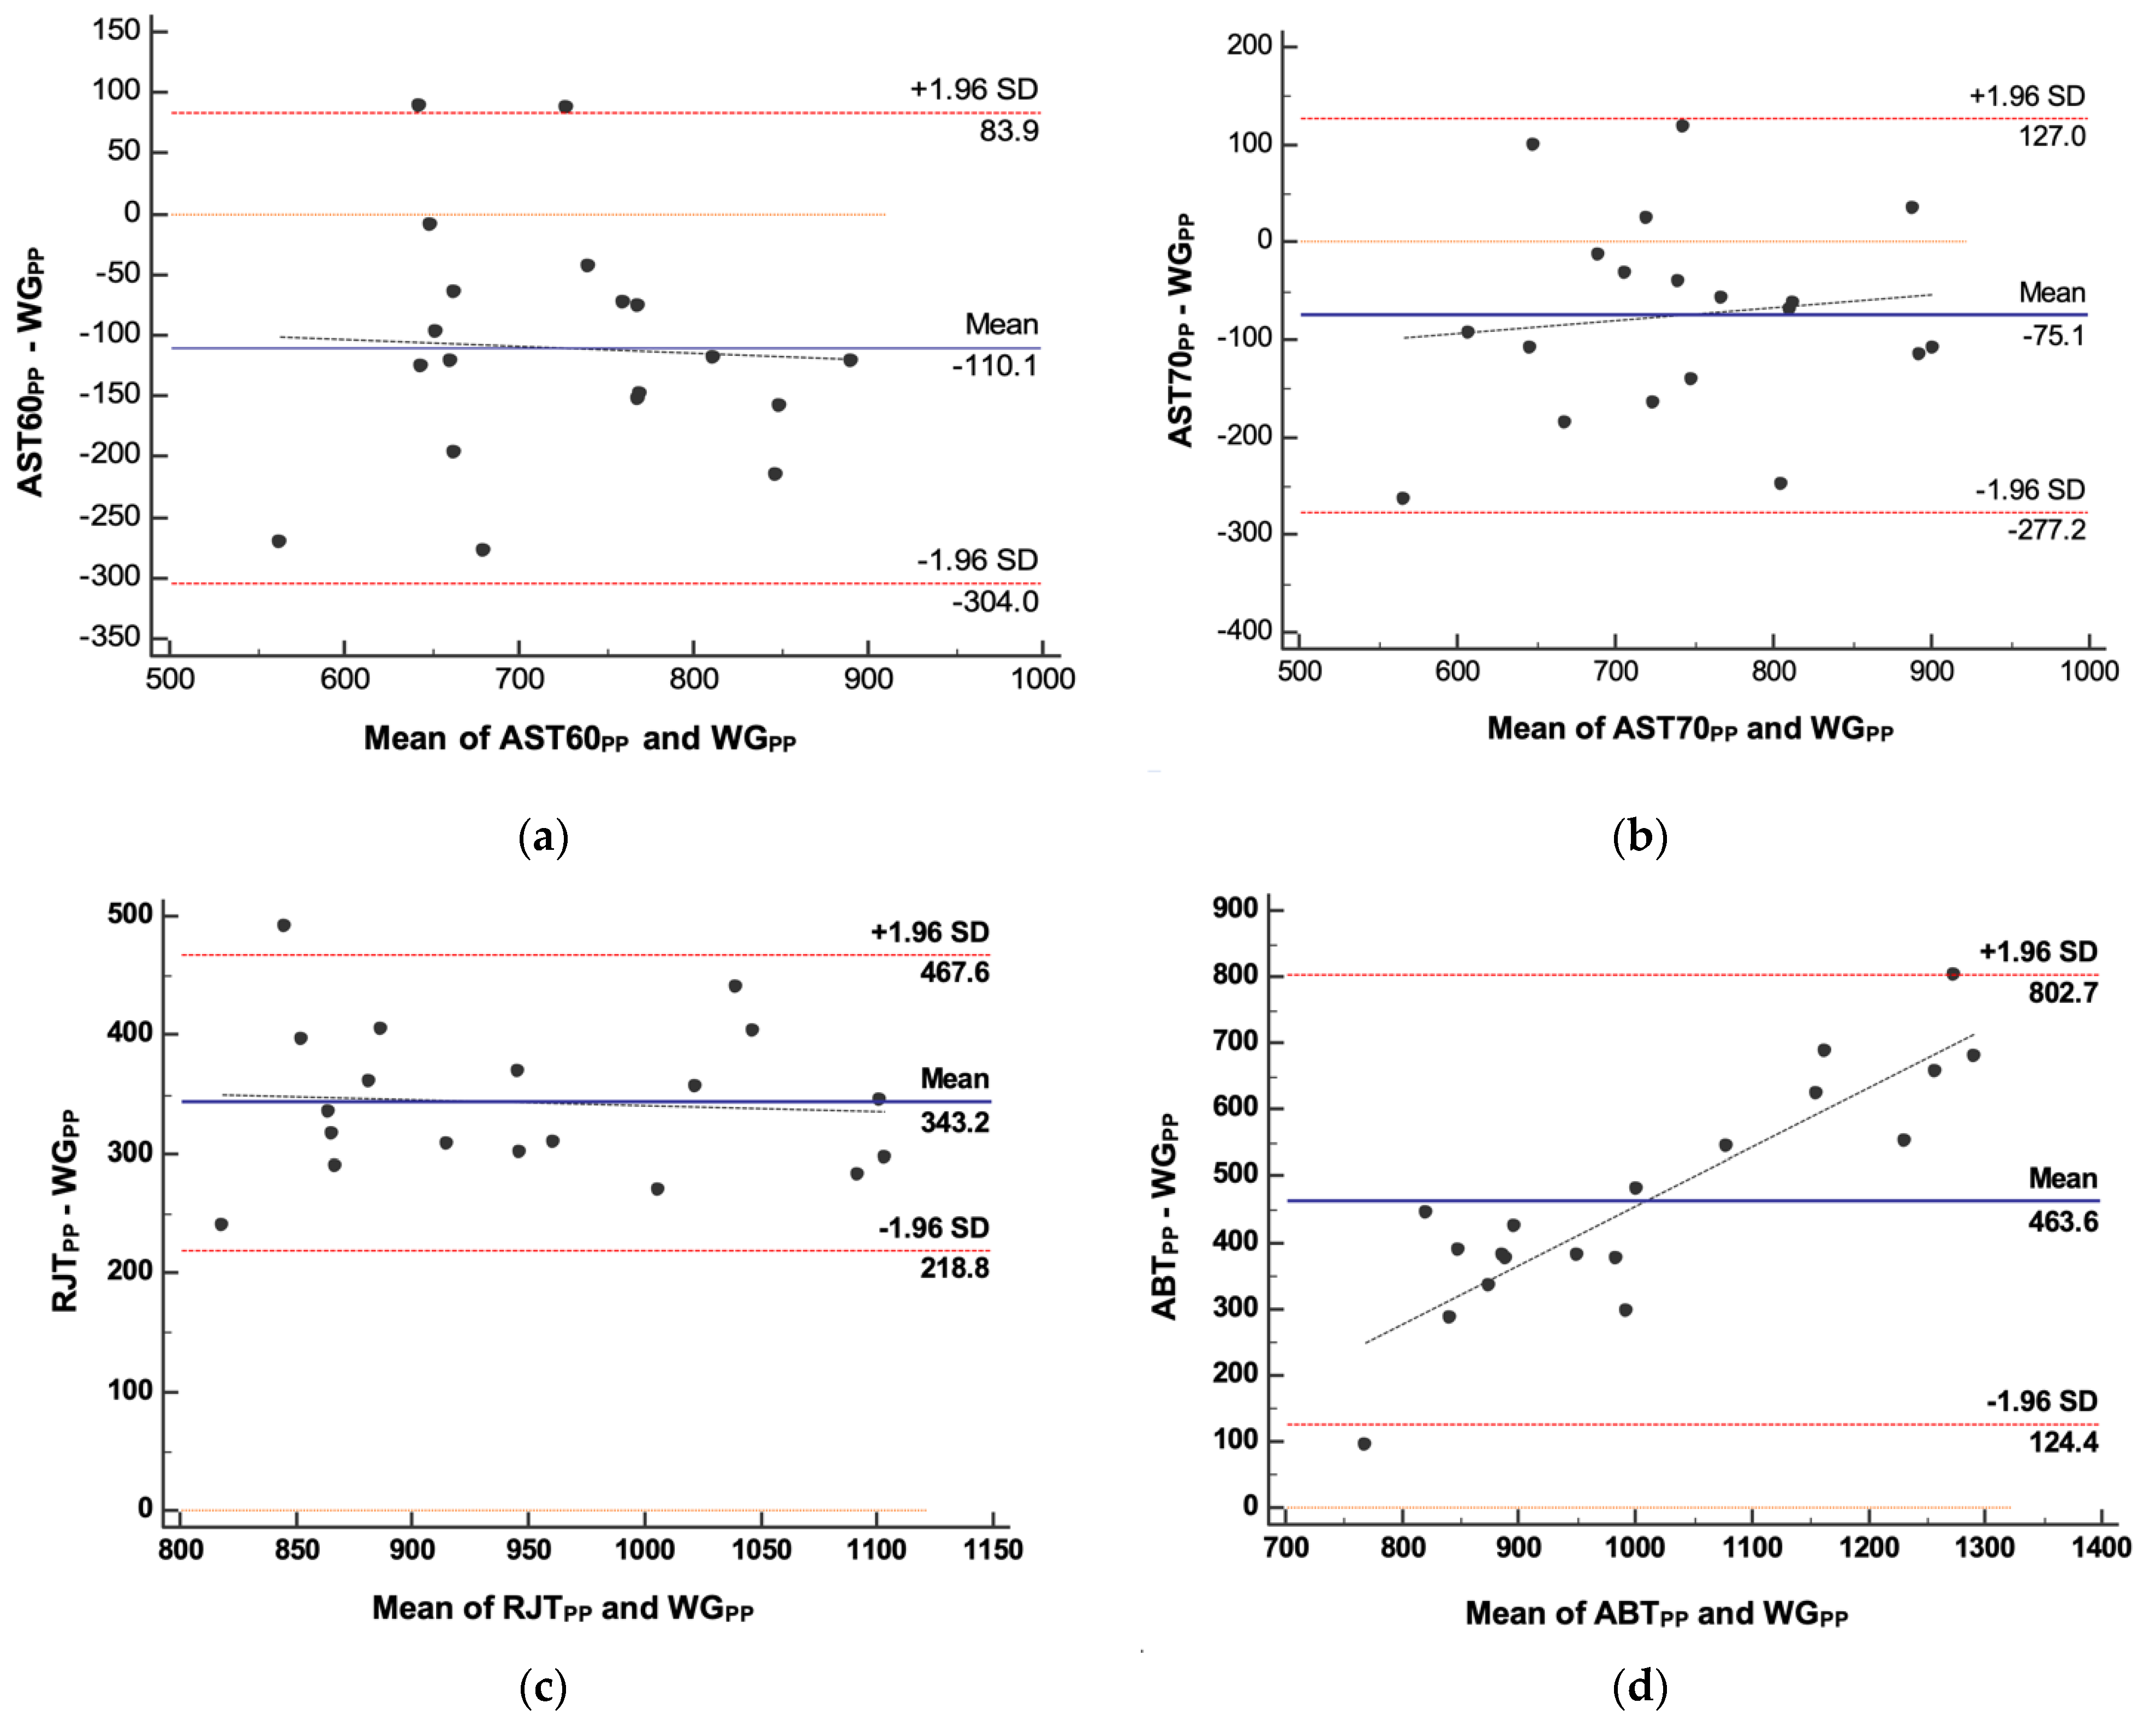
| Methods | Bias | Limits of Agreement | Kendall’s Tau | Absolute Percentage Error | ||||||
|---|---|---|---|---|---|---|---|---|---|---|
| Diff | 95% CI | p | Lower | 95% CI | Upper | 95% CI | p | Median | 95% CI | |
| AST60—WG | −110.05 | −157.74 to −62.36 | 0.0001 | −303.98 | −386.95 to −221.00 | 83.87 | 0.90 to 166.85 | 0.25 | 14.86% | 12.00 to 17.77 |
| AST70—WG | −75.11 | −124.80 to −25.41 | 0.0052 | −277.19 | −363.65 to −190.72 | 126.98 | 40.51 to 213.44 | 0.89 | 12.20% | 6.87 to 17.22 |
| RJT—WG | 343.22 | 312.63 to 373.80 | <0.0001 | 218.84 | 165.62 to 272.06 | 467.59 | 414.38 to 520.81 | 0.58 | 42.19% | 37.65 to 49.16 |
| ABT—WG | 463.58 | 380.18 to 546.98 | <0.0001 | 124.44 | −20.67 to 269.55 | 802.72 | 657.61 to 947.83 | <0.001 | 59.48% | 49.41 to 70.87 |
Publisher’s Note: MDPI stays neutral with regard to jurisdictional claims in published maps and institutional affiliations. |
© 2021 by the authors. Licensee MDPI, Basel, Switzerland. This article is an open access article distributed under the terms and conditions of the Creative Commons Attribution (CC BY) license (https://creativecommons.org/licenses/by/4.0/).
Share and Cite
Ponce-García, T.; Benítez-Porres, J.; García-Romero, J.C.; Castillo-Domínguez, A.; Alvero-Cruz, J.R. The Anaerobic Power Assessment in CrossFit® Athletes: An Agreement Study. Int. J. Environ. Res. Public Health 2021, 18, 8878. https://doi.org/10.3390/ijerph18168878
Ponce-García T, Benítez-Porres J, García-Romero JC, Castillo-Domínguez A, Alvero-Cruz JR. The Anaerobic Power Assessment in CrossFit® Athletes: An Agreement Study. International Journal of Environmental Research and Public Health. 2021; 18(16):8878. https://doi.org/10.3390/ijerph18168878
Chicago/Turabian StylePonce-García, Tomás, Javier Benítez-Porres, Jerónimo Carmelo García-Romero, Alejandro Castillo-Domínguez, and José Ramón Alvero-Cruz. 2021. "The Anaerobic Power Assessment in CrossFit® Athletes: An Agreement Study" International Journal of Environmental Research and Public Health 18, no. 16: 8878. https://doi.org/10.3390/ijerph18168878
APA StylePonce-García, T., Benítez-Porres, J., García-Romero, J. C., Castillo-Domínguez, A., & Alvero-Cruz, J. R. (2021). The Anaerobic Power Assessment in CrossFit® Athletes: An Agreement Study. International Journal of Environmental Research and Public Health, 18(16), 8878. https://doi.org/10.3390/ijerph18168878