Article

Validation of a Brief Screening Instrument for Chemical Intolerance in a Large U.S. National Sample

1
Department of Family and Community Medicine, University of Texas Health Science Center San Antonio, 7703 Floyd Curl Drive, San Antonio, TX 78229, USA
2
Hayward Score, Carmel, CA 93921, USA
*
Author to whom correspondence should be addressed.
Int. J. Environ. Res. Public Health 2021, 18(16), 8714; https://doi.org/10.3390/ijerph18168714
Submission received: 23 June 2021 / Revised: 10 August 2021 / Accepted: 12 August 2021 / Published: 18 August 2021
(This article belongs to the Section Public Health Statistics and Risk Assessment)

Abstract

:
Background: Chemical intolerance (CI) is characterized by multisystem symptoms triggered by low levels of exposure to xenobiotics including chemicals, foods/food additives, and drugs/medications. Prior prevalence estimates vary from 8–33% worldwide. Clinicians and researchers need a brief, practical screening tool for identifying possible chemical intolerance. This large, population-based study describes the validation of a three-item screening questionnaire, the Brief Environmental Exposure and Sensitivity Inventory (BREESI), against the international reference standard used for assessing chemical intolerance, the Quick Environmental Exposure and Sensitivity Inventory (QEESI). Methods: More than 10,000 people in the U.S. responded to the BREESI and the QEESI in a population-based survey. We calculated the overall prevalence of CI in this sample, as well as by gender, age, and income. Common statistical metrics were used to evaluate the BREESI as a screener for CI against the QEESI. Results: The prevalence estimate for QEESI-defined chemical intolerance in the U.S. was 20.39% (95% CI 19.63–21.15%). The BREESI had 91.26% sensitivity (95% CI: 89.20–93.04%) and 92.89% specificity (95% CI: 91.77–93.90%). The positive likelihood ratio was 12.83 (95% CI: 11.07–14.88), and the negative likelihood ratio was 0.09 (95% CI: 0.08–0.12). Logistic regression demonstrates that the predicted probability of CI increased sharply with each increase in the number of BREESI items endorsed (Odds Ratio: 5.3, 95% CI: 4.90–5.75). Conclusions: Chemical intolerance may affect one in five people in the U.S. The BREESI is a new, practical instrument for researchers, clinicians, and epidemiologists. As a screening tool, the BREESI offers a high degree of confidence in case ascertainment. We recommend: screen with the BREESI, confirm with the QEESI.

1. Introduction

Chemical Intolerance: International concern over intolerances to chemicals [1,2], foods [3,4], and drugs [5] is increasing. Up to one-quarter of the U.S. population report being either “especially” or “unusually” sensitive to certain chemicals [6]. Population-based surveys in several countries estimate CI prevalence to range between 8% and 33% [2,6,7,8]. Katerndahl et al. [9] found that 20% of patients in a university family medicine clinic reported chemical intolerances. At least one in ten US adults have well-documented food allergies, and one in five report food intolerances [10,11]. A large US electronic medical records study showed that 2.1% of health plan patients reported three or more drug intolerances [12]. Similarly, a UK medical records study showed that among more than 25,000 inpatients with documented drug intolerances, 4.9% had Multiple Drug Intolerance Syndrome, defined as 3 or more adverse reactions to drugs, suggesting cross-intolerances [13].
The Quick Environmental Exposure and Sensitivity Inventory (QEESI), the most widely used clinical screening test and research tool for identifying chemical intolerance (CI), has emerged as an international reference standard (see Table 1). Table 1 shows 72 peer-reviewed journal articles using the QEESI in 16 countries with a total of over 32,000 respondents. Complete references, along with the URLs for each citation, are provided in the Supplementary Material file.
Although the 50-item QEESI can be completed in less than 15 min, clinicians and researchers need a more rapid way to screen for CI, in part because of clinical time constraints and respondent burden [14]. In response, we developed the “Brief Environmental Exposure and Sensitivity Inventory” (BREESI), comprised of three questions derived from the QEESI. We previously published the BREESI’s validity metrics for a sample of 293 individuals from a primary care clinic [14]. In that sample, the BREESI showed excellent positive and negative predictive values (97% and 95% respectively) and good specificity and sensitivity (90% and 87% respectively) as compared with QEESI defined results.

The Brief Environmental Exposure and Sensitivity Inventory (BREESI)

Instructions: Please answer these three questions by checking Yes or No.
  • Do you feel sick when you are exposed to tobacco smoke, certain fragrances, nail polish/remover, engine exhaust, gasoline, air fresheners, pesticides, paint/thinner, fresh tar/asphalt, cleaning supplies, new carpet, or furnishings? By sick, we mean headaches, difficulty thinking, difficulty breathing, weakness, dizziness, upset stomach, etc?
    _Yes _No
  • Are you unable to tolerate or do you have adverse or allergic reactions to any drugs or medications (such as antibiotics, anesthetics, pain relievers, X-ray contrast dye, vaccines, or birth control pills) or to an implant, prosthesis, contraceptive chemical or device, or other medical/surgical/dental material or procedure?
    _Yes _No
  • Are you unable to tolerate or do you have adverse reactions to any foods such as dairy products, wheat, corn, eggs, caffeine, alcoholic beverages, or food additives (such as MSG, food dye)?
    _Yes _No
These three questions help gauge an individual’s tendency to react adversely to diverse substances representing three major exposure categories (chemicals, foods, and drugs) covered by the Quick Environmental Exposure and Sensitivity Inventory (QEESI).
In this manuscript, we present: (1) a new prevalence estimate for chemical intolerance in a large U.S. sample, (2) the BREESI’s screening performance in a much larger, non-clinical, U.S. population-based survey of more than 10,000 individuals, (3) an additional random cohort of 1000 Americans for the purposes of a comparative sensitivity analysis. Here, we provide a detailed evaluation of the BREESI’s sensitivity and specificity, positive and negative predictive values, and likelihood ratios.

2. Materials and Methods

We surveyed US adults ages 18 and older, between 1 June and 2 June 2020, using the SurveyMonkey Audience platform [15]. A description of how respondents were recruited is available at www.surveymonkey.com/mp/audience accessed on 13 August 2021. The 10,981 respondents were randomly selected from nearly 3 million online users of the SurveyMonkey platform. The survey had an abandonment rate of 10.07% and took an average of 4 min 51 s to complete. The modeled error estimate for this survey was +/− 1.37%. The data was weighted for the population sizes of the 50 states plus the District of Columbia, gender, age, race, and income within each census region to match the Census Bureau’s 2015 American Community Survey (ACS) targets.
We included a secondary cohort to further investigate the validity of the BREESI in this large sample. One thousand respondents were randomly recruited by email through the market research company Dynata, a panel (survey) company that provides recruitment services for researchers (www.dynata.com accessed on 13 August 2021). Dynata adheres to the ESOMAR market research code of conduct. Respondents were recruited from Dynata’s nationally representative research panel in each country. The sample was stratified with roughly equal numbers of participants (n = 1000) across seven age bands: 18–19, 20–29, 30–39, 40–49, 50–59, 60–69, and 70 and older. It was also stratified by gender for approximately equal numbers of males and females. Both cohorts responded to the exact same survey as described below, and data were analyzed in the same manner. QEESI and BREESI Scores: The QEESI has 4 scales: Chemical Exposures, Other Exposures, Symptoms, and Life Impact. There is also a 10-item Masking Index which gauges ongoing exposures, such as caffeine, alcohol, or tobacco use, that can affect individuals’ awareness of their intolerances as well as the intensity of their responses to environmental exposures [16,17]. Each scale contains 10 items which are rated from 0 to 10: 0 = “not at all a problem” to 10 = “severe/disabling symptoms.” Scale totals range from 0–100.
There are three QEESI classifications for CI, based on responses to the Chemical Exposures and Symptom Scales. Scores greater than or equal to 40 on both scales are very suggestive of CI. Scores from 20–39 on one or both scales are suggestive of CI. Scores less than 20 on both scales are not suggestive of CI [16,17]. We use these criteria in this study.
We derived the BREESI’s three questions from the chemical, food, and drug items on the QEESI. We compressed the ten chemical exposure items into a single “yes” or “no” question. We summarized the food and drug intolerance items on the QEESI Other Exposures Scale in two “yes” or “no” questions. Our goal was to create a brief but sensitive instrument for assessing CI in clinical settings and epidemiological/research investigations.
Statistical Analysis: We prepared CI prevalence estimates for the entire sample by gender, age, and household income. We calculated standard metrics for testing the validity of a screening instrument [18], namely: sensitivity and specificity, positive and negative predictive values, and likelihood ratios for the BREESI items against the established QEESI categories of very suggestive versus not suggestive.
Specificity, sensitivity, positive predictive values (PPV), and negative predictive values (NPV) are measures that depend upon the prevalence of the clinical event in the population under study [19]. On the other hand, positive likelihood ratios (PLR) and negative likelihood ratios (NLR) do not depend on disease prevalence and are therefore preferred and considered more accurate than NPV and PPV [20]. Therefore, we calculated the likelihood ratios values [21] as:
  • Positive likelihood ratio (PLR): the ratio between the probability of a positive test result given the presence of the disease and the probability of a positive test result given the absence of the disease.
    PLR = True positive rate/False positive rate = Sensitivity/(1-Specificity)
  • Negative likelihood ratio (NLR): the ratio between the probability of a negative test result given the presence of the disease and the probability of a negative test result given the absence of the disease.
    NLR = False negative rate/True negative rate = (1-Sensitivity)/Specificity
A PLR greater than 10 is strong evidence for determining a disease condition is present. Conversely, a NLR less than 0.10 is strong evidence for ruling out a disease condition [22,23]. The accuracy statistic (e.g., the receiver operator curve) indicates an overall performance of the test.
Using logistic regression, we also determined Odds Ratios (OR) with 95% confidence intervals and the c-statistic for the BREESI as a predictor of CI (very suggestive vs not suggestive). Potential confounding variables were included in a multivariate model. All analyses were conducted using SAS statistical software [24].

3. Results

Sample demographics: Among the 10,981 survey respondents, 257 did not complete the QEESI Chemical Exposures or Symptom Scales and were removed from the analysis. Demographics for the 10,724 respondents with complete QEESI data appear in Table 2. To evaluate the sample coverage, we compare our demographics with the American Community Survey (ACS) [25,26]. The final demographic sample we derived was very close (within approximately 10%) to the estimates obtained by the ACS. Our sample has a slight gender and younger participant bias as well as a slightly lower percentage of household incomes over $100,000.
As shown in Table 2, our CI prevalence estimate for this sample, based on the QEESI very suggestive category, is 20.39%. The secondary validity sample yielded a slightly higher prevalence rate of 25.00% (not shown in the table).
Table 3 shows CI prevalence rates by gender, age, and household income. Females were significantly more likely than males to report CI (22.6% vs. 18.21%, p < 0.001). Respondents older than 60 years of age were significantly less likely to have scores very suggestive of CI compared to those 60 years of age or younger (approximately 11 % vs. 23%, p < 0.001). Those in the lower-income categories were more likely to have scores very suggestive of CI than respondents reporting $100,000 or more a year, or those who preferred not to report their household income. Average QEESI scale scores for each QEESI group (not suggestive of CI, suggestive of CI, and very suggestive of CI) are also shown in Table 3. As would be expected, scores of the not suggestive group are very much lower than the other groups, with the very suggestive group having the highest scores on the Chemical Exposures and Symptom Scales (p < 0.001).
BREESI responses: One-third of participants responded “No” to all three BREESI items (n = 3614, 33.7%). Approximately one-third (n = 3320, 30.96%) chose one item only; 21.55% (n = 2311) chose two items; and 13.79% (N = 1479) chose all three. The Venn diagram in Figure 1 shows the overlap and percentage of those who chose at least one BREESI item (n = 7110 or 66% of the total sample). The chemical item accounts for most of the variability. Twenty-one percent of those choosing any item chose all three items.
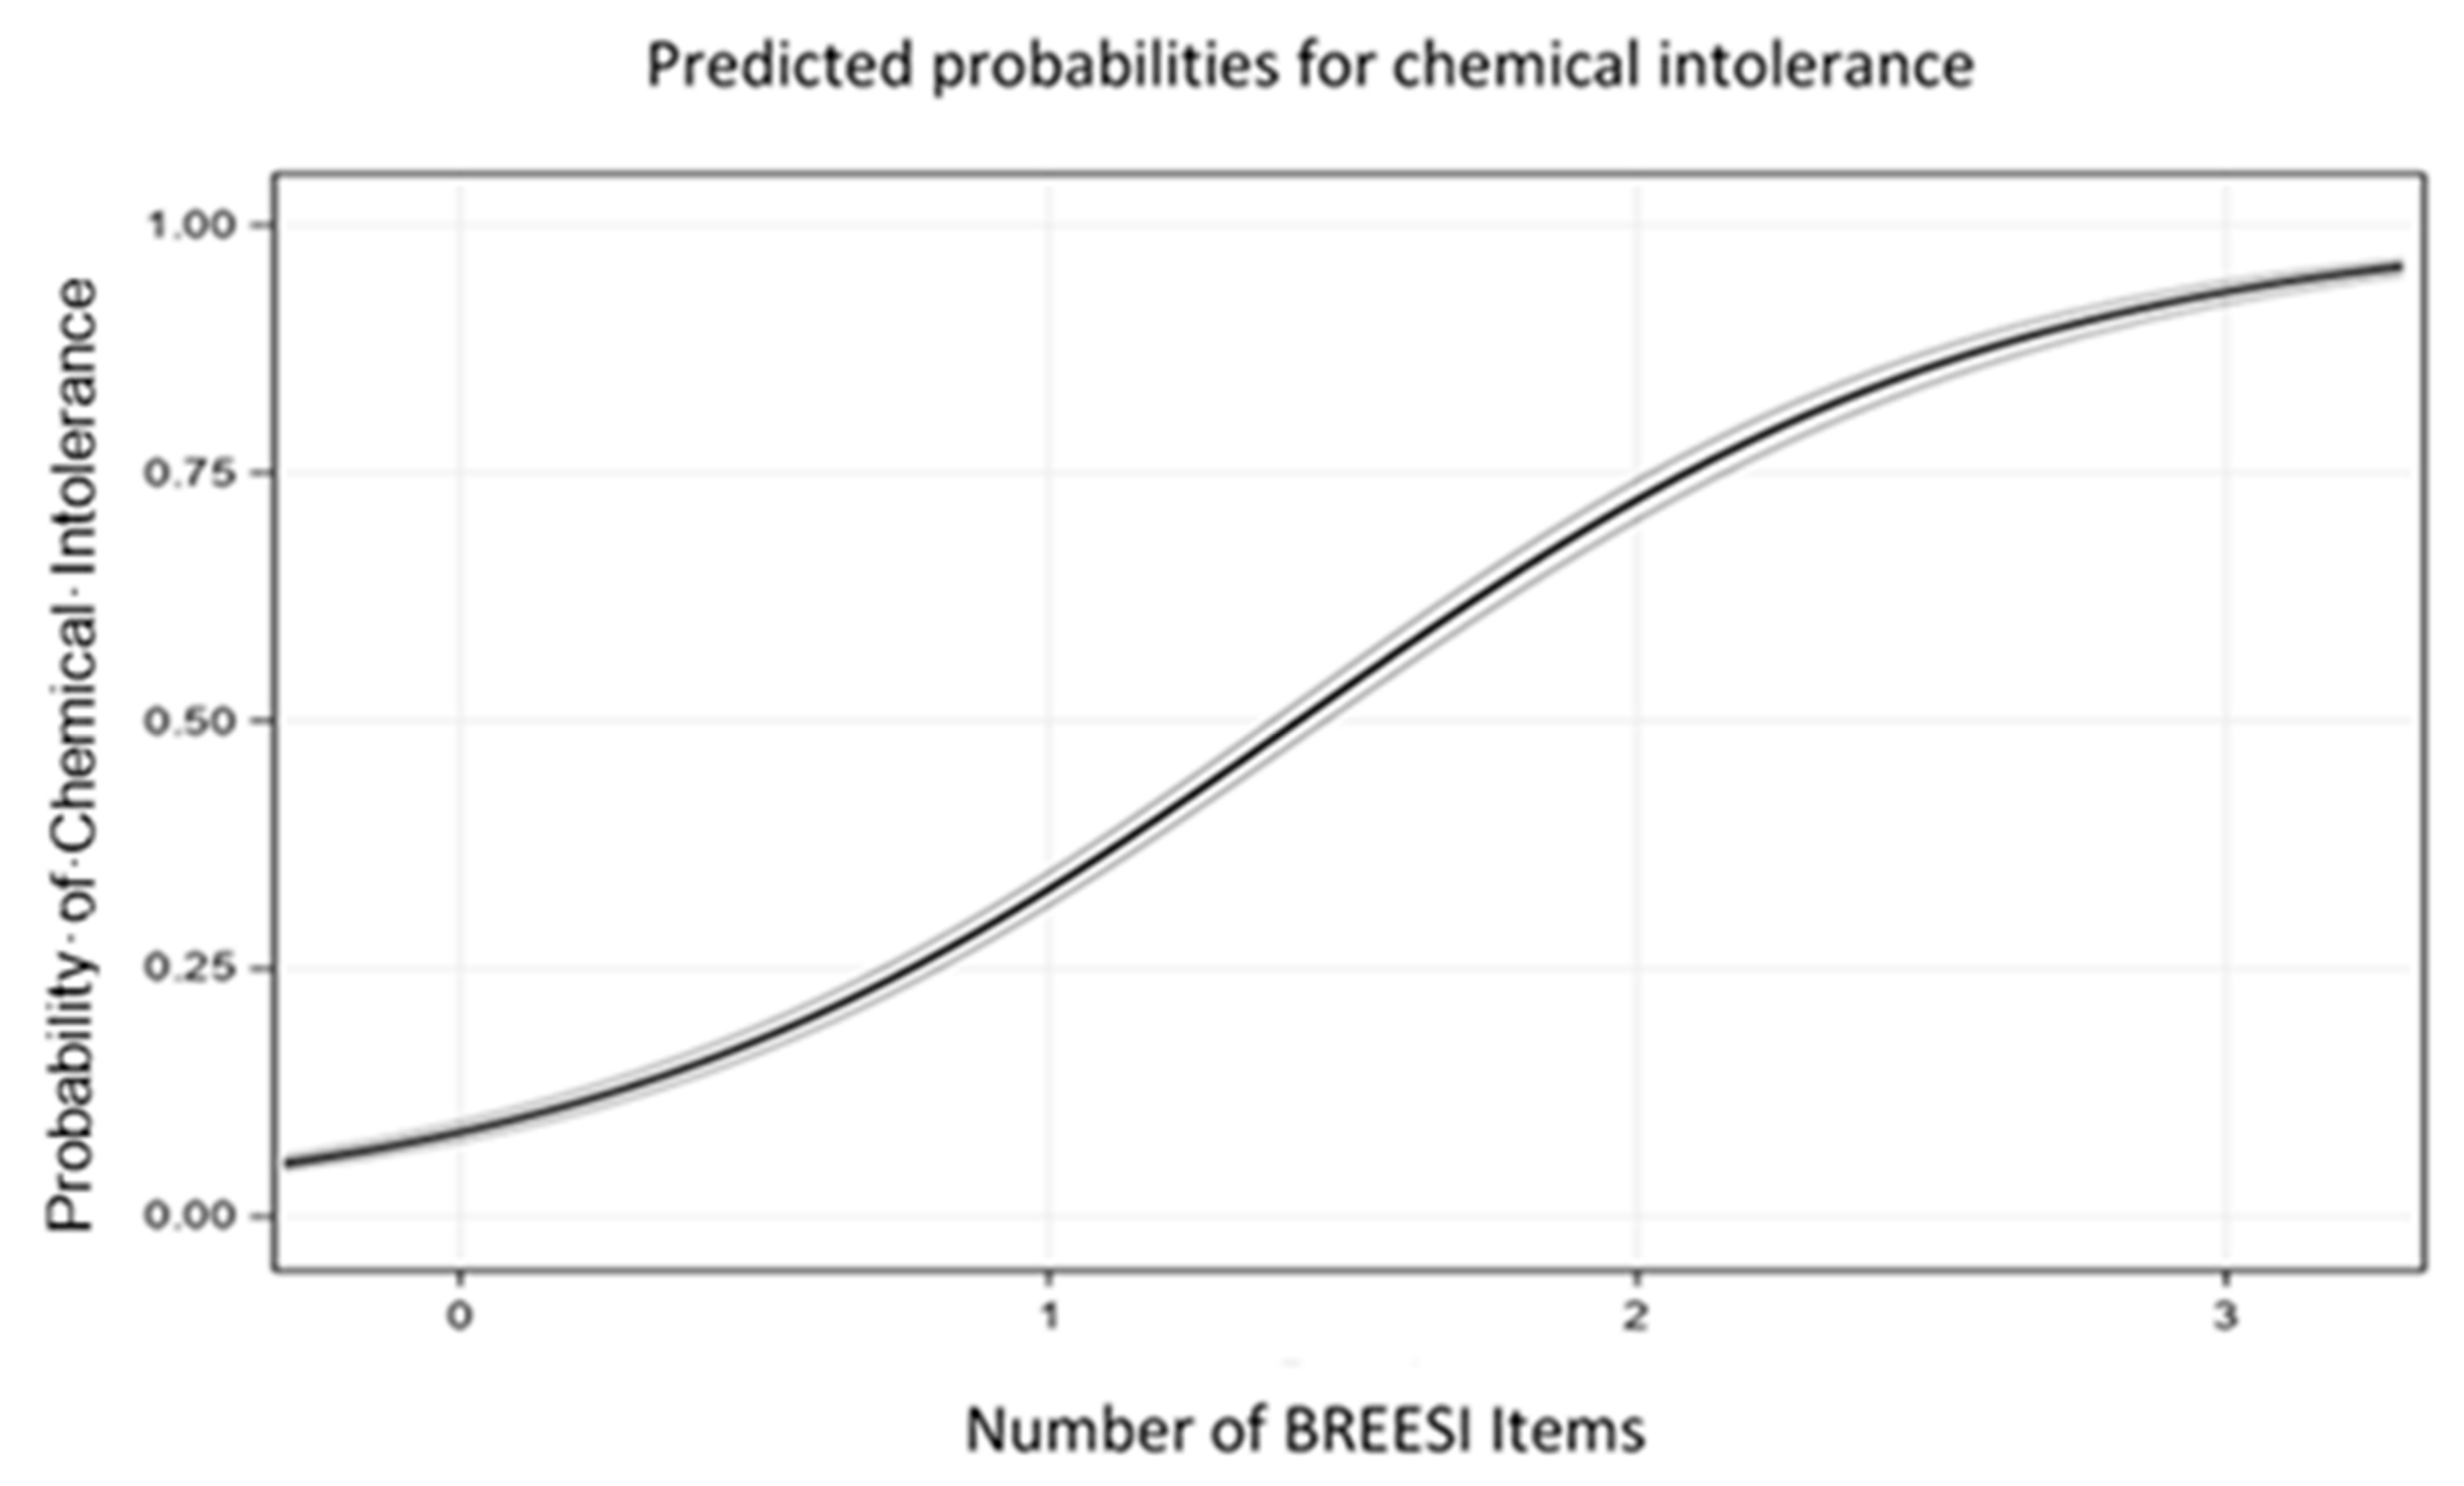
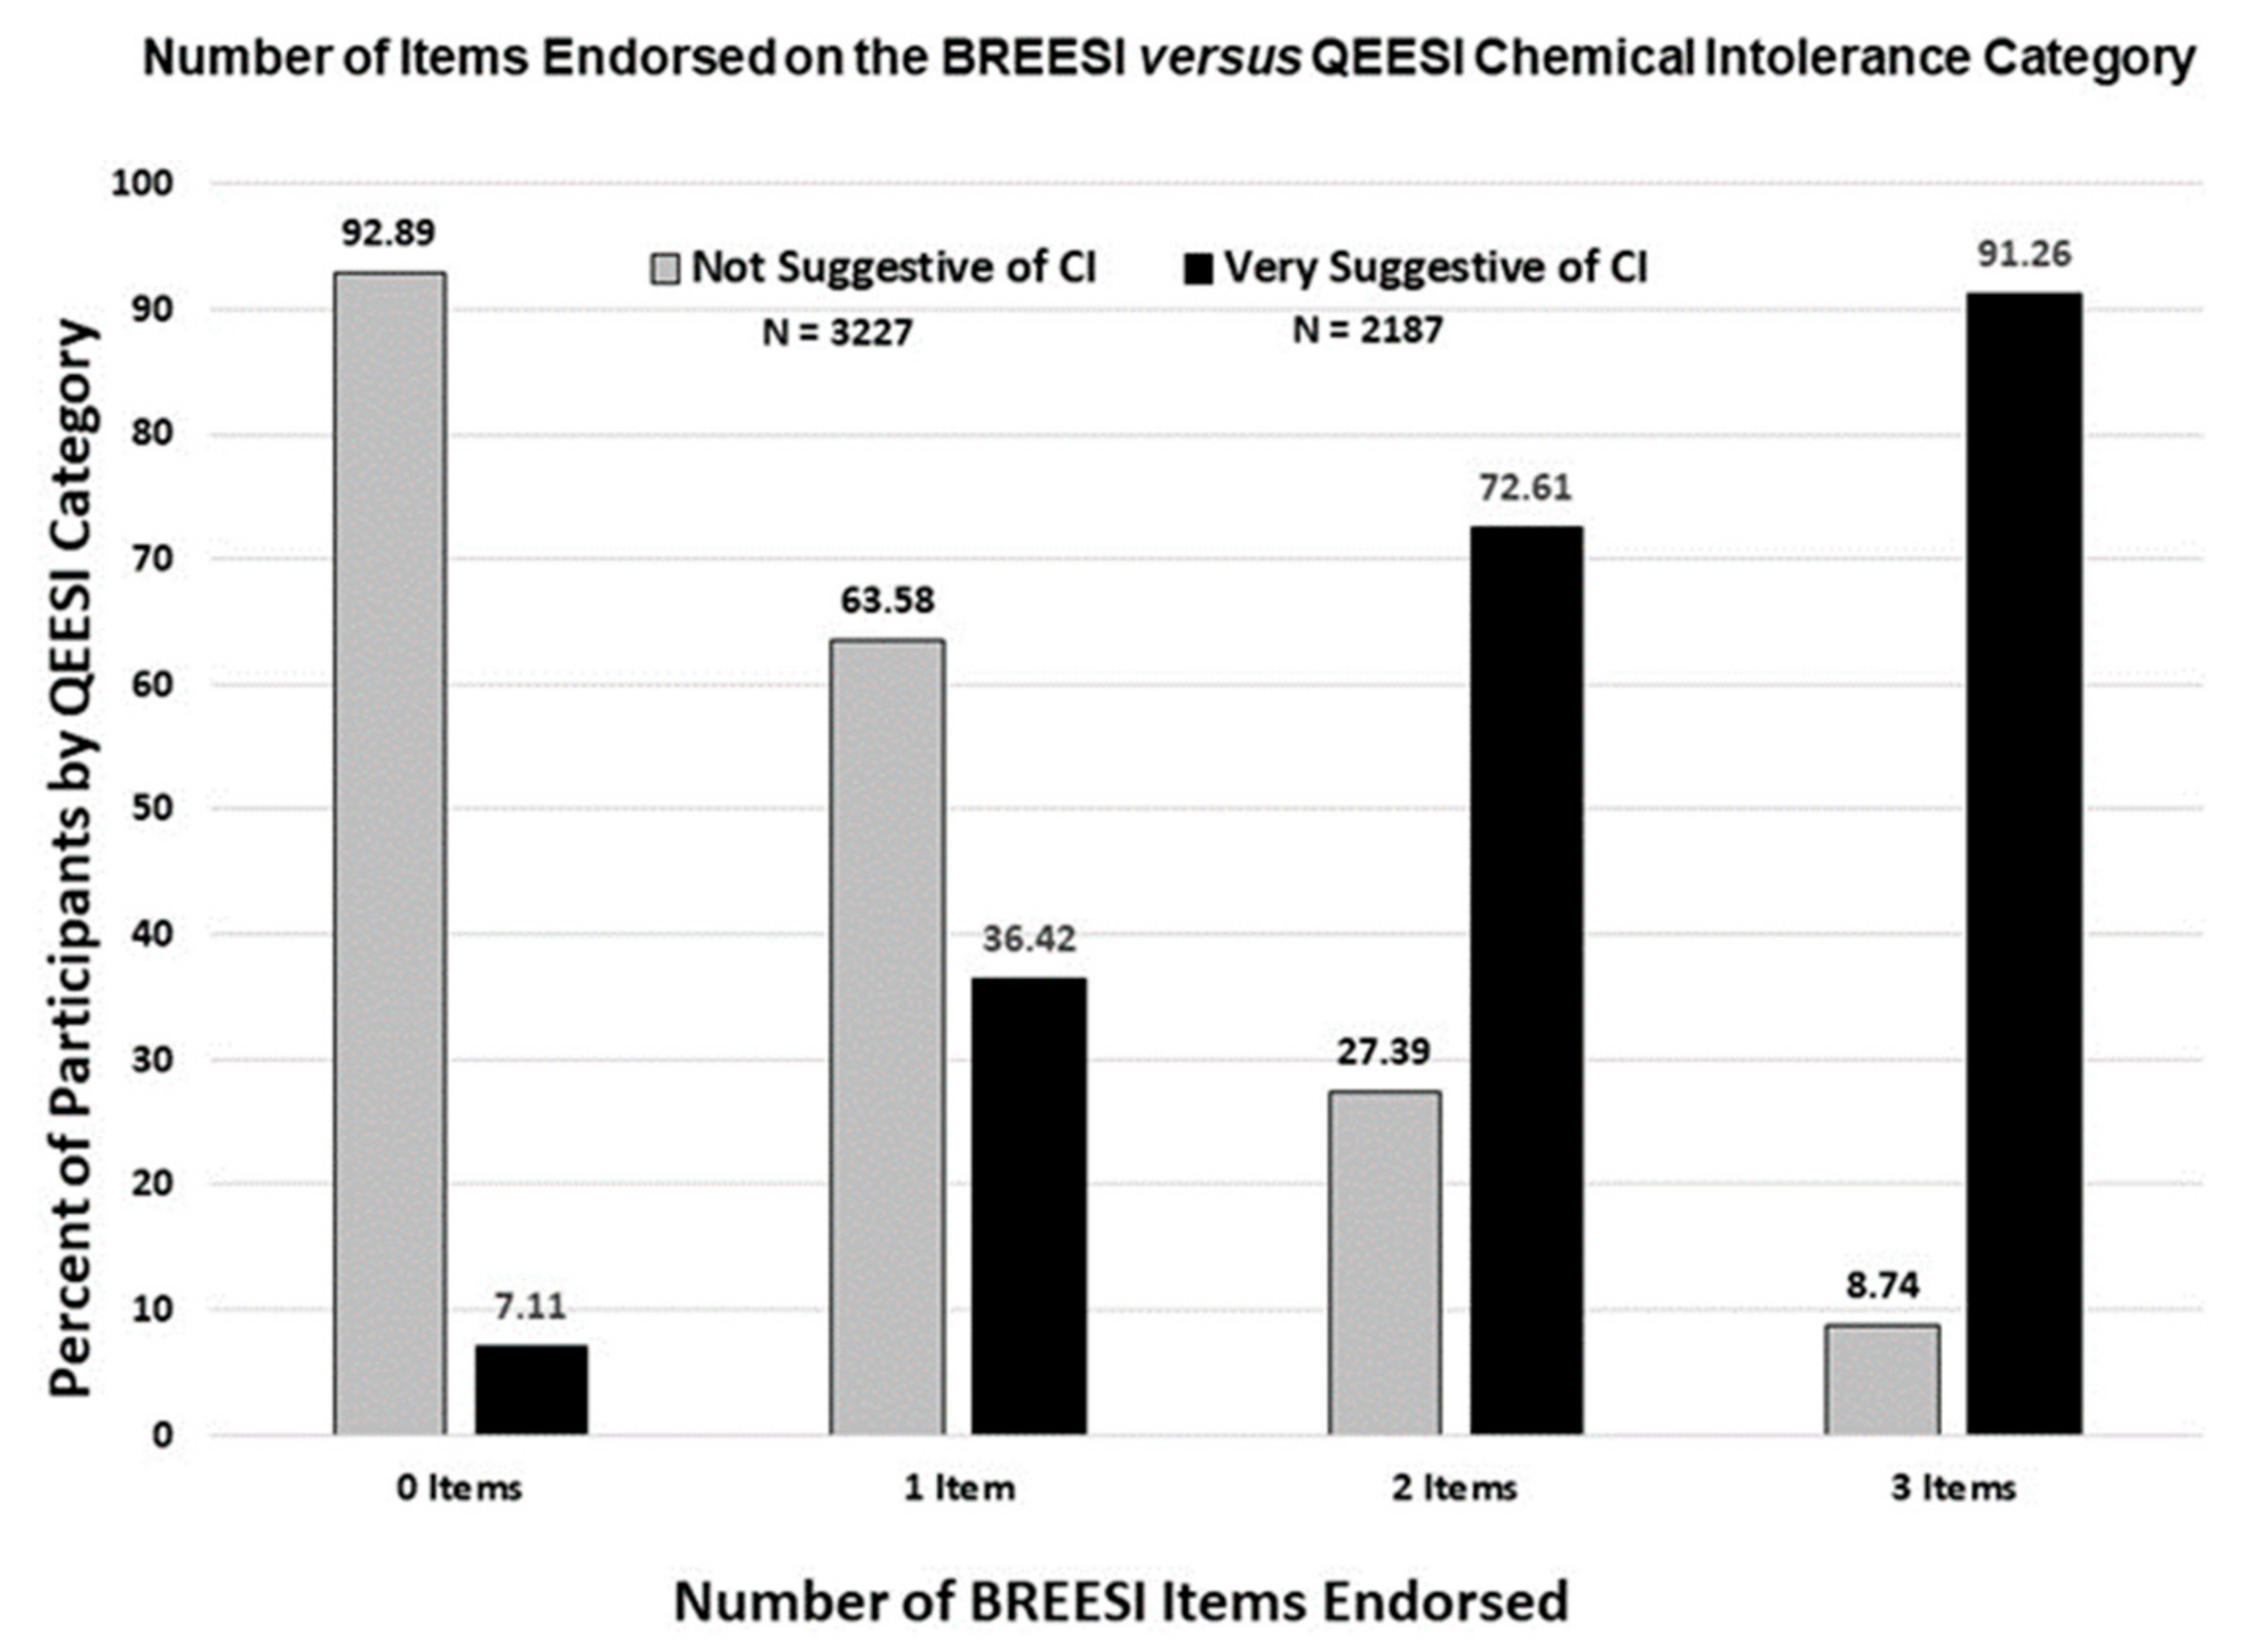
The logistic regression probability graph in Figure 2 is consistent with the bar graph trend in Figure 3. The predicted probability of CI increases sharply as more BREESI items are endorsed. With no BREESI items selected, the probability of CI is about 5%; with one BREESI item, 32%; two items, 75%; and with all three items, 90%. Thus, the odds of CI increase with each additional BREESI item chosen (OR = 5.3, 95% confidence interval = 4.90–5.75, ROC = 0.87). Adjusting for age, gender, and income in the logistic model did not alter the outcome (OR = 5.4, 95% confidence interval = 5.00–5.90, ROC = 0.89). Similarly, the secondary validity sample demonstrated the same Odds Ratio as the primary sample (OR = 5.22, 95% CI = 3.93–6.92, ROC = 0.87).
The metrics in Table 4 indicate how well the BREESI correctly categorizes those with, and without QEESI identified chemical intolerance. The performance metrics are given for the primary sample and for the secondary validity sample. The sensitivity indicates how well a test predicts true positive cases. Specificity indicates how well a test predicts true negative cases. In the primary sample of 10,000, the BREESI showed a sensitivity of 91% and specificity of 93%. Positive predictive value (PPV) is the probability that subjects with a positive screening test truly have the condition. A negative predictive value (NPV) is the probability that subjects with a negative screening test do not have the condition. The PPV for the BREESI was 83% accurate in predicting CI. The NPV indicates that the BREESI was 97% accurate in classifying those without CI. The accuracy statistic was 92% accurate for the BREESI as a predictor of CI.
In the secondary random sample of 1000 Americans, shown at the bottom of Table 4, the BREESI’s overall performance metrics were comparable to that of the larger sample. By these statistical metrics, both samples provide evidence that the BREESI performs well as a screening tool for CI.

4. Discussion

Our earlier study of 293 primary care patients [14] showed that the BREESI exhibited good positive and negative predictive values, as well as sensitivity and specificity, when evaluated against the QEESI reference standard [14]. This suggested that the BREESI might be an efficient tool for determining potential high likelihood CI, but one requiring evaluation in other larger population samples. The results of this U.S. population-based study in more than 10,000 individuals confirm the BREESI’s performance, based upon the same predictive performance metrics as in the previous study. To address concerns about prevalence estimates affecting the Sensitivity, Specificity, Positive and Negative Predictive Values, we included the Positive and Negative Likelihood Ratios, which are not influenced by disease prevalence. Table 4 shows that all performance metrics were excellent, confirming the BREESI as an efficient and reliable chemical intolerance screening tool in the U.S. population. We recommend using a BREESI cutoff score of “3” for epidemiological studies due to its high congruence with CI. As shown in Figure 2, if all three items are chosen, there is a 91% likelihood that QEESI classification would be very suggestive of CI. On the other hand, in the clinical setting, even a score of “1” on the BREESI yields a 36% change of very suggestive of CI. To avoid the possibility of missing a case, a BREESI score of 1 should prompt clinicians to administer the QEESI.
Potential uses of the BREESI: The BREESI is not a substitute for the QEESI, but rather a time-saving tool to identify individuals with potential CI in medical clinics or epidemiological studies. Identifying those who are, or are not, likely to have CI simply by asking the three BREESI questions can reduce clinical assessment time. Researchers, clinicians, health plans, epidemiologists, and others can use the BREESI to screen for chemical intolerance. Individuals who endorse any of the BREESI items should take the full QEESI to help identify specific chemical, food, and drug triggers. Including everyone who answers yes to any one of the three BREESI items makes it unlikely that an individual with CI will be overlooked. Individuals who endorse two or three BREESI items have an even greater likelihood of meeting CI criteria. Using the BREESI, followed by the QEESI, enables practitioners to identify patients who are more chemically intolerant so they may be counseled to avoid or minimize their exposures. New-onset (or marked worsening) of chemical, food, and/or drug intolerances is a hallmark of chemical intolerance, much as fever signifies possible infection. For clinical studies, we would suggest administering the BREESI to patients at clinical visits, just as medications and allergies are assessed and updated. The finding of very suggestive of CI is an important tool in the diagnostic process but does not by itself establish the diagnosis of CI and should not be an end, but an important part of the process of diagnosis and potential intervention, particularly given the known cluster of other treatable conditions that often accompany CI.
For large-scale epidemiological studies, the BREESI score of three would capture CI with a relatively high degree of confidence. Depending on the size and scope of larger studies, researchers could consider a BREESI score of two to capture more cases of CI.
CI prevalence: The prevalence results of our primary and secondary samples reported in this study support those of previous studies showing a high prevalence of self-reported intolerances to chemicals, foods, and drugs in the U.S. population—although the range has been estimates between 8 and 33%. The prevalence of very suggestive CI based on QEESI responses in this population-based sample of more than 10,000 people in the U.S. was 20.39% (95% CI 19.63–21.15%) and 25% (95% CI 22.1–28.0) in the secondary sample. We believe this is the largest study to date to estimate CI prevalence in the U.S. Based on the 2019 U.S. Census Bureau population estimate [26], our study suggests that more than 50 million U.S. adults have chemical intolerance.
Limitations: Our data come from a national survey platform limited to those with access to computers. The digital divide (e.g., opportunities to access information and communication technologies through the Internet) has continued to narrow over the last 20 years with recent studies indicating that age and gender are less affected, but low income remains associated with lower access [27]. As indicated in Table 2, our sample was approximately 10% lower in the income bracket of over $100,000 compared to the ACS. Despite these potential access biases, the primary justification for using online platforms is that they are quick, affordable, and yield a sufficiently large sample to be representative of a reasonable population estimate. Clinical samples would only be representative of the region they serve, and even then, only of the sick population. Phone surveys are significantly more expensive and time intensive.

5. Conclusions

CI is an underappreciated driver of morbidity among patients who may not know how to report their symptoms to their doctors or on health questionnaires. Despite the high prevalence of CI, clinicians and/or other researchers may fail to diagnose or identify CI because they do not know the pertinent questions to ask. Researchers and epidemiologists may be missing important opportunities to understand CI as it relates to other conditions or research contexts. The three-item BREESI makes it possible to assess CI rapidly and with a fairly high degree of confidence and should, when warranted, prompt a more comprehensive assessment using the QEESI. We recommend: screen with the BREESI, confirm with the QEESI.

Supplementary Materials

The following are available online at https://www.mdpi.com/article/10.3390/ijerph18168714/s1.

Author Contributions

Conceptualization, R.B.P., C.R.J. and C.S.M.; Data curation, R.F.P., D.K. and R.R.; Formal analysis, R.F.P. and D.K.; Funding acquisition, R.F.P. and C.S.M.; Investigation, C.G. and D.R.S.; Methodology, R.F.P.; Project administration, R.F.P., T.W., R.R., R.B.P., C.R.J. and D.R.S.; Resources, R.R., R.B.P., C.R.J., C.G. and D.R.S.; Software, D.K.; Supervision, T.W., R.B.P., C.G. and C.S.M.; Validation, T.W.; Visualization, D.K.; Writing—original draft, R.F.P.; Writing—review & editing, R.F.P., T.W., D.K., R.R., C.R.J., C.G., D.R.S. and C.S.M. All authors have read and agreed to the published version of the manuscript.

Funding

This research was funded by the Marilyn Brachman Hoffman Foundation, Fort Worth, Texas.

Institutional Review Board Statement

The study was conducted according to the guidelines of the Declaration of Helsinki and approved by the University of Texas Health Science Center San Antonio Internal Review Board (approval number HSC20200718N).

Informed Consent Statement

Written informed consent was waived due to completely anonymous volunteer participation.

Data Availability Statement

The dataset analyzed during the current study is available from the corresponding author on reasonable request.

Acknowledgments

We appreciate the Marilyn Brachman Hoffman Foundation, Fort Worth, Texas, for their generous support of this research.

Conflicts of Interest

The authors declare no conflict of interest. The funders had no role in the design of the study; in the collection, analyses, or interpretation of data; in the writing of the manuscript, or in the decision to publish the results.

References

  1. Hojo, S.; Mizukoshi, A.; Azuma, K.; Okumura, J.; Ishikawa, S.; Miyata, M.; Mizuki, M.; Ogura, H.; Sakabe, K. Survey on changes in subjective symptoms, onset/trigger factors, allergic diseases, and chemical exposures in the past decade of Japanese patients with multiple chemical sensitivity. Int. J. Hyg. Environ. Health 2018, 221, 1085–1096. [Google Scholar] [CrossRef]
  2. Steinemann, A. National Prevalence and Effects of Multiple Chemical Sensitivities. J. Occup. Environ. Med. 2018, 60, e152–e156. [Google Scholar] [CrossRef] [PubMed] [Green Version]
  3. Young, E.; Stoneham, M.D.; Petruckevitch, A.; Barton, J.; Rona, R. A population study of food intolerance. Lancet 1994, 343, 1127–1130. [Google Scholar] [CrossRef]
  4. Rona, R.; Keil, T.; Summers, C.; Gislason, D.; Zuidmeer, L.; Sodergren, E.; Sigurdardottir, S.T.; Lindner, T.; Goldhahn, K.; Dahlstrom, J.; et al. The prevalence of food allergy: A meta-analysis. J. Allergy Clin. Immunol. 2007, 120, 638–646. [Google Scholar] [CrossRef] [PubMed]
  5. Macy, E. Multiple Drug Intolerance Syndrome. In Drug Allergy Testing; David, A.K., Banerji, A., Eds.; Elsevier: Amsterdam, The Netherlands, 2018; pp. 165–168. ISBN 9780323485517. [Google Scholar] [CrossRef]
  6. Caress, S.M.; Steinemann, A.C. Prevalence of multiple chemical sensitivities: A population-based study in the southeastern United States. Am. J. Public Health 2004, 94, 746–747. [Google Scholar] [CrossRef] [PubMed]
  7. Azuma, K.; Uchiyama, I.; Katoh, T.; Ogata, H.; Arashidani, K.; Kunugita, N. Prevalence and Characteristics of Chemical Intolerance: A Japanese Population-Based Study. Arch. Environ. Occup. Health 2015, 70, 341–353. [Google Scholar] [CrossRef] [PubMed]
  8. Kreutzer, R.; Neutra, R.R.; Lashuay, N. Prevalence of people reporting sensitivities to chemicals in a population-based survey. Am. J. Epidemiol. 1999, 150, 1–12. [Google Scholar] [CrossRef] [PubMed] [Green Version]
  9. Katerndahl, D.A.; Bell, I.R.; Palmer, R.F.; Miller, C.S. Chemical intolerance in primary care settings: Prevalence, comorbidity, and outcomes. Ann. Fam. Med. 2012, 10, 357–365. [Google Scholar] [CrossRef] [PubMed] [Green Version]
  10. Gupta, R.S.; Warren, C.M.; Smith, B.M.; Jiang, J.; Blumenstock, J.A.; Davis, M.M.; Schleimer, R.P.; Nadeau, K.C. Prevalence and Severity of Food Allergies Among US Adults. JAMA Netw. Open 2019, 2, e185630. [Google Scholar] [CrossRef] [PubMed]
  11. Rael, E.; Sampath, V.; Nadeau, K.C. Diagnosis and Differential Diagnosis of Food Allergy. In Pediatric Food Allergy; Gupta, R., Ed.; Springer: Berlin/Heidelberg, Germany, 2020. [Google Scholar] [CrossRef]
  12. Macy, E.; Ho, N.J. Multiple drug intolerance syndrome: Prevalence, clinical characteristics, and management. Ann. Allergy. Asthma Immunol. 2011, 108, 88–93. [Google Scholar] [CrossRef] [PubMed]
  13. Omer, H.M.; Hodson, J.; Thomas, S.K.; Coleman, J.J. Multiple drug intolerance syndrome: A large-scale retrospective study. Drug Saf. 2014, 37, 1037–1045. [Google Scholar] [CrossRef] [PubMed] [Green Version]
  14. Palmer, R.F.; Jaén, C.R.; Perales, R.B.; Rincon, R.; Forster, J.N.; Miller, C.S. Three questions for identifying chemically intolerant individuals in clinical and epidemiological populations: The Brief Environmental Exposure and Sensitivity Inventory (BREESI). PLoS ONE 2020, 15, e0238296. [Google Scholar] [CrossRef] [PubMed]
  15. SurveyMonkey Audience Platform. SurveyMonkey Inc. San Mateo, California, USA. Available online: www.surveymonkey.com (accessed on 13 August 2021).
  16. Miller, C.S.; Prihoda, T.J. The Environmental Exposure and Sensitivity Inventory (EESI): A standardized approach for measuring chemical intolerances for research and clinical applications. Toxicol. Ind. Health 1999, 15, 370–385. [Google Scholar] [CrossRef] [PubMed]
  17. Miller, C.S.; Prihoda, T.J. A controlled comparison of symptoms and chemical intolerances reported by Gulf War veterans, implant recipients and persons with multiple chemical sensitivity. Toxicol. Ind. Health 1999, 15, 386–397. [Google Scholar] [CrossRef] [PubMed]
  18. Maxim, L.D.; Niebo, R.; Utell, M.J. Screening tests: A review with examples. Inhal. Toxicol. 2014, 26, 811–828. [Google Scholar] [CrossRef] [PubMed]
  19. Altman, D.G.; Bland, J.M. Diagnostic tests 2: Predictive values. BMJ 1994, 309, 102. [Google Scholar] [CrossRef] [PubMed] [Green Version]
  20. Heston, T.F. Standardizing predictive values in diagnostic imaging research. J. Magn. Reson. Imaging 2011, 33, 505. [Google Scholar] [CrossRef] [PubMed]
  21. Zhou, X.H.; Obuchowski, N.A.; McClish, D.K. Statistical Methods in Diagnostic Medicine; Wiley: New York, NY, USA, 2002. [Google Scholar]
  22. Glen, S. Likelihood Ratio (Medicine): Basic Definition, Interpretation. From Statistics HowTo.com: Elementary Statistics for the Rest of Us! Available online: https://www.statisticshowto.com/likelihood-ratio/ (accessed on 13 August 2021).
  23. McGee, S. Simplifying Likelihood Ratios. J. Gen. Intern. Med. 2002, 17, 647–650. [Google Scholar] [CrossRef] [Green Version]
  24. SAS Institute Inc. SAS® 9.4 Statements: Reference, 3rd ed.; SAS Institute Inc.: Cary, NC, USA, 2014. [Google Scholar]
  25. U.S. Census Bureau. American Community Survey, 2019 American Community Survey Detailed Tables by Age and Sex, Table 1. Available online: https://data.census.gov/cedsci/ (accessed on 7 June 2021).
  26. United States Census Bureau. United States. Quick Facts. 2019. Available online: https://www.census.gov/quickfacts/fact/table/US/PST045219 (accessed on 1 November 2020).
  27. Fang, M.L.; Canham, S.L.; Battersby, L.; Sixsmith, J.; Wada, M.; Sixsmith, A. Exploring Privilege in the Digital Divide: Implications for Theory, Policy, and Practice. Gerontologist 2019, 59, e1–e15. [Google Scholar] [CrossRef] [PubMed]
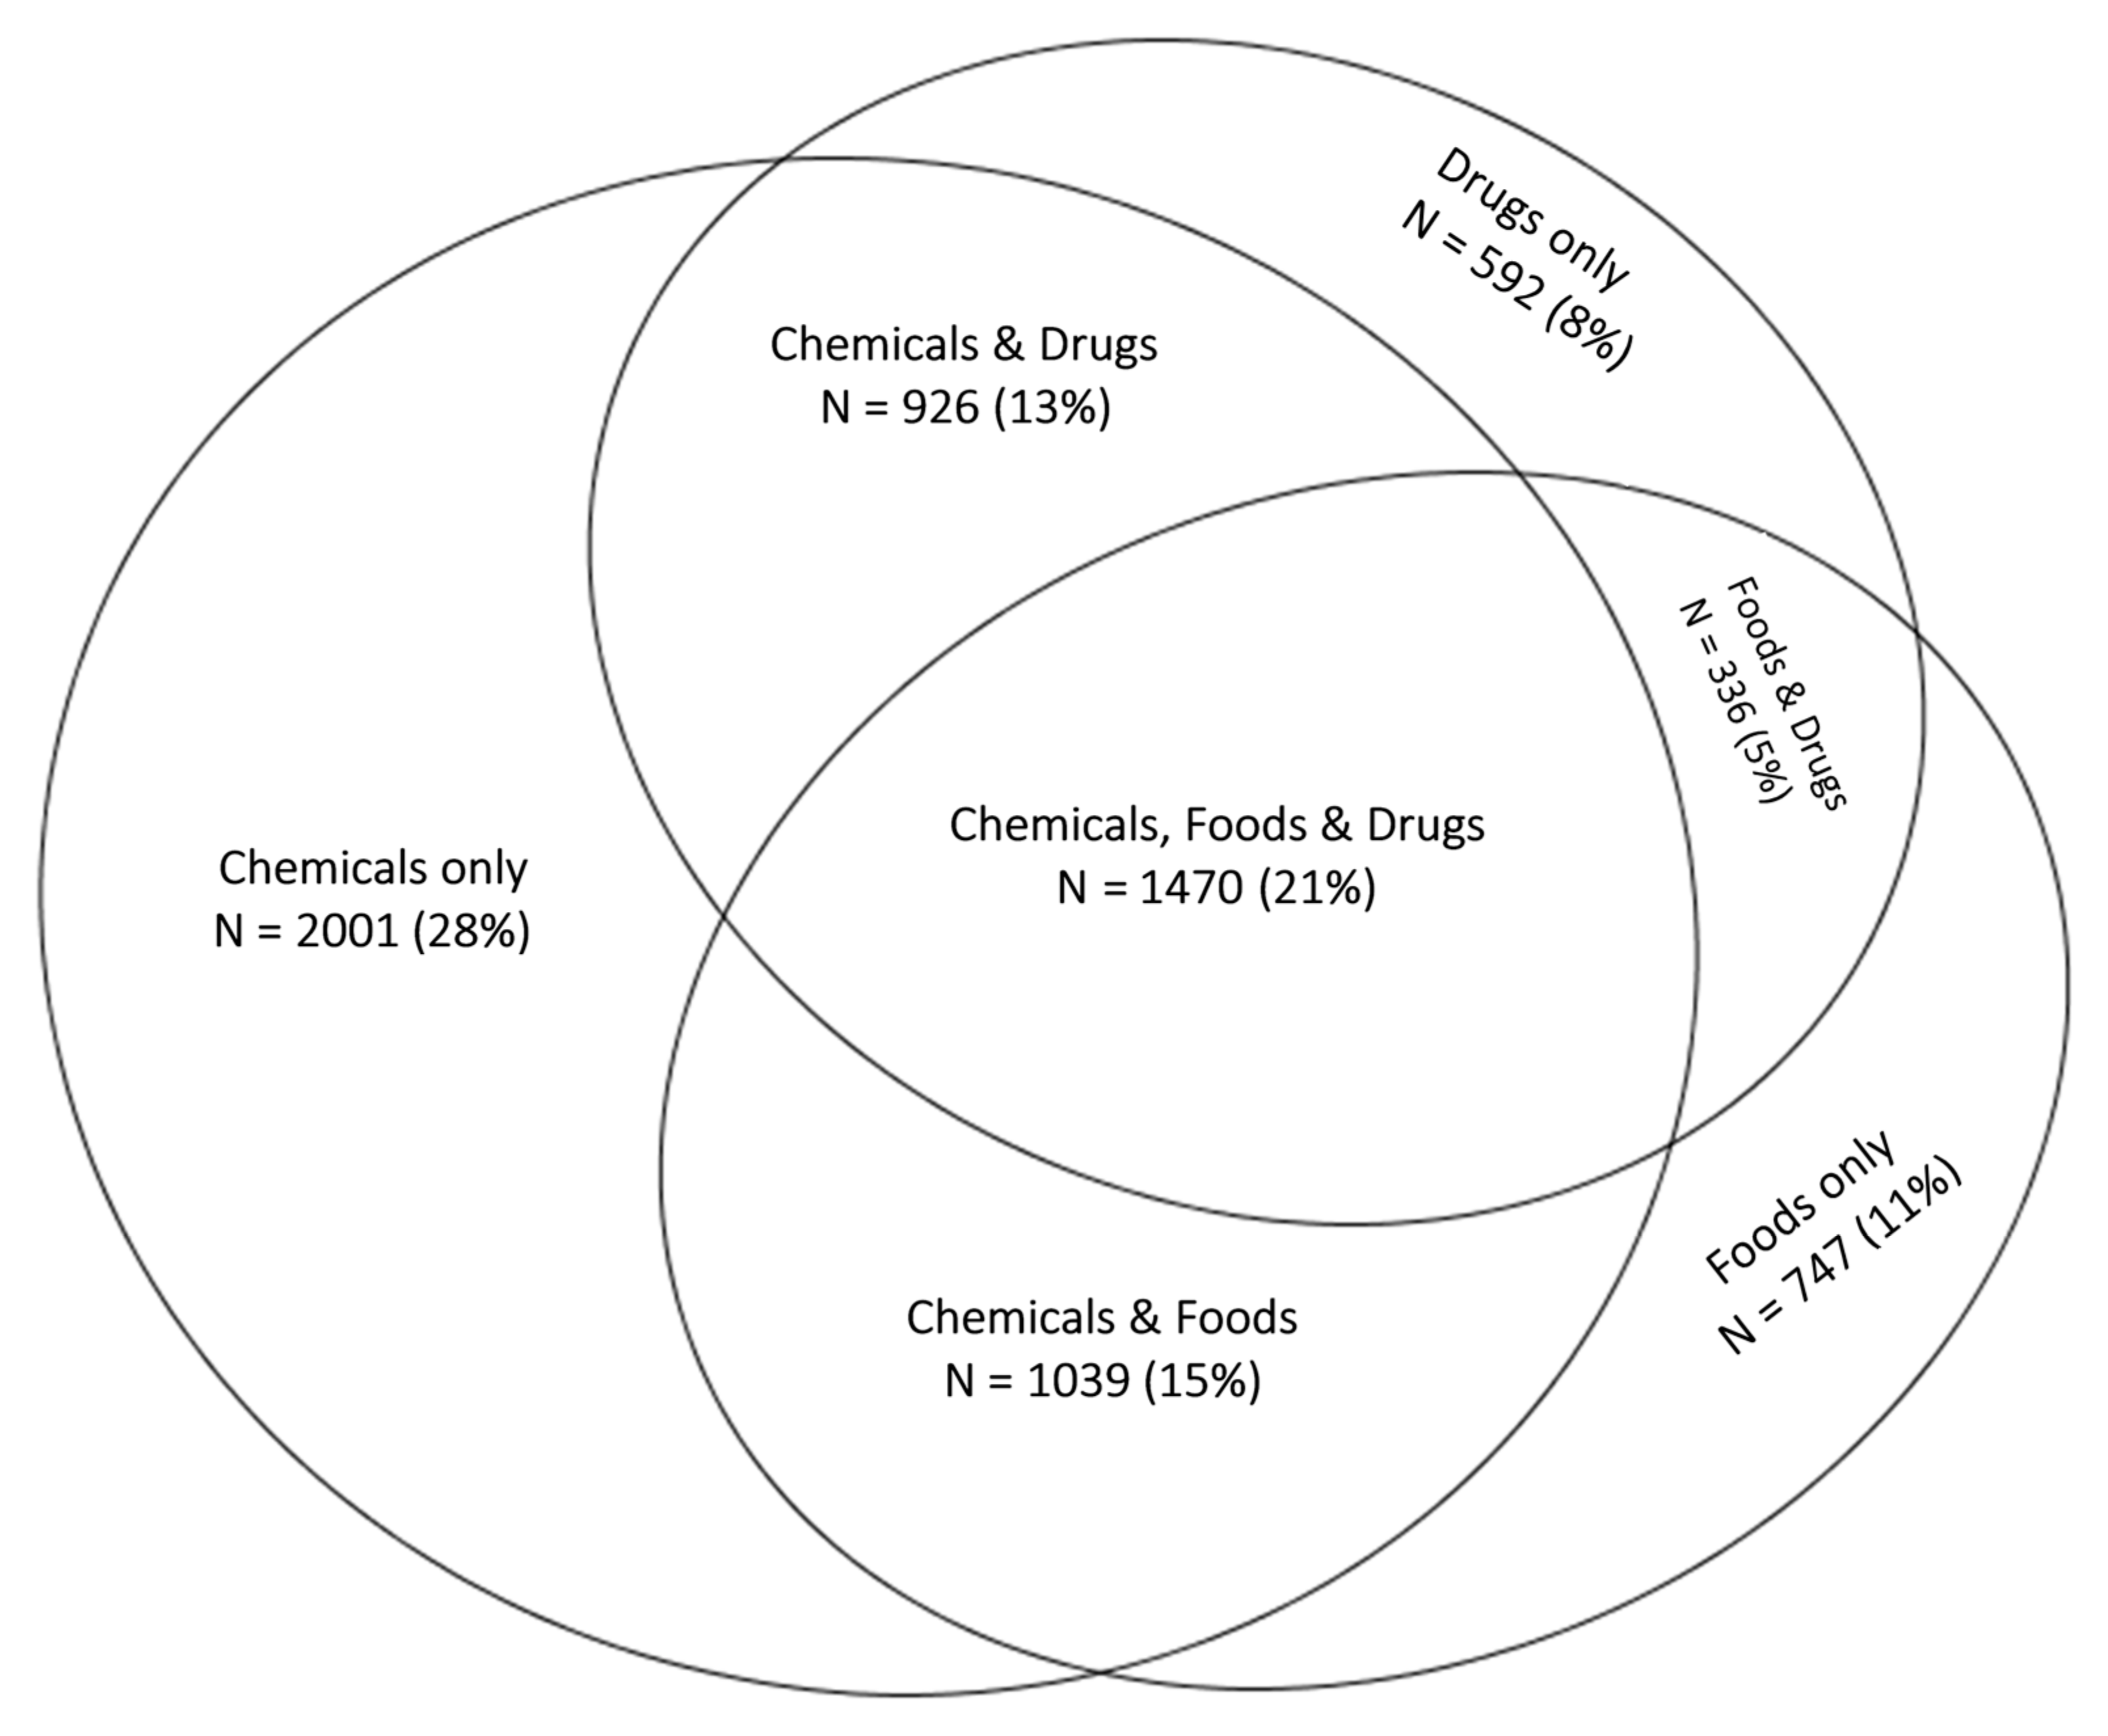
Figure 1. Venn diagram depicting overlap between BREESI responses of one or more items (n = 7110).
Ijerph 18 08714 g001
Figure 2. Predicted probability of chemical intolerance versus number of BREESI items endorsed. BREESI statistical validity performance.
Ijerph 18 08714 g002
Figure 3. Number of BREESI items endorsed for low (not suggestive) versus high (very suggestive) QEESI chemical intolerance categories. Figure 2 shows that as more BREESI items are chosen, the percentage having QEESI-defined CI (solid black bars) increases. As fewer BREESI items are chosen, a much lower percentage of very suggestive of CI is observed.
Ijerph 18 08714 g003
Table 1. Peer-reviewed Journal Articles Using the QEESI by Country.
CountryAuthor & DateNCountryAuthor & DateN
AustriaWeiss, 201772JapanHojo, 2009412
ChinaHuang, 2011658JapanHojo, 2018214
ChinaHuang, 2014658JapanHojo, 2019555
ColumbiaStorino, 20211JapanIshibashi, 2007214
DenmarkDantoft, 2014298JapanLu, 2020667
DenmarkHauge, 201569JapanManabe, 2008368
DenmarkSkovbjerg, 20121493JapanMizuki, 200432
DenmarkTran, 20143JapanMizuki, 201540
DenmarkTran, 201739JapanMizukoshi, 20158
FinlandHeinonen-Guzejev, 2012327JapanNakaoka, 201843
FinlandSelinheimo, 201952JapanOhsawa, 20202
FinlandVuokko, 201912JapanSuzuki, 2020141
FranceKamoun, 201120JapanWatai, 2018528
GermanyBauer, 2007202JapanYoshino, 200469
GermanySchnakenberg, 2007521Saudi ArabiaKhalil, 2020134
IndonesiaHildebrandt, 2019471South KoreaHeo, 20171030
IndonesiaKubota,2020707South KoreaJeon, 2012300
ItalyCaccamo, 2013443South KoreaJeong, 2014379
ItalyDe Luca, 2010444South KoreaYun, 20131
ItalyDe Luca, 2014300SpainAguilar-Aguilar, 2018 52
ItalyDe Luca, 2015563SpainAlobid, 2014118
ItalyGugliandolo, 201634SpainFernandez-Solà, 200575
ItalyMicarelli, 2016a38SpainGarcía-Sierra, 2014125
ItalyMicarelli, 2016b38SpainLago Blanco, 201673
ItalyViziano, 201738SpainMena, 2013231
Japan Azuma, 201323SpainNogué, 200752
JapanAzuma, 2015a7245SpainParedes-Rizo, 20181
JapanAzuma, 2015b12SpainPérez-Crespo, 2018514
JapanAzuma, 201616SpainAguilar-Aguilar, 2018 52
JapanAzuma, 2019909SwedenAndersson, 2009207
JapanCui, 2013324SwedenNordin, 2010283
JapanCui, 20142464United StatesGould Peek, 2015563
JapanCui, 2015565United StatesHeilbrun, 2015694
JapanFujimori, 20121084United StatesKaterndahl, 2012400
JapanHasegawa, 200951United StatesMiller, 1999a421
JapanHojo, 20021260United StatesMiller, 1999b421
JapanHojo, 2003760United StatesPalmer, 2020293
JapanHojo, 2005440UruguayDe Ben, 20142
JapanHojo, 200810616 Countries   Total N > 32,000 subjects
Table 2. Sample demographics (N = 10,724) Compared to the American Community Survey.
NPercentage of SamplePercentage in ACS
GenderMale492753.36%48.68%
Female563646.64%51.32%
Missing1611.50%
Age
18–29278826.39%13.10%
30–44232021.96%27.69%
45–60314329.75%26.87%
>60231221.89%32.34%
Missing1611.50%
Household
Income/Year
<$25,000183917.45%18.1%
$25,000–$49,999201819.15%20.3%
$50,000–$74,999196518.65%17.4%
$75,000–$99,999135812.89%12.8%
$100,000234122.21%31.4%
Prefer not to answer10189.66%
Missing1851.7%
QEESI Score
Not Suggestive of CI322730.09%NA
Suggestive of CI531049.52%NA
Very Suggestive of CI218720.39%NA
Number of BREESI Items Endorsed
0361433.7%NA
1332030.96%NA
2231121.55%NA
3147913.79%NA
Table 3. Chemical intolerance prevalence by demographic group and mean scale scores (N = 10,724).
Not Suggestive
of CI
Suggestive of CIVery Suggestive of CI
Total Sample30.09%49.52%20.39%
GenderMale36.76%45.04%18.21%
Female23.94%53.46%22.6% ***
Age18–2926.72%49.28%24.00%
30–4426.9%49.83%23.28%
45–6027.39%50.30%22.3%
>6040.22%48.49%11.29% ***
Household
Income/Year
<25,00027.35%47.85%24.8%
$25,000–<$50,00025.82%51.34%22.84%
$50,000–<$75,00027.94%50.08%21.98%
$75,000–<$100,00029.68%49.63%20.69%
>$100,00034.39%48.83%16.79% ***
Prefer not to
answer
36.25%49.41%14.34%
QEESI Scale ScoresTotalNot Suggestive of CISuggestive of CIVery Suggestive of CI
Mean (SD)Mean (SD)Mean (SD)Mean (SD)
Chemical Exposures Score28.50 (22.49)6.10
(5.90)
29.91 (16.12)58.14
(13.17) ***
Symptom Score28.58 (22.10)6.97
(5.94)
29.34 (15.13)58.64
(13.56) ***
Mantel-Hansel Chi-Square *** p < 0.001, comparing Very Suggestive within demographic categories.
Table 4. Statistical performance metrics of the BREESI.
Value95% Confidence Interval
United States sample (n = 10,724)
Sensitivity91.26%89.20% to 93.04%
Specificity92.89%91.77% to 93.90%
Positive Predictive Value82.89%80.68% to 84.89%
Negative Predictive Value96.57%95.79% to 97.21%
Positive Likelihood Ratio12.8311.07 to 14.88
Negative Likelihood Ratio0.090.08 to 0.12
Accuracy92.44%91.47% to 93.33%
Additional United States Sensitivity sample (N = 1000)
Sensitivity78.71%71.42% to 84.87%
Specificity97.28%93.18% to 99.25%
Positive Predictive Value92.85%83.13% to 97.17%
Negative Predictive Value91.05%88.24% to 93.23%
Positive Likelihood Ratio28.9310.96 to 76.31
Negative Likelihood Ratio0.220.16 to 0.30
Accuracy91.52%87.79% to 94.41%
Publisher’s Note: MDPI stays neutral with regard to jurisdictional claims in published maps and institutional affiliations.