
Effects and Environmental Features of Mountainous Urban Greenways (MUGs) on Physical Activity


Abstract
:1. Introduction
2. Methods
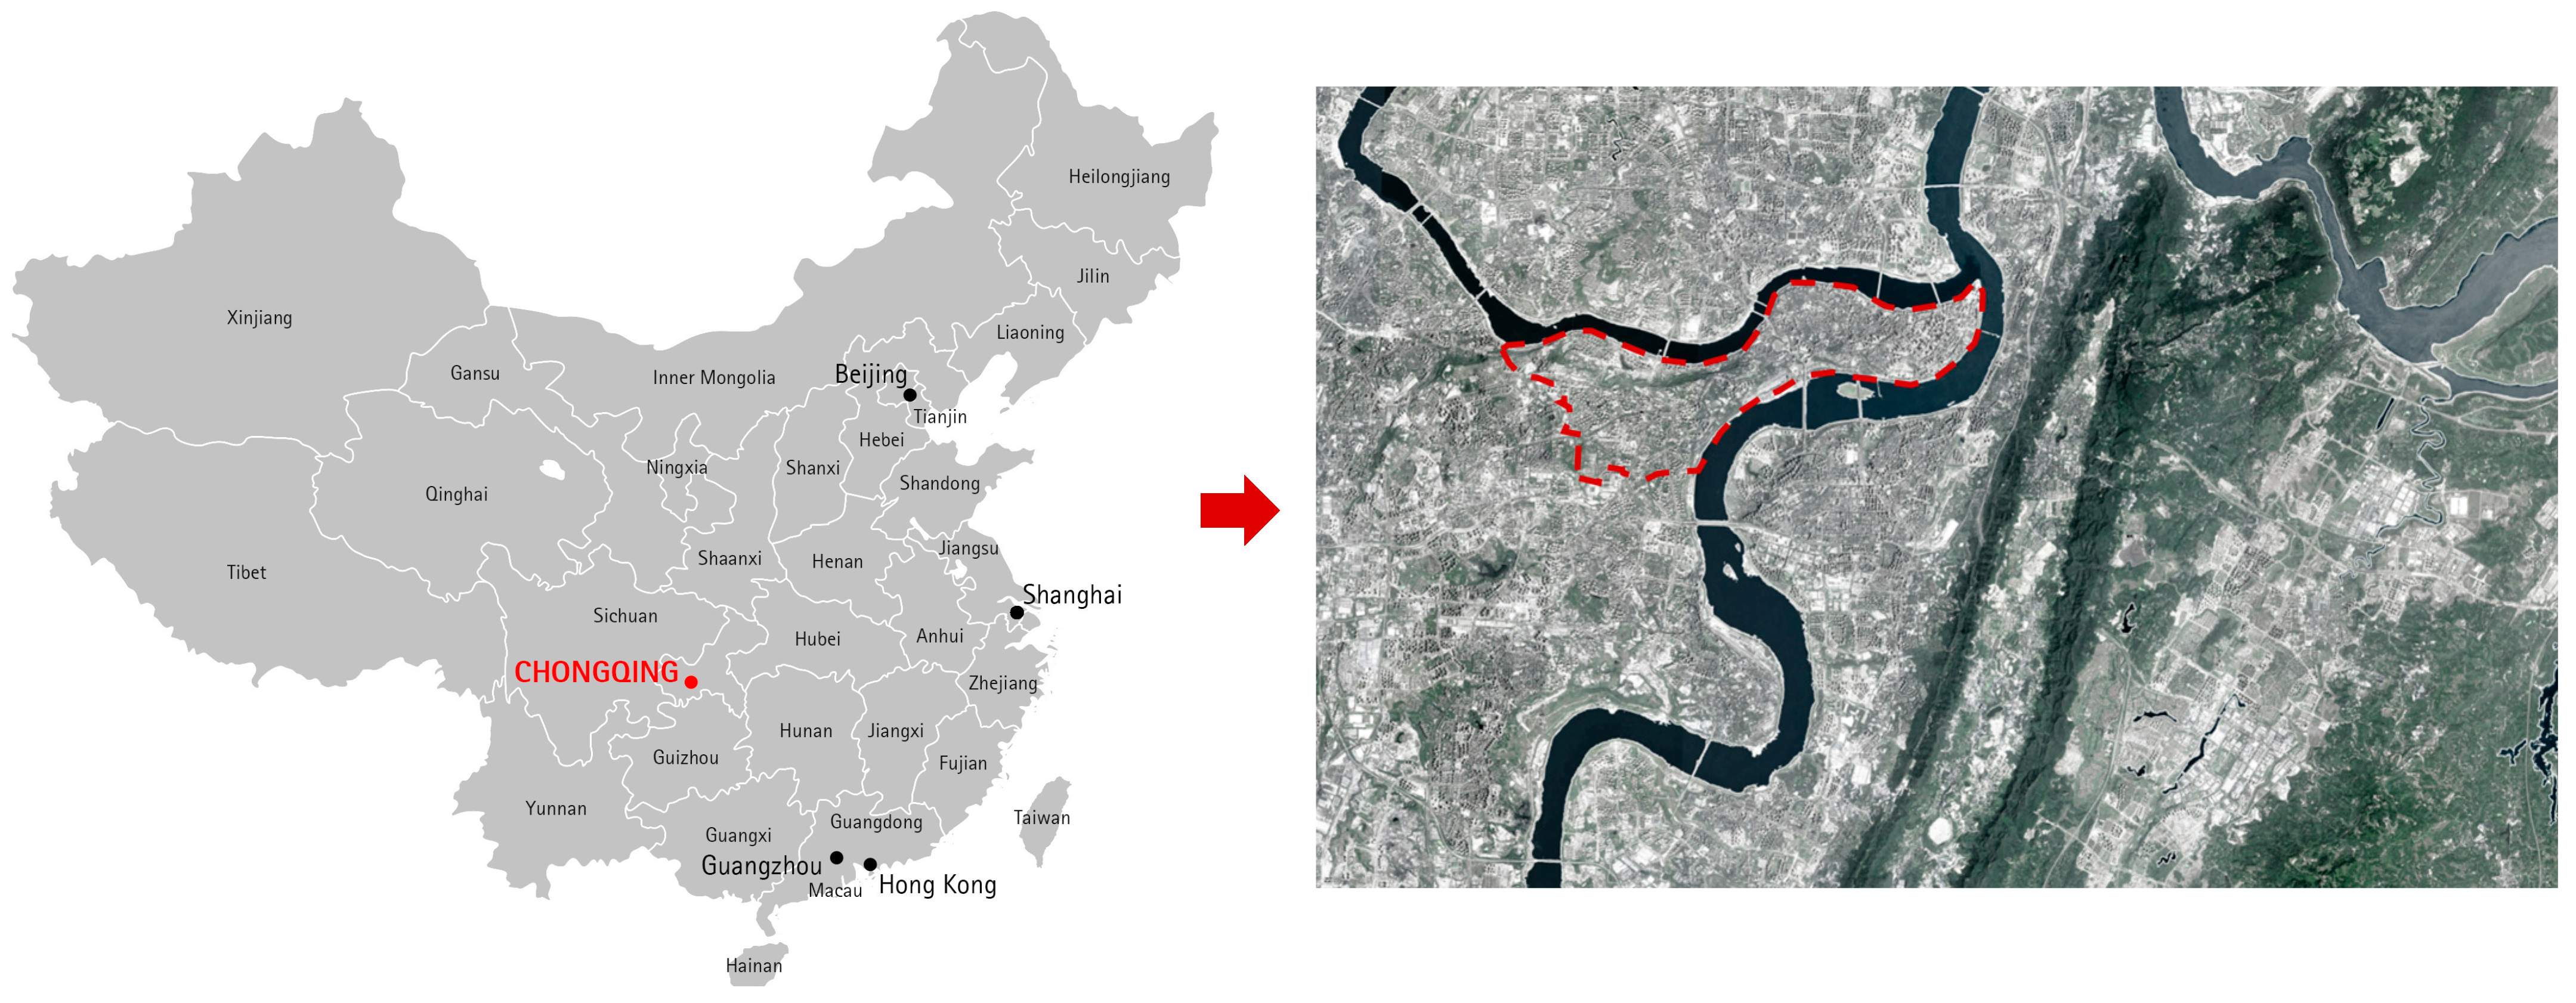
2.1. Study Area
2.2. Data
2.2.1. Physical Activity (PA)
2.2.2. MUG and Surrounding Environment
2.3. Data Analysis
2.3.1. Dependent Variable: Describes Users’ PA in Terms of Both Density and Attributes
- (1)
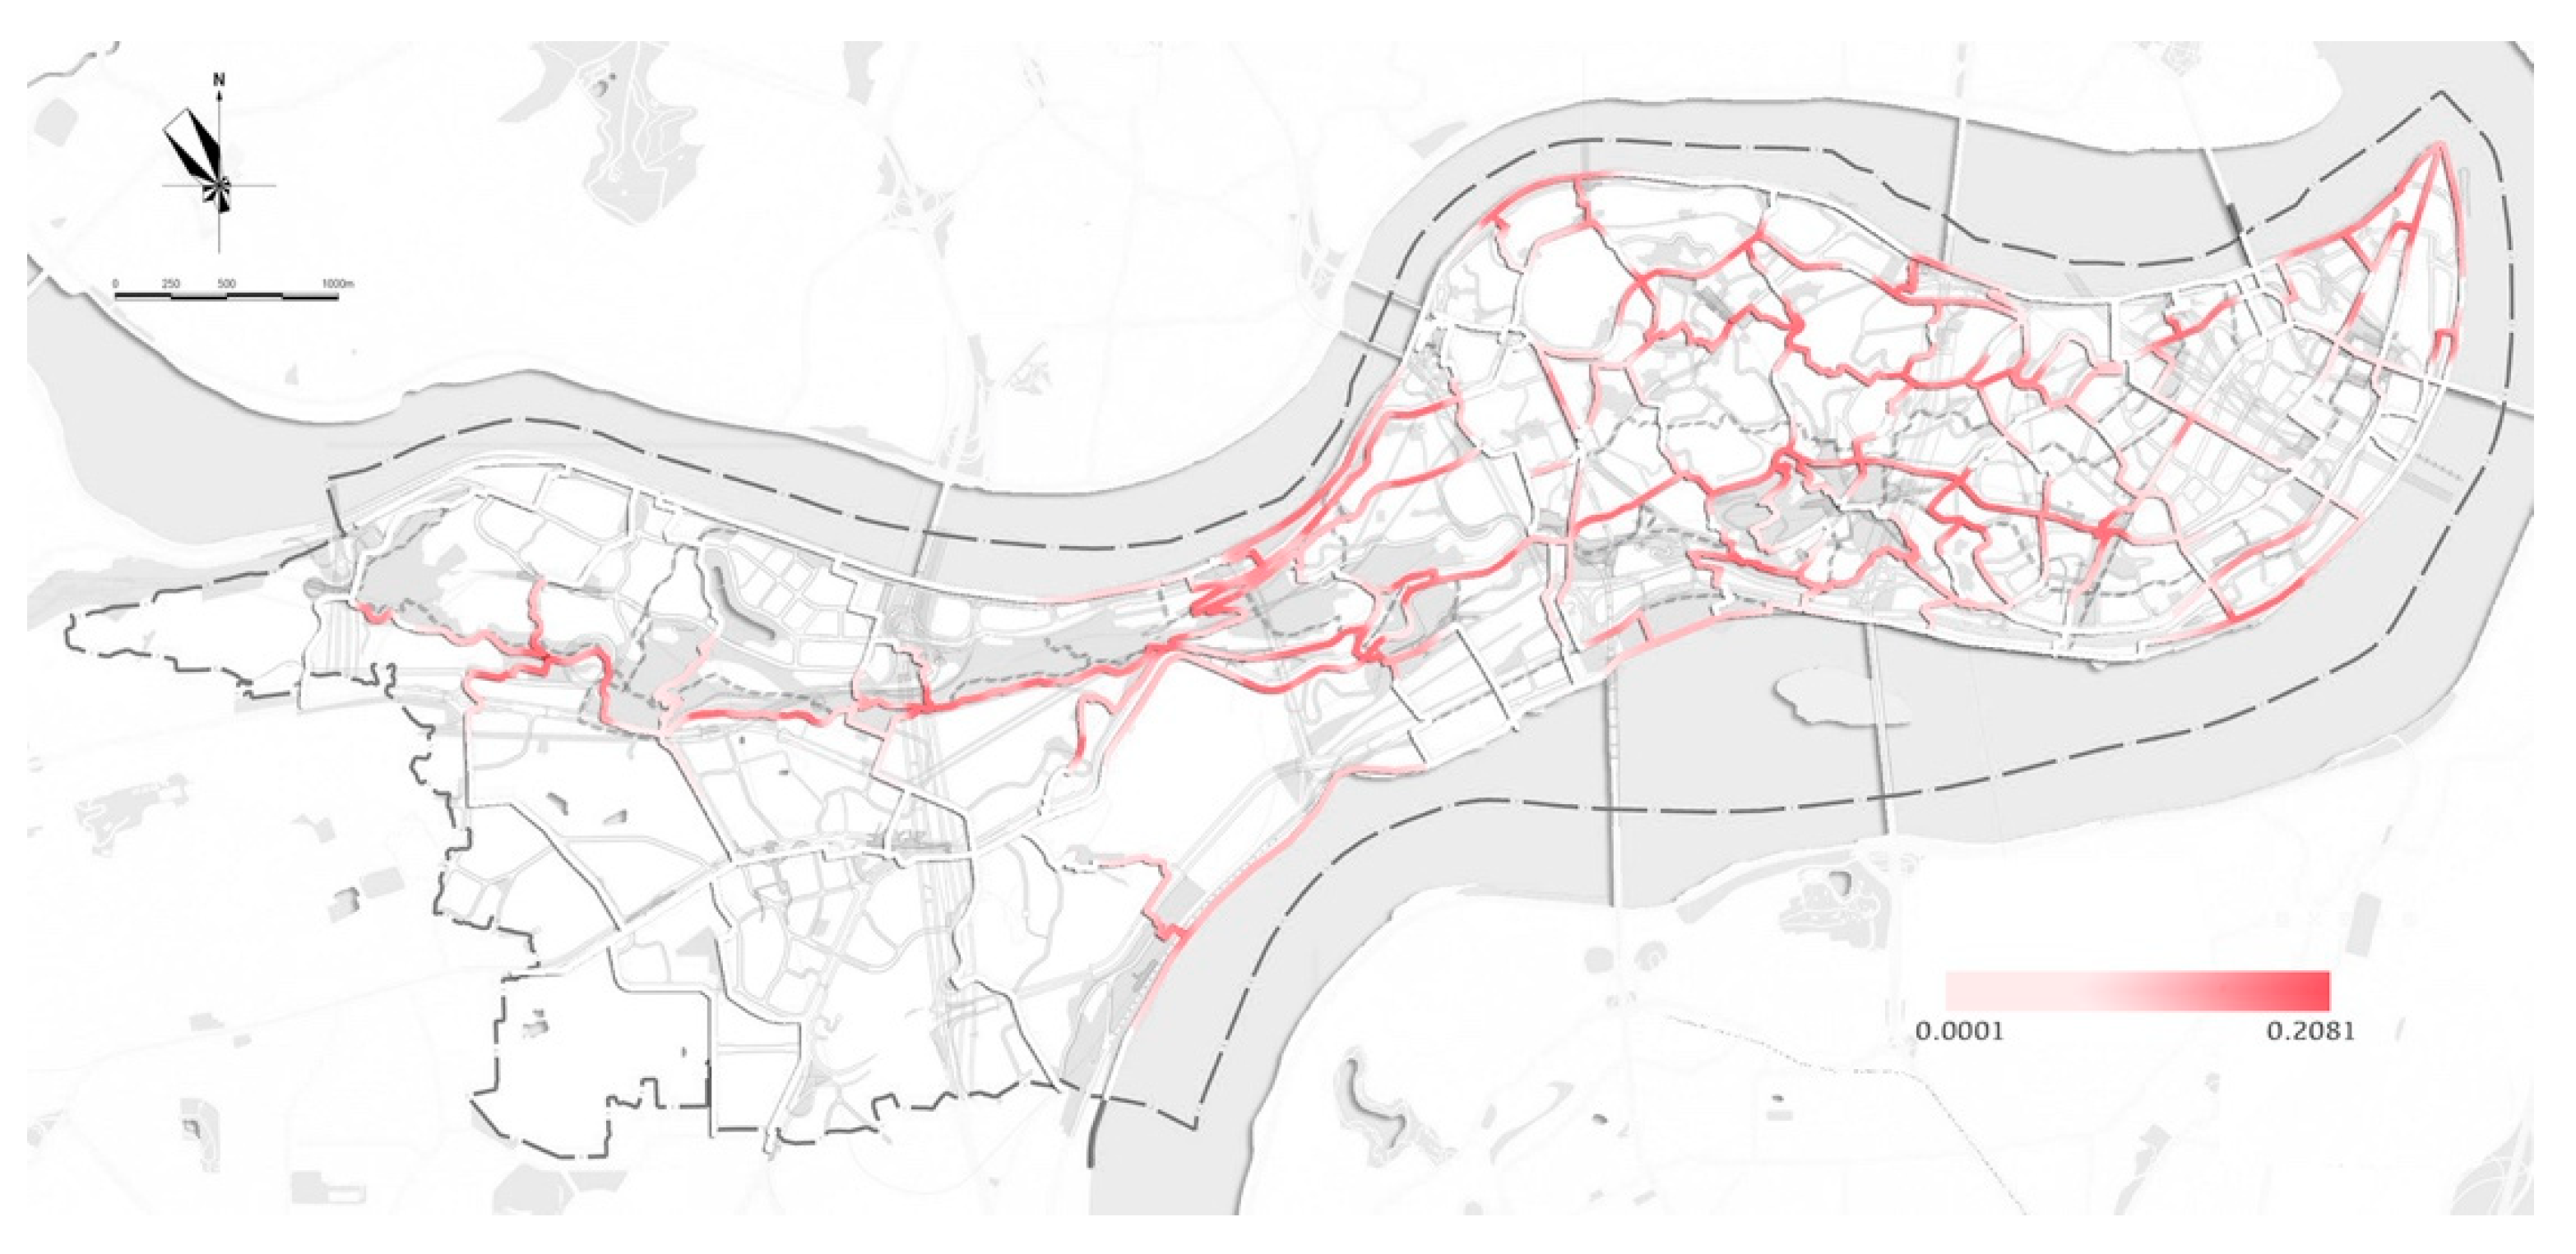
- PA density: Total PA routes per unit area of the 300 m buffer zone along the MUG, which indicates the density of PA along a certain segment of the MUG. It is calculated by dividing the total length of PA by the buffer area along the route. A blank area would be considered out of use. A total of 1314 records of PA were entered into ArcGIS and processed by the Intersect tool.
- (2)
- PA attributes: Quality of PA, including the duration, distance and speed. Cycling rarely occurs in the Yuzhong Peninsula MUGs, so the types of PA are not counted in this study. These VGI data were obtained from the KEEP app (https://www.keep.com/, accessed on 14 August 2021), then encoded and entered into ArcGIS to be overlaid with the MUG data.
2.3.2. Independent Variables: Describe the Environmental Features of the MUGs
- (1)
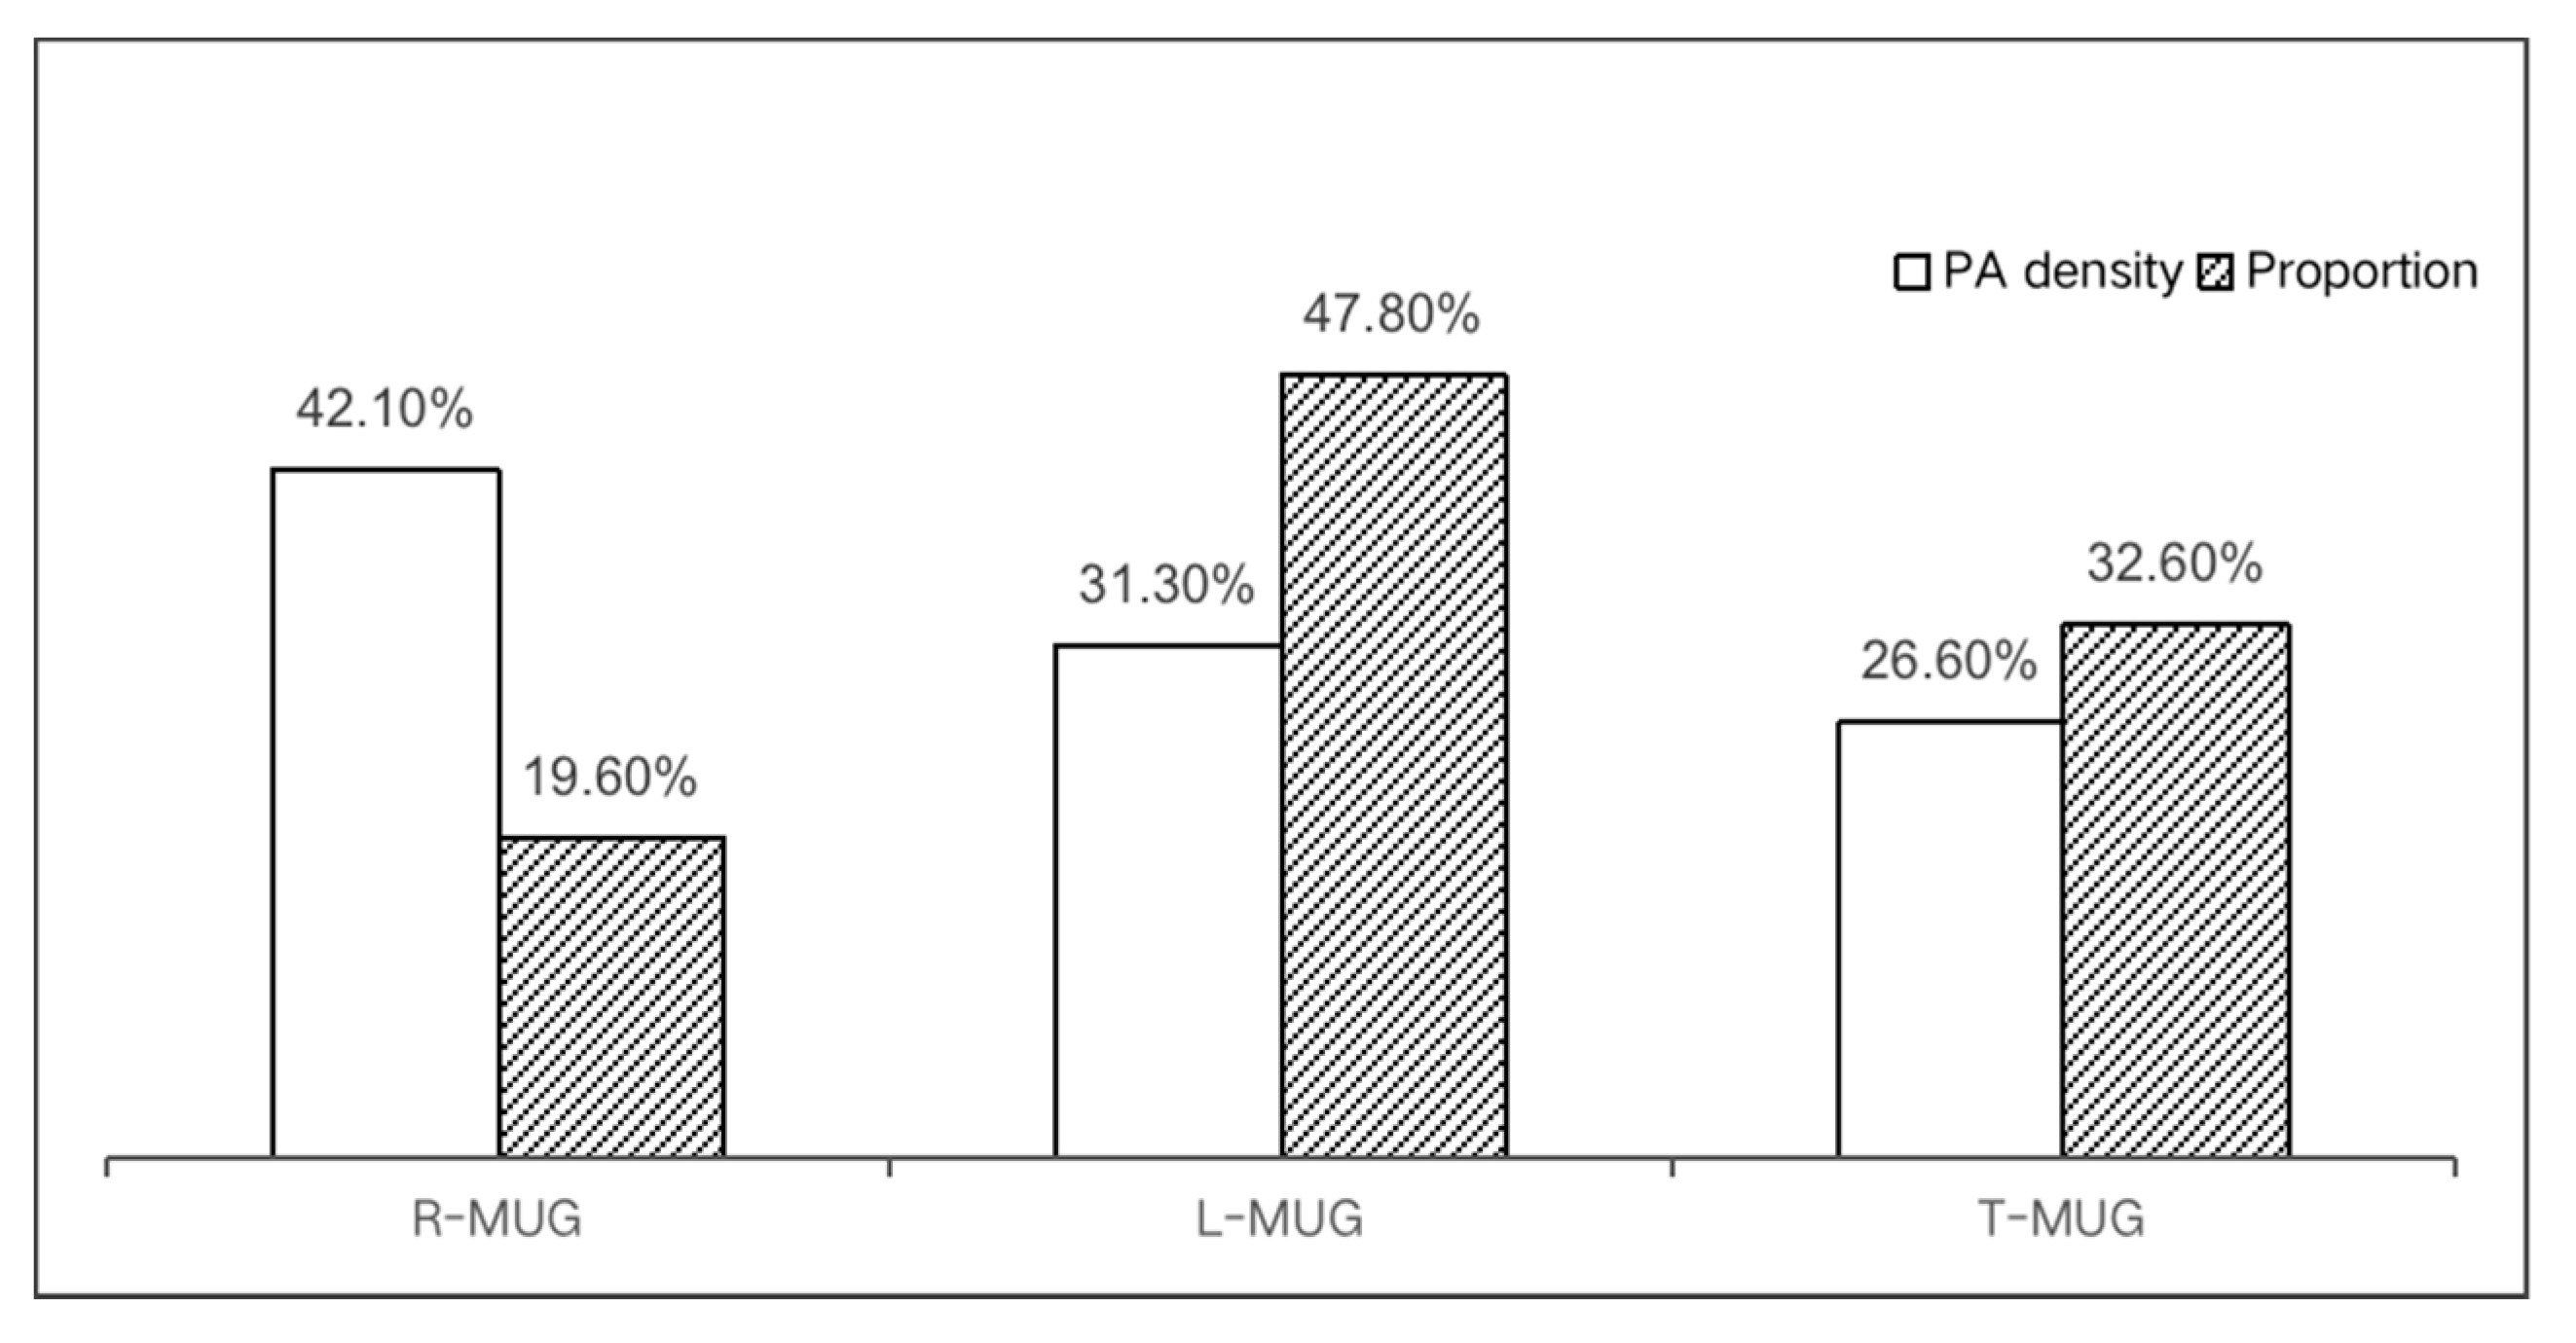
- Type ratios: Ranging from 0 to 1, these represent the proportions of the MUG types in a PA record, and are a general reflection of the overall environmental quality. Three ratios correspond to the three MUG types: R-MUG, T-MUG and L-MUG. Each ratio is calculated by dividing the length of the corresponding MUG type by the total length of the PA track records. Features such as pavements, facilities and landscapes have also been considered because each type has its own unified standards.
- (2)
- Slope (elevation-to-distance ratio): Calculated from dividing the elevation by distance in a route and ranges from 0 to 1. It reflects the mountainous characteristics of a MUG. Greenways in the plains tend to have lower slopes.
- (3)
- Node ratio: Nodes are the interactions of greenway segments, which indicates the network feature of a greenway system. Nodes ratios are calculated by dividing the number of nodes by a PA track length in the 300-m buffer zone along each MUG segment. A higher value means better connectivity and reflects the network attributes of MUGs [40].
2.3.3. Control Variables: The Surrounding Environments of the MUGs Could Affect the PA Conducted in Them
2.4. Statistical Analysis
3. Results
3.1. Descriptive Analysis
3.1.1. PA Density
3.1.2. PA Attributes
3.1.3. Yuzhong Peninsula MUG and Surrounding Environment
3.2. Statistical Analysis
3.2.1. Model 1. PA Density and MUG Environmental Characteristics
3.2.2. Model 2. PA Attributes and MUGs Environmental Characteristics
4. Discussion
4.1. Effects of MUGs and Surrounding Environment on PA Density
4.2. Effects of of MUGs and Surrounding Environment on PA Attributes
4.3. Role of MUGs Classification to Support PA
4.4. Key Environmental Feature for Supporting PA in MUG
4.5. Advice to Support PA by Planning in the Practice
4.6. Limitation and Perspective
5. Conclusions
Author Contributions
Funding
Institutional Review Board Statement
Informed Consent Statement
Data Availability Statement
Acknowledgments
Conflicts of Interest
Appendix A

| All Cities | Ghent, Belgium | Curitiba, Brazil | Bogota, Colombia | Olomouc, Czech Republic * | Aarhus, Denmark | Hong Kong, China † | Cuernavaca, Mexico * | Wellington, New Zealand * | Christchurch, New Zealand * | Stoke- on-Trent, UK | Seattle, WA, USA * | Baltimore, MD, USA * | |
|---|---|---|---|---|---|---|---|---|---|---|---|---|---|
| Number with ≥4 days of valid physical activity data | 6822 (68%) | 1050 (90%) | 330 (47%) | 223 (23%) | 258 (78%) | 272 (42%) | 269 (56%) | 656 (97%) | 416 (84%) | 373 (75%) | 135 (16%) | 1198 (93%) | 870 (95%) |
| MVPA (min/day) | 37·3 (26·5) | 35·5 (23·5) | 31·5 (24·6) | 37·0 (26·4) | 47·1 (27·7) | 39·7 (23·2) | 44·9 (25·3) | 31·2 (25·2) | 50·1 (31·0) | 44·0 (32·5) | 36·7 (27·3) | 36·3 (24·9) | 29·2 (22·0) |
References
- Ning, J. China Statistical Yearbook; National Bureau of Statistics of China: Beijing, China, 2019; Volume 22.
- Zhang, M.; Wang, K.; Liu, J. Urban Park Categorization for Physical Activity Needs in America. Planners 2018. Available online: https://en.cnki.com.cn/Article_en/CJFDTotal-GHSI201804024.htm (accessed on 23 March 2019).
- Warburton, D.E.R. Health benefits of physical activity: The evidence. Can. Med. Assoc. J. 2006, 174, 801–809. [Google Scholar] [CrossRef] [Green Version]
- Fei, S.; Norman, I.J.; While, A.E. Physical activity in older people: A systematic review. BMC Public Health 2013, 13, 449. [Google Scholar]
- Vogel, T.B.; Brechat, P.H.; Leprêtre, P.M.; Kaltenbach, G.; Berthel, M.; Lonsdorfer, J. Health benefits of physical activity in older patients: A review. Int. J. Clin. Pract. 2010, 63, 303–320. [Google Scholar] [CrossRef]
- Wen, M.; Hawkley, L.C.; Cacioppo, J.T. Objective and perceived neighborhood environment, individual SES and psychosocial factors, and self-rated health: An analysis of older adults in Cook County, Illinois. Soc. Sci. Med. 2006, 63, 2575–2590. [Google Scholar] [CrossRef] [PubMed]
- Gao, J.; Fu, H.; Li, J.; Jia, Y. Association between social and built environments and leisure-time physical activity among Chinese older adults—A multilevel analysis. BMC Public Health 2015, 15, 1317. [Google Scholar] [CrossRef] [Green Version]
- Niedermeier, M.; Friihauf, A.; Elliott, L.R.; Ledochowski, L. Acute effects of outdoor physical activity on affect and psychological well-being in depressed patients—A preliminary study. Ment. Health Phys. Act. 2016, 10, 4–9. [Google Scholar]
- Weng, P.Y.; Chiang, Y.C. Psychological Restoration through Indoor and Outdoor Leisure Activities. J. Leis. Res. 2014, 46, 203–217. [Google Scholar] [CrossRef]
- Lee, A.; Maheswaran, R. The health benefits of urban green spaces: A review of the evidence. J. Public Health 2011, 33, 212–222. [Google Scholar] [CrossRef] [PubMed]
- Chang, P.J. Effects of the built and social features of urban greenways on the outdoor activity of older adults. Landsc. Urban Plan. 2020, 204, 103929. [Google Scholar] [CrossRef]
- Sallis, J.; Cerin, E.; Conway, T.; Adams, M.; Frank, L.; Pratt, M.; Salvo, D.; Schipperijn, J.; Smith, G.; Cain, K. Physical activity in relation to urban environments in 14 cities worldwide: A cross-sectional study. Lancet 2016, 6736, 348. [Google Scholar] [CrossRef] [Green Version]
- Heath, G.W.; Parra, D.C.; Sarmiento, O.L.; Andersen, L.B.; Owen, N.; Goenka, S.; Montes, F.; Brownson, R.C. Evidence-based intervention in physical activity: Lessons from around the world. Lancet 2012, 380, 272–281. [Google Scholar] [CrossRef] [Green Version]
- Huang, N.C.; Shiann-Far, K.; Hu, S. The Relationship between Urbanization, the Built Environment, and Physical Activity among Older Adults in Taiwan. Int. J. Environ. Res. Public Health 2018, 15, 836. [Google Scholar] [CrossRef] [PubMed] [Green Version]
- Rung, A.L.; Mowen, A.J.; Broyles, S.T.; Gustat, J. The role of park conditions and features on park visitation and physical activity. J. Phys. Act. Health 2011, 8 (Suppl. 2), S178–S187. [Google Scholar] [CrossRef] [Green Version]
- Bedimo-Rung, A.L.; Mowen, A.J.; Cohen, D.A. The significance of parks to physical activity and public health: A conceptual model. Am. J. Prev. Med. 2005, 28, 159–168. [Google Scholar] [CrossRef]
- Thompson, C.W. Activity, exercise and the planning and design of outdoor spaces—ScienceDirect. J. Environ. Psychol. 2013, 34, 79–96. [Google Scholar] [CrossRef] [Green Version]
- Grahn, P.; Stigsdotter, U.A. Landscape planning and stress. Urban For. Urban Green. 2004, 2, 1–18. [Google Scholar] [CrossRef] [Green Version]
- Joseph, R.P.; Maddock, J.E. Observational Park-based physical activity studies: A systematic review of the literature. Prev. Med. 2016, 89, 257–277. [Google Scholar] [CrossRef] [Green Version]
- Liu, Z.; Lin, Y.; Meulder, B.D.; Wang, S. Can greenways perform as a new planning strategy in the Pearl River Delta, China. Landsc. Urban Plan. 2019, 187, 81–95. [Google Scholar] [CrossRef]
- Little, C.E. Greenways for America; JHU Press: Baltimore, MA, USA, 1995. [Google Scholar]
- Sga, B.; Dlr, A.; Nv, A.; Mkab, C. A new urban greenway in Vancouver, British Columbia: Adolescents’ perspectives, experiences and vision for the future. J. Transp. Health 2019, 15, 100620. [Google Scholar]
- Shafer, C.S.; L Ee, B.K.; Turner, S. A tale of three greenway trails: User perceptions related to quality of life. Landsc. Urban Plan. 2000, 49, 163–178. [Google Scholar] [CrossRef]
- Dallat, M.; Soerjomataram, I.; Hunter, R.F.; Tully, M.A.; Cairns, K.J.; Kee, F. Urban greenways have the potential to increase physical activity levels cost-effectively. Eur. J. Public Health 2014, 24, 190. [Google Scholar] [CrossRef] [Green Version]
- West, S.T.; Shores, K.A. The Impacts of Building a Greenway on Proximate Residents’ Physical Activity. J. Phys. Act. Health 2011, 8, 1092–1097. [Google Scholar] [CrossRef]
- Ewing, R.; Handy, S.; Brownson, R.C.; Clemente, O.; Winston, E. Identifying and Measuring Urban Design Qualities Related to Walkability. J. Phys. Act. Health 2006, 3, S223–S240. [Google Scholar] [CrossRef]
- Ewing, R.; Cervero, R. Travel and the built environment: A meta-analysis. J. Am. Plan. Assoc. 2010, 76, 265–294. [Google Scholar] [CrossRef]
- Cauwenberg, J.V.; Nathan, A.; Ba Rnett, A.; Ba Rnett, D.W.; Cerin, E. Relationships Between Neighbourhood Physical Environmental Attributes and Older Adults’ Leisure-Time Physical Activity: A Systematic Review and Meta-Analysis. Sports Med. 2018, 48, 1635–1660. [Google Scholar] [CrossRef]
- Kl, A.; Kwms, B.; Xi, Y.; Yuan, G.C.; Dan, L.C. Where do networks really work? The effects of the Shenzhen greenway network on supporting physical activities. Landsc. Urban Plan. 2016, 152, 49–58. [Google Scholar]
- Akpinar, A. Factors influencing the use of urban greenways: A case study of Aydn, Turkey. Urban For. Urban Green. 2016, 16, 123–131. [Google Scholar] [CrossRef]
- Xie, B.; Lu, Y.; Wu, L.; An, Z. Dose-response effect of a large-scale greenway intervention on physical activities: The first natural experimental study in China. Health Place 2021, 67, 102502. [Google Scholar] [CrossRef]
- Liu, X.; Zhu, Z.; Jin, L.; Lu, W.; Huang, C. Measuring patterns and mechanism of greenway use—A case from Guangzhou, China. Urban For. Urban Green. 2018, 34, 55–63. [Google Scholar] [CrossRef]
- Miao, X.U.; Chen, R.; Sun, K.; Yang, M. A Healthy City Design Exploration for the Ladder Trails from the Perspective of the Elderly People:A Case Study of Chongqing Mountain Trails. Shanghai Urban Plan. Rev. 2017. Available online: https://en.cnki.com.cn/Article_en/CJFDTotal-HCSG201703004.htm (accessed on 13 March 2019).
- Yan, B.; Li, Z. Study of Slow System Planning on Mountain City—Taking the Yuzhong Peninsula as an Example. Chin. Landsc. Archit. 2018. Available online: https://en.cnki.com.cn/Article_en/CJFDTotal-ZGYL201804011.htm (accessed on 18 October 2019).
- Boreham, C.; Wallace, W.; Nevill, A. Training effects of accumulated daily stair-climbing exercise in previously sedentary young women. Prev. Med. 2000, 30, 277–281. [Google Scholar] [CrossRef] [PubMed]
- Buechter, R.B.; Fechtelpeter, D. Climbing for preventing and treating health problems: A systematic review of randomized controlled trials. GMS Ger. Med. Sci. 2011, 9, Doc19. [Google Scholar] [PubMed]
- Bergland, A.; Sylliaas, H.; Jarnlo, G.B.; Wyller, T.B. Health, Balance, and Walking as Correlates of Climbing Steps. J. Aging Phys. Act. 2008, 16, 42–52. [Google Scholar] [CrossRef]
- Olander, E.K.; Eves, F.F. Effectiveness and Cost of Two Stair-Climbing Interventions—Less Is More. Am. J. Health Promot. AJHP 2011, 25, 231. [Google Scholar] [CrossRef] [PubMed]
- Hirsch, J.A.; Peter, J.; Robinson, J.; Eastman, K.M.; Conley, K.D.; Evenson, K.R.; Francine, L. Using MapMyFitness to Place Physical Activity into Neighborhood Context. Front. Public Health 2014, 2, 19. [Google Scholar] [CrossRef] [Green Version]
- Hou, N.; Popkin, B.M.; Jacobs, D.R.; Yan, S.; Guilkey, D.; Lewis, C.E.; Gordon-Larsen, P. Longitudinal associations between neighborhood-level street network with walking, bicycling, and jogging: The CARDIA study. Health Place 2010, 16, 1206–1215. [Google Scholar] [CrossRef] [PubMed] [Green Version]
- Fynn, J.F.; Hardeman, W.; Milton, K.; Murphy, J.; Jones, A. A systematic review of the use and reporting of evaluation frameworks within evaluations of physical activity interventions. Int. J. Behav. Nutr. Phys. Act. 2020, 17, 107. [Google Scholar] [CrossRef]
- Chen, Y.; Gu, W.; Tao, L.; Lei, Y.; Zeng, M. Increasing the Use of Urban Greenways in Developing Countries: A Case Study on Wutong Greenway in Shenzhen, China. Int. J. Environ. Res. Public Health 2017, 14, 554. [Google Scholar] [CrossRef] [Green Version]
- Liu, Z.; Lin, Y.; Meulder, B.D.; Wang, S. Heterogeneous landscapes of urban greenways in Shenzhen: Traffic impact, corridor width and land use. Urban For. Urban Green. 2020, 55, 126785. [Google Scholar] [CrossRef]
- Smit, M.; Hosking, J.; Woodward, A.; Witten, K.; MacMillan, A. Systematic literature review of built environment effects on physical activity and active transport—An update and new findings on health equity. Int. J. Behav. Nutr. Phys. Act. 2017, 14, 158. [Google Scholar] [CrossRef] [PubMed]
- Dobbs, C.; Escobedo, F.J.; Zipperer, W.C. A framework for developing urban forest ecosystem services and goods indicators. Landsc. Urban Plan. 2011, 99, 196–206. [Google Scholar] [CrossRef]

| MUG Type | Description | Source | Proportion | Photo |
|---|---|---|---|---|
| Transportation (T-MUG) | Non-motor pathway connects transit to urban clusters and provides people routes for traveling. | Mainly from the renovation of walkways. | 33.4% (32.80 km) |  |
| Recreational (R-MUG) | Walkways connect attractions and places of interest to communities, providing people places for hiking, sightseeing and other types of recreational activities. | Newly built greenway. | 19.6% (19.20 km) | 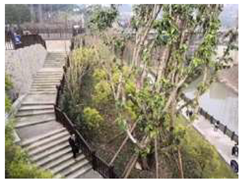 |
| Livelihood (L-MUG) | Pedestrian-only pathways connect communities and public facilities, providing people places for shopping, socializing and visiting. | Mainly from conservation and extension of existing streets. | 47.0% (46.20 km) |  |
| R-MUG (km) | T-MUG (km) | L-MUG (km) | Total (km) | |
|---|---|---|---|---|
| PA presence | 14.8 | 13.5 | 18.8 | 47.1 (48.0%) |
| No presence | 4.4 | 19.3 | 27.4 | 51.1 (52.0%) |
| Total | 19.2 (19.6%) | 32.8 (33.4%) | 46.2 (47.0%) | 98.2 (100.0%) |
| Type | PA Density (km/km2) | PA Attributes | ||||||
|---|---|---|---|---|---|---|---|---|
| Duration (min) | Distance (km) | Speed (km/h) | ||||||
| Range | Mean | Range | Mean | Range | Mean | Range | Mean | |
| R-MUG | 0.0020–0.1728 | 0.0158 | 30.0–424.6 | 79.8 | 1.4–12.1 | 4.1 | 2.1–6.4 | 5.0 |
| T-MUG | 0.0001–0.2081 | 0.0072 | 20.2–104.3 | 32.7 | 1.1–15.2 | 2.9 | 1.8–7.3 | 5.2 |
| L-MUG | 0.0001–0.1370 | 0.0048 | 27.2–217.2 | 54.9 | 1.0–13.8 | 2.3 | 1.9–5.4 | 3.9 |
| Type | Slope | Node Ratio (n/km) | ||
|---|---|---|---|---|
| MUG | Range | Mean | Range | Mean |
| R-MUG | 0.006–0.079 | 0.026 | 0.002–0.034 | 0.014 |
| T-MUG | 0.012–0.141 | 0.038 | 0.006–0.051 | 0.016 |
| L-MUG | 0.019–0.189 | 0.047 | 0.004–0.079 | 0.021 |
| Type | Residential Density (%) | Mixture of Land Use | Open Space POI (n/km) | Transit POI (n/km) | Shop POI (n/km) | |||||
|---|---|---|---|---|---|---|---|---|---|---|
| Range | Mean | Range | Mean | Range | Mean | Range | Mean | Range | Mean | |
| R-MUG | 6–29 | 18 | 0.07–0.82 | 0.57 | 4–24 | 12.5 | 7–29 | 18.4 | 19–48 | 32.5 |
| T-MUG | 15–45 | 27 | 0.16–0.85 | 0.71 | 1–9 | 7.8 | 15–48 | 35.2 | 25–64 | 45.1 |
| L-MUG | 21–69 | 48 | 0.37–0.87 | 0.67 | 0–10 | 5.9 | 11–30 | 22.5 | 38–89 | 66.2 |
| Model 1 | Factor | 1st StepB p-Value | 2nd StepB p-Value | ||
|---|---|---|---|---|---|
| Control variable (Surrounding environmental characteristic of MUG) | Residential density | 2.145 * | 0.000 | 2.674 * | 0.000 |
| Mixture of land use | 3.121 * | 0.030 | 7.441 | 0.312 | |
| Open space POI | 1.152 * | 0.000 | 2.32 * | 0.000 | |
| Transit POI | 5.218 * | 0.021 | 1.239 * | 0.001 | |
| Shop POI | 0.021 | 0.821 | 0.002 | 0.119 | |
| Independent variable (MUG characteristics) | Node ratio | 0.009 * | 0.021 | ||
| Slope | −1.513 * | 0.000 | |||
| T-MUG ratio | 1.531 * | 0.002 | |||
| L-MUG ratio | 0.625 | 0.127 | |||
| R-MUG ratio | 2.314 * | 0.000 | |||
| Constant | −0.167 | 0.219 | −0.128 | 0.651 | |
| R square | 0.113 | 0.264 | |||
| Model 2: Step 1 | Factor | PA Attribute | Duration | Speed | |||
|---|---|---|---|---|---|---|---|
| Distance | |||||||
| B | Sig | B | p-Value | B | Sig | ||
| Control variable (Surrounding environmental characteristic of MUG) | Residential density | −0.027 | 0.346 | 1.156 * | 0.014 | −6.514 | 0.540 |
| Mixture of land use | −4.581 | 0.453 | −2.841 | 0.515 | −0.358 | 0.815 | |
| Open space POI | 0.951 * | 0.000 | 0.614 * | 0.001 | 0.935 | 1.548 | |
| Transit POI | 0.622 | 0.356 | 0.561 | 0.096 | −0.684 * | 0.000 | |
| Shop POI | 4.156 | 0.678 | 2.159 | 0.156 | 3.256 | 0.681 | |
| Constant | 0.053 | 0.078 | 0.652 | ||||
| R square | 0.257 | 0.234 | 0.201 | ||||
| Model 2: Step 1 | Factor | PA Attribute | Duration | Speed | |||
|---|---|---|---|---|---|---|---|
| Distance | |||||||
| B | p-Value | B | p-Value | B | p-Value | ||
| Control variable (Surrounding environmental characteristic of a MUG) | Residential density | −0.944 | 0.346 | 0.035 | 0.531 | −0.195 | 0.062 |
| Mixture of land use | −0.751 | 0.453 | −0.197 | 0.680 | −0.130 | 0.256 | |
| Open space POI | 0.219 * | 0.000 | 0.192 * | 0.000 | 0.638 | 0.144 | |
| Transit POI | 0.169 | 0.626 | 0.175 | 0.096 | −0.195 | 1.210 | |
| Shop POI | 0.097 | 0.090 | 0.201 | 0.156 | 0.523 | 0.129 | |
| Independent variable (MUG characteristics) | Node ratio | 0.142 * | 0.013 | 0.223 | 0.087 | 0.147 | 0.982 |
| Slope | −0.741 * | 0.006 | −0.516 | 0.617 | −1.546 * | 0.000 | |
| T-MUG ratio | 0.089 | 0.052 | 0.340 * | 0.027 | 0.224 * | 0.017 | |
| L-MUG ratio | −0.055 | 0.414 | 0.190 | 0.247 | −0.008 | 0.994 | |
| R-MUG ratio | 0.323 * | 0.000 | 1.273 * | 0.000 | 0.015 | 0.114 | |
| Constant | 0.005 | 0.021 | 0.681 | ||||
| R square | 0.341 | 0.365 | 0.282 | ||||
Publisher’s Note: MDPI stays neutral with regard to jurisdictional claims in published maps and institutional affiliations. |
© 2021 by the authors. Licensee MDPI, Basel, Switzerland. This article is an open access article distributed under the terms and conditions of the Creative Commons Attribution (CC BY) license (https://creativecommons.org/licenses/by/4.0/).
Share and Cite
Ma, M.; Ding, L.; Kou, H.; Tan, S.; Long, H. Effects and Environmental Features of Mountainous Urban Greenways (MUGs) on Physical Activity. Int. J. Environ. Res. Public Health 2021, 18, 8696. https://doi.org/10.3390/ijerph18168696
Ma M, Ding L, Kou H, Tan S, Long H. Effects and Environmental Features of Mountainous Urban Greenways (MUGs) on Physical Activity. International Journal of Environmental Research and Public Health. 2021; 18(16):8696. https://doi.org/10.3390/ijerph18168696
Chicago/Turabian StyleMa, Ming, Liang Ding, Huaiyun Kou, Shaohua Tan, and Hao Long. 2021. "Effects and Environmental Features of Mountainous Urban Greenways (MUGs) on Physical Activity" International Journal of Environmental Research and Public Health 18, no. 16: 8696. https://doi.org/10.3390/ijerph18168696
APA StyleMa, M., Ding, L., Kou, H., Tan, S., & Long, H. (2021). Effects and Environmental Features of Mountainous Urban Greenways (MUGs) on Physical Activity. International Journal of Environmental Research and Public Health, 18(16), 8696. https://doi.org/10.3390/ijerph18168696