Article

One Year of COVID-19 Pandemic in Italy: Effect of Sedentary Behavior on Physical Activity Levels and Musculoskeletal Pain among University Students

1
Department of Psychology, Educational Science and Human Movement, University of Palermo, Via Giovanni Pascoli 6, 90144 Palermo, Italy
2
Department of Biomedical and Biotechnological Sciences, Human, Histology and Movement Science Section, University of Catania, Via S. Sofia n°87, 95123 Catania, Italy
3
Research Center on Motor Activities (CRAM), University of Catania, 95123 Catania, Italy
4
Department of Biology, College of Science and Technology, Temple University, Philadelphia, PA 19122, USA
*
Author to whom correspondence should be addressed.
Int. J. Environ. Res. Public Health 2021, 18(16), 8680; https://doi.org/10.3390/ijerph18168680
Submission received: 6 July 2021 / Revised: 12 August 2021 / Accepted: 15 August 2021 / Published: 17 August 2021
(This article belongs to the Special Issue Physical Activity and Sport in the COVID-19 Context)

Abstract

:
The COVID-19 outbreak forced Italian students to reduce their daily activities, inducing a seden-tary attitude that was worsened by distanced learning. This study aimed to survey the physical activity levels that were maintained before and during the social restrictions following the pan-demic, their correlation to musculoskeletal pain, as well as analyzing the impact of these COVID-19 restrictions on pain and fatigue that affects daily life activities. A total of 2044 students completed the online questionnaire, of which the results of 1654 participants were eligible. Before the pandemic, the levels of physical activity were distributed as: 19.9% no activity, 30.1% light ac-tivity, 21.5% moderate activity, and 28.5% high activity. After one year of the pandemic, 30.6% of the participants were inactive, 48.1%, 10.9%, and 10.5% stated as maintaining, respectively, light, moderate and high levels of physical activity. Furthermore, 43.5% reported neck pain and 33.5% stated to experience low back pain. Physical activity levels lower than 150 min/week may have predisposed students to suffer from neck pain (1.95 OR at 95% CI, 1.44–2.64) and low back pain (1.79 OR at 95% CI, 1.29–2.49). A positive correlation between physical activity levels, Verbal Descriptive Scale (VDS), and pain frequency have been observed for neck and low back pain (p-value < 0.05). Finally, low physical activity levels were associated with musculoskeletal pain onset and pain worsening.

1. Introduction

The severe acute respiratory syndrome coronavirus 2 (SARS-CoV-2), responsible for the coronavirus disease 2019 (COVID-19), has spread worldwide since the first reported case in Wuhan in late December 2019, becoming the primary threat to public health in all countries. Since the World Health Organization (WHO), on 11 March 2020, declared the COVID-19 pandemic, many countries, including Italy, launched public health security plans based on the promotion of social distancing, wearing anti-infection masks, and lockdown restrictions. These extreme measures induced lifestyle changes; in particular, quarantine caused a reduction in physical activity (PA) levels per week in all different age groups, leading to decreased levels of psychological well-being in Italy [1]. Physical inactivity also plays a crucial role in non-communicable chronic disease, which is considered responsible for over three million premature deaths worldwide every year [2]. The relationship between quarantine-imposed reduced PA levels and musculoskeletal pain (MP) is a topic of growing interest today. Sagát et al. [3] showed how this extreme lifestyle change led to an increase in low back and neck pain prevalence in Riyadh’s population aged 18 to 64. Toprak et al. [4] compared people who stayed home and continued to work during the three-month lockdown of the pandemic in Turkey, and found that those who stayed home had increased MP symptoms that were likely due to lower PA levels.
One of the social categories most affected by restricted mobility and reduced PA levels is students. Students typically spend many hours seated on non-ergonomic chairs and assuming incorrect postures to carry out their curricular activities, leading to a general musculoskeletal overload [5]. Furthermore, while spending much time using laptops and smartphones to study and support leisure activities, they adopt incorrect postures, leading to musculoskeletal alteration and pain, especially to the neck and the spine [6]. Haroon et al. [7] reported a high incidence of MP in Karachi’s university medical students, identifying the usage of laptops for more than three hours per day as a risk factor for neck pain. Different studies [8,9,10] conducted among university students highlighted a high percentage of them stating MP, especially at the neck and low back. Furthermore, inactive students commonly reported mild/moderate pain, while physically active students referred to severe pain with a higher frequency over the month than inactive ones.
This study aimed to survey the PA levels and their correlation to MP among university students from Italy, before and during the pandemic restriction, therefore analyzing the impact of COVID-19 restrictions on pain and fatigue affecting daily life activities.

2. Materials and Methods

2.1. Design

This study employed an online survey addressed to Italian university students through the Google Forms web survey platform (Google LLC, Mountain View, CA, USA). The online survey was displayed through social media, such as Instagram and Facebook, and sent to personal contacts and university students via WhatsApp and email. Participants were informed about the aims of the study, data anonymization, and protection. They were asked to provide informed consent before participation: “The data of this survey are anonymous, and their confidentiality will be guaranteed in compliance with the Italian and European legislation on the protection of personal data. We remind you that participation is voluntary, and therefore you can withdraw or give up at any time. The participant, adequately informed of the methods and purposes of the research described above, gives his consent to his participation, ensuring that his personal data will be treated anonymously”.

2.2. Participants

A total of 2044 Italian university students completed the online Google form questionnaire from 8 February to 21 March 2021, during the COVID-19 lockdown in Italy. A data cleansing process has been applied to remove ineligible data following the American Association for Public Opinion Research guidelines [11]. The eligible responses for this study were 1654: 1026 from females (62%) and 628 from males (38%).

2.3. Questionnaire

The online questionnaire (https://forms.gle/dzCy8MSdYUdq3wEb8) (accessed on 8 February 2021) aimed to investigate the effect of a sedentary lifestyle and the presence of spinal pain due to the pandemic restrictions among university students. The questionnaire was divided into four sections. The first (1) section comprised demographic, anthropometric, socioeconomic data, health status, and lifestyle questions. In addition, it introduces questions concerning PA levels before and during the COVID-19 pandemic, whether weight gain occurred during one year of restrictions, and how many hours were spent seated during the day due to online distance learning. The second (2) and third (3) sections comprised cervical and lumbar questions investigating whether the students ever experienced spine pain before the pandemic, or if the pain occurred for the first time during the pandemic, pain score based on Verbal Descriptive Scale (VDS) [12], pain frequency during the week/month. Furthermore, the moment of the day and the type of posture in which the pain occurs, symptoms related to the pain, and if they use drugs or specific exercise to reduce the pain. The fourth (4) section was an adapted version of the SF-36 “limitation of activities” section [13] which investigated the perception of breathlessness, i.e., air hunger, tachycardia, perceived during the COVID-19 emergency (from March 2020 to March 2021) due to anti-infection mask usage. This section comprised five questions with three possible answers, each related to a specific score: no reduction = 2, mild reduction = 1, and severe reduction = 0. Based on the SF-36 recommendations for scoring protocol, participants of the study achieving a high overall score were classified as no fatigue subjects; meanwhile, those with a low overall score were classified as moderate fatigue subjects, according to the SF-36 classification method.

2.4. Statistical Analysis

Statistical analysis was performed using R Project for Statistical Computing (Vienna, Austria) [14,15] and Jamovi (Version 1.6, Sydney, Australia) [16]. The analysis was conducted with the use of descriptive statistics. Statistical differences between groups were tested using the t-test, Chi-square test, and the Kendall–tau rank correlation coefficient. The odds ratio (OR) and corresponding 95% confidence intervals (CI) were calculated. Levels of significance were set at α < 0.05.

3. Results

3.1. General Characteristics of the Study Population

Baseline characteristics of the study subjects are displayed in Table 1. Overall, the study sample (n = 1654) comprised 62% females and 38% males. The sample consists of university students whose mean age was 22.51 ± 3.12 (p-value < 0.05), height 169.04 ± 8.84 centimeters, weight 65.24 ± 13.38 kg, and body mass index (BMI) was 22.7 ± 3.5 kg/m2. The values of BMI identified three categories: underweight (BMI < 18.5), normal weight (BMI 18.5–24.9), and overweight (BMI > 25.0), 71.1% of participants were classified as normal-weight subjects.

3.2. Physical Activity Levels before and after One Year of the COVID-19 Pandemic in Italy

Participants gave information about PA levels before the pandemic, i.e., before March 2020, and during the pandemic, i.e., from March 2020 to March 2021, considering whether the pandemic had increased or decreased PA. The subjects were therefore clustered into four categories depending on their level of PA per week: no activity (0 min/week), light activity (<140 min/week of PA), moderate activity (≃150 min/week of PA), and high activity (>200 min/week of PA). Before the pandemic, the total number of participants is distributed according to activity levels: 19.9% no activity, 30.1% light activity, 21.5% moderate activity, and 28.5% high activity. During one year of pandemic restriction, the total number of participants is distributed according to activity levels: 30.6% no activity, 48.1% light activity, 10.9% moderate activity, and 10.5% high activity, Table 2. The data report an increase of no activity behavior and a drastic decrease of moderate and high PA levels following one year of pandemic. However, the percentage of those practicing light levels of PA recorded an increase of 18%.
The fourth section measured the fatigue levels, specifically by investigating the perception of breathlessness, i.e., air hunger, tachycardia, perceived during the pandemic. The mean average score was 6.37 ± 2.89, attesting to an overall high score for this section. The density plot, Figure 1a, presents a left asymmetrical skewness of the data (skewness = −0.48). Additionally, the boxplot, Figure 1b, shows the left whisker longer than the right one, meaning that the distribution tail is longer at left, namely, the students’ fatigue levels distribution is clustered to a high score; therefore, the students did not experience high levels of fatigue due to anti-infection mask usage during COVID-19.
Secondly, students have been divided into two groups: PA < 150 min/week and PA ≥ 150 min/week, and then sub-divided by the presence of neck pain, low back pain, or both pains. As reported in Table 3, 50.5% of them stated that they experienced pain, and those with neck and low back pain belongs predominantly to the group of individuals practicing PA < 150 min/week. Data suggest that students are more prone to suffer neck pain than low back pain, 43.5%, and 33.5%, respectively. Neck pain is the most frequently reported site of pain for both PA < 150 min/week and PA ≥ 150 min/week groups.

3.3. Bodyweight and Seated Time Due to Activities Restriction during One Year of the COVID-19 Pandemic in Italy

A total of 861 students (52.1%) reported an increase in body weight after one year. Specifically, 61.9% reported a bodyweight increase of less than 5 kg, 35.1% a bodyweight increases between 5 kg and 10 kg, and only 3% stated a bodyweight increase over 10 kg.
Almost all students stated a seated time higher than 4 h/day. The 46.9% reported a seated time between 4 and 8 h, 37.1% between 8 and 12 h, and a small percentage, 8.2%, higher than 12 h.
Among those participants who reported PA levels lower than 150 min/week together with a seated time >8 h/day (38.8% of total) (Figure 2), 40.8% did not report a bodyweight increase, 34.6% stated a bodyweight increase lesser than 5 kg, 21.5% a bodyweight increase ranged between 5 kg and 10 kg, and 3.1% stated a bodyweight increase over 10 kg. These data suggest a strong correlation between a moderate-to-high body weight increase and PA levels lower than 150 min/week. The odds of weight increase for those showing a sedentary behavior are 5.36 (OR with 95% CI ranging from 3.04 to 9.47) times of those practicing PA, Table A1.

3.4. Neck Pain during One Year of COVID-19 Pandemic in Italy

Participants were asked to give information about neck pain onset during the pandemic or if they were used to experience neck pain even before the pandemic; comprehensive data are shown in Table 4. Summarily, 718/1654 students (43.5%) reported the presence of neck pain. Concerning the subjects with pain, 72.1% declared having experienced neck pain during the pandemic period. The pain frequency data are almost equally distributed among all the respective answers. The highest concentration of VDS score is 45.7% moderate and 32.3% mild. Concerning the specific time window of the day, 73.3% experience neck pain after several hours of study, and 60.7% of the pain group state the seated posture as the most pain-arise related. About the relief strategies, 35.4% keep the pain during daily activities until it resolves independently, while 32.9% prefer to perform a specific exercise to reduce it. 77.1% of the latter perform neck muscle stretching and joint mobilization exercises, Table 5. Lastly, all participants were asked to recognize whether the pandemic restrictions had affected the pain onset or not. The 47.6% stated a slight pain increase, whereas 13.4% stated a severe pain increase. Furthermore, 17% of them experienced pain for the first time during the pandemic, 21.2% do not impute the pain onset to the pandemic restriction.

3.5. Low Back Pain during One Year of COVID-19 Pandemic in Italy

Participants were asked to give information about low back pain onset during the pandemic or if they were used to experience low back pain even before the pandemic; comprehensive data are shown in Table 4. Summarily, 554/1654 students (33.5%) reported the presence of low back pain. Concerning the subjects with pain, 72.9% declared having experienced low back pain during the pandemic period. The pain frequency data are almost equally distributed among all the respective answers. The highest concentration of VDS score is 39.4% moderate and 35.4% mild. Concerning the specific time window of the day, 69.7% experience low back pain after several hours of study. Furthermore, 50.5% of the pain group states that seated posture is the most pain-arise related, while 30% experience pain when walking, doing PA, or doing housework. About the relief strategies, 37.9% keep the pain during daily activities until it resolves independently, whereas another 37.9% prefer to perform a specific exercise to reduce it. 88.6% of the latter perform muscle stretching and joint mobilization exercises for the back, Table 5. Lastly, all participants were asked to recognize whether the pandemic restrictions had affected the pain onset or not. The 47.3% stated a slight pain increase, whereas 22.4% stated a severe pain increase. Furthermore, 13% of them experienced pain for the first time during the pandemic, 15.5% do not impute the pain onset to the pandemic restriction.

3.6. Neck and Low Back Pain and Sedentary Behavior during One Year of COVID-19 Pandemic in Italy

Neck and low back pain data were then crossed with sedentary conditions. Sedentary behavior (SB) was referred to individuals with PA levels <150 min/week (78.6% of the total of the students) and seated time greater than 8 h/day (45.3% of total the students). Sedentary students result as 38.8% of the total (642/1654). A percentage of 52.3% and 38.9% of them stated to experience neck and low back pain, respectively. These results might suggest that 1 out of 2 students and 1 out of 3 students having SB can be prone to suffer from neck and low back pain, respectively. The OR for the neck pain sample is 1.95 with a 95% CI ranging from 1.44 to 2.64, Table A2. The OR for the low back pain sample is 1.79 with a 95% CI ranging from 1.29 to 2.49, Table A3.

3.7. Neck VDS Scores and Pain Frequency Compared to Physical Activity Levels

Data of neck VDS score and pain frequency have been crossed with PA levels to understand if PA can modulate pain perception and occurrence. VDS contingency table, Table 6, shows the highest number of students experiencing pain is concentrated between No PA and Light PA with Mild Pain and Moderate Pain. The highest concentration is in those practicing Light PA and experiencing Moderate Pain, 24.2% of the total.
Pain frequency contingency table, Table 7, shows the frequency of neck pain during the month is almost equally shared among all the groups, except for the 16 times/month group, which comprises the lowest number of individuals. The reported percentages show that the highest concentration is in those practicing Light PA and experiencing the pain two times/month, 16.7% of the total.
The stacked bar of neck pain shows the correlation between PA levels, VDS score (Figure 3A), and pain frequency (Figure 3B). Students belonging to the No PA and Light PA categories represent most subjects with pain, suggesting that those practicing PA < 150 min/week (No PA and Light PA subjects) are more prone to experience pain. Secondly, those with a VDS score = Severe pain or very severe pain are expressed as a higher percentage in groups No PA and Light PA. Among subjects with PA ≥ 150 min/week (Moderate and High PA), the higher percentages of VDS score are represented by mild and moderate VDS levels of pain. These results suggest a lower existence of students with pain and, in addition, lower pain perception among those who comply with WHO guidelines. Similarly, the pain frequency stacked bar, Figure 3B, shows a similar trend. Nevertheless, a notable percentage of those experiencing pain 16 times/month in the High PA group suggest a possible relationship between pain frequency and high activity levels. Notably, the population suffering from neck pain is more concentrated in the Light PA group for both plots.

3.8. Low back VDS Scores and Pain Frequency Compared to Physical Activity Levels

Data of low back VDS score and pain frequency have been crossed with PA levels to understand if PA can modulate pain perception and occurrence. VDS contingency table, Table 8, shows the highest number of students experiencing pain is concentrated between No PA and Light PA with Mild Pain and Moderate Pain. The highest concentration is in those practicing Light PA and experiencing Mild Pain, 21.3% of the total.
Pain frequency contingency table, Table 9, shows the frequency of low back pain during the month is almost equally shared among all the groups, slightly higher for the 8 times/month group. The reported percentages show that the highest concentration is in those practicing Light PA and experiencing pain 8 times/month, 16.6% of the total.
The stacked bar of low back pain shows the correlation between PA levels, VDS score, Figure 4A, and pain frequency, Figure 4B. Its trend is in accordance with the neck pain stacked bar. Students belonging to No PA and Light PA categories represent most subjects with pain, suggesting that those with PA < 150 min/week are more prone to experience pain. Secondly, those with a VDS score resulting from severe pain or very severe pain are mainly present in the No PA and Light PA groups. The group Moderate PA shows a similar trend for all pain levels, although very severe pain is not present. This data might suggest that PA level close to 150 min/week, i.e., Moderate PA, is associated with lower pain perception, while PA levels lower or higher than WHO guidelines might determine an increase in pain perception. Similarly, the pain frequency stacked bar, Figure 4b, shows a similar trend. Nevertheless, there is a notable percentage of those experiencing pain 16 times/month and 8 times/month in the No PA and Light PA groups, suggesting a possible relationship between pain frequency and low activity levels. A considerable percentage of those with 16 times/month pain presence is also represented in the High PA group. This trend is similar to the VDS stacked bar and might suggest that PA levels close to 150 min/week, Moderate PA, are associated with a lower pain frequency, while PA levels lower or higher than WHO guidelines might determine an increase in pain frequency. Notably, the population suffering from low back pain is more concentrated in the Light PA group for both plots.

4. Discussion

Imposed quarantine due to the COVID-19 pandemic imposed a severe reduction in daily activities and inevitably increased the onset of MP. In the available literature concerning the COVID-19 aspects, the relationship between PA reduction and MP has not yet been investigated. To the best of our knowledge, this is the first study discussing the relationship between the reduction of PA levels, SB increase, and MP onset in university students after one year of COVID-19 restrictions in Italy.
The disease outbreak has changed young people’s lives who were used to spending most of the day away from home between study, work, commitments, friends, sports, and entertainment. 
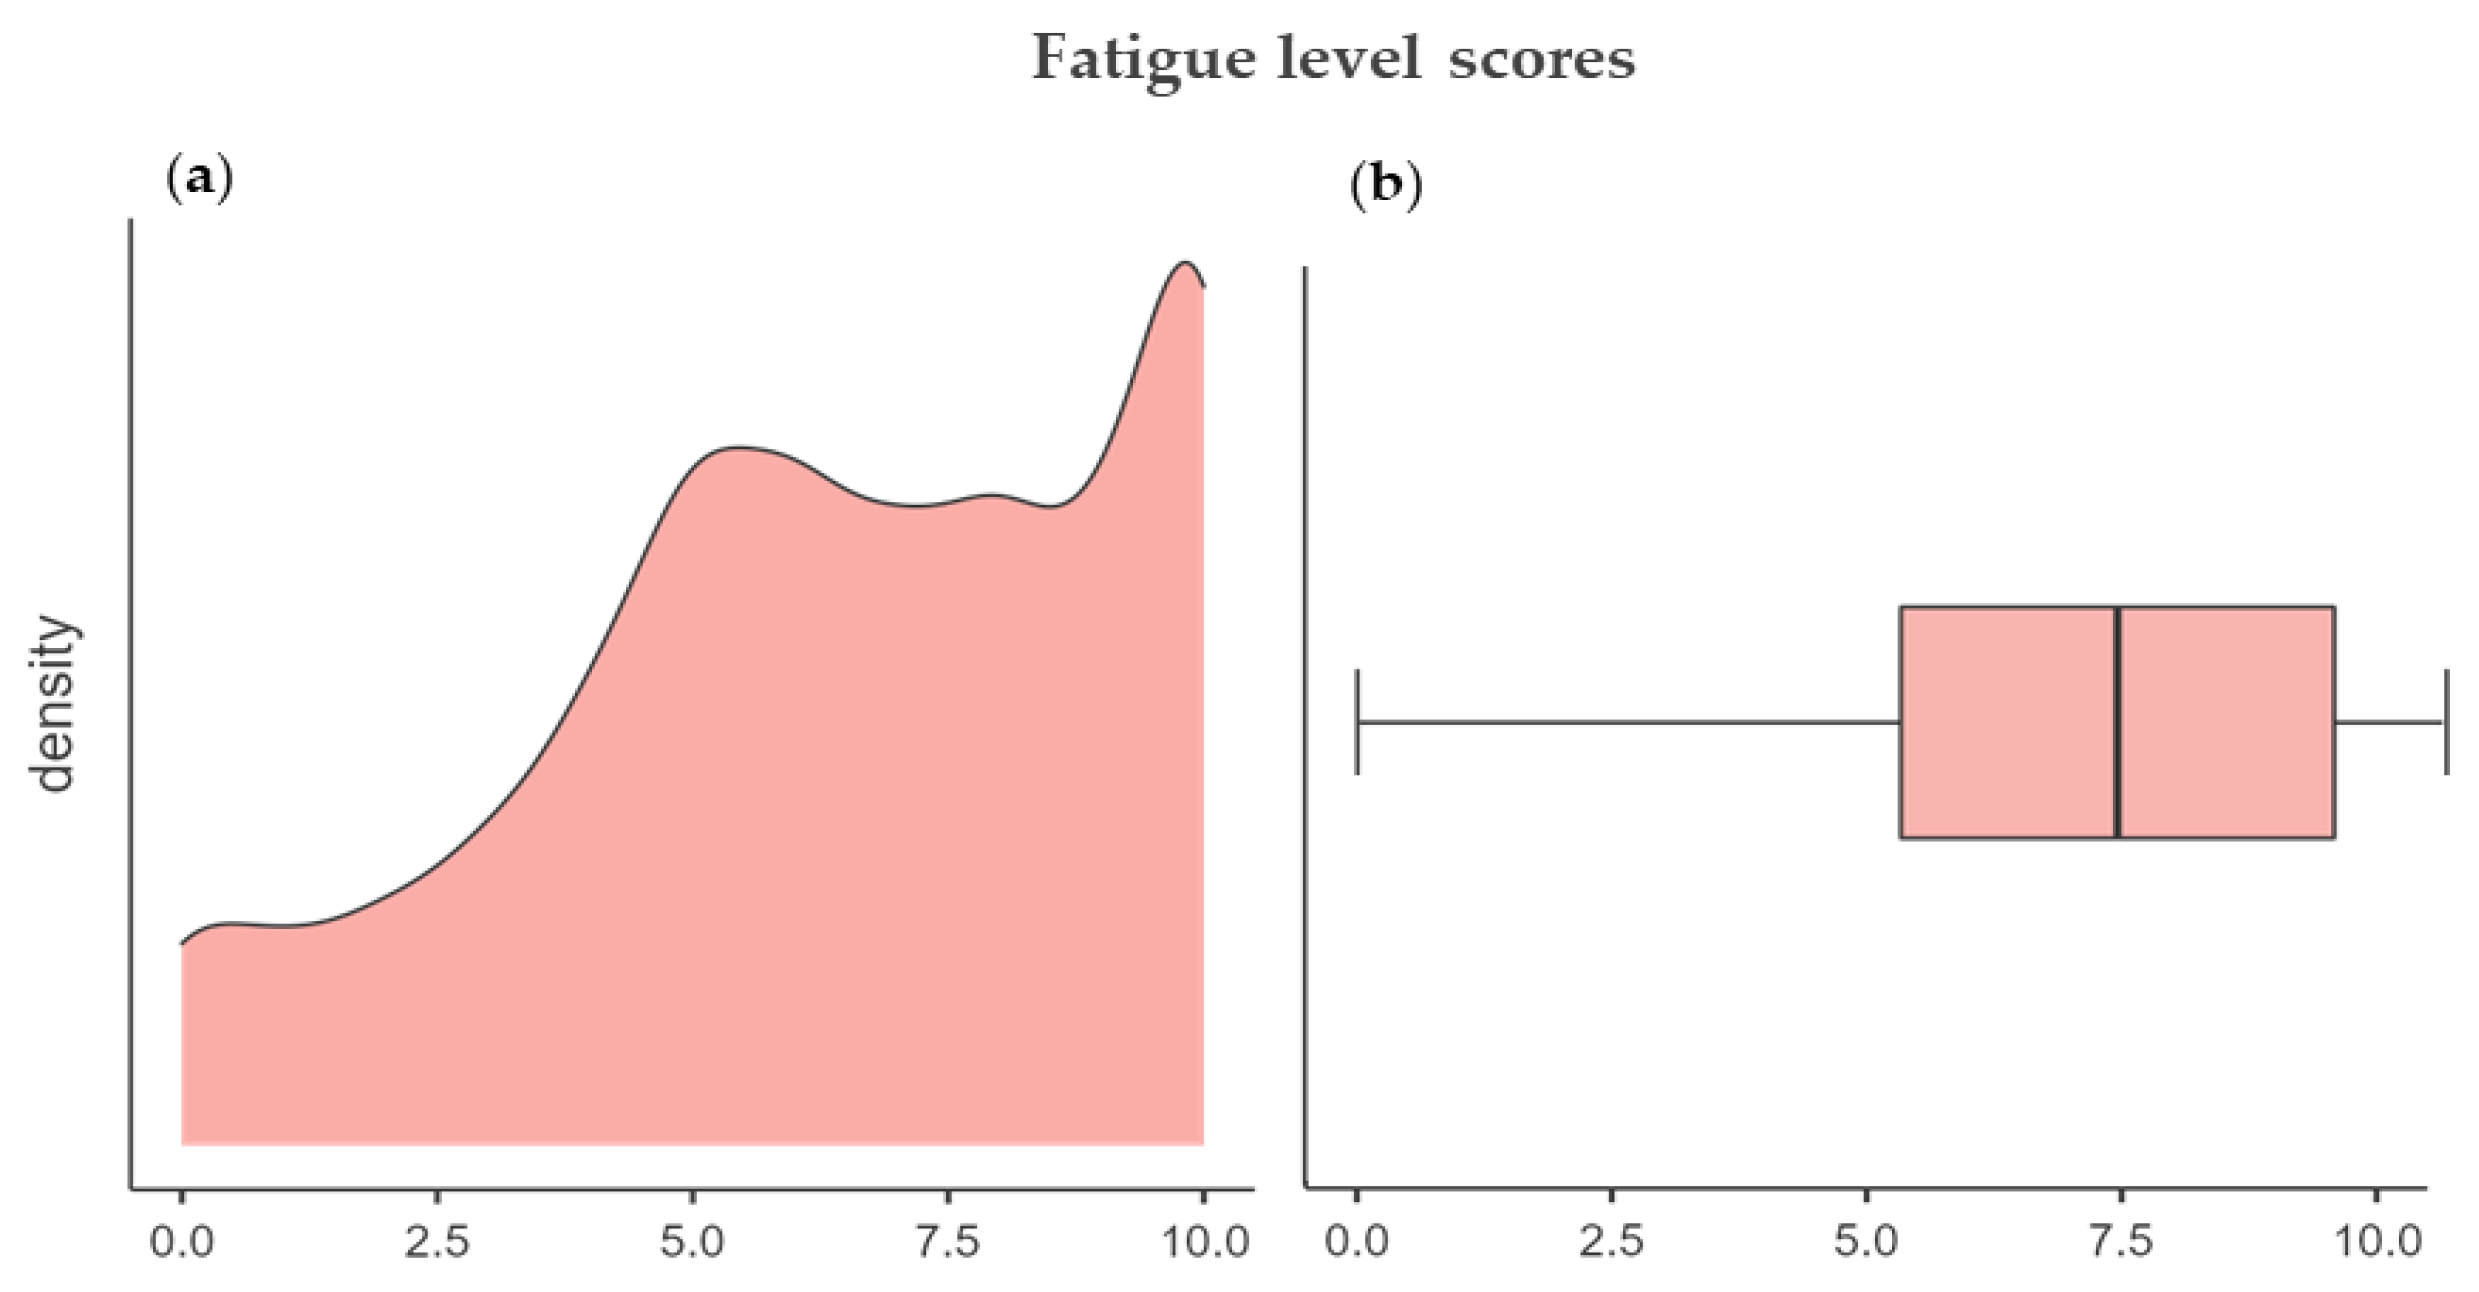
Figure 5 shows the primary outcomes of this study.
During the first pandemic period, March-May 2020, sport-related public facilities were closed, making it challenging to practice jogging, running, or walking long distances. Maugeri et al. [
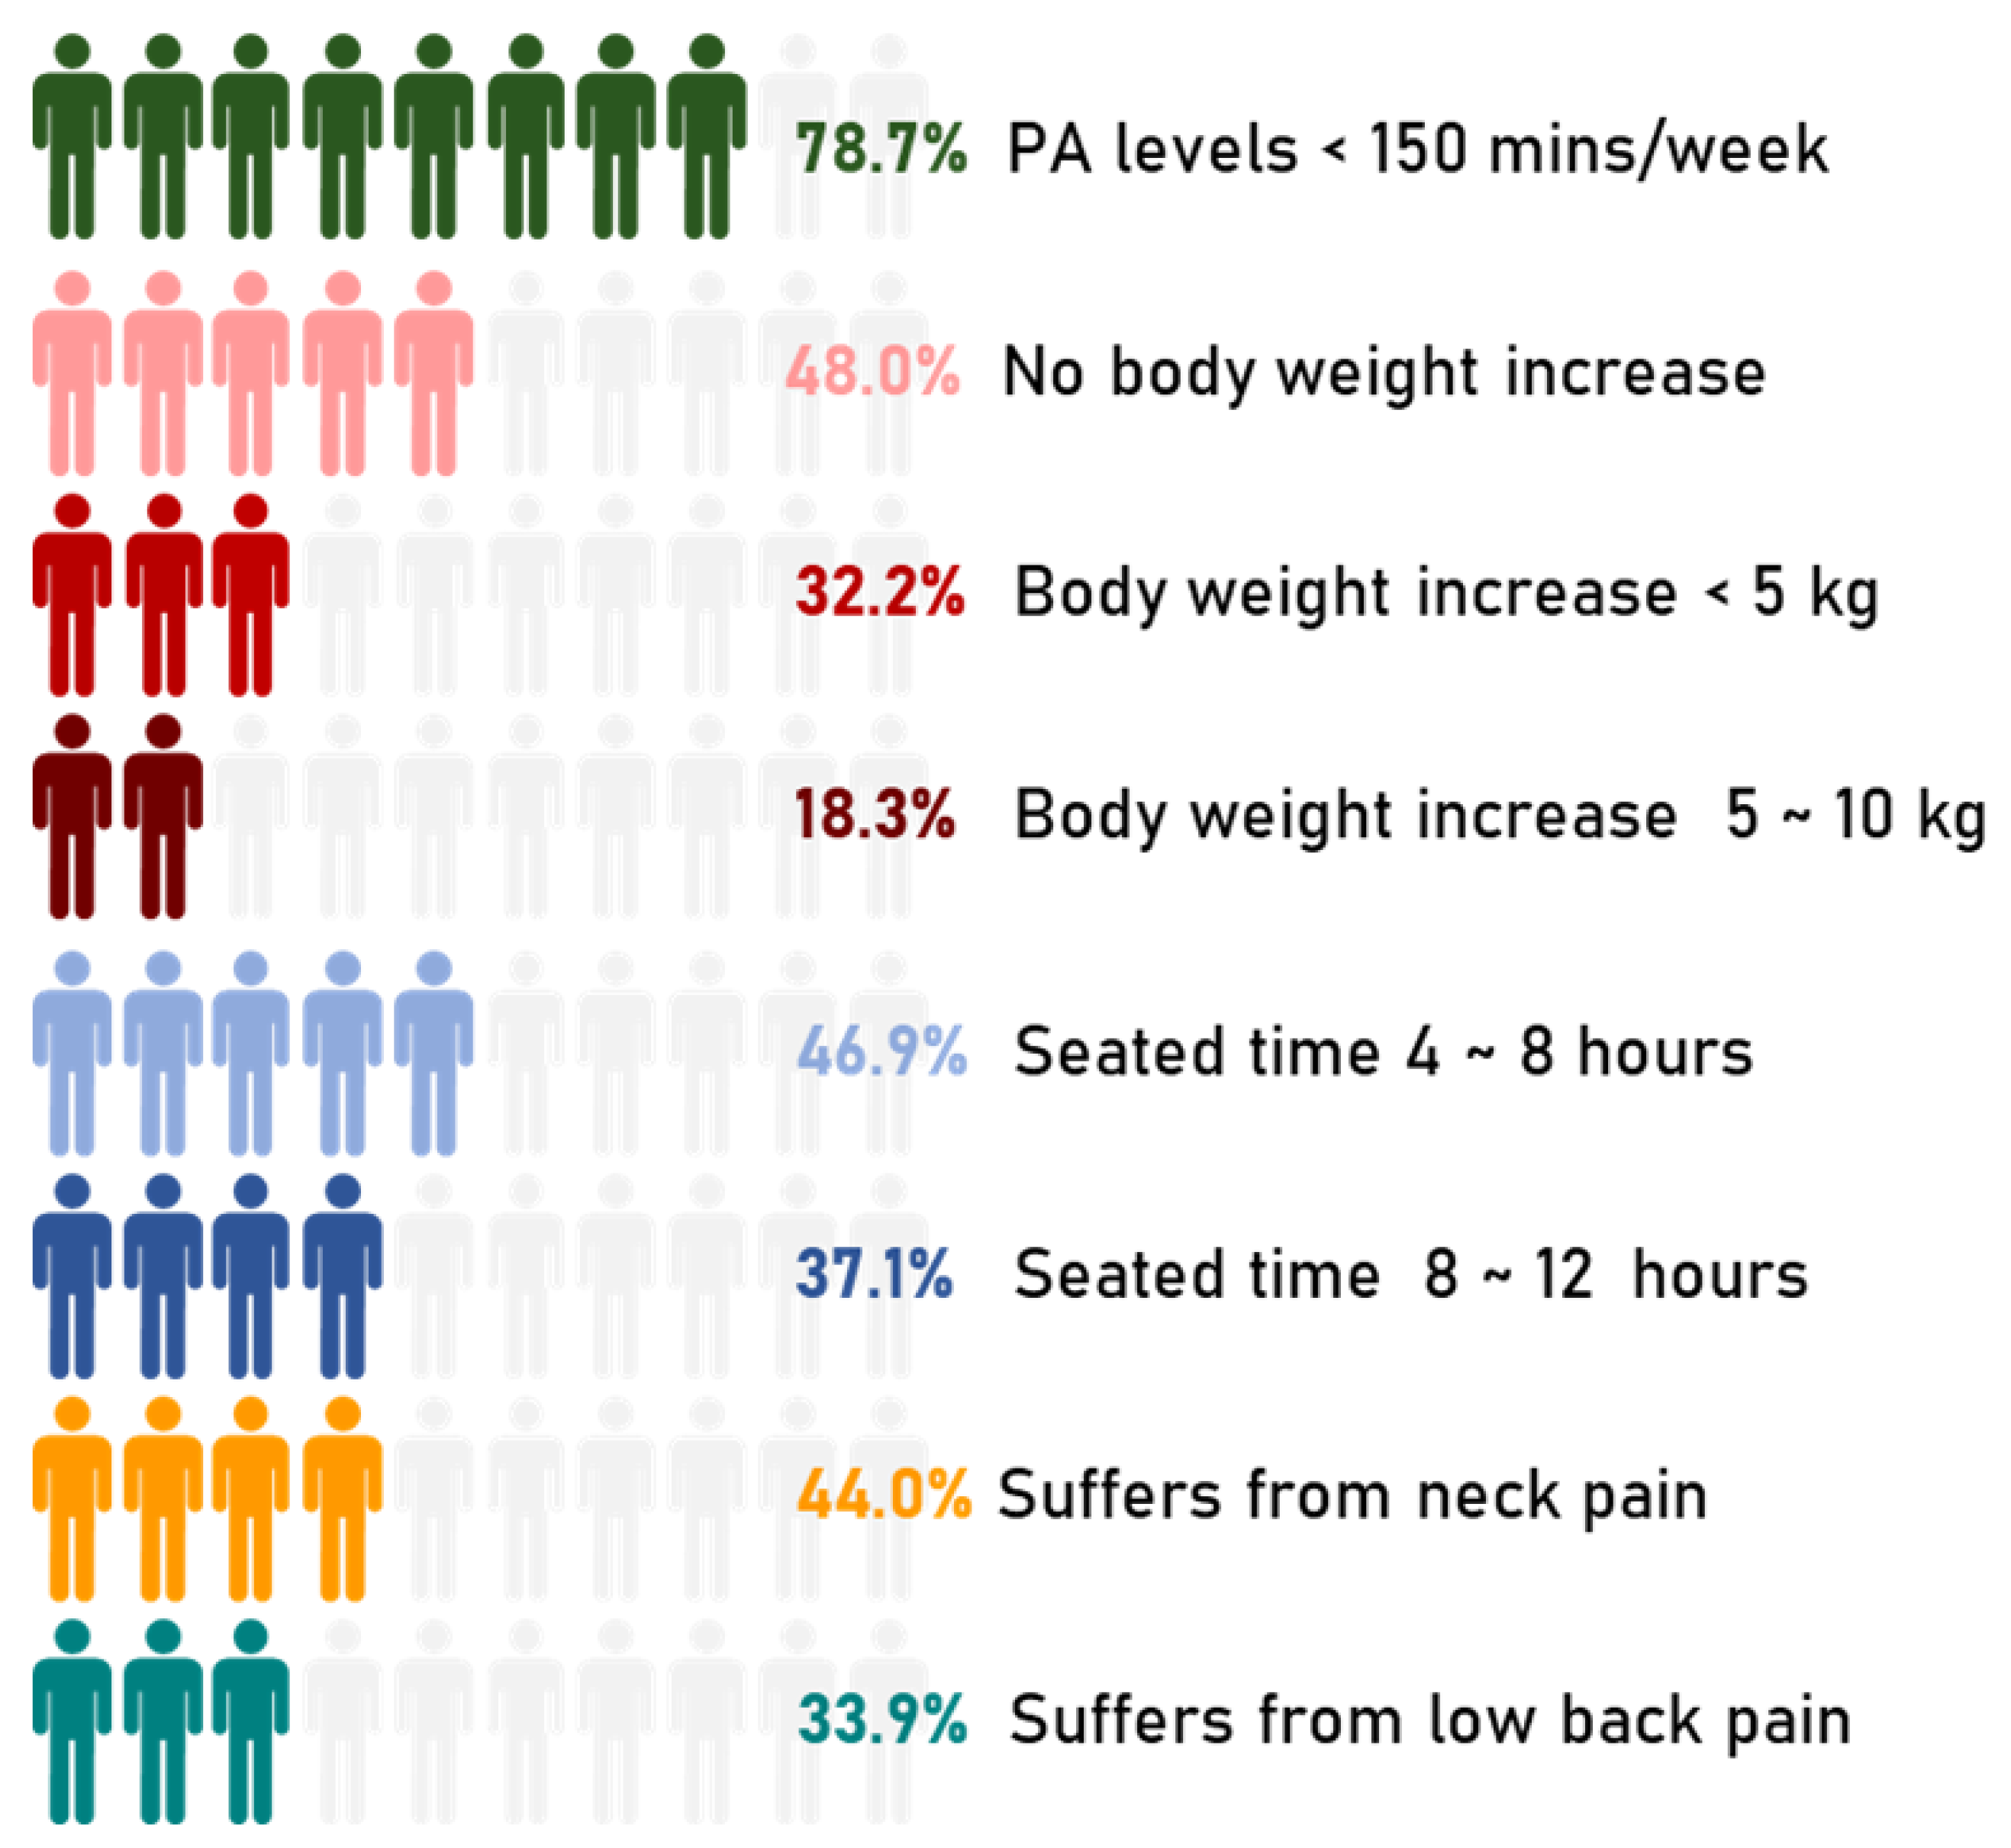
17] conducted an epidemiological analysis during the first quarantine period on 2524 Italian subjects aged 18 and 70. PA levels suffered a moderate decrease, those who practiced moderate activity decreased by about 6%, while those who practiced intense activity by 11%. Some sports activities resumed from June but starting from October, with the increase in the number of infections, sports centers closed once more, and the red zones blocked the students at home again. This event did not permit the expected recovery of sports activities, so according to our data, about 30% of the participants did not return to the PA levels they had before the pandemic after one year of experiencing a pandemic. Figure 6 shows how PA levels have changed between before and during the pandemic in one year. About 60% of those inactive before the pandemic did not change this behavior during the pandemic, while 35% practicing light activity before the pandemic became inactive during the pandemic. Interestingly, the highest percentage of people for each group, except for the inactive ones, is channeled into the light activity group. The increase of subjects performing light levels PA is due to the presence of those who started practicing PA (14.1%), probably to overcome the severe limitations of daily activities, and those who reduced their PA levels from moderate and high to light (27.1% and 23.1%, respectively). Among those who did not practice PA before the pandemic (19.9%), 40.2% started practicing PA during the pandemic. These findings contrast with Hall et al. [18], are speculating that those already sedentary before the pandemic would hardly increase their PA levels during the pandemic. Several studies analyzed reduced PA and SB worldwide [19,20,21,22]. Many authors decreed a possible end of these conditions in the summer of 2020, although unfortunately, starting from October 2020, the severe limitations were back in effect in Italy. WHO guidelines of PA and SB [
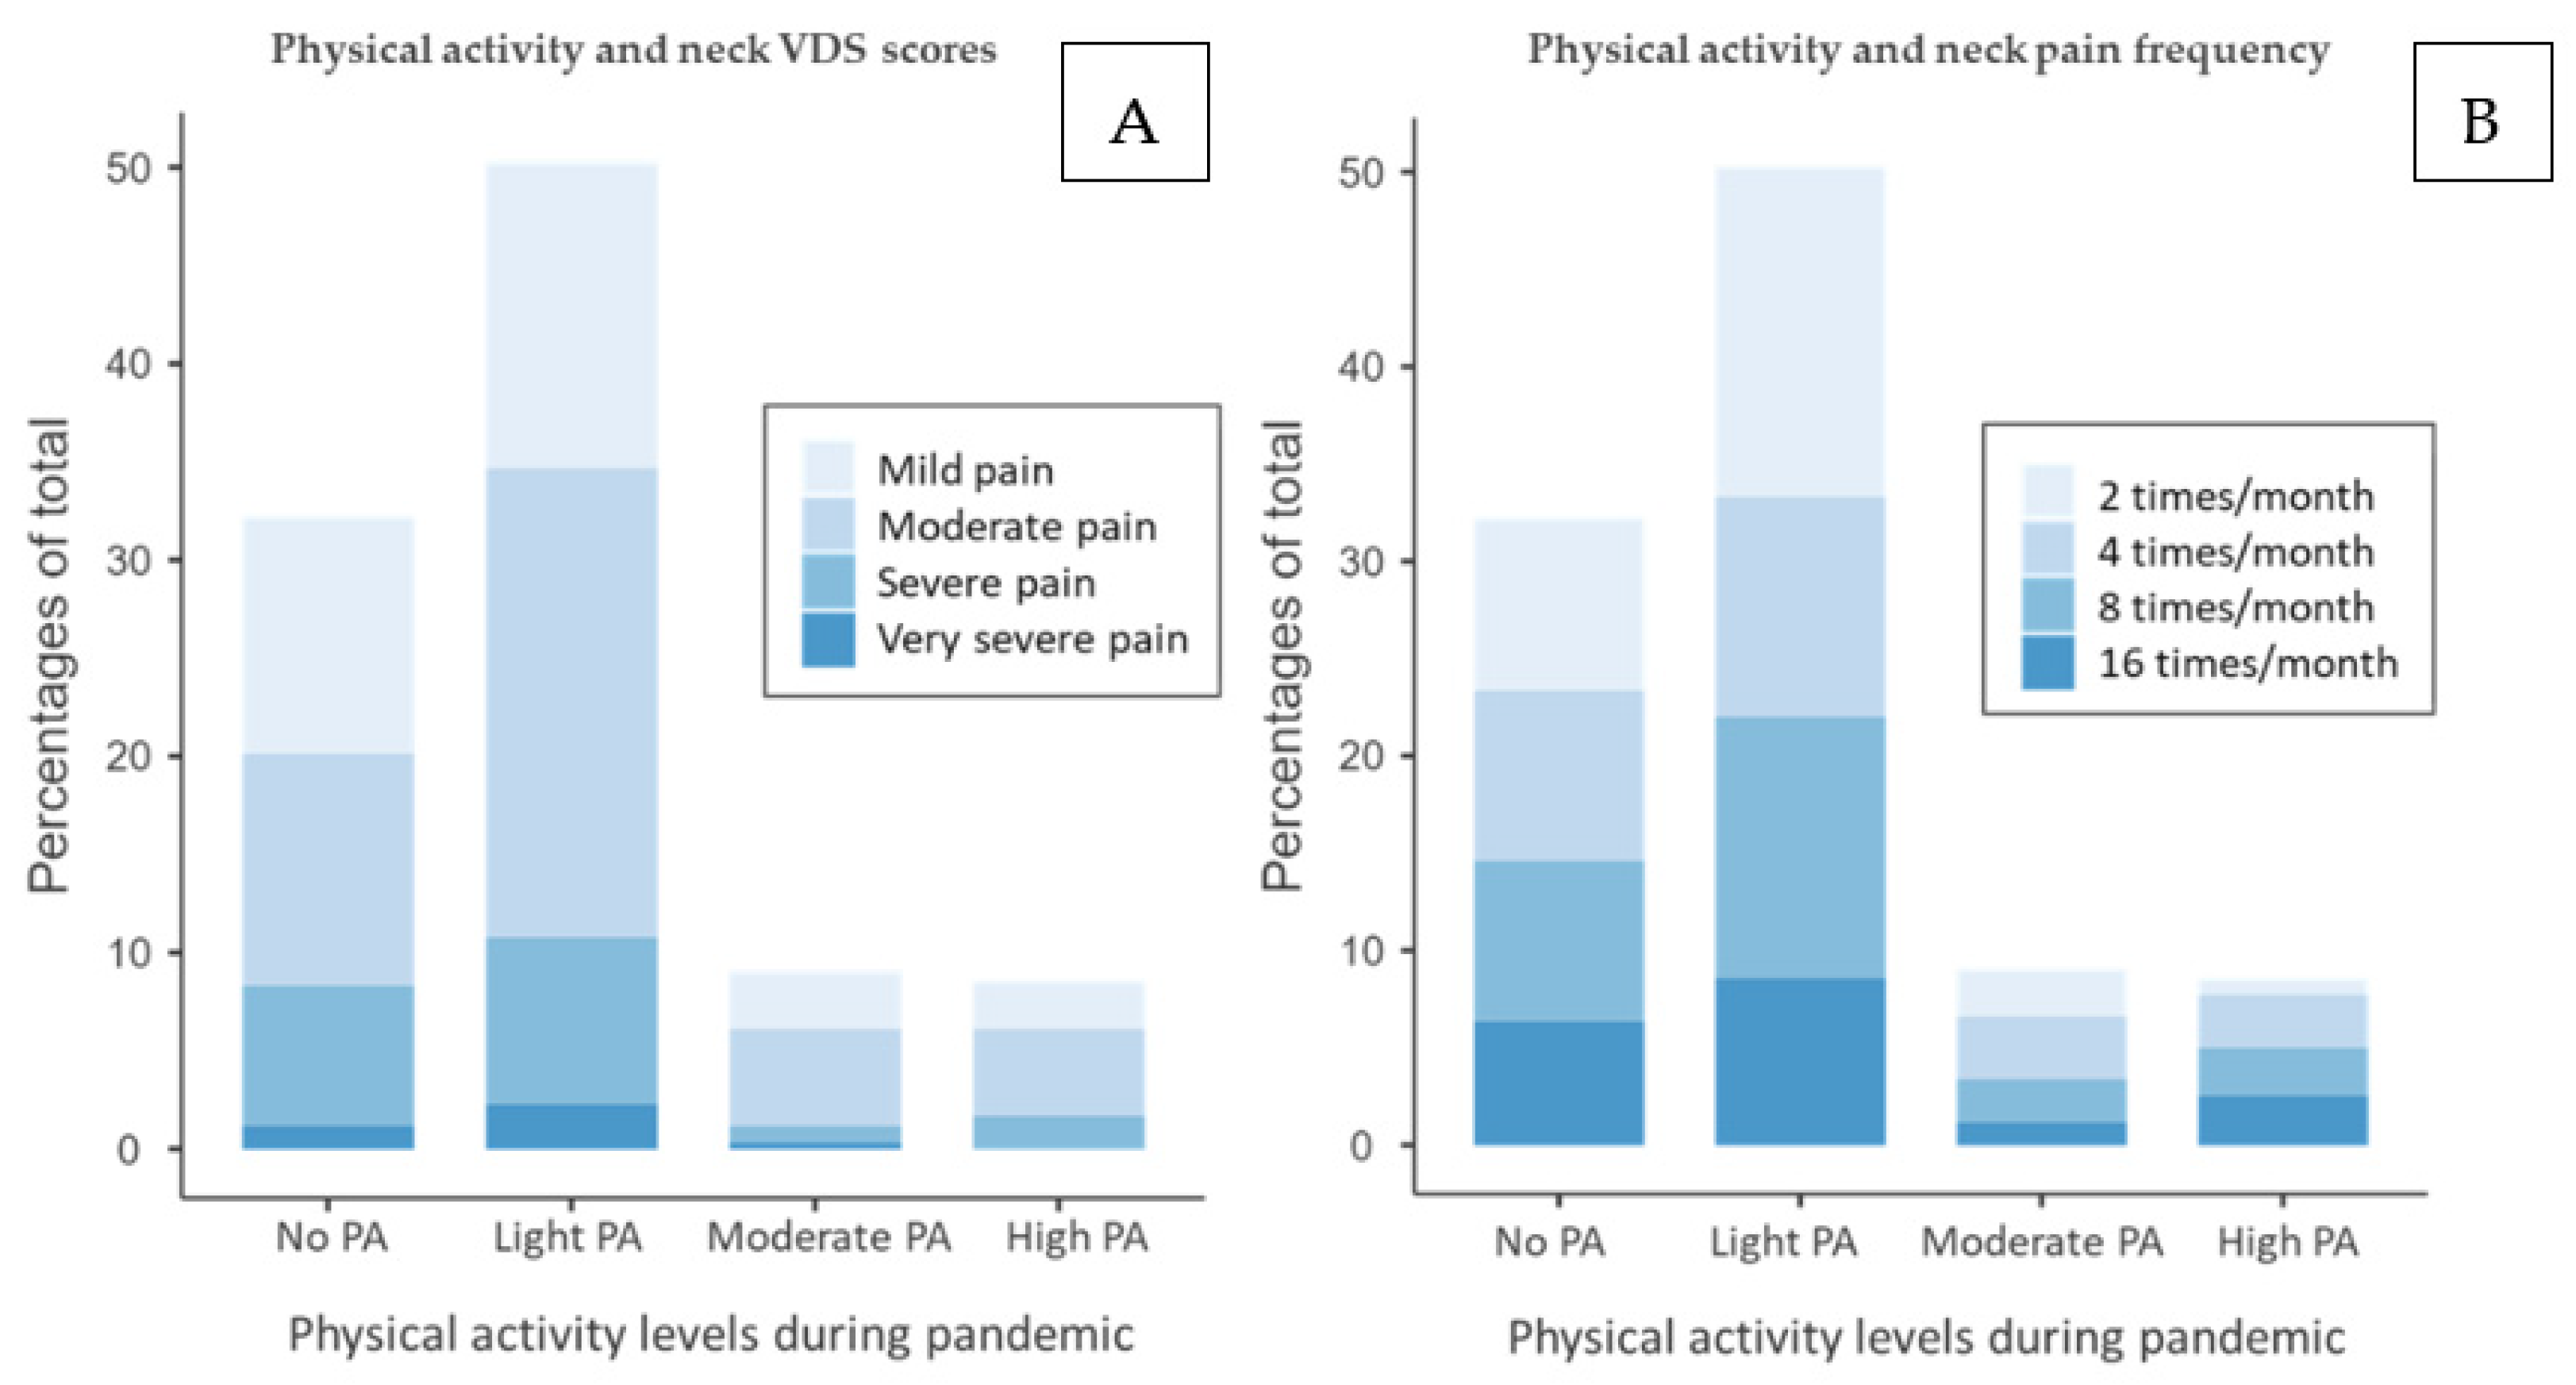
23] recommend doing at least 150 min of moderate-intensity PA throughout the week and limiting sedentary time. In line with these guidelines, the students who reported MP were divided into two groups based on PA adherence. The data show a high prevalence of students reporting pain in the PA < 150 min/week group, representing 41.7% versus 8.8% of those performing PA ≥ 150 min/week.
The 72.2% of those with neck pain experienced it during the pandemic and mainly due to several hours of study, as expected since they had to attend courses through electronic devices due to the restriction measures. As reported by Mowatt et al. [24], the most frequent health problems among those using electronic devices for several hours are computer vision syndrome, neck, shoulder, and back pain, and specifically, 89.9% of undergraduate university students have a prevalence of these health problems [25]. Prolonged use of mobile phones, tablets, or laptops to attend online lessons or to spend time on social media may negatively affect neck and shoulders pain [26]. This relationship, anyhow, has been validated by several epidemiological studies, which confirmed that assuming a wrong posture for many hours and having SB is strongly related to the severity of neck pain [27,28,29,30,31]. Our data show how the levels of VDS score, and frequency of neck pain onset are considerably lower for students performing moderate to high PA levels compared to those with light or no PA levels. These findings confirm the hypothesis of a greater likelihood of having neck pain for those with low levels of PA as highlighted by Scarabottolo et al. [32] and Guddal et al. [33]. Conversely, we strongly disagree with Sitthipornvorakul et al. [34], who assert strong evidence of no association between PA and neck pain.
The 72.9% of the students with low back pain experienced it during the pandemic, mainly due to several hours of study, probably related to a wrong posture assumed during it, as for the neck pain. Stressors, fear of pain, and lack of PA, according to Amelot et al. [35], are the most critical factors affecting LBP occurrence. Only PA levels have been evaluated in the present study, but psychosocial repercussions over mental health were present in line with another analysis conducted among the Italian population [36]. As for neck pain, VDS score and frequency for low back pain was considerably lower for students with moderate to high PA levels, compared to those with light or no PA. These results are in line with Wedderkopp et al. [36], where physically active students had a low predisposition to experiencing back pain. Likewise, Guddal et al. [33] observed that moderate levels of PA were correlated to reduced LBP onset. However, as we highlighted in the results section, excessively high PA levels might increase the risk of spinal pain because intense activities might contribute to a wrong posture and lead to pain onset [37].
Two studies [38,39] pointed the absence of correlation between a sedentary lifestyle and the occurrence of MP in medical students with LBP. Our data contrast these authors’ points of view because the OR between SB and low back pain was 1.79 (95% CI, 1.29–2.49), Table A2. However, these authors did not clearly state what describes SB. While Moroder [38] did not classify sitting time and PA levels threshold as sedentary, Chen S.M. [39] considered only time spent sitting, omitting the PA levels. Even if this topic is still debated among the scientific community, our findings strongly agree with a recent meta-analysis published in Nature journal by Alzahrani et al. [40], who highlighted the importance of medium to moderate PA levels to decrease the risk of LBP. Furthermore, epidemiological research has shown that assuming a wrong posture for a prolonged time, sitting for many hours, or simply taking part in SB are strong predictors of adverse health outcomes such as cardiovascular diseases [41], diabetes [42], cancer [43], musculoskeletal pain [44], or depression [45]. In line with our investigations about SB and MP presence, Shrier and Feldman [46,47] identified the prolonged sitting position as a prevalent risk factor for MP onset. In general, it can be assumed that the more frequent students are physically inactive during the week, the more frequent is the risk of suffering from chronic pain [48].
Concerning the pain relief strategies, Mimi Mun Yee Tse et al. [49] conducted a similar study of university students in Hong Kong and stated a high percentage of them adopting pharmacological methods to contrast MP. This condition differs from our data, as our sample’s highest pain relief strategy was performing physical exercises or waiting until the pain resolves. Those experiencing pain should prefer non-pharmacological treatment initially, favoring exercises or rehabilitation protocols [50] instead. Therefore, education for the young is needed to give them resources to manage their condition, such as exercises sheets, pain management guidelines, or prevention methods [50,51].
Further studies are needed to understand the aspects related to a sedentary lifestyle and pain. What is clear is that we must work on two fronts since, following this trend, the 2025 global PA target (10% reduction of physical inactivity) will not be met [52]. Firstly, National governments should develop new approaches to engage the unwilling population to increase or start PA programs, especially after one year of restrictions. Secondly, there is a need to understand the reasons behind some students’ indifference towards PA, since, during the pandemic, they could have trained at home to counterbalance psychological and physiological distress [53,54]. The last decade’s general increase of physical inactivity prompted the WHO in 2018 to provide a plan until 2030 to encourage the world population to be more active [55]. The aim is to invest in policies to promote sports activities, jogging, or just recreational activities to achieve different sustainable development goals by 2030. Trivial as it may seem, yet simply carrying out a student’s daily activities such as leaving home in the morning, going to university, walking with friends, or visiting a shop can be worth it to maintain an active body, and thus avoid the onset of pain [56]. In line with WHO guidelines, we suggest the need to plan educational programs that encourage students to practice exercise. For instance, with the help of professionals, e.g., kinesiologists, universities could plan a 10-min break within lessons to perform simple exercises to keep the body active and avoid the classic pains from incorrect posture.
This study has some limitations that need to be considered in the results’ interpretation. First, the questionnaire was administered through online channels, which may determine a disinterest in answering all questions carefully. Second, it was a self-reported questionnaire, indicating an underestimation or overestimation of the self-conditions based on the questions. Third, a bias regarding PA levels before the pandemic may be present due to the time elapsed. Fourth, this study has a cross-sectional design, so inference must be evaluated carefully. Conversely, many responses, the presence of different check-questions useful to reduce the bias, the strong consistency due to a close age range, and the reduced likelihood of having other conditions that could lead to MP enhance the study’s strength.
In terms of future research, we expect to conduct further research like this after recovering entirely from the COVID-19 pandemic to determine if PA and SB levels retrieved after this social catastrophe and investigate how MPs can be modulated through daily exercises.

5. Conclusions

One year of COVID-19 restrictions forced the students to reduce their daily activities and triggered, in some cases, adverse health outcomes. An overall reduction of physical activity and musculoskeletal pain onset was observed, especially for those who did not respect the WHO physical activity guidelines. These findings highlight the alarming condition of the presence of musculoskeletal pain in a young population. Universities are called upon to handle this situation in the best possible way; a preventive approach is required as a young person experiencing pain today could be an adult with chronic pathologies tomorrow, leading to earlier habitual use of drugs, namely, which is a burden to public health.

Author Contributions

Conceptualization, F.R. and G.M. (Giuseppe Musumeci); methodology, F.R. and B.T.; software, M.D.R.; validation, F.R. and A.B.; formal analysis, F.R. and S.R.; investigation, F.R. and G.M. (Grazia Maugeri); resources, A.P.; data curation, F.R. and G.M. (Grazia Maugeri); writing—original draft preparation, F.R.; writing—review and editing G.M. (Giuseppe Musumeci); visualization, F.R. and S.R.; supervision G.M. (Giuseppe Musumeci), A.B. and A.P.; project administration, G.M. (Giuseppe Musumeci); funding acquisition, G.M. (Giuseppe Musumeci) All authors have read and agreed to the published version of the manuscript.

Funding

This work was funded by the University Research Project Grant (PIACERI Found—NATURE-OA—2020–2022), Department of Biomedical and Biotechnological Sciences (BIOME-TEC), University of Catania, Italy.

Institutional Review Board Statement

The study was conducted according to the guidelines of the Declaration of Helsinki and approved by the Local Ethics Committee of the Research Center on Motor Activities (CRAM), University of Catania (Protocol Number: CRAM-011-2020-16 March 2020).

Informed Consent Statement

Protection of personal data (Legislative Decree 101/2028), Voluntary (Art.7 of Legislative Decree 196/2003 (repealed by Legislative Decree 101/2018-Ref. Art. 15 Reg. 2016/679/ EU).

Data Availability Statement

The data presented in this study are available on request from the corresponding author.

Conflicts of Interest

The authors declare no conflict of interest.

Appendix A

Table A1. Odds ratio between sedentary behavior and body weight increase.
Weight
Increase
No Weight
Increase
TotalOdds Ratioτb *
Sedentary1584846425.36 (3.04–9.47)−0.213
No sedentary14230244
Total172714886
Sedentary: physical activity levels < 150 min/week and seated time > 8 h/day; * Kendall-tau value.
Table A2. Odds ratio between sedentary behavior and low back pain.
Low Back PainNo Low Back PainTotalOdds Ratioτb *
Sedentary2503926421.79 (1.29–2.49)0.118
No sedentary64180244
Total314572886
Sedentary: physical activity levels < 150 min/week and seated time > 8 h/day; * Kendall-tau value.
Table A3. Odds ratio between sedentary behavior and neck pain.
Neck PainNo Neck PainTotalOdds Ratioτb *
Sedentary3363066421.95 (1.44–2.64)−0.145
No sedentary88156244
Total424462886
Sedentary: physical activity levels < 150 min/week and seated time > 8 h/day; * Kendall-tau value.

References

  1. Musumeci, G. Physical Activity for Health—An Overview and an Update of the Physical Activity Guidelines of the Italian Ministry of Health. J. Funct. Morphol. Kinesiol. 2016, 1, 269–275. [Google Scholar] [CrossRef]
  2. Lee, I.M.; Shiroma, E.J.; Lobelo, F.; Puska, P.; Blair, S.N.; Katzmarzyk, P.T. Effect of physical inactivity on major non-communicable diseases worldwide: An analysis of burden of disease and life expectancy. Lancet 2012, 380, 219–229. [Google Scholar] [CrossRef] [Green Version]
  3. Šagát, P.; Bartík, P.; Prieto González, P.; Tohănean, D.I.; Knjaz, D. Impact of COVID-19 Quarantine on Low Back Pain Intensity, Prevalence, and Associated Risk Factors among Adult Citizens Residing in Riyadh (Saudi Arabia): A Cross-Sectional Study. Int. J. Environ. Res. Public Health 2020, 17, 7302. [Google Scholar] [CrossRef]
  4. Toprak Celenay, S.; Karaaslan, Y.; Mete, O.; Ozer Kaya, D. Coronaphobia, musculoskeletal pain, and sleep quality in stay-at home and continued-working persons during the 3-month COVID-19 pandemic lockdown in Turkey. Chronobiol. Int. 2020, 37, 1778–1785. [Google Scholar] [CrossRef]
  5. Caromano, F.; Amorim, C.; Rebelo, C.; Contesin, A.; Favero, F.; Costa, J.; Kawai, M.; Voos, M. Prolonged sitting and physical discomfort in university students. Acta Fisiátr. 2015, 22, 176–180. [Google Scholar] [CrossRef] [Green Version]
  6. Queiroz, L.B.; Lourenço, B.; Silva, L.E.V.; Lourenço, D.M.R.; Silva, C.A. Musculoskeletal pain and musculoskeletal syndromes in adolescents are related to electronic devices. J. Pediatr. 2018, 94, 673–679. [Google Scholar] [CrossRef]
  7. Haroon, H.; Mehmood, S.; Imtiaz, F.; Ali, S.A.; Sarfraz, M. Musculoskeletal pain and its associated risk factors among medical students of a public sector University in Karachi, Pakistan. J. Pak. Med. Assoc. 2018, 68, 682–688. [Google Scholar] [PubMed]
  8. Lim, S.S.; Vos, T.; Flaxman, A.D.; Danaei, G.; Shibuya, K.; Adair-Rohani, H.; Amann, M.; Anderson, H.R.; Andrews, K.G.; Aryee, M.; et al. A comparative risk assessment of burden of disease and injury attributable to 67 risk factors and risk factor clusters in 21 regions, 1990–2010: A systematic analysis for the Global Burden of Disease Study 2010. Lancet 2012, 380, 2224–2260. [Google Scholar] [CrossRef] [Green Version]
  9. Vujcic, I.; Stojilovic, N.; Dubljanin, E.; Ladjevic, N.; Ladjevic, I.; Sipetic-Grujicic, S. Low Back Pain among Medical Students in Belgrade (Serbia): A Cross-Sectional Study. Pain Res. Manag. 2018, 2018, 8317906. [Google Scholar] [CrossRef] [Green Version]
  10. Kędra, A.; Kolwicz-Gańko, A.; Kędra, P.; Bochenek, A.; Czaprowski, D. Back pain in physically inactive students compared to physical education students with a high and average level of physical activity studying in Poland. BMC Musculoskelet. Disord. 2017, 18, 501. [Google Scholar] [CrossRef] [Green Version]
  11. The American Association for Public Opinion Research. “Standard Definitions Report 9th Edition” Standard Definitions: Final Dispositions of Case Codes and Out-Come Rates for Surveys, 9th ed.; AAPOR: Washington, DC, USA, 2016; Available online: https://www.aapor.org/Publications-Media/AAPOR-Journals/Standard-Definitions.aspx (accessed on 24 April 2016).
  12. Hjermstad, M.J.; Fayers, P.M.; Haugen, D.F.; Caraceni, A.; Hanks, G.W.; Loge, J.H.; Fainsinger, R.; Aass, N.; Kaasa, S. Studies comparing Numerical Rating Scales, Verbal Rating Scales, and Visual Analogue Scales for assessment of pain intensity in adults: A systematic literature review. J. Pain Symptom Manag. 2011, 41, 1073–1093. [Google Scholar] [CrossRef] [PubMed]
  13. Lins, L.; Carvalho, F.M. SF-36 total score as a single measure of health-related quality of life: Scoping review. SAGE Open Med. 2016, 4, 2050312116671725. [Google Scholar] [CrossRef] [Green Version]
  14. Stiglic, G.; Watson, R.; Cilar, L. R you ready? Using the R programme for statistical analysis and graphics. Res. Nurs. Health 2019, 42, 494–499. [Google Scholar] [CrossRef]
  15. R Core Team. R: A Language and Environment for Statistical Computing. (Version 4.0) [Computer Software]. 2020. Available online: https://cran.r-project.org (accessed on 15 March 2021).
  16. The Jamovi Project. Jamovi. (Version 1.6) [Computer Software]. 2021. Available online: https://www.jamovi.org (accessed on 16 March 2021).
  17. Maugeri, G.; Castrogiovanni, P.; Battaglia, G.; Pippi, R.; D’Agata, V.; Palma, A.; Di Rosa, M.; Musumeci, G. The impact of physical activity on psychological health during COVID-19 pandemic in Italy. Heliyon 2020, 6, e04315. [Google Scholar] [CrossRef]
  18. Hall, G.; Laddu, D.R.; Phillips, S.A.; Lavie, C.J.; Arena, R. A tale of two pandemics: How will COVID-19 and global trends in physical inactivity and sedentary behavior affect one another? Prog. Cardiovasc. Dis. 2021, 64, 108–110. [Google Scholar] [CrossRef]
  19. Dunton, G.F.; Do, B.; Wang, S.D. Early effects of the COVID-19 pandemic on physical activity and sedentary behavior in children living in the U.S. BMC Public Health 2020, 20, 1351. [Google Scholar] [CrossRef]
  20. Ammar, A.; Brach, M.; Trabelsi, K.; Chtourou, H.; Boukhris, O.; Masmoudi, L.; Bouaziz, B.; Bentlage, E.; How, D.; Masmoudi, L.; et al. Effects of COVID-19 Home Confinement on Eating Behaviour and Physical Activity: Results of the ECLB-COVID19 International Online Survey. Nutrients 2020, 12, 1583. [Google Scholar] [CrossRef] [PubMed]
  21. Zheng, C.; Huang, W.Y.; Sheridan, S.; Sit, C.H.; Chen, X.K.; Wong, S.H. COVID-19 Pandemic Brings a Sedentary Lifestyle in Young Adults: A Cross-Sectional and Longitudinal Study. Int. J. Environ. Res. Public Health 2020, 17, 6035. [Google Scholar] [CrossRef]
  22. Meyer, J.; McDowell, C.; Lansing, J.; Brower, C.; Smith, L.; Tully, M.; Herring, M. Changes in Physical Activity and Sedentary Behavior in Response to COVID-19 and Their Associations with Mental Health in 3052 US Adults. Int. J. Environ. Res. Public Health 2020, 17, 6469. [Google Scholar] [CrossRef]
  23. Bull, F.C.; Al-Ansari, S.S.; Biddle, S.; Borodulin, K.; Buman, M.P.; Cardon, G.; Carty, C.; Chaput, J.P.; Chastin, S.; Chou, R.; et al. World Health Organization 2020 guidelines on physical activity and sedentary behaviour. Br. J. Sports Med. 2020, 54, 1451. [Google Scholar] [CrossRef]
  24. Mowatt, L.; Gordon, C.; Santosh, A.B.R.; Jones, T. Computer vision syndrome and ergonomic practices among undergraduate university students. Int. J. Clin. Pract. 2018, 72. [Google Scholar] [CrossRef]
  25. Reddy, S.C.; Low, C.K.; Lim, Y.P.; Low, L.L.; Mardina, F.; Nursaleha, M.P. Computer vision syndrome: A study of knowledge and practices in university students. Nepal. J. Ophthalmol. 2013, 5, 161–168. [Google Scholar] [CrossRef]
  26. Al-Hadidi, F.; Bsisu, I.; AlRyalat, S.A.; Al-Zu’bi, B.; Bsisu, R.; Hamdan, M.; Kanaan, T.; Yasin, M.; Samarah, O. Association between mobile phone use and neck pain in university students: A cross-sectional study using numeric rating scale for evaluation of neck pain. PLoS ONE 2019, 14, e0217231. [Google Scholar] [CrossRef]
  27. Cagnie, B.; Danneels, L.; Van Tiggelen, D.; De Loose, V.; Cambier, D. Individual and work related risk factors for neck pain among office workers: A cross sectional study. Eur. Spine J. 2007, 16, 679–686. [Google Scholar] [CrossRef] [PubMed] [Green Version]
  28. Janwantanakul, P.; Pensri, P.; Jiamjarasrangsi, W.; Sinsongsook, T. Associations between prevalence of self-reported musculoskeletal symptoms of the spine and biopsychosocial factors among office workers. J. Occup. Health 2009, 51, 114–122. [Google Scholar] [CrossRef] [Green Version]
  29. Ortiz-Hernández, L.; Tamez-González, S.; Martínez-Alcántara, S.; Méndez-Ramírez, I. Computer use increases the risk of musculoskeletal disorders among newspaper office workers. Arch. Med. Res. 2003, 34, 331–342. [Google Scholar] [CrossRef]
  30. Jacobs, K.; Johnson, P.; Dennerlein, J.; Peterson, D.; Kaufman, J.; Gold, J.; Williams, S.; Richmond, N.; Karban, S.; Firn, E.; et al. University students’ notebook computer use. Appl. Ergon. 2009, 40, 404–409. [Google Scholar] [CrossRef]
  31. Silva, G.R.; Pitangui, A.C.; Xavier, M.K.; Correia-Júnior, M.A.; De Araújo, R.C. Prevalence of musculoskeletal pain in adolescents and association with computer and videogame use. J. Pediatr. 2016, 92, 188–196. [Google Scholar] [CrossRef] [Green Version]
  32. Scarabottolo, C.C.; Pinto, R.Z.; Oliveira, C.B.; Zanuto, E.F.; Cardoso, J.R.; Christofaro, D.G.D. Back and neck pain prevalence and their association with physical inactivity domains in adolescents. Eur. Spine J. 2017, 26, 2274–2280. [Google Scholar] [CrossRef] [Green Version]
  33. Guddal, M.H.; Stensland, S.; Småstuen, M.C.; Johnsen, M.B.; Zwart, J.A.; Storheim, K. Physical Activity Level and Sport Participation in Relation to Musculoskeletal Pain in a Population-Based Study of Adolescents: The Young-HUNT Study. Orthop. J. Sports Med. 2017, 5, 2325967116685543. [Google Scholar] [CrossRef] [PubMed]
  34. Sitthipornvorakul, E.; Janwantanakul, P.; Purepong, N.; Pensri, P.; van der Beek, A.J. The association between physical activity and neck and low back pain: A systematic review. Eur. Spine J. 2011, 20, 677–689. [Google Scholar] [CrossRef] [PubMed] [Green Version]
  35. Amelot, A.; Mathon, B.; Haddad, R.; Renault, M.C.; Duguet, A.; Steichen, O. Low Back Pain Among Medical Students: A Burden and an Impact to Consider! Spine 2019, 44, 1390–1395. [Google Scholar] [CrossRef]
  36. Wedderkopp, N.; Kjaer, P.; Hestbaek, L.; Korsholm, L.; Leboeuf-Yde, C. High-level physical activity in childhood seems to protect against low back pain in early adolescence. Spine J. Off. J. N. Am. Spine Soc. 2009, 9, 134–141. [Google Scholar] [CrossRef] [PubMed]
  37. Aartun, E.; Boyle, E.; Hartvigsen, J.; Ferreira, P.H.; Maher, C.G.; Ferreira, M.L.; Hestbaek, L. The most physically active Danish adolescents are at increased risk for developing spinal pain: A two-year prospective cohort study. BMJ Open Sport Exerc. Med. 2016, 2, e000097. [Google Scholar] [CrossRef] [Green Version]
  38. Moroder, P.; Runer, A.; Resch, H.; Tauber, M. Low back pain among medical students. Acta Orthop. Belg. 2011, 77, 88–92. [Google Scholar]
  39. Chen, S.M.; Liu, M.F.; Cook, J.; Bass, S.; Lo, S.K. Sedentary lifestyle as a risk factor for low back pain: A systematic review. Int. Arch. Occup. Environ. Health 2009, 82, 797–806. [Google Scholar] [CrossRef]
  40. Alzahrani, H.; Mackey, M.; Stamatakis, E.; Zadro, J.R.; Shirley, D. The association between physical activity and low back pain: A systematic review and meta-analysis of observational studies. Sci. Rep. 2019, 9, 8244. [Google Scholar] [CrossRef] [PubMed]
  41. Dunstan, D.W.; Dogra, S.; Carter, S.E.; Owen, N. Sit less and move more for cardiovascular health: Emerging insights and opportunities. Nat. Rev. Cardiol. 2021, 18, 637–648. [Google Scholar] [CrossRef] [PubMed]
  42. Li, X.; Zhou, T.; Ma, H.; Liang, Z.; Fonseca, V.A.; Qi, L. Replacement of Sedentary Behavior by Various Daily-Life Physical Activities and Structured Exercises: Genetic Risk and Incident Type 2 Diabetes. Diabetes Care 2021, 44. [Google Scholar] [CrossRef]
  43. Patterson, R.; McNamara, E.; Tainio, M.; de Sá, T.H.; Smith, A.D.; Sharp, S.J.; Edwards, P.; Woodcock, J.; Brage, S.; Wijndaele, K. Sedentary behaviour and risk of all-cause, cardiovascular and cancer mortality, and incident type 2 diabetes: A systematic review and dose response meta-analysis. Eur. J. Epidemiol. 2018, 33, 811–829. [Google Scholar] [CrossRef] [Green Version]
  44. Pinto, A.J.; Dunstan, D.W.; Owen, N.; Bonfá, E.; Gualano, B. Combating physical inactivity during the COVID-19 pandemic. Nat. Rev. Rheumatol. 2020, 16, 347–348. [Google Scholar] [CrossRef]
  45. Huang, Y.; Li, L.; Gan, Y.; Wang, C.; Jiang, H.; Cao, S.; Lu, Z. Sedentary behaviors and risk of depression: A meta-analysis of prospective studies. Transl. Psychiatry 2020, 10, 26. [Google Scholar] [CrossRef] [PubMed] [Green Version]
  46. Shrier, I.; Ehrmann-Feldman, D.; Rossignol, M.; Abenhaim, L. Risk factors for development of lower limb pain in adolescents. J. Rheumatol. 2001, 28, 604–609. [Google Scholar]
  47. Ehrmann Feldman, D.; Shrier, I.; Rossignol, M.; Abenhaim, L. Risk factors for the development of neck and upper limb pain in adolescents. Spine 2002, 27, 523–528. [Google Scholar] [CrossRef]
  48. Grasdalsmoen, M.; Engdahl, B.; Fjeld, M.K.; Steingrímsdóttir, Ó.A.; Nielsen, C.S.; Eriksen, H.R.; Lønning, K.J.; Sivertsen, B. Physical exercise and chronic pain in university students. PLoS ONE 2020, 15, e0235419. [Google Scholar] [CrossRef] [PubMed]
  49. Tse, M.M.Y.; Tang, A.; Budnick, A.; Ng, S.S.M.; Yeung, S.S.Y. Pain and Pain Management Among University Students: Online Survey and Web-Based Education. Cyberpsychol. Behav. Soc. Netw. 2017, 20, 305–313. [Google Scholar] [CrossRef] [PubMed]
  50. Lin, I.; Wiles, L.; Waller, R.; Goucke, R.; Nagree, Y.; Gibberd, M.; Straker, L.; Maher, C.G.; O’Sullivan, P.P.B. What does best practice care for musculoskeletal pain look like? Eleven consistent recommendations from high-quality clinical practice guidelines: Systematic review. Br. J. Sports Med. 2020, 54, 79–86. [Google Scholar] [CrossRef] [PubMed]
  51. American Society of Anesthesiologists Task Force on Chronic Pain Management; American Society of Regional Anesthesia and Pain Medicine. Practice guidelines for chronic pain management: An updated report by the American Society of Anesthesiologists Task Force on Chronic Pain Management and the American Society of Regional Anesthesia and Pain Medicine. Anesthesiology 2010, 112, 810–833. [Google Scholar] [CrossRef] [PubMed] [Green Version]
  52. Guthold, R.; Stevens, G.A.; Riley, L.M.; Bull, F.C. Worldwide trends in insufficient physical activity from 2001 to 2016: A pooled analysis of 358 population-based surveys with 1.9 million participants. Lancet Glob. Health 2018, 6, e1077–e1086. [Google Scholar] [CrossRef] [Green Version]
  53. Ravalli, S.; Musumeci, G. Coronavirus Outbreak in Italy: Physiological Benefits of Home-Based Exercise During Pandemic. J. Funct. Morphol. Kinesiol. 2020, 5, 31. [Google Scholar] [CrossRef]
  54. Maugeri, G.; Musumeci, G. Adapted Physical Activity to Ensure the Physical and Psychological Well-Being of COVID-19 Patients. J. Funct. Morphol. Kinesiol. 2021, 6, 13. [Google Scholar] [CrossRef] [PubMed]
  55. World Health Organiztion (WHO). Global Action Plan on Physical Activity 2018–2030: More Active People for a Healthier World; World Health Organization: Genevra, Switzerland, 2018. [Google Scholar]
  56. Romero-Blanco, C.; Rodríguez-Almagro, J.; Onieva-Zafra, M.D.; Parra-Fernández, M.L.; Prado-Laguna, M.D.C.; Hernández-Martínez, A. Physical Activity and Sedentary Lifestyle in University Students: Changes during Confinement Due to the COVID-19 Pandemic. Int. J. Environ. Res. Public Health 2020, 17, 6567. [Google Scholar] [CrossRef] [PubMed]
Figure 1. (a) A density plot showing the concentration of scores and (b) a boxplot showing the difference of distribution.
Ijerph 18 08680 g001
Figure 2. Estimation of sedentary participants depending on seated time and physical activity levels during the pandemic.
Ijerph 18 08680 g002
Figure 3. (A) Stacked bar of VDS neck score and physical activity levels and (B) stacked bar of pain frequency and physical activity levels. No PA: no physical activity, Light PA: physical activity <140 min/week, Moderate PA: ≃150 min/week, High PA: >200 min/week.
Ijerph 18 08680 g003
Figure 4. (A) Stacked bar of VDS low back score and physical activity levels and (B) stacked bar of pain frequency and physical activity levels. No PA: no physical activity, Light PA: physical activity <140 min/week, Moderate PA: ≃150 min/week, High PA: >200 min/week.
Ijerph 18 08680 g004
Figure 5. Primary outcomes of the present study. The representation is counted as n/10 based on the respective data.
Ijerph 18 08680 g005
Figure 6. Physical activity changes before (March 2020) and during (March 2020/2021) one year of pandemic restrictions.
Ijerph 18 08680 g006
Table 1. Characteristics of participants.
(n)(%)
Participants165
Female102662
Male62838
Underweight (BMI)1307.9
Normal weight (BMI)117671.1
Overweight (BMI)34821
n: number, %: percentage, BMI: Body mass index.
Table 2. Physical activity levels before and during the pandemic.
Before the PandemicDuring the Pandemic
(n)(%)(n)(%)p-value *
Absent32819.950630.6<0.001
Light49830.179648.1
Moderate35621.518010.9
High47228.517210.5
n: number; %: percentage, * according to chi-square test.
Table 3. Students with musculoskeletal pai divided by physical activity levels.
TotalNeck PainOnly Neck PainBoth PainsLow Back PainOnly Low Back Pain
(n)(%)(n)(%)(n)(%)(n)(%)(n)(%)(n)(%)p-value *
PA < 15068041.759035.721613.129217.647028.417210.40.0184
PA ≥ 150 1468.81287.8664503845301.8
PA < 150: physical activity lesser than 150 min/week; PA ≥ 150: physical activity at least 150 min/week; n: number; %: percentage based on the whole population, * according to chi-square test.
Table 4. Overall characteristics of musculoskeletal pains.
Neck Pain Students (718)Low Back Pain Students (554)
(n)(%)(n)(%)
Temporal window
Pain within the last 4 months40055.726046.9
Pain within the last 9 months11816.414426.0
Pain within the last 12 months20027.915027.1
Frequency
16 times/month13218.413023.5
8 times/month19226.716630.0
4 times/month18826.212422.3
2 times/month20628.713424.2
Pain intensity
0—no pain0000
1—mild pain23232.319635.4
2—moderate pain32845.721839.1
3—severe pain13218.411019.9
4—very severe pain263.6305.4
5—worst pain ever0000
Daytime window
After several hours of study52673.338669.7
After waking up in the morning8411.7549.7
In the late evening669.26211.2
No specific moment425.8529.4
Pain posture onset
Sitting43660.728050.5
Walking/housework648.916630.0
No specific circumstance21830.410819.5
Pain relief strategy
Performance exercises23632.921037.9
Medicines13018.1468.3
Sleep9813.68815.9
Wait until it resolves25435.421037.9
Table 5. Exercise classification of those choosing exercises as pain relief strategy.
Neck Pain Students (236)Low Back Pain Students (210)
(n)(%)(n)(%)
Stretching and joint mobilization18277.118688.6
Performing sport activities166.883.8
Counter-resistance/isometric3816.1167.6
Table 6. Contingency table of physical activity levels and VDS neck scores.
VDS Levels
Mild PainModerate PainSevere PainVery Severe PainTotalχ2 *τb **
(n)(%)(n)(%)(n)(%)(n)(%)(n)(%)0.020−0.002
No PA8211.48612527.281.122831.8
Light PA11015.317424.2628.6162.236250.4
Moderate PA223.1334.650.760.8669.2
High PA182.5324.5121.700628.6
Total23232.332545.313118.2304.2718100
n: number; %: percentage, No PA: no physical activity; Light PA: <150 min/week of MVPA, Moderate PA: ≃150 min/week of MVPA; High PA: >200 min/week of MVPA; VDS: verbal descriptive scale; * Chi-square p-value; ** Kendall-tau value.
Table 7. Contingency table of physical activity levels and neck pain frequency.
Monthly Frequencies
2 Times/Month4 Times/Month8 Times/Month16 Times/MonthTotalχ2 *τb **
(n)(%)(n)(%)(n)(%)(n)(%)(n)(%)0.0100.02
No PA628.6628.6608.4446.122831.8
Light PA12016.78211.49813.6628.636250.4
Moderate PA182.5243.3162.281.1669.2
High PA60.8202.8182.5182.5628.6
Total20628.718826.219226.713218.4718100
n: number; %: percentage, No PA: no physical activity; Light PA: <150 min/week of MVPA, Moderate PA: ≃150 min/week of MVPA; High PA: >200 min/week of MVPA; * Chi-square p-value; ** Kendall-tau value.
Table 8. Contingency table of physical activity levels and VDS low back scores.
VDS Levels
Mild PainModerate PainSevere PainVery Severe PainTotalχ2 *τb **
(n)(%)(n)(%)(n)(%)(n)(%)(n)(%)0.026−0.09
No PA468.38014.4427.6122.218032.5
Light PA11821.311019.9488.7142.529052.3
Moderate PA183.2183.2122.200488.7
High PA142.5101.881.440.7366.5
Total19635.421839.411019.9305.4554
n: number; %: percentage, No PA: no physical activity; Light PA: <150 min/week of MVPA, Moderate PA: ≃150 min/week of MVPA; High PA: >200 min/week of MVPA; VDS: verbal descriptive scale; * Chi-square p-value; ** Kendall-tau value.
Table 9. Contingency table of physical activity levels and low back pain frequency.
Monthly Frequencies
2 Times/Month4 Times/Month8 Times/Month16 Times/MonthTotalχ2 *τb **
(n)(%)(n)(%)(n)(%)(n)(%)(n)(%)0.037−0.05
No PA427.6366.5488.7549.718032.5
Light PA6611.97413.49216.65810.529052.3
Moderate PA183.281.4162.961.1488.7
High PA81.461.191.6132.3366.5
Total13424.212422.416529.813123.6554
n: number; %: percentage, No PA: no physical activity; Light PA: <150 min/week of MVPA, Moderate PA: ≃150 min/week of MVPA; High PA: >200 min/week of MVPA; * Chi-square p-value; ** Kendall-tau value.
Publisher’s Note: MDPI stays neutral with regard to jurisdictional claims in published maps and institutional affiliations.

