
Efficiency and Productivity Change of Public Hospitals in Panama: Do Management Schemes Matter?


Abstract
1. Introduction
2. Literature Review
3. Materials and Methods
3.1. Context of the Study and Sample Design
3.2. Data and Variables
3.3. Methodology
4. Results
5. Discussion
6. Conclusions
Author Contributions
Funding
Institutional Review Board Statement
Informed Consent Statement
Data Availability Statement
Acknowledgments
Conflicts of Interest
Appendix A

| Hospital | Network | Province | District | Level of complexity | Area of Influence |
|---|---|---|---|---|---|
| Hospital Santo Tomas | MoH | Panamá | Panamá | III | Regional |
| Hospital Del Niño | MoH | Panamá | Panamá | III | Urban |
| Hospital de Especialidades Pediátricas Omar Torrijos Herrera | SSF | Panamá | Panamá | III | Rural |
| Complejo Hospitalario Dr. Arnulfo Arias Madrid | SSF | Panamá | Panamá | III | Urban |
| Hospital Dra. Susana Jones Cano | SSF | Panamá | San Miguelito | II | Urban |
| Hospital San Miguel Arcangel | MoH | Panamá | San Miguelito | II | Urban |
| Hospital de Changuinola | SSF | Bocas del Toro | Changuinola | II | Rural |
| Hospital de Almirante | SSF | Bocas del Toro | Changuinola | I-II | Rural |
| Hospital de Chiriquí Grande | SSF | Bocas del Toro | Chiriquí Grande | I-II | Rural |
| Hospital Regional Dr. Rafael Hernandez | SSF | Chiriquí | David | II | Regional |
| Hospital Dr. Cecilio A. Castillero | MoH | Herrera | Chitre | II | Urban |
| Hospital Ezequiel Abadia | SSF | Veraguas | Sona | I-II | Urban |
| Policlinica Especializada Dr. Horacio Diaz Gomez | SSF | Veraguas | Santiago | II | Urban |
| Hospital Dr. Rafael Estevez | SSF | Coclé | Aguadulce | II | Urban |
| Hospital Dr. Aquilino Tejeira | MoH | Coclé | Penonomé | II | Regional |
| Hospital San José de la Palma | MoH | Darién | Chepigana | I-II | Urban |
| Hospital Regional de Azuero Anita Moreno | MoH | Los Santos | La Villa de Los Santos | II | Regional |
| Hospital Rafael H. Moreno | MoH | Los Santos | Macaracas | II | Rural |
| Hospital Dr. Gustavo Nelson Collado | SSF | Herrera | Chitre | II | Regional |
| Hospital Luis Chicho Fabrega | MoH | Veraguas | Santiago | II | Regional |
| Hospital Materno Infantil Jose Domingo de Obaldia | MoH | Chiriquí | David | III | Regional |
| Hospital Dr. Joaquin Pablo Franco Sayas | MoH | Los Santos | Las Tablas | II | Regional |
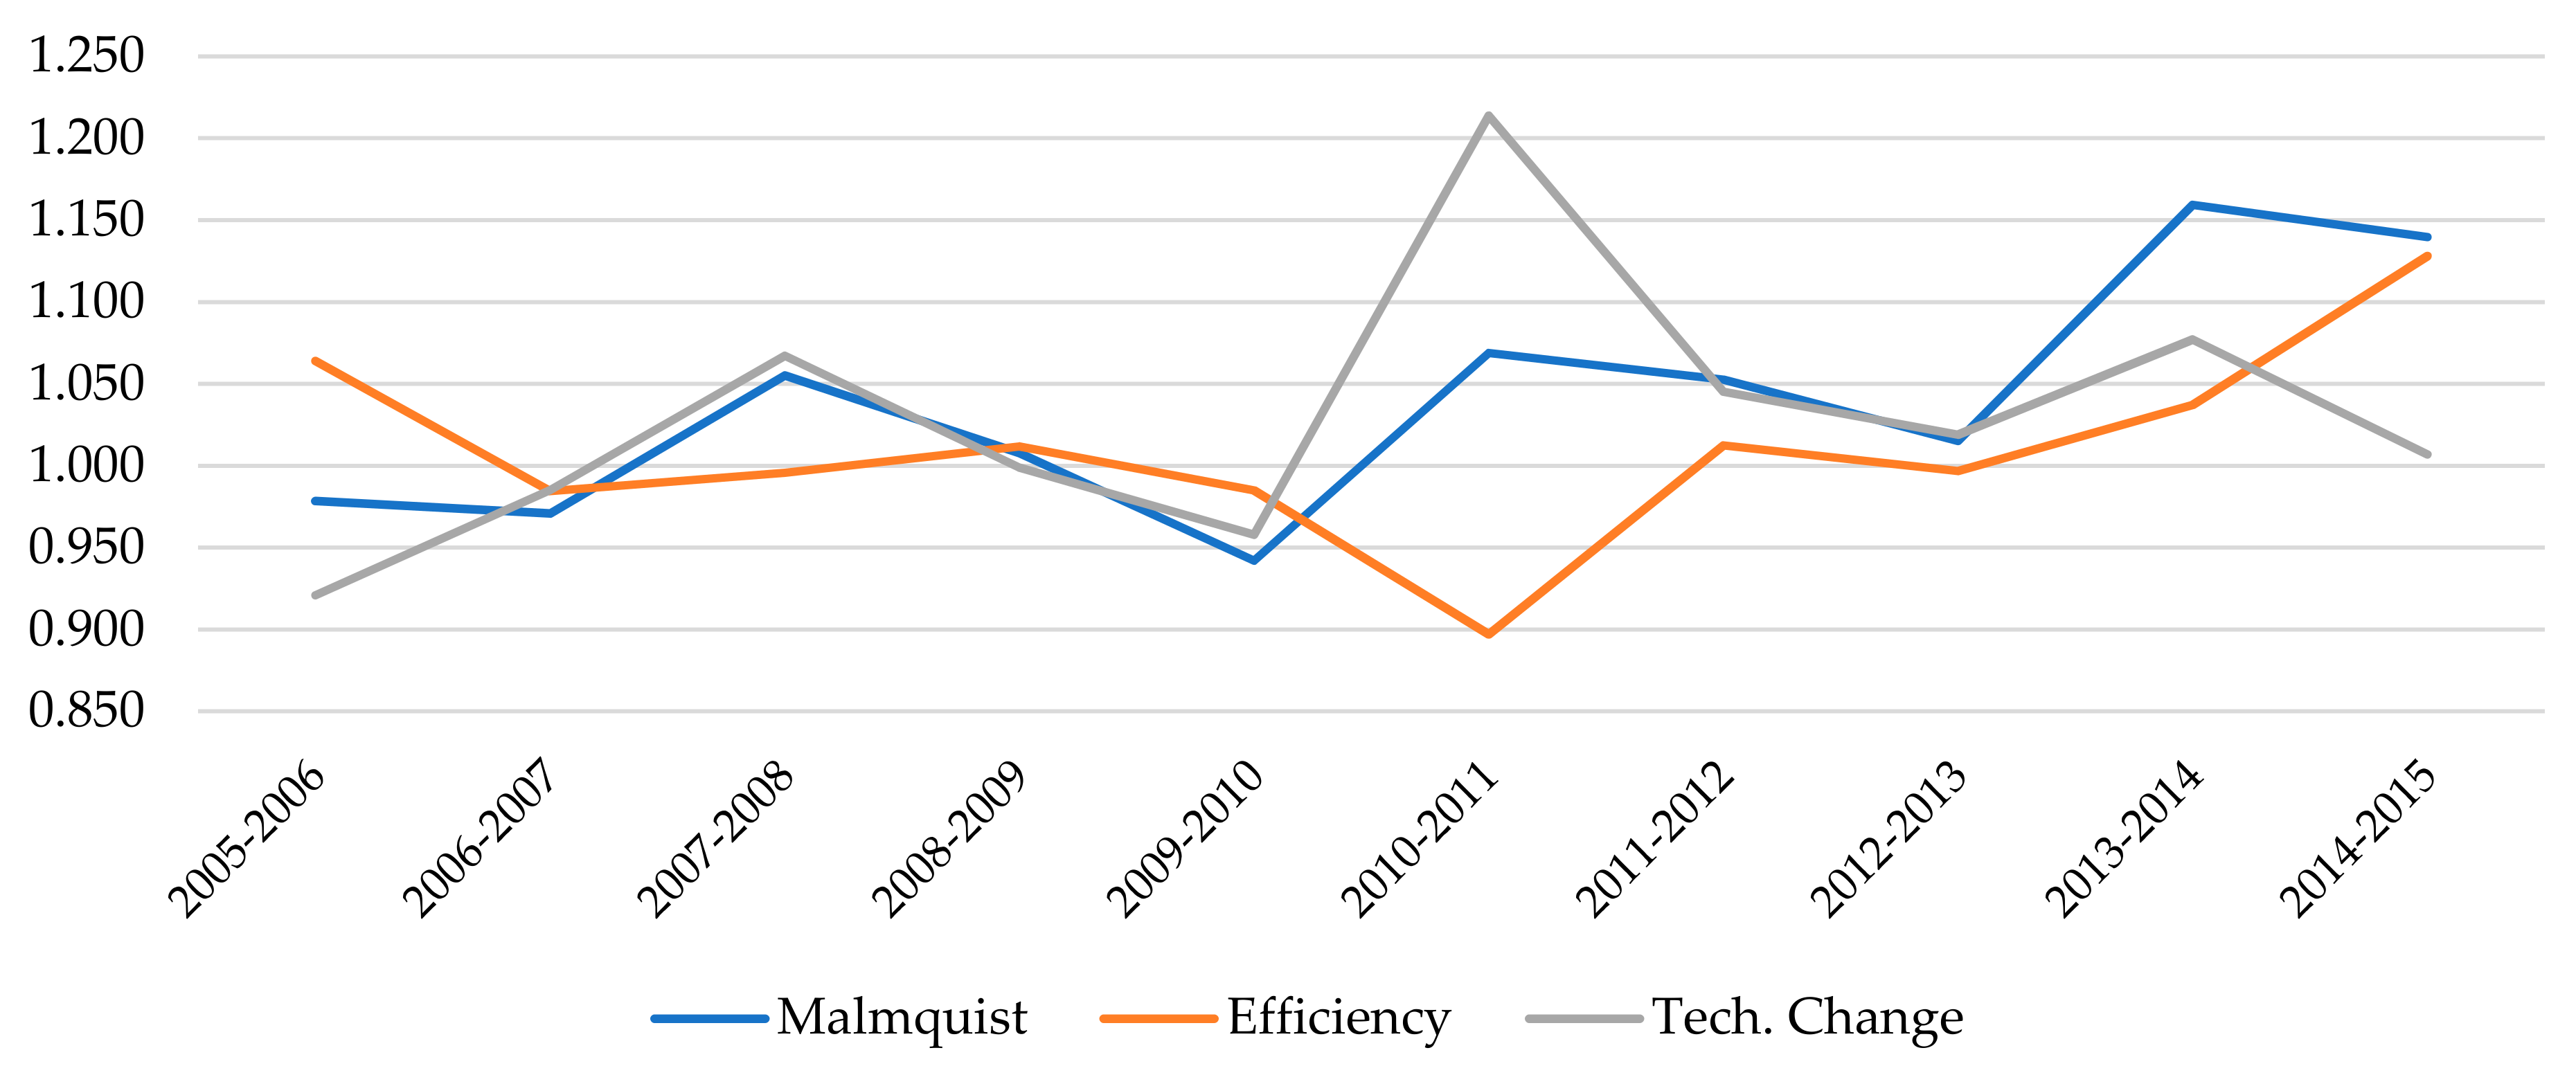
| Malmquist | 2005–2006 | 2006–2007 | 2007–2008 | 2008–2009 | 2009–2010 | 2010–2011 | 2011–2012 | 2012–2013 | 2013–2014 | 2014–2015 |
| Mean | 0.9784 | 0.9708 | 1.0552 | 1.0077 | 0.9419 | 1.0689 | 1.0525 | 1.0151 | 1.1593 | 1.1396 |
| SD | 0.0865 | 0.1196 | 0.1000 | 0.0975 | 0.1175 | 0.1517 | 0.1287 | 0.1288 | 0.6770 | 0.3216 |
| Min | 0.8506 | 0.6483 | 0.8891 | 0.8661 | 0.6286 | 0.8409 | 0.6621 | 0.7634 | 0.8750 | 0.8842 |
| Max | 1.2196 | 1.2841 | 1.2466 | 1.3412 | 1.1487 | 1.5448 | 1.3335 | 1.4485 | 1.5645 | 1.3565 |
| Efficiency | 2005–2006 | 2006–2007 | 2007–2008 | 2008–2009 | 2009–2010 | 2010–2011 | 2011–2012 | 2012–2013 | 2013–2014 | 2014–2015 |
| Mean | 1.0640 | 0.9844 | 0.9956 | 1.0117 | 0.9849 | 0.8969 | 1.0125 | 0.9968 | 1.0372 | 1.1280 |
| SD | 0.0932 | 0.1022 | 0.1074 | 0.0795 | 0.1119 | 0.1469 | 0.1181 | 0.0689 | 0.1555 | 0.2192 |
| Min | 0.9471 | 0.6646 | 0.6940 | 0.8315 | 0.6351 | 0.6472 | 0.8352 | 0.8092 | 0.9169 | 0.8888 |
| Max | 1.2927 | 1.1408 | 1.2491 | 1.1659 | 1.1710 | 1.0971 | 1.3662 | 1.1124 | 1.3598 | 1.2809 |
| Pure Efficiency | 2005–2006 | 2006–2007 | 2007–2008 | 2008–2009 | 2009–2010 | 2010–2011 | 2011–2012 | 2012–2013 | 2013–2014 | 2014–2015 |
| Mean | 1.0230 | 0.9866 | 1.0181 | 0.9804 | 0.9863 | 1.0279 | 1.0056 | 0.9995 | 1.0326 | 1.0842 |
| SD | 0.0666 | 0.0714 | 0.1048 | 0.0768 | 0.0764 | 0.1808 | 0.1094 | 0.0791 | 0.1475 | 0.1912 |
| Min | 0.9193 | 0.8026 | 0.8864 | 0.7358 | 0.7747 | 0.7454 | 0.6993 | 0.8053 | 0.8823 | 0.8747 |
| Max | 1.2434 | 1.1384 | 1.3590 | 1.1467 | 1.1138 | 1.7628 | 1.2668 | 1.2331 | 1.4173 | 1.4419 |
| Technological Change | 2005–2006 | 2006–2007 | 2007–2008 | 2008–2009 | 2009–2010 | 2010–2011 | 2011–2012 | 2012–2013 | 2013–2014 | 2014–2015 |
| Mean | 0.9208 | 0.9852 | 1.0672 | 0.9988 | 0.9579 | 1.2137 | 1.0452 | 1.0189 | 1.0771 | 1.0068 |
| SD | 0.0493 | 0.0420 | 0.1204 | 0.0950 | 0.0683 | 0.2001 | 0.1214 | 0.1145 | 0.3261 | 0.1647 |
| Min | 0.7878 | 0.9348 | 0.8891 | 0.9112 | 0.8028 | 0.8409 | 0.6621 | 0.8758 | 0.9183 | 0.8814 |
| Max | 0.9994 | 1.1514 | 1.4928 | 1.3412 | 1.0576 | 1.5554 | 1.2249 | 1.4485 | 1.5091 | 1.5310 |
| Pure Technological Change | 2005–2006 | 2006–2007 | 2007–2008 | 2008–2009 | 2009–2010 | 2010–2011 | 2011–2012 | 2012–2013 | 2013–2014 | 2014–2015 |
| Mean | 0.9211 | 0.9912 | 1.0477 | 1.0417 | 0.9514 | 1.0633 | 0.9984 | 1.1123 | 1.0364 | 1.0275 |
| SD | 0.3360 | 0.3230 | 0.3289 | 0.4092 | 0.3038 | 0.3489 | 0.3284 | 0.4973 | 0.4463 | 0.3405 |
| Min | 0.7515 | 0.7000 | 0.8118 | 0.7431 | 0.7280 | 0.6344 | 0.4322 | 0.8849 | 0.6898 | 0.8837 |
| Max | 1.0615 | 1.4376 | 1.2249 | 1.6317 | 1.2268 | 1.3814 | 1.2116 | 1.4148 | 1.4336 | 1.5828 |
| Scale Efficiency | 2005–2006 | 2006–2007 | 2007–2008 | 2008–2009 | 2009–2010 | 2010–2011 | 2011–2012 | 2012–2013 | 2013–2014 | 2014–2015 |
| Mean | 1.0431 | 0.9973 | 0.9852 | 1.0358 | 0.9968 | 0.8842 | 1.0090 | 1.0002 | 1.0044 | 1.0394 |
| SD | 0.1070 | 0.0761 | 0.1253 | 0.0928 | 0.0656 | 0.1509 | 0.0716 | 0.0654 | 0.0339 | 0.0579 |
| Min | 0.9609 | 0.7781 | 0.6588 | 0.8315 | 0.8198 | 0.5538 | 0.8697 | 0.7531 | 0.9643 | 0.9913 |
| Max | 1.3722 | 1.1282 | 1.2257 | 1.3338 | 1.1230 | 1.0934 | 1.2056 | 1.1103 | 1.0999 | 1.2049 |
| Scale Technological Change | 2005–2006 | 2006–2007 | 2007–2008 | 2008–2009 | 2009–2010 | 2010–2011 | 2011–2012 | 2012–2013 | 2013–2014 | 2014–2015 |
| Mean | 1.0061 | 1.0090 | 1.0334 | 0.9847 | 1.0179 | 1.1465 | 1.0613 | 0.9461 | 1.0528 | 0.9820 |
| SD | 0.3696 | 0.3196 | 0.3305 | 0.3617 | 0.3180 | 0.3875 | 0.3354 | 0.3465 | 0.3212 | 0.2944 |
| Min | 0.7430 | 0.8010 | 0.9042 | 0.8058 | 0.7839 | 0.8903 | 0.9309 | 0.5998 | 0.9570 | 0.8661 |
| Max | 1.2555 | 1.3861 | 1.5046 | 1.2963 | 1.2737 | 1.5714 | 1.5320 | 1.0850 | 1.3818 | 1.0816 |
References
- Moreno-Serra, R.; Anaya-Montes, M.; Smith, P.C. Potential determinants of health system efficiency: Evidence from Latin America and the Caribbean. PLoS ONE 2019, 14, e0216620. [Google Scholar] [CrossRef] [PubMed]
- Ministry of Health. Health Situation Analysis; Panama Health Profile: Panama City, Panama, 2015.
- Medici, A.; Lewis, M. Health policy and finance challenges in Latin America and the Caribbean: An economic perspective. In Oxford Research Encyclopedia of Economics and Finance; Oxford University Press: Oxford, UK, 2019. [Google Scholar] [CrossRef]
- Ozcan, Y.A. Performance measurement using data envelopment analysis (DEA). In Health Care Benchmarking and Performance Evaluation; Ozcan, Y.A., Ed.; Springer: Boston, MA, USA, 2007. [Google Scholar]
- Hollingsworth, B. The measurement of efficiency and productivity of health care delivery. Health Econ. 2008, 17, 1107–1128. [Google Scholar] [CrossRef] [PubMed]
- Cantor, V.J.M.; Poh, K.L. Integrated analysis of healthcare efficiency: A systematic review. J. Med. Syst. 2018, 42, 1–23. [Google Scholar] [CrossRef] [PubMed]
- Linna, M. Health care financing reform and the productivity change in Finnish hospitals. J. Health Care Fin. 1999, 26, 83–100. [Google Scholar]
- Chang, S.J.; Hsiao, H.C.; Huang, L.H.; Chang, H. Taiwan quality indicator project and hospital productivity growth. Omega 2011, 39, 14–22. [Google Scholar] [CrossRef]
- Chowdhury, H.; Zelenyuk, V.; Laporte, A.; Wodchis, W.P. Analysis of productivity, efficiency and technological changes in hospital services in Ontario: How does case-mix matter? Int. J. Prod. Econ. 2014, 150, 74–82. [Google Scholar] [CrossRef]
- Valdmanis, V.; Rosko, M.; Mancuso, P.; Tavakoli, M.; Farrar, S. Measuring performance change in Scottish hospitals: A Malmquist and times-series approach. Health Serv. Outcomes Res. Methodol. 2017, 17, 113–126. [Google Scholar] [CrossRef][Green Version]
- Mitropoulos, P.; Mitropoulos, I.; Karanikas, H.; Polyzos, N. The impact of economic crisis on the Greek hospitals’ productivity. Int. J. Health Plan. Manag. 2018, 33, 171–184. [Google Scholar] [CrossRef]
- Ray, S.C.; Desli, E. Productivity growth, technical progress, and efficiency change in industrialized countries: Comment. Am. Econ. Rev. 1997, 87, 1033–1039. [Google Scholar]
- Simar, L.; Wilson, P.W. Estimating and bootstrapping Malmquist indices. Eur. J. Oper. Res. 1999, 115, 459–471. [Google Scholar] [CrossRef]
- Simar, L.; Wilson, P.W. A general methodology for bootstrapping in non-parametric frontier models. J. Appl. Stat. 2000, 27, 779–802. [Google Scholar] [CrossRef]
- Lothgren, M.; Tambour, M. Bootstrapping the data envelopment analysis Malmquist productivity index. Appl. Econ. 1999, 31, 417–425. [Google Scholar] [CrossRef]
- Chowdhury, H.; Wodchis, W.; Laporte, A. Efficiency and technological change in health care services in Ontario: An application of Malmquist Productivity Index with bootstrapping. Int. J. Prod. Perform. Manag. 2011, 60, 721–745. [Google Scholar] [CrossRef]
- Marques, R.C.; Carvalho, P. Estimating the efficiency of Portuguese hospitals using an appropriate production technology. Int. Trans. Oper. Res. 2013, 20, 233–249. [Google Scholar] [CrossRef]
- Ferreira, D.; Marques, R.C. Did the corporatization of Portuguese hospitals significantly change their productivity? Eur. J. Health Econ. 2015, 16, 289–303. [Google Scholar] [CrossRef] [PubMed]
- Cheng, Z.; Cai, M.; Tao, H.; He, Z.; Lin, X.; Lin, H.; Zuo, Y. Efficiency and productivity measurement of rural township hospitals in China: A bootstrapping data envelopment analysis. BMJ Open 2016, 6, e011911. [Google Scholar] [CrossRef]
- Worthington, A.C. Frontier efficiency measurement in health care: A review of empirical techniques and selected applications. Med. Care Res. Rev. 2004, 61, 135–170. [Google Scholar] [CrossRef]
- Rosko, M.D.; Mutter, R.L. Stochastic frontier analysis of hospital inefficiency: A review of empirical issues and an assessment of robustness. Med. Care Res. Rev. 2008, 65, 131–166. [Google Scholar] [CrossRef]
- Jacobs, R.; Smith, P.C.; Street, A. Measuring Efficiency in Health Care: Analytic Techniques and Health Policy; Cambridge University Press: Cambridge, UK, 2006. [Google Scholar] [CrossRef]
- Kohl, S.; Schoenfelder, J.; Fügener, A.; Brunner, J.O. The use of Data Envelopment Analysis (DEA) in healthcare with a focus on hospitals. Health Care Manag. Sci. 2019, 22, 245–286. [Google Scholar] [CrossRef]
- Varabyova, Y.; Blankart, C.R.; Schreyögg, J. Using nonparametric conditional approach to integrate quality into efficiency analysis: Empirical evidence from cardiology departments. Health Care Manag. Sci. 2017, 20, 565–576. [Google Scholar] [CrossRef] [PubMed]
- Ferreira, D.C.; Marques, R.C.; Nunes, A.M. Economies of scope in the health sector: The case of Portuguese hospitals. Eur. J. Oper. Res. 2018, 266, 716–735. [Google Scholar] [CrossRef]
- Mastromarco, C.; Stastna, L.; Votapkova, J. Efficiency of hospitals in the Czech Republic: Conditional efficiency approach. J. Prod. Anal. 2019, 51, 73–89. [Google Scholar] [CrossRef]
- Ozcan, Y.A.; Luke, R.D.; Haksever, C. Ownership and organizational performance: A comparison of technical efficiency across hospital types. Med. Care 1992, 30, 781–794. [Google Scholar] [CrossRef] [PubMed]
- Burgess, J.F., Jr.; Wilson, P.W. Hospital ownership and technical inefficiency. Manage. Sci. 1996, 42, 110–123. [Google Scholar] [CrossRef]
- Chang, H.; Cheng, M.A.; Das, S. Hospital ownership and operating efficiency: Evidence from Taiwan. Eur. J. Oper. Res. 2004, 159, 513–527. [Google Scholar] [CrossRef]
- Barbetta, G.P.; Turati, G.; Zago, A.M. Behavioral differences between public and private not-for-profit hospitals in the Italian national health service. Health Econ. 2007, 16, 75–96. [Google Scholar] [CrossRef]
- Herr, A. Cost and technical efficiency of German hospitals: Does ownership matter? Health Econ. 2008, 17, 1057–1071. [Google Scholar] [CrossRef]
- Farsi, M.; Filippini, M. Effects of ownership, subsidization and teaching activities on hospital costs in Switzerland. Health Econ. 2008, 17, 335–350. [Google Scholar] [CrossRef]
- Tiemann, O.; Schreyögg, J. Effects of ownership on hospital efficiency in Germany. Bus. Res. 2009, 2, 115–145. [Google Scholar] [CrossRef]
- Czypionka, T.; Kraus, M.; Mayer, S.; Röhrling, G. Efficiency, ownership, and financing of hospitals: The case of Austria. Health Care Manag. Sci. 2014, 17, 331–347. [Google Scholar] [CrossRef]
- Chen, K.C.; Chen, H.M.; Chien, L.N.; Yu, M.M. Productivity growth and quality changes of hospitals in Taiwan: Does ownership matter? Health Care Manag. Sci. 2019, 22, 451–461. [Google Scholar] [CrossRef] [PubMed]
- Ferreira, D.C.; Marques, R.C. Public-private partnerships in health care services: Do they outperform public hospitals regarding quality and access? Evidence from Portugal. Socio-Econ. Plan. Sci. 2021, 73, 100798. [Google Scholar] [CrossRef]
- Kruse, F.M.; Stadhouders, N.W.; Adang, E.M.; Groenewoud, S.; Jeurissen, P.P. Do private hospitals outperform public hospitals regarding efficiency, accessibility, and quality of care in the European Union? A literature review. Int. J. Health Plan. Manag. 2018, 33, e434–e453. [Google Scholar] [CrossRef] [PubMed]
- Lindlbauer, I.; Schreyögg, J. The relationship between hospital specialization and hospital efficiency: Do different measures of specialization lead to different results? Health Care Manag. Sci. 2014, 17, 365–378. [Google Scholar] [CrossRef] [PubMed]
- Lee, K.; Chun, K.; Lee, J. Reforming the hospital service structure to improve efficiency: Urban hospital specialization. Health Policy 2008, 87, 41–49. [Google Scholar] [CrossRef]
- Daidone, S.; D’Amico, F. Technical efficiency, specialization and ownership form: Evidences from a pooling of Italian hospitals. J. Product. Anal. 2009, 32, 203–216. [Google Scholar] [CrossRef]
- Bannick, R.R.; Ozcan, Y.A. Efficiency analysis of federally funded hospitals: Comparison of DoD and VA hospitals using data envelopment analysis. Health Serv. Manag. Res. 1995, 8, 73–85. [Google Scholar] [CrossRef]
- Maniadakis, N.; Hollingsworth, B.; Thanassoulis, E. The impact of the internal market on hospital efficiency, productivity and service quality. Health Care Manag. Sci. 1999, 2, 75–85. [Google Scholar] [CrossRef]
- Biørn, E.; Hagen, T.P.; Iversen, T.; Magnussen, J. The effect of activity-based financing on hospital efficiency: A panel data analysis of DEA efficiency scores 1992–2000. Health Care Manag. Sci. 2003, 6, 271–283. [Google Scholar] [CrossRef]
- Blank, J.; Eggink, E. The impact of policy on hospital productivity: A time series analysis of Dutch hospitals. Health Care Manag. Sci. 2014, 17, 139–149. [Google Scholar] [CrossRef]
- Rego, G.; Nunes, R.; Costa, J. The challenge of corporatisation: The experience of Portuguese public hospitals. Eur. J. Health Econ. 2010, 11, 367–381. [Google Scholar] [CrossRef]
- O’Neill, L.; Rauner, M.; Heidenberger, K.; Kraus, M. A cross-national comparison and taxonomy of DEA-based hospital efficiency studies. Socio-Econ. Plan. Sci. 2008, 42, 158–189. [Google Scholar] [CrossRef]
- Jehu-Appiah, C.; Sekidde, S.; Adjuik, M.; Akazili, J.; Almeida, S.D.; Nyonator, F.; Baltussen, R.; Zere Asbu, E.; Muthuri-Kirigia, J. Ownership and technical efficiency of hospitals: Evidence from Ghana using data envelopment analysis. Cost Eff. Resour. Alloc. 2014, 12, 1–13. [Google Scholar] [CrossRef]
- Şahin, B.; İlgün, G. Assessment of the impact of public hospital associations (PHAs) on the efficiency of hospitals under the ministry of health in Turkey with data envelopment analysis. Health Care Manag. Sci. 2019, 22, 437–446. [Google Scholar] [CrossRef]
- Babalola, T.K.; Moodley, I. Assessing the efficiency of health-care facilities in Sub-Saharan Africa: A systematic review. Health Serv. Res. Manag. Epidemiol. 2020, 7. [Google Scholar] [CrossRef]
- Seddighi, H.; Nejad, F.N.; Basakha, M. Health systems efficiency in Eastern Mediterranean Region: A data envelopment analysis. Cost Eff. Resour. Alloc. 2020, 18, 1–7. [Google Scholar] [CrossRef] [PubMed]
- Arocena, P.; García-Prado, A. Accounting for quality in the measurement of hospital performance: Evidence from Costa Rica. Health Econ. 2007, 16, 667–685. [Google Scholar] [CrossRef]
- De Castro Lobo, M.S.; Ozcan, Y.A.; da Silva, A.C.; Lins, M.P.E.; Fiszman, R. Financing reform and productivity change in Brazilian teaching hospitals: Malmquist approach. Cent. Eur. J. Oper. Res. 2010, 18, 141–152. [Google Scholar] [CrossRef]
- Longaray, A.; Ensslin, L.; Ensslin, S.; Alves, G.; Dutra, A.; Munhoz, P. Using MCDA to evaluate the performance of the logistics process in public hospitals: The case of a Brazilian teaching hospital. Int. Trans. Oper. Res. 2018, 25, 133–156. [Google Scholar] [CrossRef]
- Giménez, V.; Keith, J.R.; Prior, D. Do healthcare financing systems influence hospital efficiency? A metafrontier approach for the case of Mexico. Health Care Manag. Sci. 2019, 22, 549–559. [Google Scholar] [CrossRef] [PubMed]
- Giménez, V.; Prieto, W.; Prior, D.; Tortosa-Ausina, E. Evaluation of efficiency in Colombian hospitals: An analysis for the post-reform period. Socio-Econ. Plan. Sci. 2019, 65, 20–35. [Google Scholar] [CrossRef]
- Piedra-Peña, J.; Prior, D. Analyzing the Effect of Health Reforms on the Efficiency of Ecuadorian Public Hospitals; Working Paper, 2020–05; Universitat Autònoma de Barcelona: Barcelona, Spain, 2020. [Google Scholar]
- Giancotti, M.; Pipitone, V.; Mauro, M.; Guglielmo, A. 20 years of studies on technical and scale efficiency in the hospital sector: A review of methodological approaches. Int. J. Bus. Manag. Invent. 2016, 5, 34–54. [Google Scholar]
- Caves, D.W.; Christensen, L.R.; Diewert, W.E. The economic theory of index numbers and the measurement of input, output, and productivity. Econometrica 1982, 50, 1393–1414. [Google Scholar] [CrossRef]
- Färe, R.; Grosskopf, S.; Lindgren, B.; Roos, P. Productivity changes in Swedish pharamacies 1980–1989: A non-parametric Malmquist approach. J. Prod. Anal. 1992, 3, 85–101. [Google Scholar] [CrossRef]
- Shephard, R.W. Cost and Production Functions; Princeton University Press: Princeton, NJ, USA, 1953. [Google Scholar]
- Barros, C.P.; De Menezes, A.G.; Peypoch, N.; Solonandrasana, B.; Vieira, J.C. An analysis of hospital efficiency and productivity growth using the Luenberger indicator. Health Care Manag. Sci. 2008, 11, 373. [Google Scholar] [CrossRef]
- Grosskopf, S. Some remarks on productivity and its decompositions. J. Prod. Anal. 2003, 20, 459–474. [Google Scholar] [CrossRef]
- Lovell, C.A.K. The decomposition of Malmquist productivity indexes. J. Prod. Anal. 2003, 20, 437–458. [Google Scholar] [CrossRef]
- Balk, B.M. Scale efficiency and productivity change. J. Prod. Anal. 2001, 15, 159–183. [Google Scholar] [CrossRef]
- Färe, R.; Grosskopf, S.; Norris, M.; Zhang, Z. Productivity growth, technical progress, and efficiency change in industrialized countries. Am. Econ. Rev. 1994, 84, 66–83. [Google Scholar]
- Efron, B. Bootstrap methods: Another look at the jackknife. Ann. Stat. 1979, 7, 1–16. [Google Scholar] [CrossRef]
- Efron, B.; Tibshirani, R.J. An Introduction to the Bootstrap; Chapman & Hall: London, UK, 1993. [Google Scholar]
- Simar, L.; Wilson, P.W. Sensitivity analysis of efficiency scores: How to bootstrap in nonparametric frontier models. Manag. Sci. 1998, 44, 49–61. [Google Scholar] [CrossRef]
- Lee, J.; McCullough, J.S.; Town, R.J. The impact of health information technology on hospital productivity. RAND J. Econ. 2013, 44, 545–568. [Google Scholar] [CrossRef]
- Wang, T.; Wang, Y.; McLeod, A. Do health information technology investments impact hospital financial performance and productivity? Int. J. Account. Inf. Syst. 2018, 28, 1–13. [Google Scholar] [CrossRef]
- Magnussen, J.; Hagen, T.P.; Kaarboe, O.M. Centralized or decentralized? A case study of Norwegian hospital reform. Soc. Sci. Med. 2007, 64, 2129–2137. [Google Scholar] [CrossRef]
- Jiang, S.; Min, R.; Fang, P.Q. The impact of healthcare reform on the efficiency of public county hospitals in China. BMC Health Serv. Res. 2017, 17, 838. [Google Scholar] [CrossRef]
- Mollahaliloglu, S.; Kavuncubasi, S.; Yilmaz, F.; Younis, M.Z.; Simsek, F.; Kostak, M.; Yildirim, S.; Nwagwu, E. Impact of health sector reforms on hospital productivity in Turkey: Malmquist index approach. Int. J. Organ. Theory Behavior. 2018, 21, 72–84. [Google Scholar] [CrossRef]
- Hafidz, F.; Ensor, T.; Tubeuf, S. Efficiency measurement in health facilities: A systematic review in low-and middle-income countries. Appl. Health Econ. Health Policy 2018, 16, 465–480. [Google Scholar] [CrossRef]
- Anthun, K.S.; Kittelsen, S.A.C.; Magnussen, J. Productivity growth, case mix and optimal size of hospitals. A 16-year study of the Norwegian hospital sector. Health Policy 2017, 121, 418–425. [Google Scholar] [CrossRef]
- Wang, M.L.; Fang, H.Q.; Tao, H.B.; Cheng, Z.H.; Lin, X.J.; Cai, M.; Xu, C.; Jiang, S. Bootstrapping data envelopment analysis of efficiency and productivity of county public hospitals in Eastern, Central, and Western China after the public hospital reform. Cur. Med. Sci. 2017, 37, 681–692. [Google Scholar] [CrossRef]
- Alatawi, A.; Ahmed, S.; Niessen, L.; Khan, J. Systematic review and meta-analysis of public hospital efficiency studies in Gulf region and selected countries in similar settings. Cost Eff. Resour. Alloc. 2019, 17, 1–12. [Google Scholar] [CrossRef]
- Odeck, J. Statistical precision of DEA and Malmquist indices: A bootstrap application to Norwegian grain producers. Omega 2009, 37, 1007–1017. [Google Scholar] [CrossRef]
- Daraio, C.; Simar, L. Advanced Robust and Nonparametric Methods in Efficiency Analysis: Methodology and Applications; Springer: New York, NY, USA, 2007. [Google Scholar]
- Charles, V.; Aparicio, J.; Zhu, J. The curse of dimensionality of decision-making units: A simple approach to increase the discriminatory power of data envelopment analysis. Eur. J. Oper. Res. 2019, 279, 929–940. [Google Scholar] [CrossRef]
- Simar, L.; Wilson, P.W. Estimation and inference in two-stage, semi-parametric models of production processes. J. Econom. 2007, 136, 31–64. [Google Scholar] [CrossRef]
- Simar, L.; Wilson, P.W. Two-stage DEA: Caveat emptor. J. Prod. Anal. 2011, 36, 205–218. [Google Scholar] [CrossRef]


| Province | Total | SSF | MoH |
|---|---|---|---|
| Bocas del Toro | 3 | 3 | 0 |
| Chiriquí | 2 | 1 | 1 |
| Coclé | 2 | 1 | 1 |
| Darién | 1 | 0 | 1 |
| Herrera | 2 | 1 | 1 |
| Los Santos | 3 | 0 | 3 |
| Panama | 6 | 3 | 3 |
| Veraguas | 3 | 2 | 1 |
| Total | 22 | 11 | 11 |
| Variables | Mean | SD | Min | Max | |
|---|---|---|---|---|---|
| Outputs | Discharges | 8885 | 8598 | 407 | 32,009 |
| Emergencies | 52,153 | 36,082 | 2717 | 171,744 | |
| Inputs | Beds | 205 | 209 | 15 | 843 |
| Medical staff | 111 | 173 | 5 | 1021 | |
| Non-medical staff | 321 | 256 | 6 | 1049 | |
| Variables | SSF | MoH | |||
|---|---|---|---|---|---|
| Mean | SD | Mean | SD | ||
| Outputs | Discharges | 6178 | 6183 | 11,593 | 11,464 |
| Emergencies | 43,623 | 43,638 | 60,684 | 60,486 | |
| Inputs | Beds | 175 | 176 | 234 | 230 |
| Medical staff | 131 | 131 | 92 | 90 | |
| Non-medical staff | 338 | 341 | 303 | 302 | |
| MPI | EC | PEC | SEC | TC | PTC | STC | |
|---|---|---|---|---|---|---|---|
| Mean | 1.0253 | 1.0054 | 1.0144 | 0.9993 | 1.0242 | 1.0111 | 1.0300 |
| SD | 0.0400 | 0.0253 | 0.0339 | 0.0142 | 0.0220 | 0.0330 | 0.0407 |
| Min | 0.9788 | 0.9718 | 0.9769 | 0.9648 | 0.9904 | 0.9634 | 0.9775 |
| Max | 1.1341 | 1.0770 | 1.1259 | 1.0319 | 1.0924 | 1.0863 | 1.1527 |
| MPI | EC | TC | |
|---|---|---|---|
| Mean | 1.0253 | 1.0054 | 1.0242 |
| Lower bound | 0.9911 | 0.8223 | 0.8534 |
| Upper bound | 1.0704 | 1.2133 | 1.2613 |
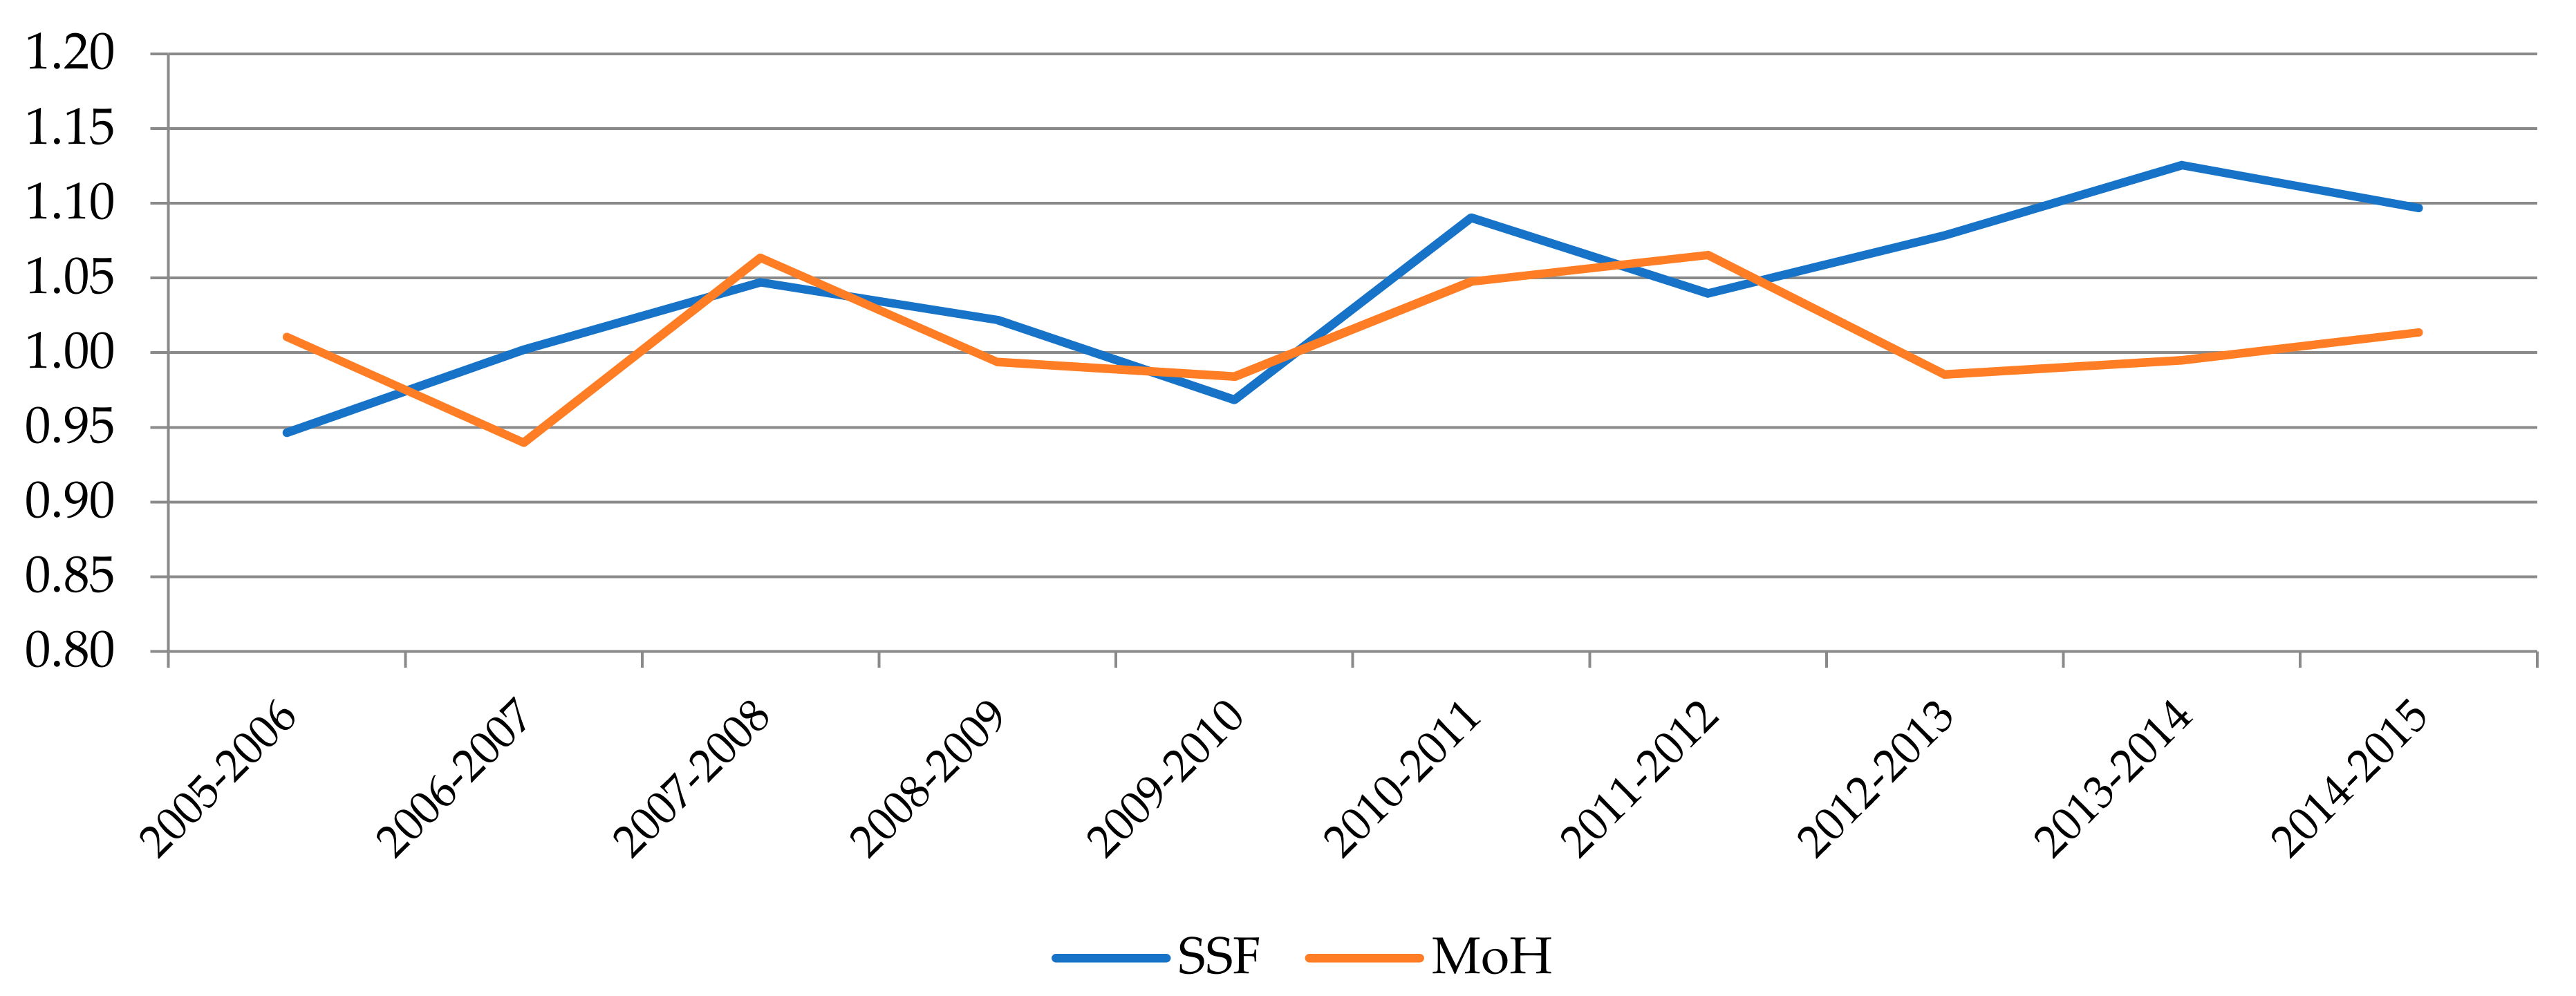
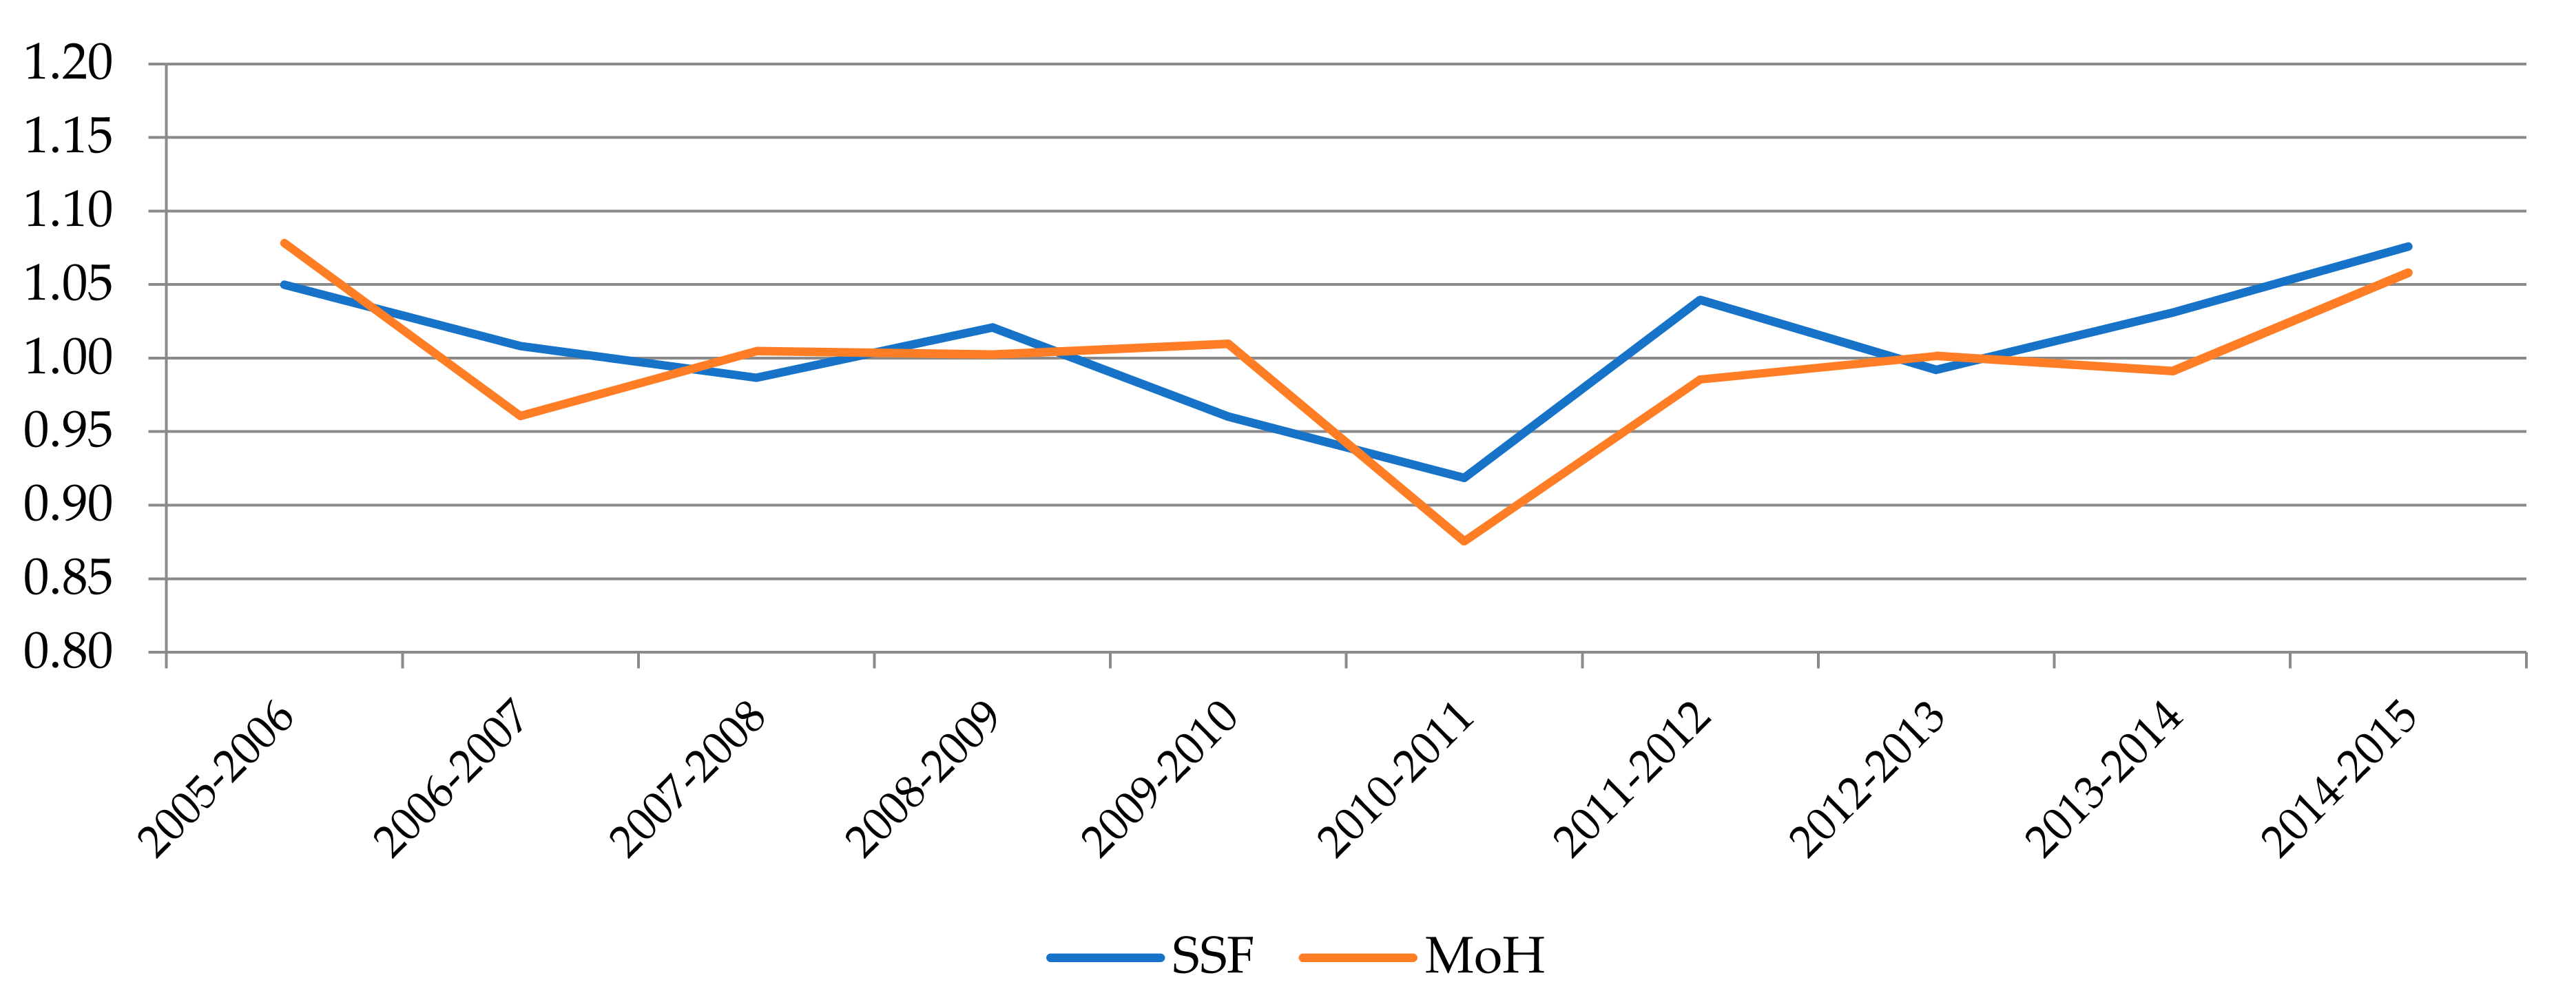
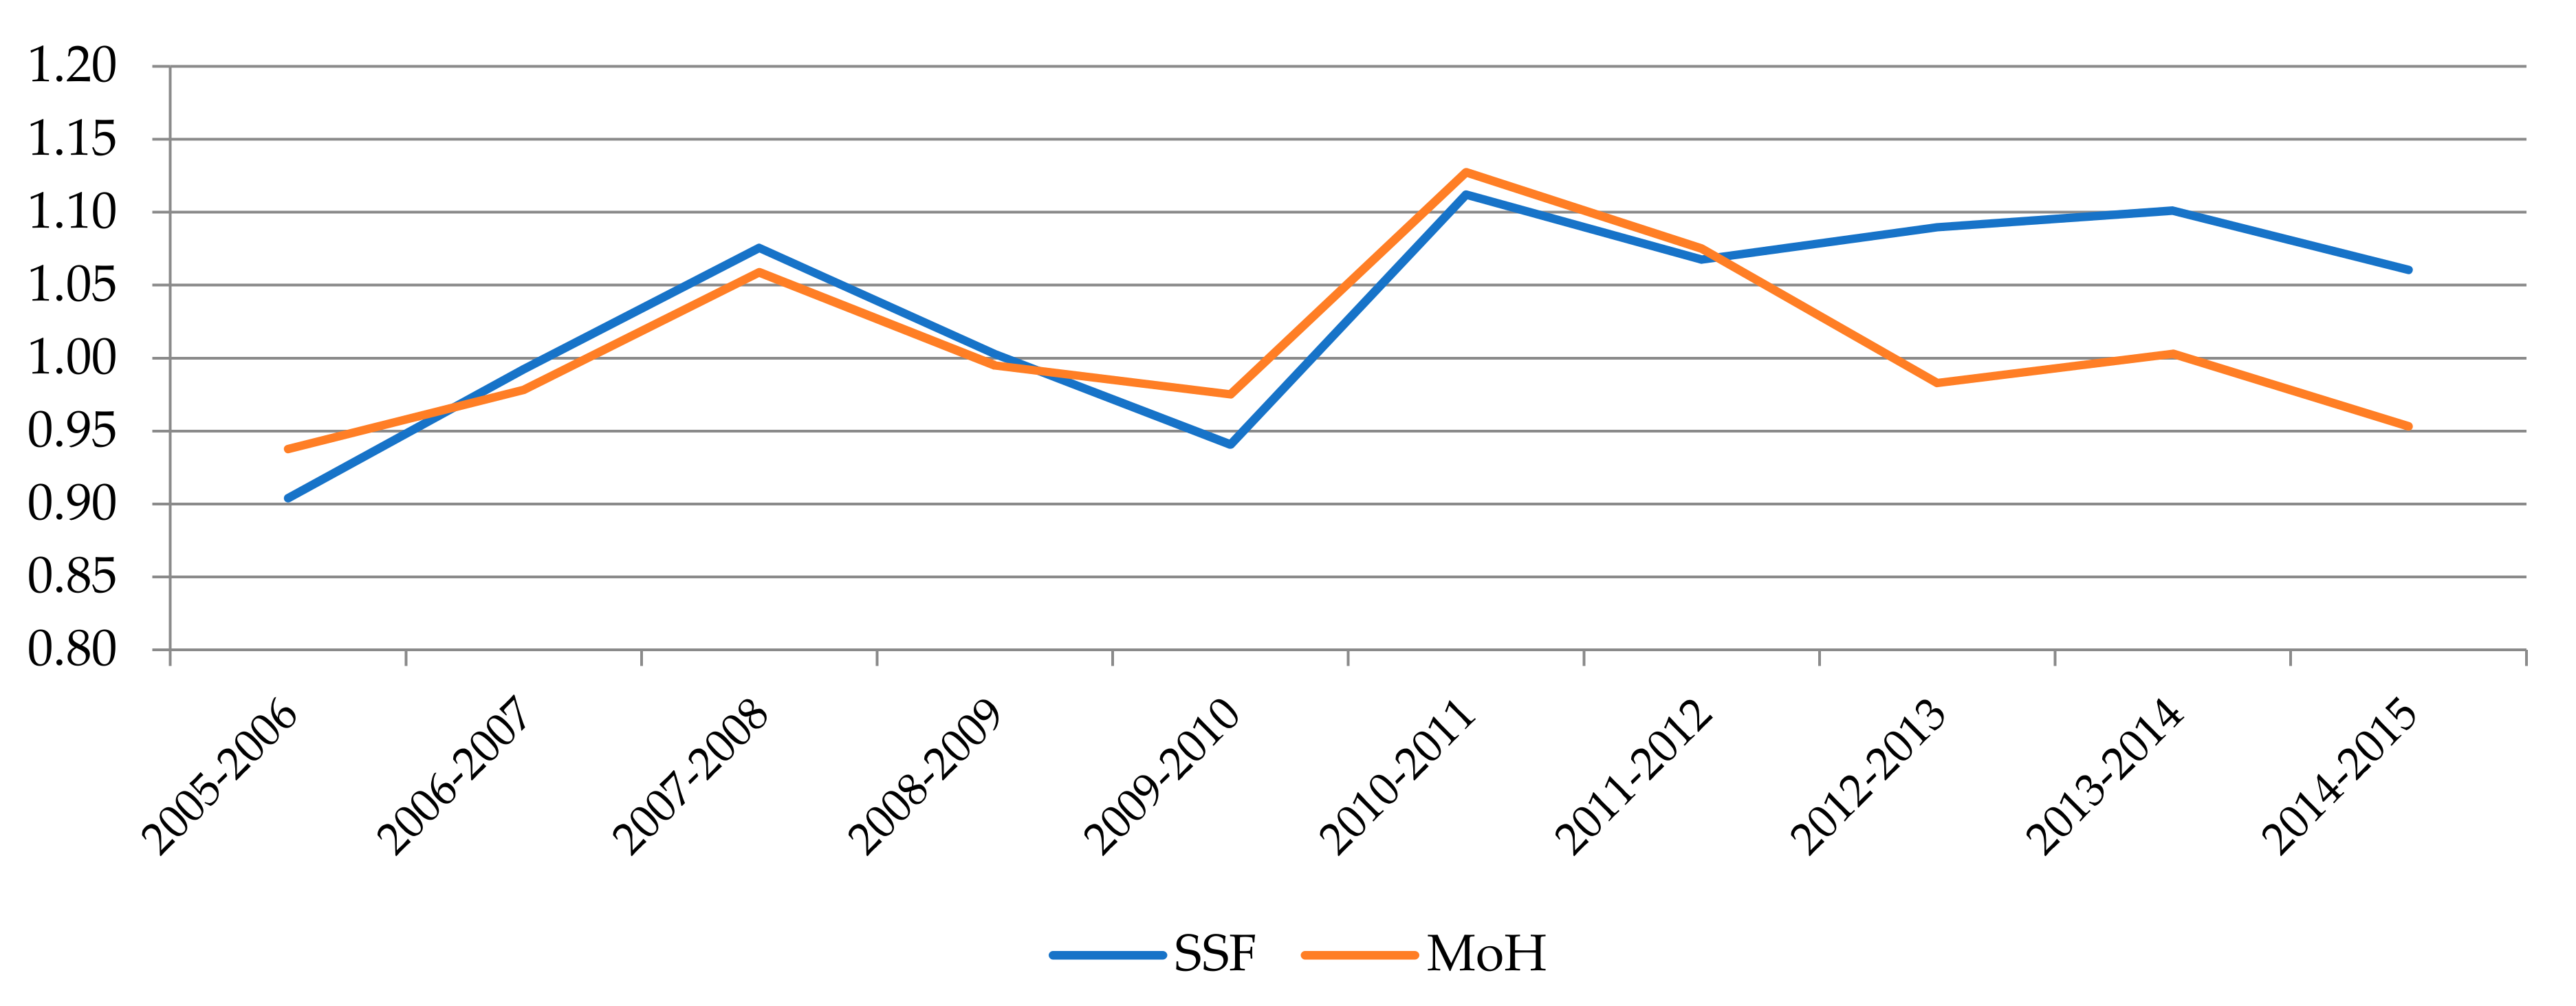
| Management System | MPI | EC | PEC. | SEC | TC | PTC | STC | |
|---|---|---|---|---|---|---|---|---|
| SSF | Mean | 1.0365 | 1.0093 | 1.0175 | 0.9993 | 1.0365 | 1.0208 | 1.0348 |
| SD | 0.0470 | 0.0208 | 0.0279 | 0.0081 | 0.0281 | 0.0348 | 0.0469 | |
| Min | 0.9836 | 0.9732 | 0.9769 | 0.9858 | 0.9904 | 0.9767 | 0.9869 | |
| Max | 1.0924 | 1.0489 | 1.0685 | 1.0154 | 1.0924 | 1.0863 | 1.1227 | |
| MoH | Mean | 1.0141 | 1.0015 | 1.0028 | 0.9997 | 1.0185 | 1.0006 | 1.0248 |
| SD | 0.0297 | 0.0296 | 0.0164 | 0.0192 | 0.0127 | 0.0291 | 0.0341 | |
| Min | 0.9788 | 0.9718 | 0.9833 | 0.9648 | 0.9967 | 0.9634 | 0.9775 | |
| Max | 1.0860 | 1.0770 | 1.0473 | 1.0319 | 1.0412 | 1.0451 | 1.0850 |
| Management System | MPI | EC | TC | |
|---|---|---|---|---|
| SSF | Mean | 1.0365 | 1.0093 | 1.0298 |
| Lower bound | 1.0008 | 0.8262 | 0.8473 | |
| Upper bound | 1.0919 | 1.2359 | 1.2749 | |
| MoH | Mean | 1.0141 | 1.0015 | 1.0185 |
| Lower bound | 0.9827 | 0.8185 | 0.8595 | |
| Upper bound | 1.0489 | 1.1908 | 1.2477 |
| System | Hospital | MPI | Lower Bound | Upper Bound | EC | Lower Bound | Upper Bound | TC | Lower Bound | Upper Bound |
|---|---|---|---|---|---|---|---|---|---|---|
| SSF | Hospital de Especialidades Pediatrica Omar Torrijos Herrera | 1.1341 | 1.0525 | 1.3378 | 1.0489 | 0.7875 | 1.4774 | 1.0590 | 0.8193 | 1.3920 |
| SSF | Hospital de Almirante | 1.0924 | 1.0721 | 1.1133 | 1.0000 | 0.7813 | 1.2900 | 1.0924 | 0.8575 | 1.4002 |
| MoH | Hospital Regional de Azuero Anita Moreno | 1.0860 | 1.0309 | 1.1332 | 1.0770 | 0.8754 | 1.2558 | 1.0070 | 0.8695 | 1.2469 |
| SSF | Hospital de Changuinola | 10807 | 1.0387 | 1.1427 | 1.0375 | 0.9942 | 1.0731 | 1.0151 | 0.8822 | 1.2209 |
| MoH | Hospital San Miguel Arcangel | 1.0426 | 1.0243 | 1.0601 | 1.0319 | 0.8656 | 1.1891 | 1.0148 | 0.8790 | 1.2051 |
| SSF | Policlinica Especializada Dr. Horacio Diaz Gomez | 1.0326 | 0.9966 | 1.0830 | 1.0000 | 0.7859 | 1.3207 | 1.0326 | 0.7965 | 1.3253 |
| SSF | Hospital Dr. Gustavo Nelson Collado (Chitre) | 1.0290 | 1.0073 | 1.0717 | 1.0343 | 0.8331 | 1.2311 | 1.0177 | 0.8558 | 1.2616 |
| SSF | Hospital Regional Dr. Rafael Hernandez | 1.0265 | 1.0067 | 1.0651 | 1.0161 | 0.8535 | 1.2019 | 1.0210 | 0.8669 | 1.2161 |
| SSF | Complejo Hospitalario Metropolitano Arnulfo A. Madrid | 1.0227 | 1.0094 | 1.0399 | 0.9946 | 0.7997 | 1.2162 | 1.0331 | 0.8463 | 1.2863 |
| MoH | Hospital Materno Infantil Jose Domingo de Obaldia | 1.0217 | 0.9740 | 1.0566 | 0.9862 | 0.8196 | 1.1538 | 1.0412 | 0.8823 | 1.2672 |
| MoH | Hospital San José de La Palma | 1.0185 | 0.9798 | 1.0487 | 1.0020 | 0.8368 | 1.1556 | 1.0190 | 0.8798 | 1.2218 |
| MoH | Hospital Luis Chicho Fabrega | 1.0135 | 0.9887 | 1.0386 | 1.0000 | 0.7893 | 1.2282 | 1.0135 | 0.8351 | 1.2831 |
| SSF | Hospital Dr. Rafael Estevez | 1.0134 | 0.9580 | 1.0657 | 1.0117 | 0.8614 | 1.1533 | 1.0188 | 0.8850 | 1.1833 |
| MoH | Hospital Rafael H. Moreno | 1.0116 | 0.9946 | 1.0389 | 1.0000 | 0.7903 | 1.2250 | 1.0116 | 0.8320 | 1.2863 |
| MoH | Hospital Santo Tomas | 1.0026 | 1.0001 | 1.0284 | 0.9912 | 0.8148 | 1.1789 | 1.0282 | 0.8607 | 1.2569 |
| MoH | Hospital Del Niño | 1.0016 | 0.9896 | 1.0330 | 0.9755 | 0.8283 | 1.1551 | 1.0353 | 0.8758 | 1.2312 |
| SSF | Hospital Dra. Susana Jones Cano | 0.9959 | 0.9717 | 1.0182 | 1.0000 | 0.7776 | 1.2198 | 0.9959 | 0.8245 | 1.2908 |
| SSF | Hospital de Chiriqui Grande | 0.9904 | 0.9582 | 1.0350 | 1.0000 | 0.8031 | 1.2496 | 0.9904 | 0.8130 | 1.2341 |
| MoH | Hospital Dr. Aquilino Tejeira | 0.9895 | 0.9617 | 1.0232 | 0.9933 | 0.7743 | 1.2082 | 0.9967 | 0.8260 | 1.2928 |
| MoH | Hospital Dr. Joaquin Pablo Franco | 0.9893 | 0.9308 | 1.0350 | 0.9876 | 0.8026 | 1.1788 | 1.0148 | 0.8569 | 1.2199 |
| SSF | Hospital Ezequiel Abadia | 0.9836 | 0.9247 | 1.0390 | 0.9732 | 0.8108 | 1.1618 | 1.0368 | 0.8733 | 1.2133 |
| MoH | Hospital Dr. Cecilio A. Castillero | 0.9788 | 0.9351 | 1.0418 | 0.9718 | 0.8062 | 1.1703 | 1.0219 | 0.8571 | 1.2131 |
Publisher’s Note: MDPI stays neutral with regard to jurisdictional claims in published maps and institutional affiliations. |
© 2021 by the authors. Licensee MDPI, Basel, Switzerland. This article is an open access article distributed under the terms and conditions of the Creative Commons Attribution (CC BY) license (https://creativecommons.org/licenses/by/4.0/).
Share and Cite
Cordero, J.M.; García-García, A.; Lau-Cortés, E.; Polo, C. Efficiency and Productivity Change of Public Hospitals in Panama: Do Management Schemes Matter? Int. J. Environ. Res. Public Health 2021, 18, 8630. https://doi.org/10.3390/ijerph18168630
Cordero JM, García-García A, Lau-Cortés E, Polo C. Efficiency and Productivity Change of Public Hospitals in Panama: Do Management Schemes Matter? International Journal of Environmental Research and Public Health. 2021; 18(16):8630. https://doi.org/10.3390/ijerph18168630
Chicago/Turabian StyleCordero, José M., Agustín García-García, Enrique Lau-Cortés, and Cristina Polo. 2021. "Efficiency and Productivity Change of Public Hospitals in Panama: Do Management Schemes Matter?" International Journal of Environmental Research and Public Health 18, no. 16: 8630. https://doi.org/10.3390/ijerph18168630
APA StyleCordero, J. M., García-García, A., Lau-Cortés, E., & Polo, C. (2021). Efficiency and Productivity Change of Public Hospitals in Panama: Do Management Schemes Matter? International Journal of Environmental Research and Public Health, 18(16), 8630. https://doi.org/10.3390/ijerph18168630