
Reducing Peak Energy Demand among Residents Who Are Not Billed for Their Electricity Consumption: Experimental Evaluation of Behaviour Change Interventions in a University Setting


Abstract
:1. Introduction
2. Review of Energy-Saving Interventions in University Residential Halls
3. A Focus on Peak Energy Demand
4. The Study Context
5. Materials and Methods
5.1. Experiment One
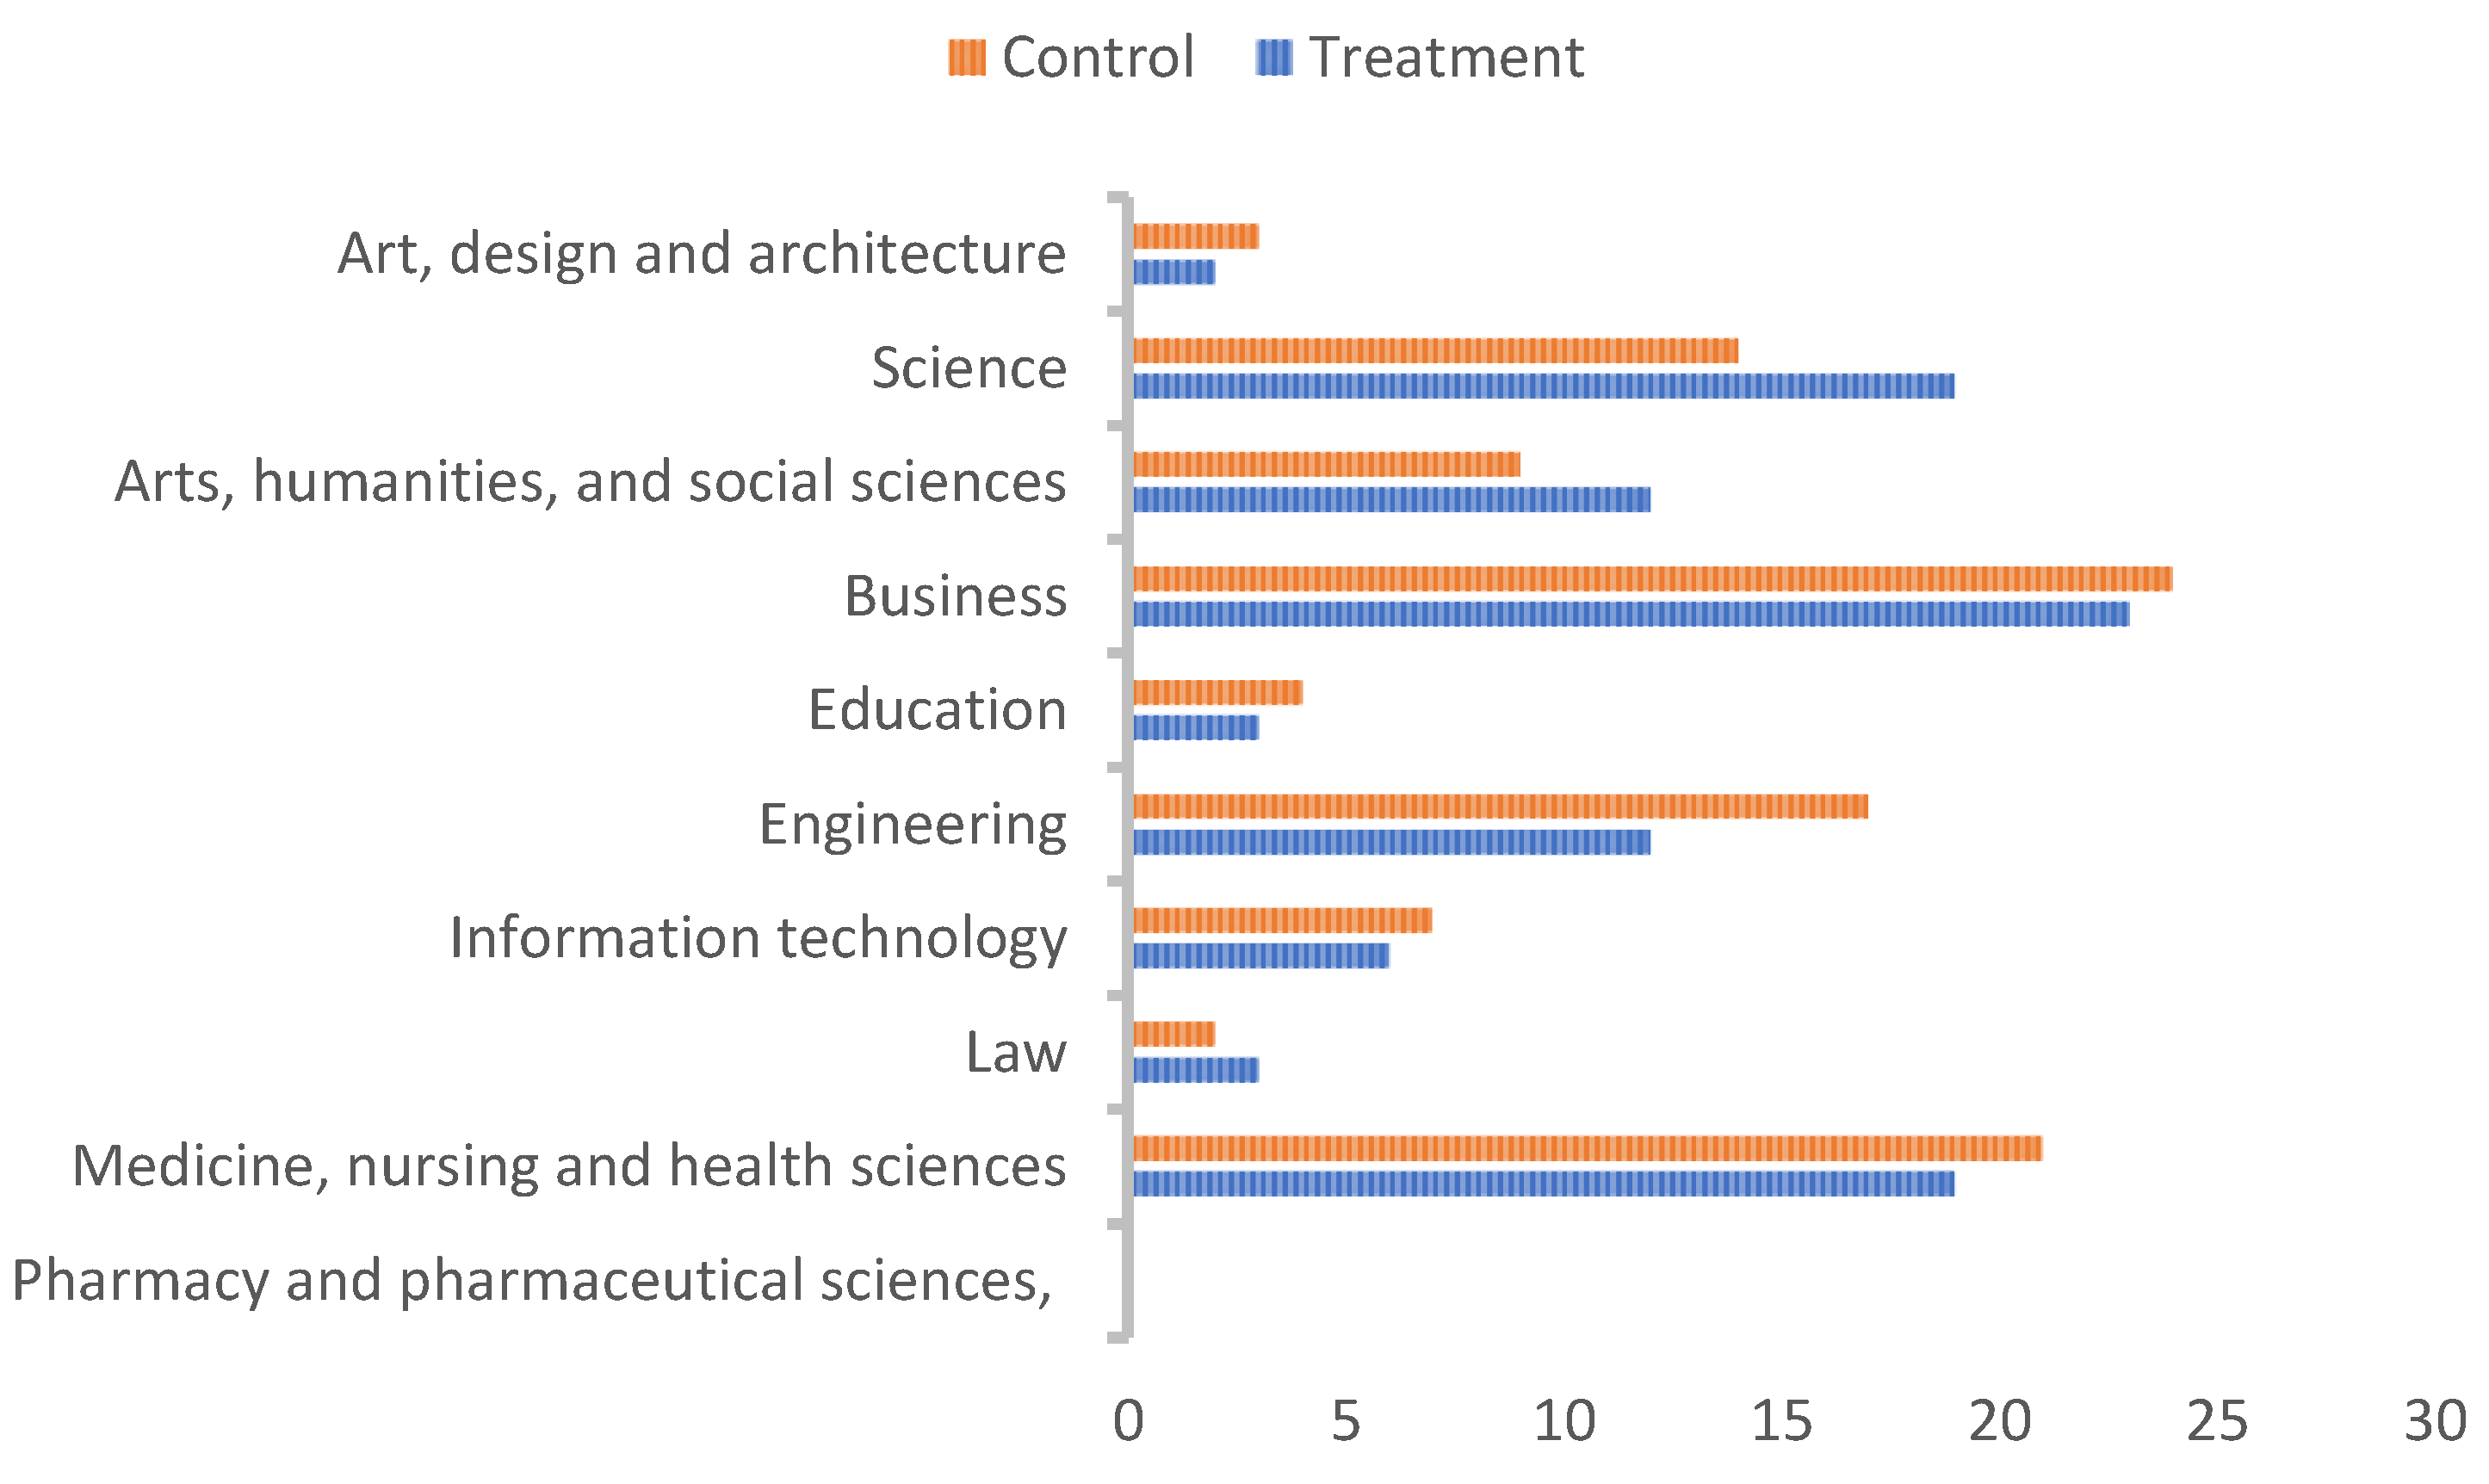
5.1.1. Participants
5.1.2. Procedures
- The student’s ranking in comparison to other students in the treatment group—the student with the lowest peak demand for the week was ranked as #1, while the student with the highest peak demand was ranked as #73.
- A link to a dashboard with more detailed information about the student’s energy use, including a 24-h demand profile, and a chart tracking their progress across the weeks of the study [13].
5.2. Experiment Two
5.2.1. Participants
5.2.2. Procedures
- No notification (control condition).
- An 8-h notification.
- A 24-h notification with a 2-h reminder (24 + 2 condition).
- -
- Students who reduced their energy use in comparison to their baseline received: “Good work! To save even more energy try following the tips below during the next peak demand event.” [14]
- -
- Students who increased their energy use in comparison to their baseline received: “Looks like you’re having a bit of trouble saving energy-the tips below might help you during the next peak demand event.”
- The percentage difference in the student’s energy use in comparison to their baseline.
- A chart showing their baseline energy demand during peak times in comparison to their energy demand during the simulated peak demand event.
- The student’s ranking in comparison to other students.
6. Results and Discussion
6.1. Experiment One Results and Discussion
6.1.1. Survey Analysis
6.1.2. Energy Consumption Analysis
6.2. Experiment Two Results and Discussion
6.2.1. Statistical Model
- is the response due to subject , treatment , period and sequence .
- is the overall mean.
- is the fixed effect of the th sequence.
- is the random effect of subject nested within sequence .
- is the fixed effect due to period .
- is the direct effect of treatment administered in period of sequence .
- is the carryover effect of the treatment administered in period of sequence .
- is the fixed blocking effect to account for variation between buildings.
- is the random error term.
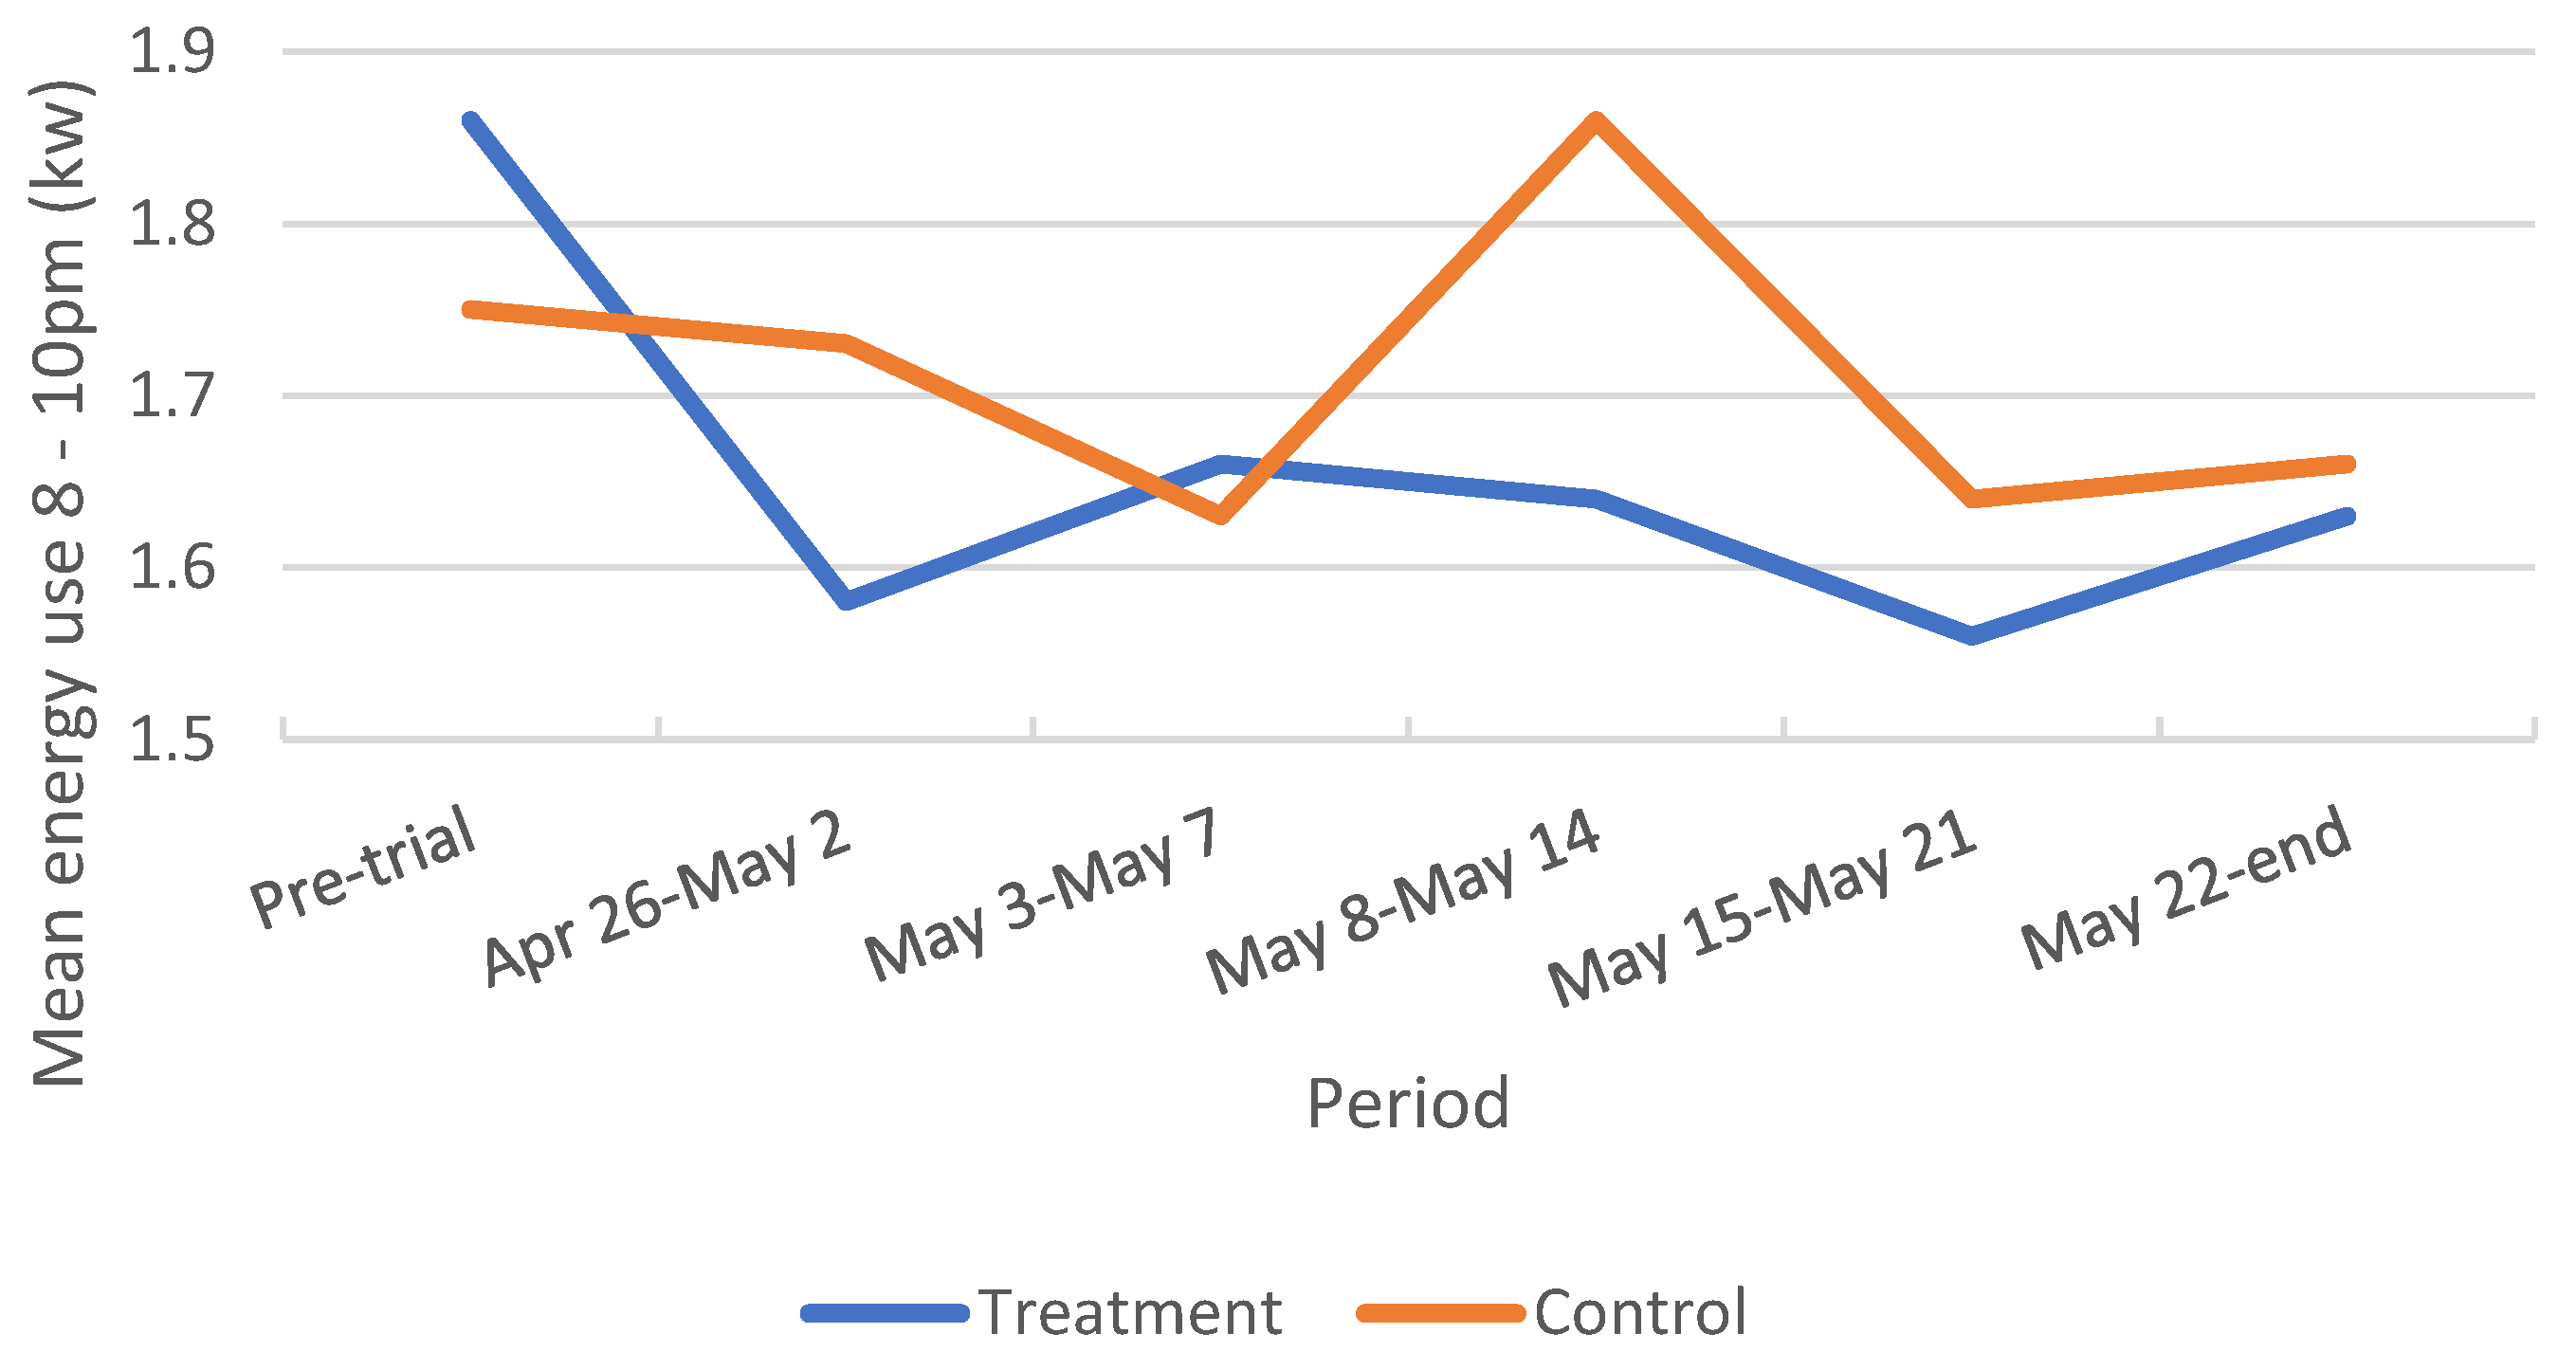
6.2.2. Energy Use Analysis
6.2.3. Ease of Reducing Energy Consumption during Peak Time
6.2.4. Participant Preferences for Different Notification Periods
6.2.5. Participant Preferences for Automatic versus Manual Control of Appliances
6.3. Study Limitations
7. Conclusions
Author Contributions
Funding
Institutional Review Board Statement
Informed Consent Statement
Data Availability Statement
Acknowledgments
Conflicts of Interest
References
- McAndrew, R.; Mulcahy, R.; Gordon, R.; Russell-Bennett, R. Household Energy Efficiency Interventions: A Systematic Literature Review. Energy Policy 2021, 150, 112136. [Google Scholar] [CrossRef]
- Bird, S.; Legault, L. Feedback and Behavioral Intervention in Residential Energy and Resource Use: A Review. Curr. Sustain. Renew. Energy Rep. 2018, 5, 116–126. [Google Scholar] [CrossRef]
- Paterakis, N.G.; Erdinç, O.; Catalão, J.P. An Overview of Demand Response: Key-Elements and International Experience. Renew. Sustain. Energy Rev. 2017, 69, 871–891. [Google Scholar] [CrossRef]
- Eid, C.; Koliou, E.; Valles, M.; Reneses, J.; Hakvoort, R. Time-Based Pricing and Electricity Demand Response: Existing Barriers and next Steps. Util. Policy 2016, 40, 15–25. [Google Scholar] [CrossRef] [Green Version]
- Andor, M.A.; Fels, K.M. Behavioral Economics and Energy Conservation—A Systematic Review of Non-Price Interventions and Their Causal Effects. Ecol. Econ. 2018, 148, 178–210. [Google Scholar] [CrossRef] [Green Version]
- Bekker, M.J.; Cumming, T.D.; Osborne, N.K.; Bruining, A.M.; McClean, J.I.; Leland, L.S., Jr. Encouraging Electricity Savings in a University Residential Hall through a Combination of Feedback, Visual Prompts, and Incentives. J. Appl. Behav. Anal. 2010, 43, 327–331. [Google Scholar] [CrossRef]
- Erlene Parece, T.; Younos, T.; Grossman, L.S.; Geller, E.S. A Study of Environmentally Relevant Behavior in University Residence Halls. Int. J. Sustain. High. Educ. 2013, 14, 466–481. [Google Scholar] [CrossRef]
- Bator, R.J.; Phelps, K.; Tabanico, J.; Schultz, P.W.; Walton, M.L. When It Is Not about the Money: Social Comparison and Energy Conservation among Residents Who Do Not Pay for Electricity. Energy Res. Soc. Sci. 2019, 56, 101198. [Google Scholar] [CrossRef]
- McMakin, A.H.; Malone, E.L.; Lundgren, R.E. Motivating Residents to Conserve Energy without Financial Incentives. Environ. Behav. 2002, 34, 848–863. [Google Scholar] [CrossRef]
- Tiefenbeck, V.; Wörner, A.; Schöb, S.; Fleisch, E.; Staake, T. Real-Time Feedback Promotes Energy Conservation in the Absence of Volunteer Selection Bias and Monetary Incentives. Nat. Energy 2019, 4, 35–41. [Google Scholar] [CrossRef]
- Anderson, K.; Song, K.; Lee, S.; Krupka, E.; Lee, H.; Park, M. Longitudinal Analysis of Normative Energy Use Feedback on Dormitory Occupants. Appl. Energy 2017, 189, 623–639. [Google Scholar] [CrossRef]
- Meyers, E.; Souza, M. Social Comparison Nudges without Monetary Incentives: Evidence from Home Energy Reports. J. Environ. Econ. Manag. 2020, 101, 102315. [Google Scholar] [CrossRef]
- Delmas, M.A.; Lessem, N. Saving Power to Conserve Your Reputation? The Effectiveness of Private versus Public Information. J. Environ. Econ. Manag. 2014, 67, 353–370. [Google Scholar] [CrossRef] [Green Version]
- Alberts, G.; Gurguc, Z.; Koutroumpis, P.; Martin, R.; Muûls, M.; Napp, T. Competition and Norms: A Self-Defeating Combination? Energy Policy 2016, 96, 504–523. [Google Scholar] [CrossRef] [Green Version]
- McClelland, L.; Belsten, L. Promoting Energy Conservation in University Dormitories by Physical, Policy and Resident Behavior Changes. J. Environ. Syst. 1979, 9, 29–38. [Google Scholar] [CrossRef]
- Petersen, J.E.; Shunturov, V.; Janda, K.; Platt, G.; Weinberger, K. Dormitory Residents Reduce Electricity Consumption When Exposed to Real-time Visual Feedback and Incentives. Int. J. Sustain. High. Educ. 2007, 8, 16–33. [Google Scholar] [CrossRef]
- Delmas, M.A.; Fischlein, M.; Asensio, O.I. Information Strategies and Energy Conservation Behavior: A Meta-Analysis of Experimental Studies from 1975 to 2012. Energy Policy 2013, 61, 729–739. [Google Scholar] [CrossRef] [Green Version]
- Vine, D.; Buys, L.; Morris, P. The Effectiveness of Energy Feedback for Conservation and Peak Demand: A Literature Review. Open J. Energy Effic. 2013, 2, 7–15. [Google Scholar] [CrossRef] [Green Version]
- Seligman, C.; Darley, J.M. Feedback as a Means of Decreasing Residential Energy Consumption. J. Appl. Psychol. 1977, 62, 363. [Google Scholar] [CrossRef]
- Jorgensen, B.S.; Boulet, M.; Hoek, A.C. A Level-of-Analysis Issue in Resource Consumption and Environmental Behavior Research: A Theoretical and Empirical Contradiction. J. Environ. Manag. 2020, 260, 110154. [Google Scholar] [CrossRef]
- Khan, I. Household Factors and Electrical Peak Demand: A Review for Further Assessment. Adv. Build. Energy Res. 2021, 15, 409–441. [Google Scholar] [CrossRef]
- Liu, Y. Seasonal Relationship of Peak Demand and Energy Impacts of Energy Efficiency Measures—a Review of Evidence in the Electric Energy Efficiency Programmes. Energy Effic. 2016, 9, 1015–1035. [Google Scholar] [CrossRef]
- Azarova, V.; Cohen, J.J.; Kollmann, A.; Reichl, J. Reducing Household Electricity Consumption during Evening Peak Demand Times: Evidence from a Field Experiment. Energy Policy 2020, 144, 111657. [Google Scholar] [CrossRef]
- Heberlein, T.A.; Warriner, G.K. The Influence of Price and Attitude on Shifting Residential Electricity Consumption from On- to off-Peak Periods. J. Econ. Psychol. 1983, 4, 107–130. [Google Scholar] [CrossRef]
- Hobman, E.V.; Frederiks, E.R.; Stenner, K.; Meikle, S. Uptake and Usage of Cost-Reflective Electricity Pricing: Insights from Psychology and Behavioural Economics. Renew. Sustain. Energy Rev. 2016, 57, 455–467. [Google Scholar] [CrossRef] [Green Version]
- Luyben, P.D. A Parametric Analysis of Prompting Procedures to Encourage Electrical Energy Conservation. J. Environ. Syst. 1982, 12, 329–339. [Google Scholar] [CrossRef]
- Dunlap, R.E.; Liere, K.D.V.; Mertig, A.G.; Jones, R.E. New Trends in Measuring Environmental Attitudes: Measuring Endorsement of the New Ecological Paradigm: A Revised NEP Scale. J. Soc. Issues 2000, 56, 425–442. [Google Scholar] [CrossRef]
- Schwartz, S.H. Normative Influences on Altruism. In Advances in Experimental Social Psychology; Berkowitz, L., Ed.; Academic Press: Cambridge, MA, USA, 1977; Volume 10, pp. 221–279. [Google Scholar]
- Stern, P.C.; Dietz, T.; Abel, T.; Guagnano, G.A.; Kalof, L. A Value-Belief-Norm Theory of Support for Social Movements: The Case of Environmentalism. Hum. Ecol. Rev. 1999, 6, 81–97. [Google Scholar]
- Osbaldiston, R.; Schott, J.P. Environmental Sustainability and Behavioral Science: Meta-Analysis of Proenvironmental Behavior Experiments. Environ. Behav. 2012, 44, 257–299. [Google Scholar] [CrossRef]
- ClimateWorks Australia. Monash Demand Management Study: Final Report; ClimateWorks Australia: Melbourne, Australia, 2019. [Google Scholar]
- Keppel, G. Design and Analysis: A Researcher’s Handbook; Prentice-Hall, Inc.: Hoboken, NJ, USA, 1991. [Google Scholar]
- Cnaan, A.; Laird, N.M.; Slasor, P. Using the General Linear Mixed Model to Analyse Unbalanced Repeated Measures and Longitudinal Data. Stat. Med. 1997, 16, 2349–2380. [Google Scholar] [CrossRef]
- Gosho, M.; Maruo, K. Effect of Heteroscedasticity between Treatment Groups on Mixed-Effects Models for Repeated Measures. Pharm. Stat. 2018, 17, 578–592. [Google Scholar] [CrossRef]
- Johnson, D.; Horton, E.; Mulcahy, R.; Foth, M. Gamification and Serious Games within the Domain of Domestic Energy Consumption: A Systematic Review. Renew. Sustain. Energy Rev. 2017, 73, 249–264. [Google Scholar] [CrossRef] [Green Version]
- Morganti, L.; Pallavicini, F.; Cadel, E.; Candelieri, A.; Archetti, F.; Mantovani, F. Gaming for Earth: Serious Games and Gamification to Engage Consumers in pro-Environmental Behaviours for Energy Efficiency. Energy Res. Soc. Sci. 2017, 29, 95–102. [Google Scholar] [CrossRef]
- Ramsay, L.; Pett, J. Hard to Reach and Hard to Help: Bringing Energy Efficiency to Elusive Audiences. In Proceedings of the ECEEE Summer Study, St Raphael, France, 2–7 June 2003. [Google Scholar]
- Ashby, K.; Rotmann, S.; Mundaca, L.; Ambrose, A. HTR Characterisation: Hard-to-Reach Energy Users; User-Centred Energy Systems Technology Collaboration Programme IAE; Lund University: Lund, Sweden, 2020. [Google Scholar] [CrossRef]
- Brehm, J.W. A Theory of Psychological Reactance; Academic Press: Oxford, UK, 1966. [Google Scholar]
- Lehner, M.; Mont, O.; Heiskanen, E. Nudging—A Promising Tool for Sustainable Consumption Behaviour? J. Clean. Prod. 2016, 134, 166–177. [Google Scholar] [CrossRef]
- Froehlich, J. Promoting Energy Efficient Behaviors in the Home through Feedback: The Role of Human-Computer Interaction. In Proceedings of the Human-Computer Interface (HCI) International Conference, San Diego, CA, USA, 19–24 July 2009. [Google Scholar]
- Graml, T.; Loock, C.-M.; Baeriswyl, M.; Staake, T. Improving Residential Energy Consumption at Large Using Persuasive Systems. In Proceedings of the 19th European Conference on Information Systems, Helsinki, Finland, 9–11 June 2011. [Google Scholar]
- Schultz, P.W. Strategies for Promoting Proenvironmental Behavior: Lots of Tools but Few Instructions. Eur. Psychol. 2014, 19, 107–117. [Google Scholar] [CrossRef]
- Tetlow, R.M.; Beaman, C.P.; Elmualim, A.A.; Couling, K. Simple Prompts Reduce Inadvertent Energy Consumption from Lighting in Office Buildings. Build. Environ. 2014, 81, 234–242. [Google Scholar] [CrossRef]
- Chui, W.S.; Wai, C.W.; Ahmad, R. Local and Global Messages for Prompting Energy Conservation Behaviour: An Experimental Study in University. J. Teknol. 2015, 74, 87–92. [Google Scholar]
- Gyamfi, S.; Krumdieck, S.; Urmee, T. Residential Peak Electricity Demand Response—Highlights of Some Behavioural Issues. Renew. Sustain. Energy Rev. 2013, 25, 71–77. [Google Scholar] [CrossRef] [Green Version]
- Ito, K.; Ida, T.; Tanaka, M. Moral Suasion and Economic Incentives: Field Experimental Evidence from Energy Demand. Am. Econ. J. Econ. Policy 2018, 10, 240–267. [Google Scholar] [CrossRef] [Green Version]
- Faulkner, N.; Borg, K.; Bragge, P.; Curtis, J.; Ghafoori, E.; Goodwin, D.; Jorgensen, B.S.; Jungbluth, L.; Kneebone, S.; Smith, L.; et al. The INSPIRE Framework: How Public Administrators Can Increase Compliance with Written Requests Using Behavioral Techniques. Public Adm. Rev. 2019, 79, 125–135. [Google Scholar] [CrossRef]
- Ajzen, I. The Theory of Planned Behavior. Organ. Behav. Hum. Decis. Process. 1991, 50, 179–211. [Google Scholar] [CrossRef]

| Variable | Control % | Treatment % | |
|---|---|---|---|
| Age | 18–24 | 47 | 53 |
| 25–34 | 33 | 67 | |
| Full-time study | Full-time | 45 | 55 |
| Years of study completed | One | 41 | 59 |
| Two | 65 | 35 | |
| Three | 39 | 61 | |
| Four | 29 | 71 | |
| Five or more | 33 | 67 | |
| Gender | Male | 48 | 52 |
| Female | 43 | 57 | |
| Variable | Scale Questions | Cronbach’s α |
|---|---|---|
| Behavioural Intention (BI) |
| 0.85 |
| Personal Norm (PN) |
| 0.89 |
| ||
| ||
| ||
| [7-point rating scale from strongly agree to strongly disagree.] | ||
| Acceptance of Responsibility (AR) |
| 0.91 |
| Awareness of Consequences (AC) |
| 0.68 |
| [5-point rating scale from definitely true to definitely false.] | ||
| Environmental Concern (EC) |
| 0.77 |
| [5-point rating scale from strongly agree to strongly disagree.] | ||
| Environmental Indifference (EI) |
| 0.81 |
| Variable | Mann–Whitney U-Test p-Value |
|---|---|
| Behavioural Intentions (BI) | 0.234 |
| Personal Norm (PN) | 0.482 |
| Acceptance of Responsibility (AR) | 0.234 |
| Awareness of Consequences (AC) | 0.430 |
| Environmental Concern (EC) | 0.694 |
| Environmental Indifference (EI) | 0.438 |
| Variable | Numerator df | Denominator df | F | Sig. |
|---|---|---|---|---|
| Intercept | 1 | 121.214 | 15.548 | 0.000 |
| Group | 1 | 121.373 | 0.235 | 0.629 |
| Time | 5 | 127.000 | 4.165 | 0.002 |
| Group × Time | 5 | 127.000 | 2.373 | 0.043 |
| Intentions | 1 | 121.000 | 1.787 | 0.184 |
| PN | 1 | 121.000 | 2.295 | 0.132 |
| AR | 1 | 121.000 | 0.359 | 0.550 |
| AC | 1 | 121.000 | 0.383 | 0.537 |
| EC | 1 | 121.000 | 2.664 | 0.105 |
| EI | 1 | 121.000 | 7.598 | 0.007 |
| Group | Period | Mean Difference | Std. Error | df | p | 95% CI | |
|---|---|---|---|---|---|---|---|
| Lower Bound | Upper Bound | ||||||
| Control | 26 April–2 May | −0.045 | 0.068 | 127 | 0.972 | −0.223 | 0.133 |
| 3 May–7 May | −0.100 | 0.094 | 127 | 0.822 | −0.345 | 0.146 | |
| 8 May–14 May | 0.113 | 0.088 | 127 | 0.679 | −0.117 | 0.343 | |
| 15 May–21 May | −0.133 | 0.088 | 127 | 0.512 | −0.362 | 0.097 | |
| 21 May–end | −0.099 | 0.085 | 127 | 0.755 | −0.321 | 0.122 | |
| Treatment | 26 April–2 May | −0.269 | 0.060 | 127 | 0.000 | −0.424 | −0.113 |
| 3 May–7 May | −0.183 | 0.083 | 127 | 0.135 | −0.398 | 0.032 | |
| 8 May–14 May | −0.211 | 0.077 | 127 | 0.036 | −0.413 | −0.009 | |
| 15 May–21 May | −0.286 | 0.077 | 127 | 0.002 | −0.486 | −0.085 | |
| 21 May–end | −0.220 | 0.074 | 127 | 0.019 | −0.414 | −0.026 | |
| Treatment Simple Contrast | Contrast Estimate | Std. Error | Bonferroni Sig. |
|---|---|---|---|
| 8-h notification email vs. Control | −0.375 | 0.119 | 0.003 |
| 24 + 2-h notification email with reminder vs. Control | −0.277 | 0.118 | 0.058 |
Publisher’s Note: MDPI stays neutral with regard to jurisdictional claims in published maps and institutional affiliations. |
© 2021 by the authors. Licensee MDPI, Basel, Switzerland. This article is an open access article distributed under the terms and conditions of the Creative Commons Attribution (CC BY) license (https://creativecommons.org/licenses/by/4.0/).
Share and Cite
Jorgensen, B.S.; Fumei, S.; Byrne, G. Reducing Peak Energy Demand among Residents Who Are Not Billed for Their Electricity Consumption: Experimental Evaluation of Behaviour Change Interventions in a University Setting. Int. J. Environ. Res. Public Health 2021, 18, 8406. https://doi.org/10.3390/ijerph18168406
Jorgensen BS, Fumei S, Byrne G. Reducing Peak Energy Demand among Residents Who Are Not Billed for Their Electricity Consumption: Experimental Evaluation of Behaviour Change Interventions in a University Setting. International Journal of Environmental Research and Public Health. 2021; 18(16):8406. https://doi.org/10.3390/ijerph18168406
Chicago/Turabian StyleJorgensen, Bradley S., Sarah Fumei, and Graeme Byrne. 2021. "Reducing Peak Energy Demand among Residents Who Are Not Billed for Their Electricity Consumption: Experimental Evaluation of Behaviour Change Interventions in a University Setting" International Journal of Environmental Research and Public Health 18, no. 16: 8406. https://doi.org/10.3390/ijerph18168406
APA StyleJorgensen, B. S., Fumei, S., & Byrne, G. (2021). Reducing Peak Energy Demand among Residents Who Are Not Billed for Their Electricity Consumption: Experimental Evaluation of Behaviour Change Interventions in a University Setting. International Journal of Environmental Research and Public Health, 18(16), 8406. https://doi.org/10.3390/ijerph18168406