Rethinking the Fertility Transition in Rural Aragón (Spain) Using Height Data
Abstract
1. Introduction
2. Area, Data and Methods
2.1. Area
2.2. Data
2.3. Methods
2.4. Fertility Control Using Stopping
3. Results
3.1. The Pioneers of the Fertility Transition
Demographic factors such as the fertility rate, infant mortality or the type of household (in particular, the ratio between adult women and dependent individuals within the household), decisively condition the availability of women for paid employment: the number of hours, the times of their life cycle and the type of employment in which they can occupy. And it also explains the relationship between the massive diffusion of contraceptive means in the second half of the 20th century and the fall in fertility and the continued increase in the female activity rate in all developed countries.[84]
3.2. The Effect of the Fertility Transition on the Biological Well-Being of Offspring
3.3. Family Group
4. Discussion
Limitations
5. Conclusions
Author Contributions
Funding
Institutional Review Board Statement
Informed Consent Statement
Data Availability Statement
Acknowledgments
Conflicts of Interest
Appendix A

| 1870–1969 | 1870–1899 | 1900–1919 | 1920–1939 | 1940–1969 | |
|---|---|---|---|---|---|
| Short | 56.6 | 44.7 | 56.6 | 57.2 | 62.3 |
| Medium | 56.4 | 44.4 | 55.7 | 62.7 | 50.8 |
| Tall | 51.3 | 32.3 | 51.4 | 55.3 | 52.9 |
| 1870–1959 | 1870–1899 | 1900–1929 | 1930–1959 | |
|---|---|---|---|---|
| Short | 26.4 | 25.5 | 26.1 | 27.2 |
| Medium | 26.5 | 25.9 | 26.4 | 26.9 |
| Tall | 26.1 | 25.0 | 25.9 | 26.8 |
| Controllers | 1890–1969 | 1890–1909 | 1910–1929 | 1930–1949 | 1950–1969 |
|---|---|---|---|---|---|
| 0–2 people | 43.6 | 38.8 | 44.3 | 43.7 | 44.1 |
| 3–5 people | 43.7 | 53.1 | 40.1 | 44.0 | 44.1 |
| 6 or more people | 12.7 | 8.1 | 15.6 | 12.3 | 11.8 |
| Others | 1890–1969 | 1890–1909 | 1910–1929 | 1930–1949 | 1950–1969 |
| 0–2 people | 44.5 | 54.2 | 43.3 | 43.2 | 35.3 |
| 3–5 people | 45.0 | 40.4 | 46.1 | 43.8 | 51.9 |
| 6 or more people | 10.5 | 5.4 | 10.6 | 13.0 | 12.8 |
| Decade | Observation | Average | Standard Deviation | 95% Confidence Interval | |
|---|---|---|---|---|---|
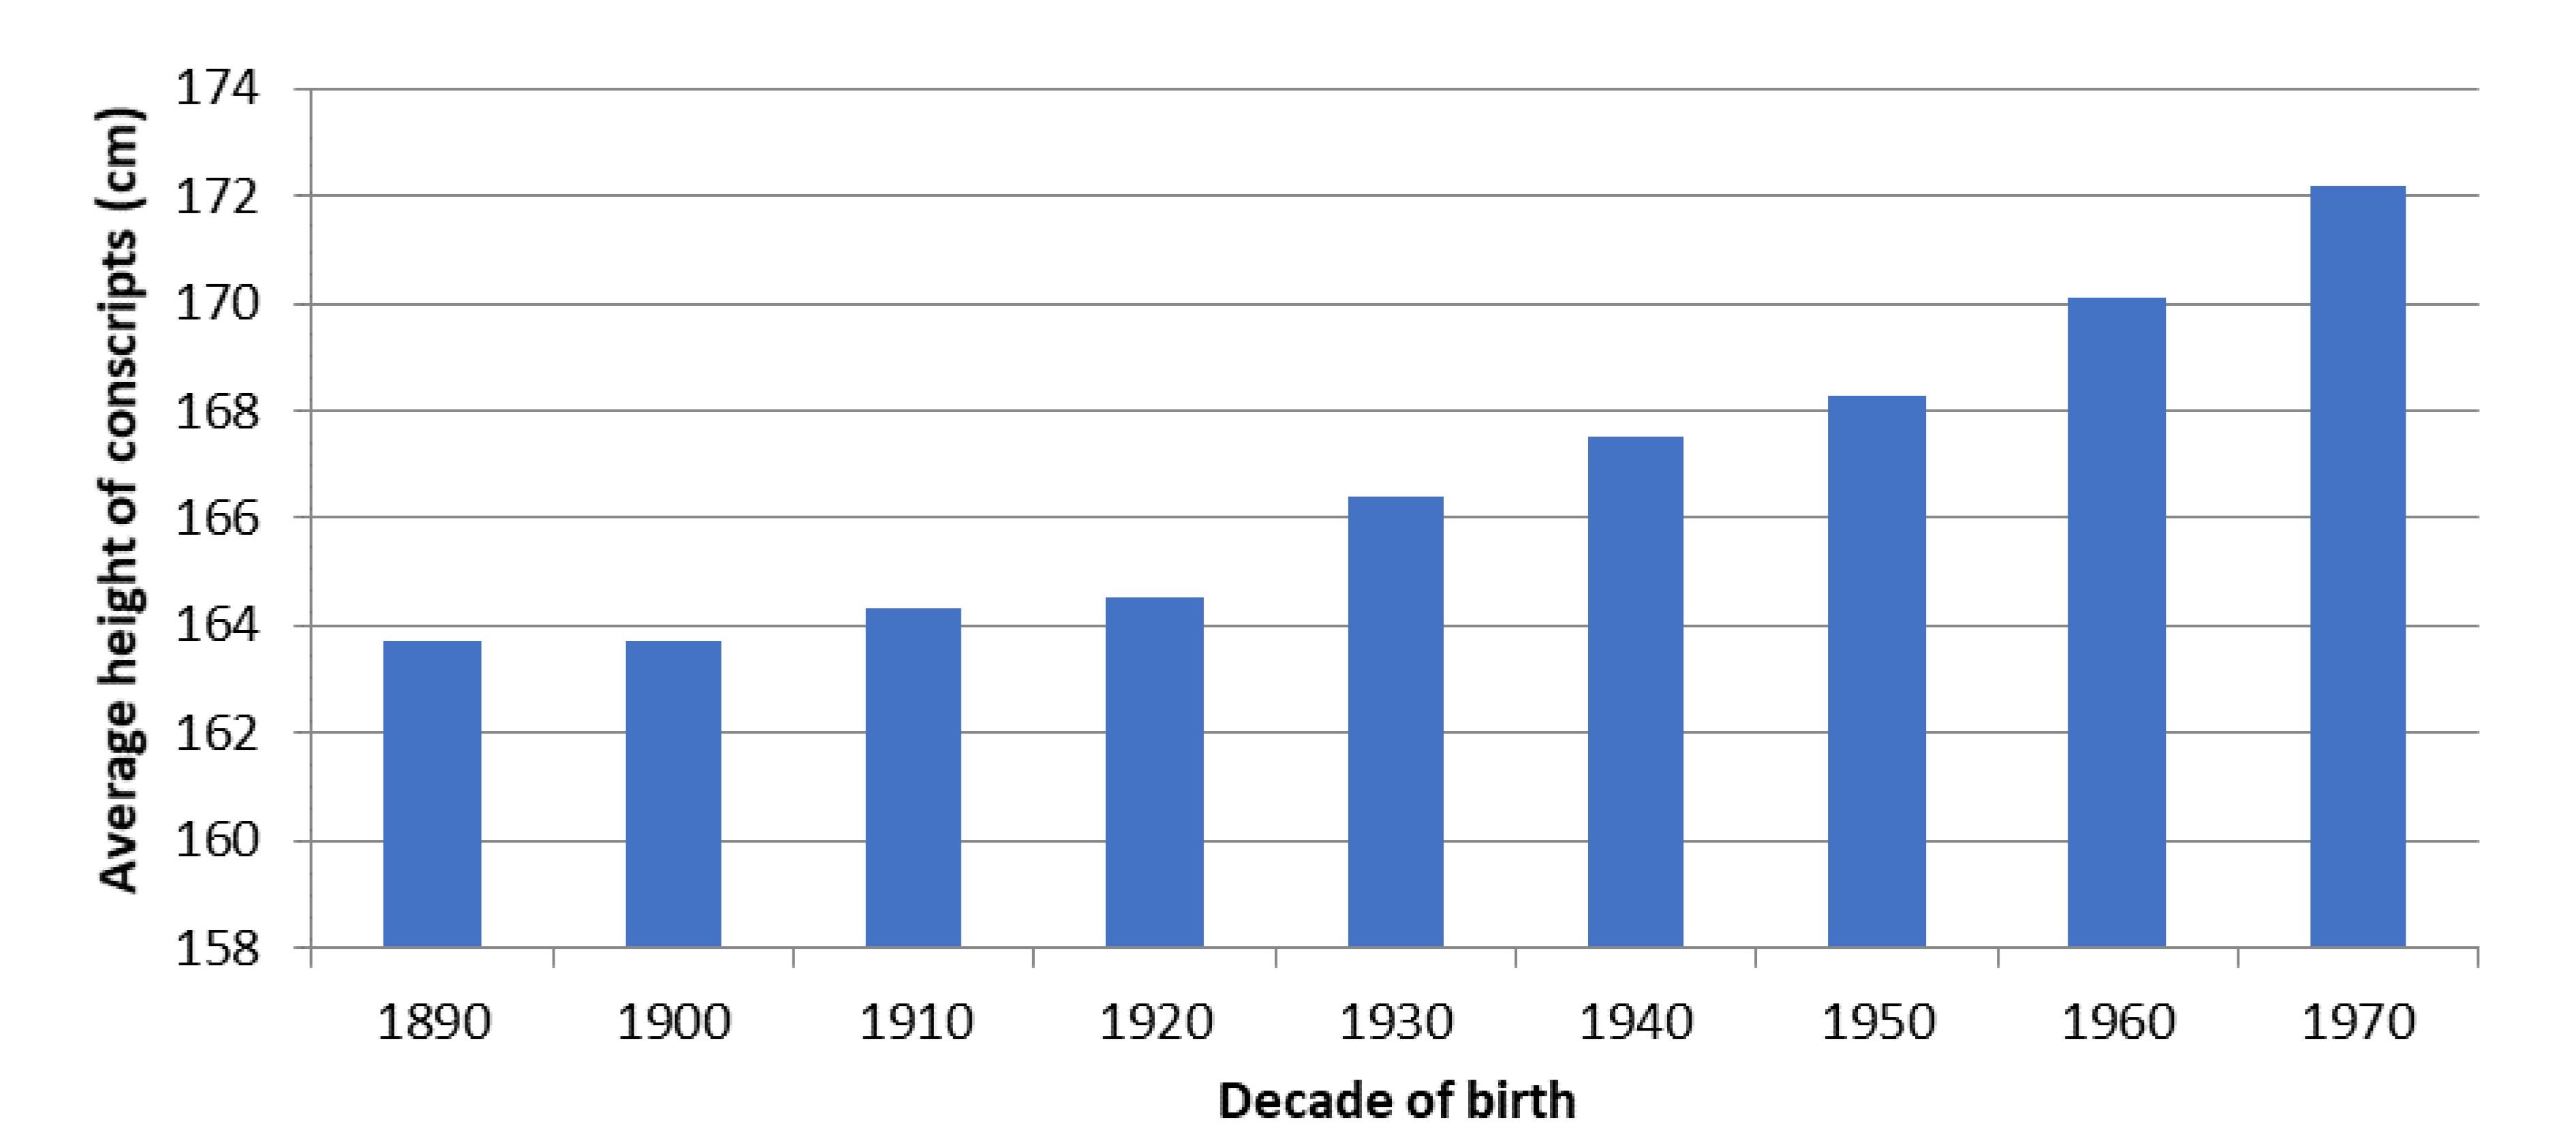
| 1890 | 113 | 163.7 | 0.5 | 162.7 | 164.8 |
| 1900 | 312 | 163.7 | 0.3 | 163.1 | 164.4 |
| 1910 | 300 | 164.3 | 0.4 | 163.6 | 165.1 |
| 1920 | 561 | 164.5 | 0.3 | 164.0 | 165.0 |
| 1930 | 463 | 166.4 | 0.3 | 166.0 | 167.0 |
| 1940 | 386 | 167.5 | 0.3 | 167.0 | 168.1 |
| 1950 | 251 | 168.3 | 0.4 | 167.6 | 169.1 |
| 1960 | 113 | 170.1 | 0.6 | 169.0 | 171.3 |
| 1970 | 11 | 172.2 | 2.3 | 167.2 | 177.4 |
| Controllers | Others | |||||||||
|---|---|---|---|---|---|---|---|---|---|---|
| Decade | Observation | Average | Standard Deviation | 95% Confidence Interval | Observation | Average | Standard Deviation | 95% Confidence Interval | ||
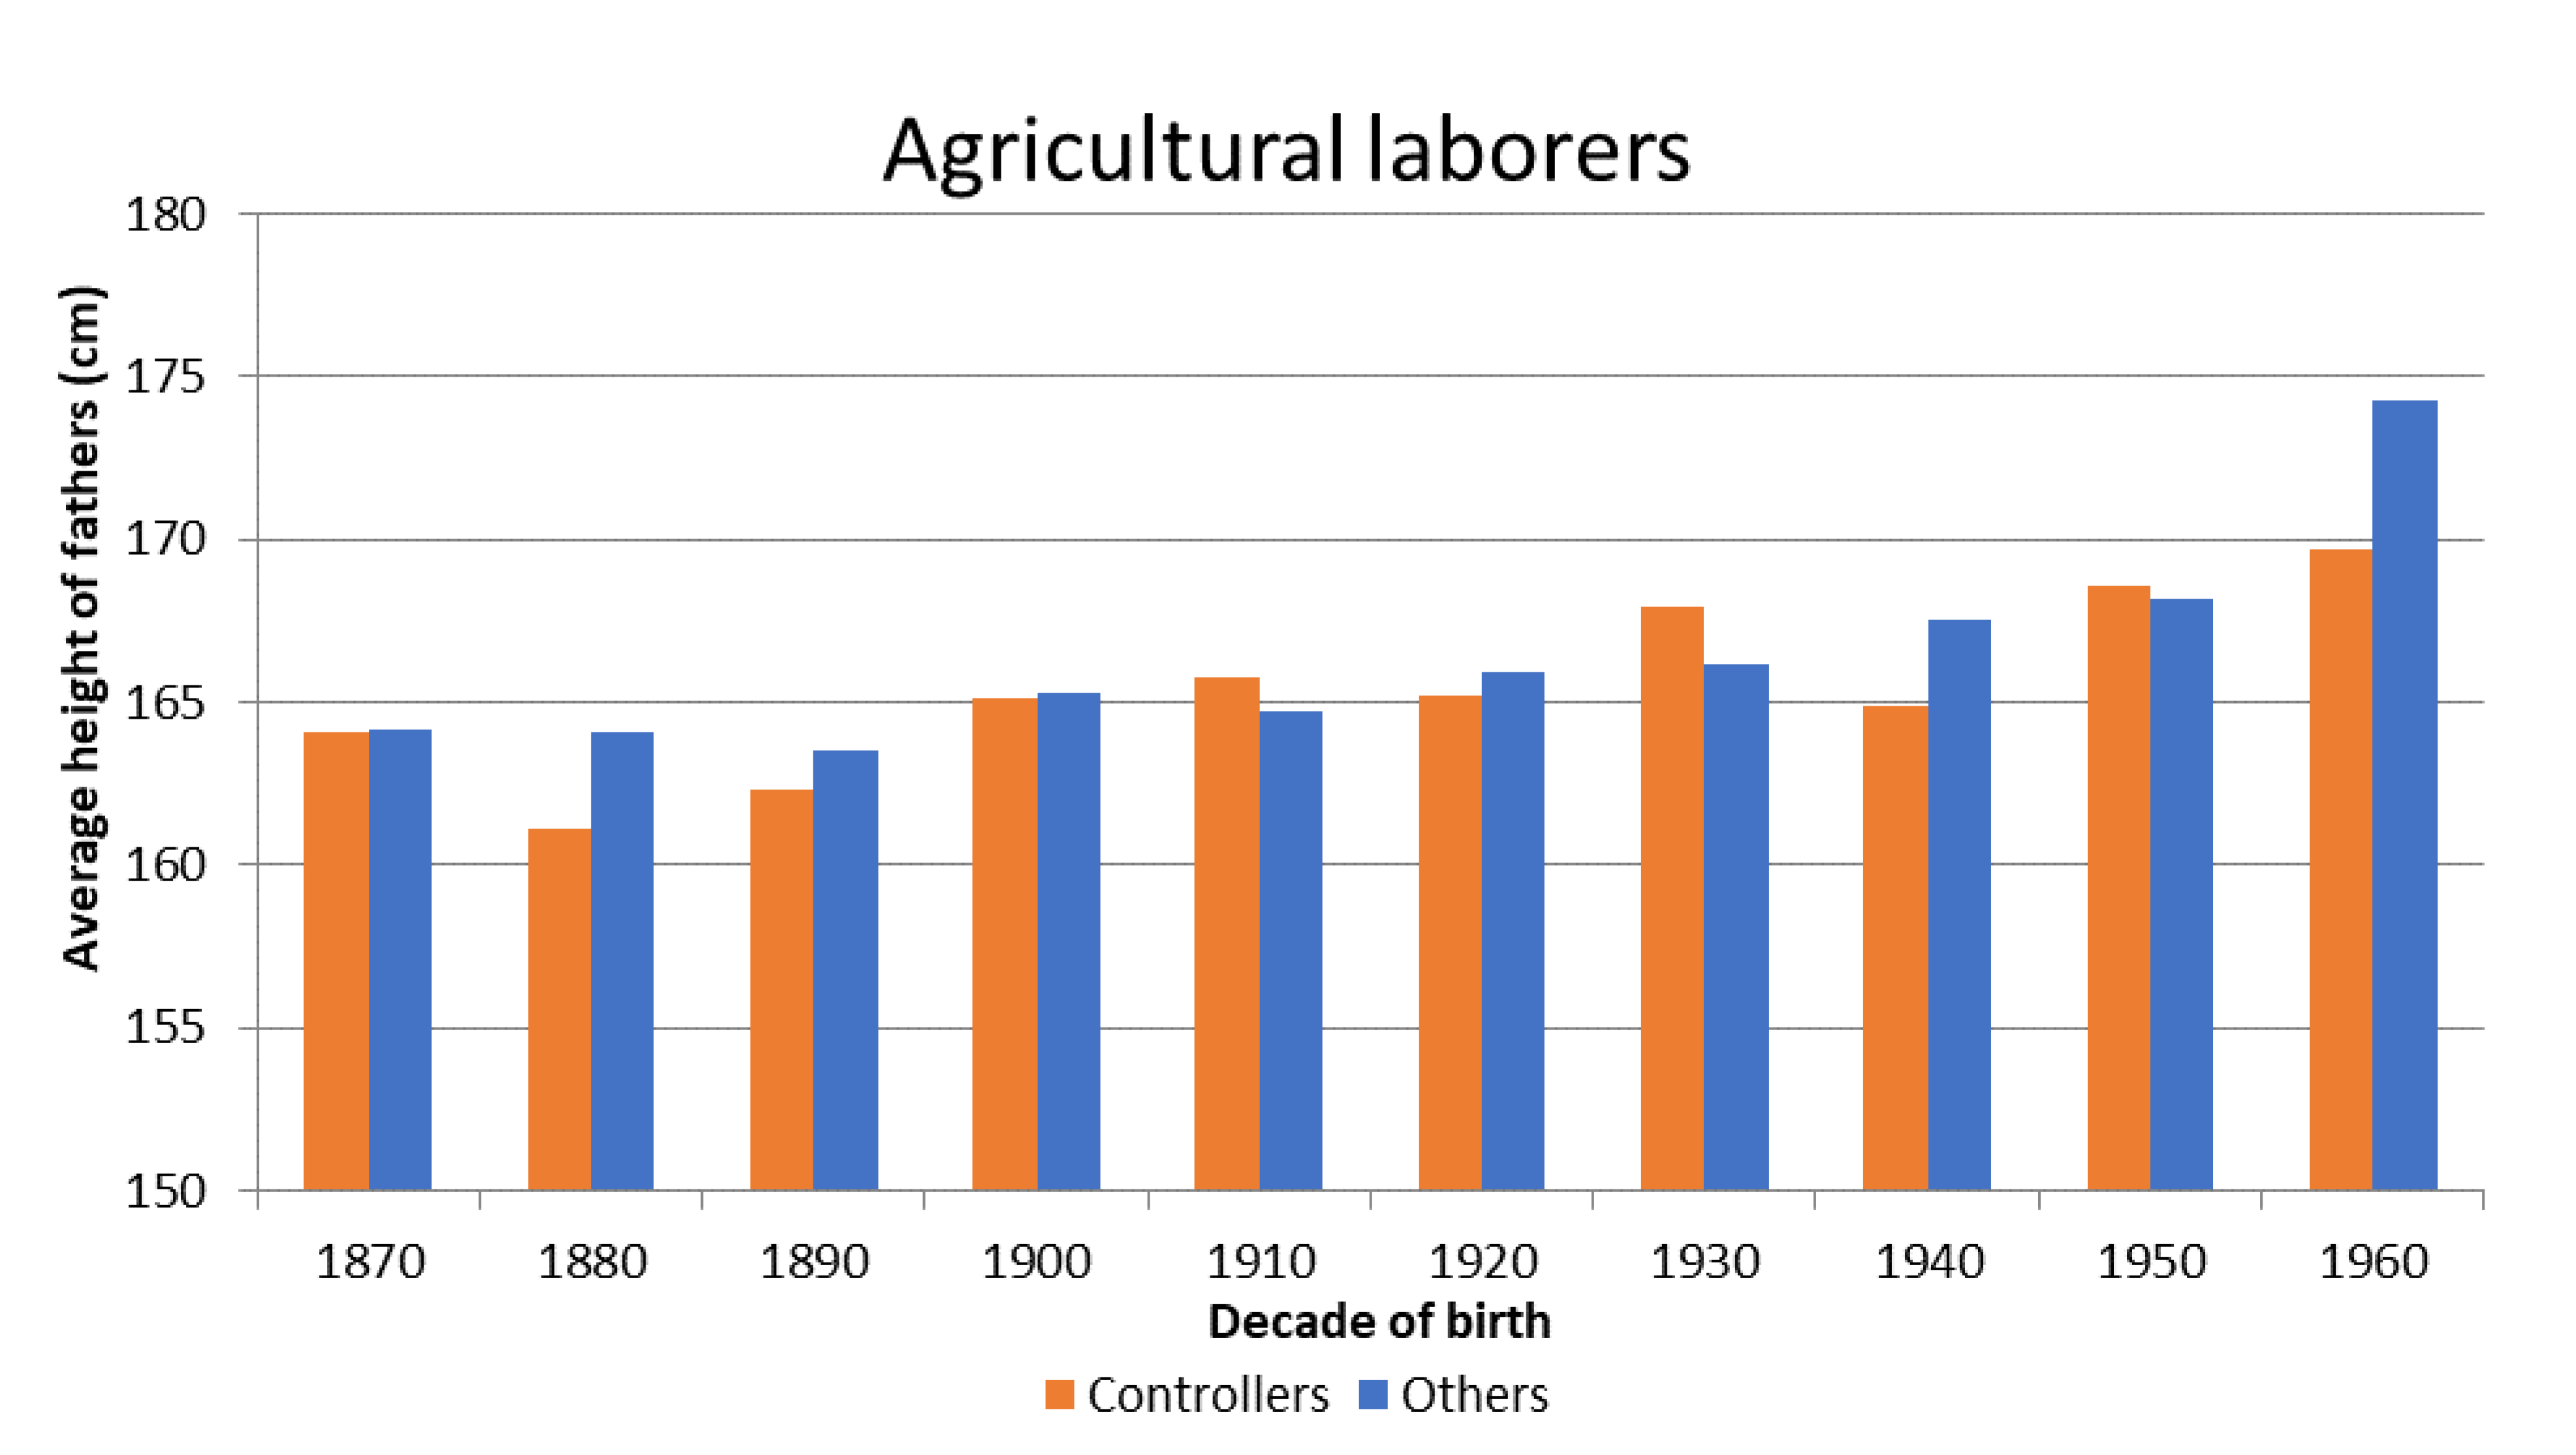
| 1870 | 4 | 164.1 | 1.6 | 158.9 | 169.4 | 11 | 164.2 | 1.1 | 161.8 | 166.6 |
| 1880 | 8 | 161.1 | 1.8 | 156.8 | 165.4 | 10 | 164.1 | 2.5 | 158.6 | 169.7 |
| 1890 | 16 | 162.3 | 1.5 | 159.2 | 165.4 | 6 | 163.5 | 1.9 | 158.7 | 168.4 |
| 1900 | 48 | 165.1 | 0.8 | 163.5 | 166.7 | 19 | 165.3 | 1.5 | 162.3 | 168.5 |
| 1910 | 23 | 165.8 | 1.3 | 163.1 | 168.6 | 28 | 164.7 | 1.2 | 162.3 | 167.2 |
| 1920 | 63 | 165.2 | 0.6 | 164.1 | 166.3 | 39 | 165.9 | 1.1 | 163.7 | 168.1 |
| 1930 | 44 | 167.9 | 0.9 | 166.1 | 169.8 | 32 | 166.2 | 0.9 | 164.4 | 168.0 |
| 1940 | 19 | 164.9 | 1.0 | 162.7 | 167.1 | 25 | 167.5 | 0.9 | 165.5 | 169.4 |
| 1950 | 23 | 168.6 | 1.1 | 166.4 | 170.8 | 22 | 168.2 | 1.1 | 165.8 | 170.6 |
| 1960 | 10 | 169.7 | 1.7 | 165.8 | 173.6 | 3 | 174.3 | 2.3 | 164.3 | 184.3 |
| Controllers | Others | |||||||||
|---|---|---|---|---|---|---|---|---|---|---|
| Decade | Observation | Average | Standard Deviation | 95% Confidence Interval | Observation | Average | Standard Deviation | 95% Confidence Interval | ||
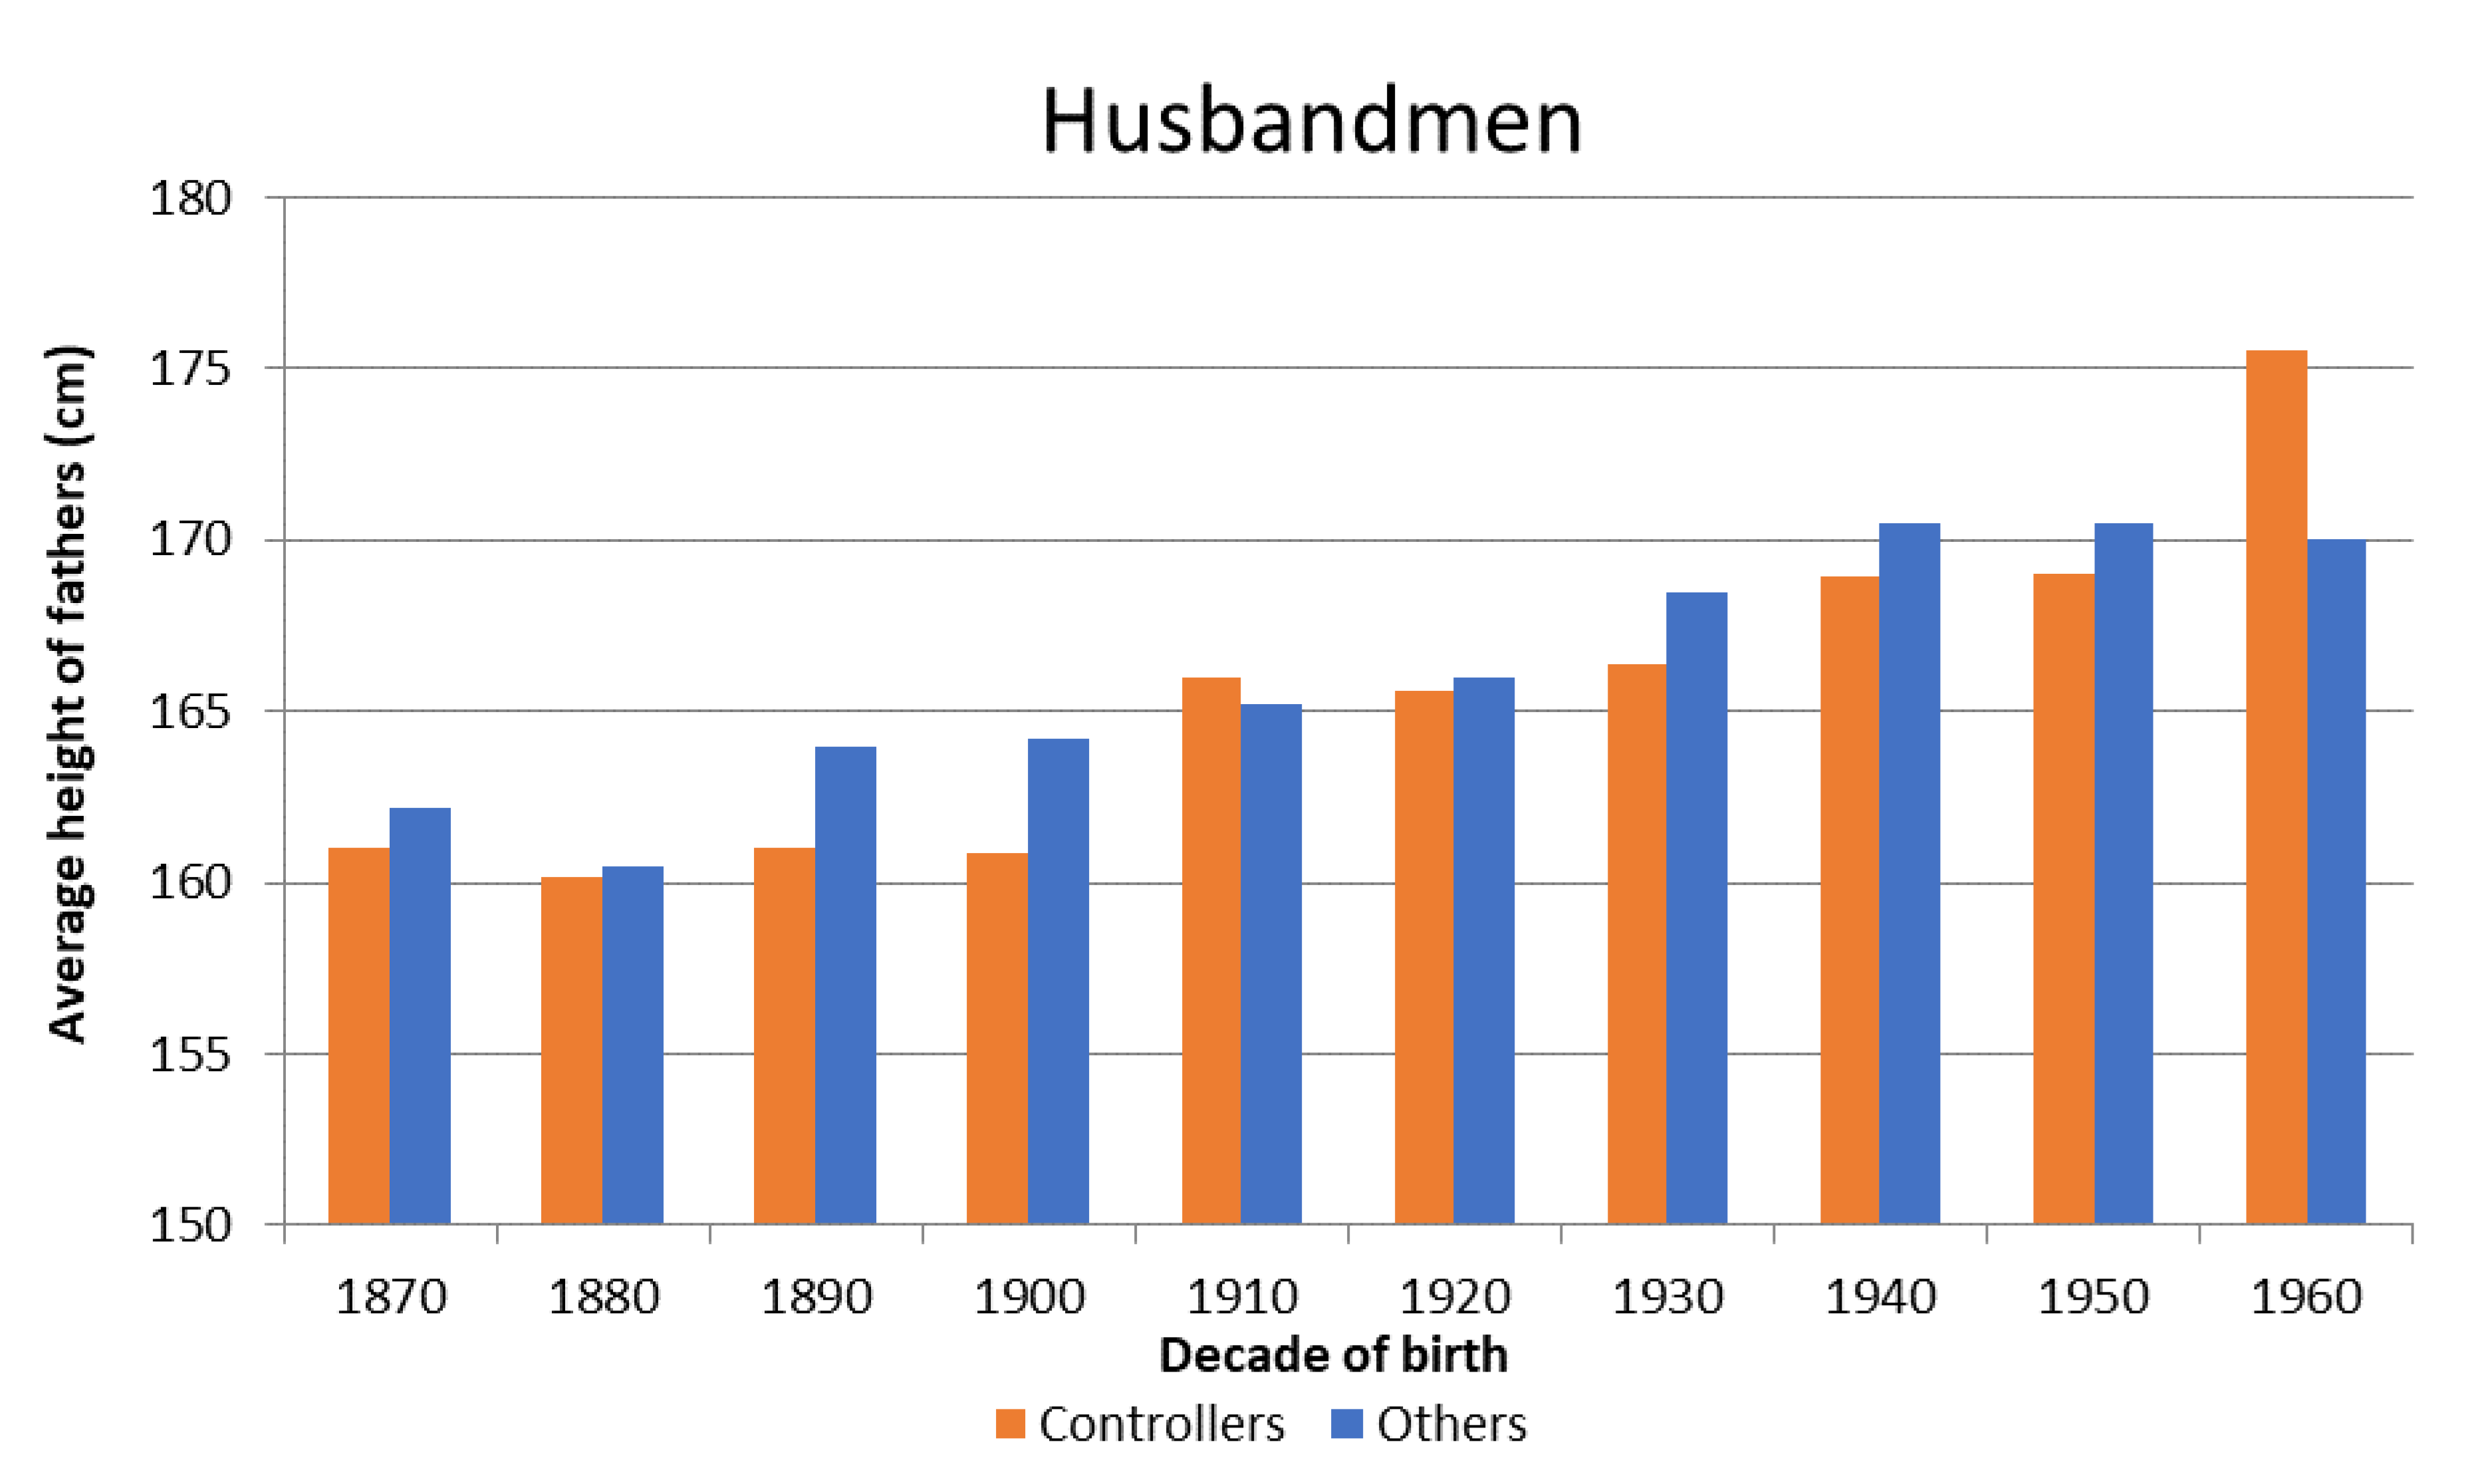
| 1870 | - | 161.0 | - | - | - | 7 | 162.2 | 2.1 | 157.1 | 167.3 |
| 1880 | 2 | 160.2 | 0.2 | 157.1 | 163.4 | - | 160.5 | - | - | - |
| 1890 | - | 161.0 | - | - | - | - | 164.0 | - | - | - |
| 1900 | 8 | 160.9 | 0.6 | 159.5 | 162.3 | 12 | 164.2 | 1.1 | 161.8 | 166.7 |
| 1910 | 11 | 166.0 | 2.1 | 161.3 | 170.7 | 16 | 165.2 | 1.9 | 161.3 | 169.1 |
| 1920 | 29 | 165.6 | 1.0 | 163.7 | 167.6 | 15 | 166.0 | 1.6 | 162.6 | 169.4 |
| 1930 | 32 | 166.4 | 1.0 | 164.4 | 168.5 | 17 | 168.5 | 1.3 | 165.8 | 171.3 |
| 1940 | 20 | 168.9 | 1.0 | 166.8 | 171.1 | 18 | 170.5 | 1.2 | 167.9 | 173.0 |
| 1950 | 14 | 169.0 | 1.0 | 166.8 | 171.3 | 8 | 170.5 | 1.8 | 166.1 | 174.8 |
| 1960 | 4 | 175.5 | 2.3 | 168.1 | 182.9 | 7 | 170.0 | 1.5 | 166.2 | 173.8 |
| Controllers | Others | |||||||||
|---|---|---|---|---|---|---|---|---|---|---|
| Decade | Observation | Average | Standard Deviation | 95% Confidence Interval | Observation | Average | Standard Deviation | 95% Confidence Interval | ||
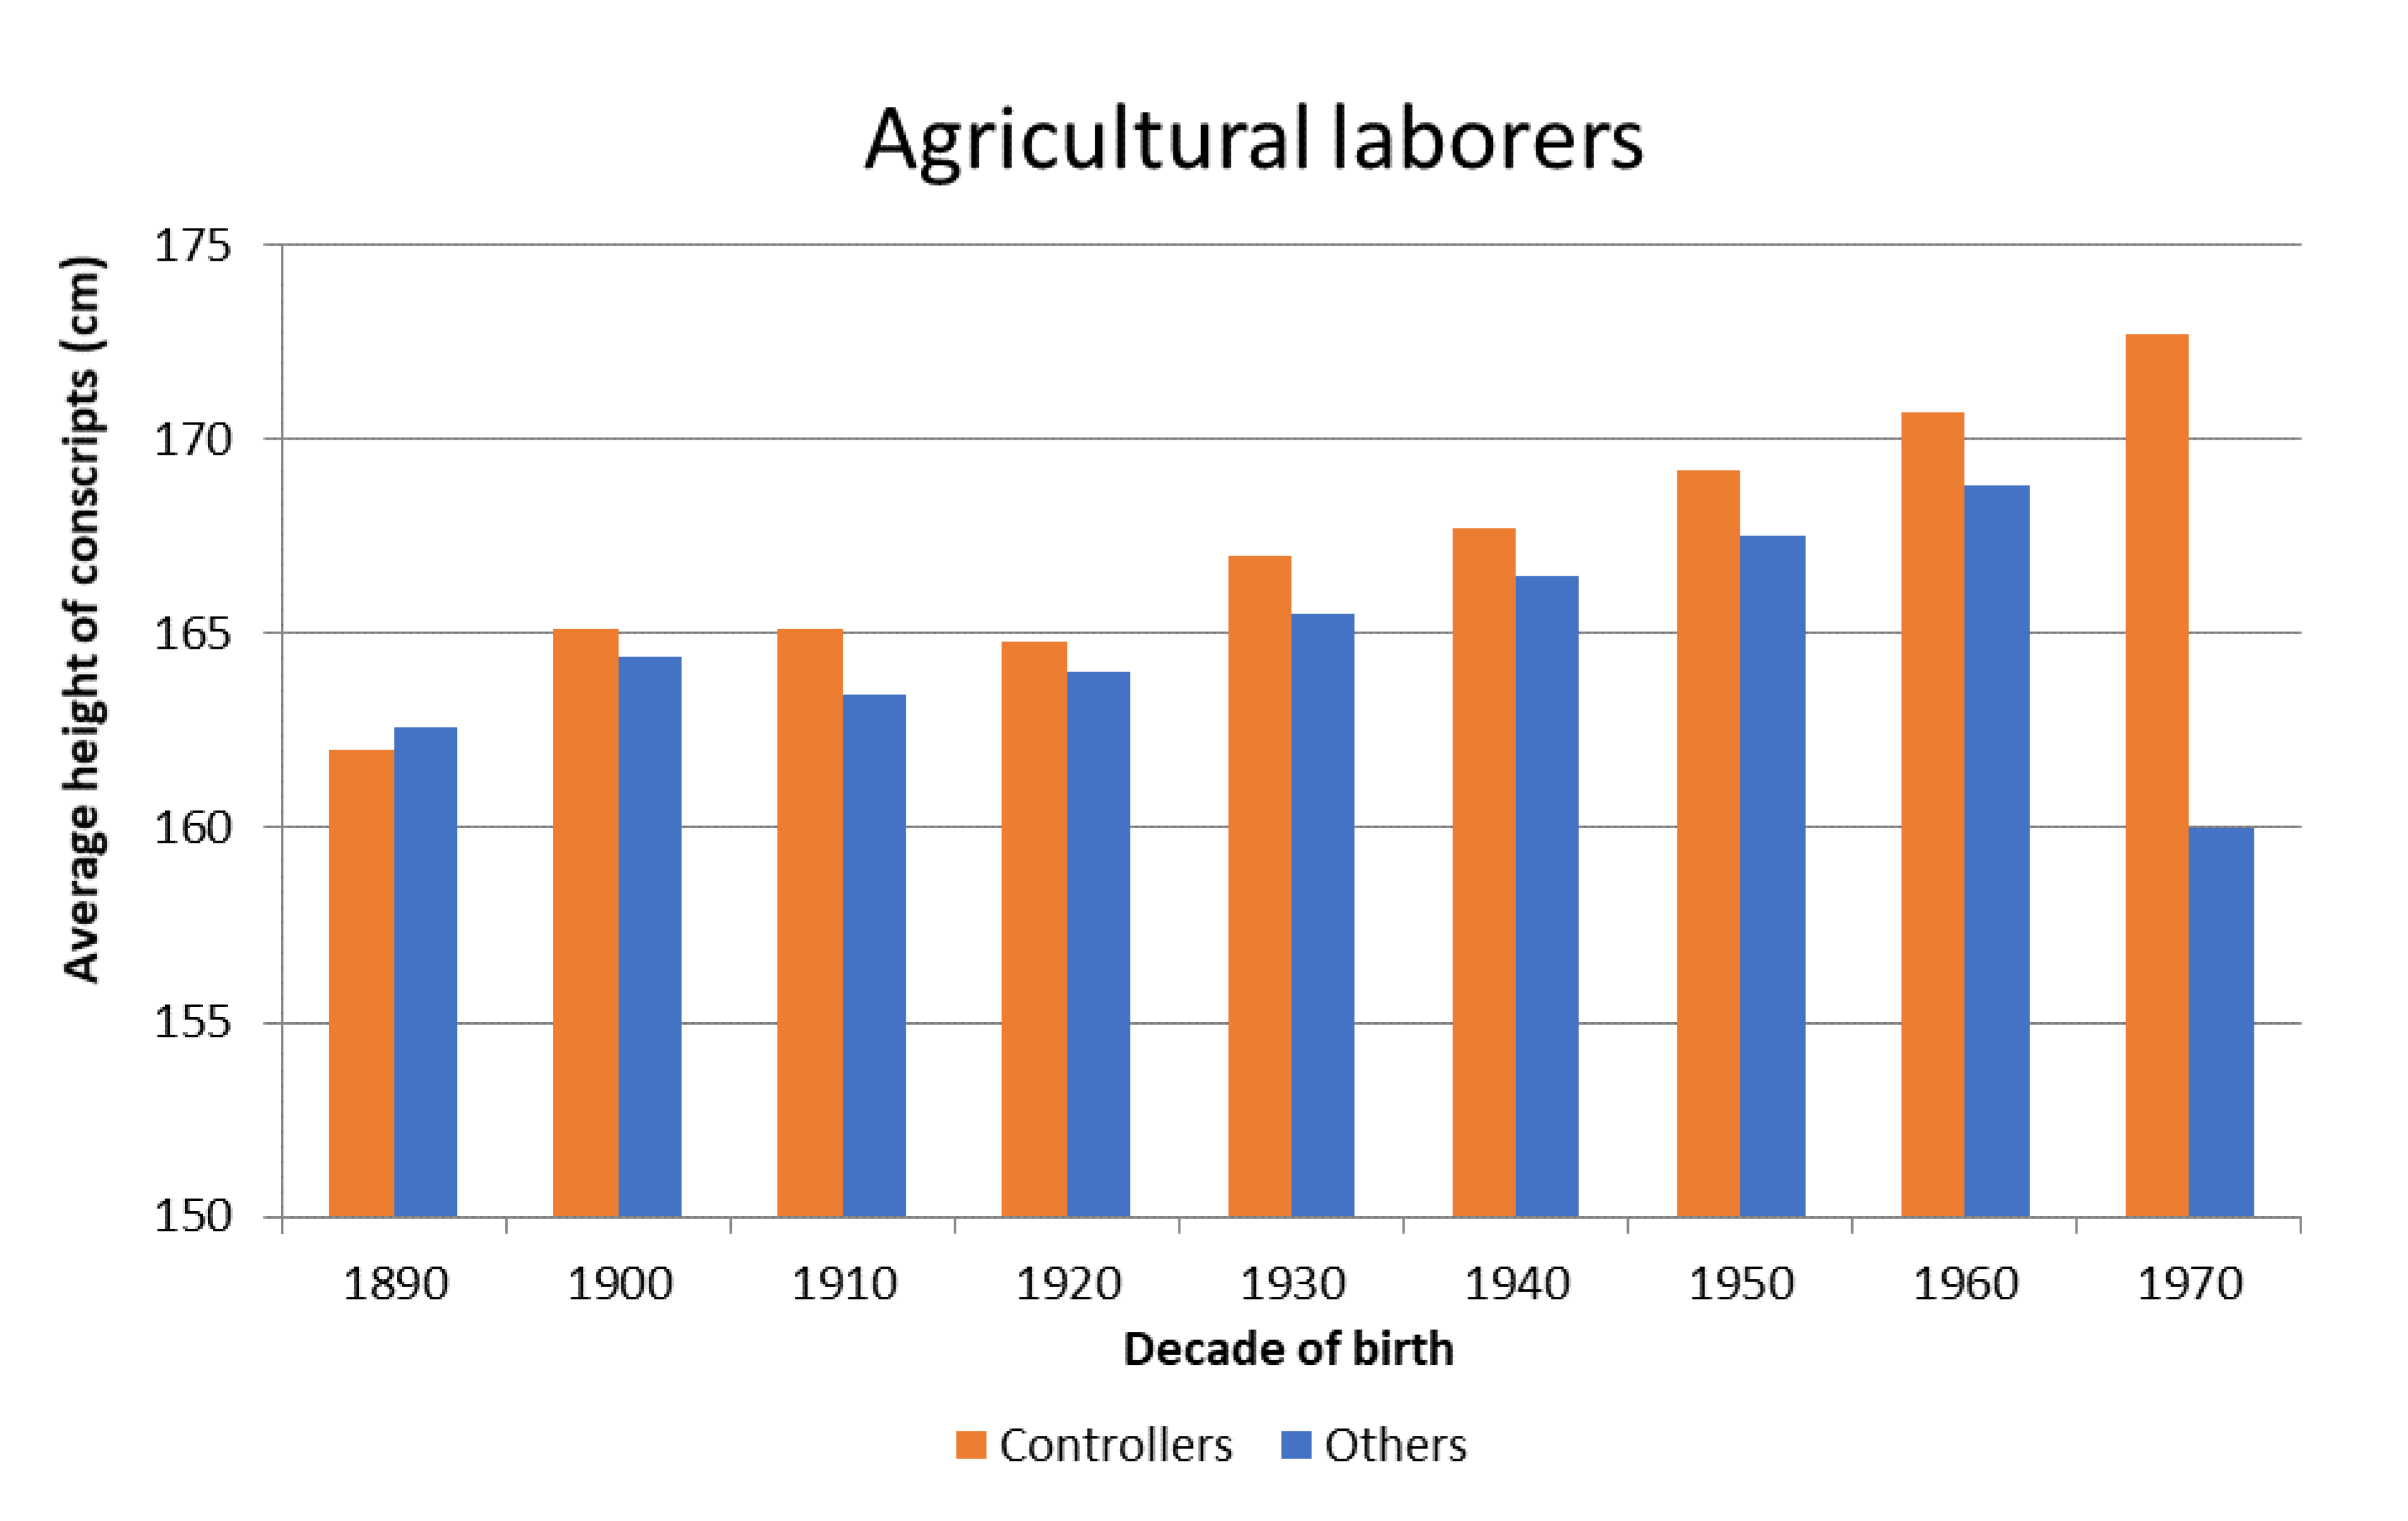
| 1890 | 6 | 162.0 | 2.5 | 155.7 | 168.4 | 53 | 162.6 | 0.8 | 161.0 | 164.2 |
| 1900 | 19 | 165.1 | 1.2 | 162.6 | 167.6 | 133 | 164.4 | 0.5 | 163.3 | 165.5 |
| 1910 | 28 | 165.1 | 1.2 | 162.7 | 167.5 | 123 | 163.4 | 0.6 | 162.1 | 164.7 |
| 1920 | 88 | 164.8 | 0.7 | 163.4 | 166.3 | 173 | 164.0 | 0.5 | 163.0 | 164.9 |
| 1930 | 104 | 167.0 | 0.5 | 166.0 | 168.1 | 147 | 165.5 | 0.5 | 164.4 | 166.6 |
| 1940 | 82 | 167.7 | 0.7 | 166.3 | 169.2 | 146 | 166.5 | 0.5 | 165.5 | 167.5 |
| 1950 | 56 | 169.2 | 0.8 | 167.5 | 170.9 | 88 | 167.5 | 0.7 | 166.1 | 168.8 |
| 1960 | 26 | 170.7 | 1.4 | 167.9 | 173.6 | 35 | 168.8 | 1.0 | 166.7 | 170.9 |
| 1970 | 4 | 172.7 | 5.0 | 156.7 | 188.7 | 1 | 160.0 | - | - | - |
| Controllers | Others | |||||||||
|---|---|---|---|---|---|---|---|---|---|---|
| Decade | Observation | Average | Standard Deviation | 95% Confidence Interval | Observation | Average | Standard Deviation | 95% Confidence Interval | ||
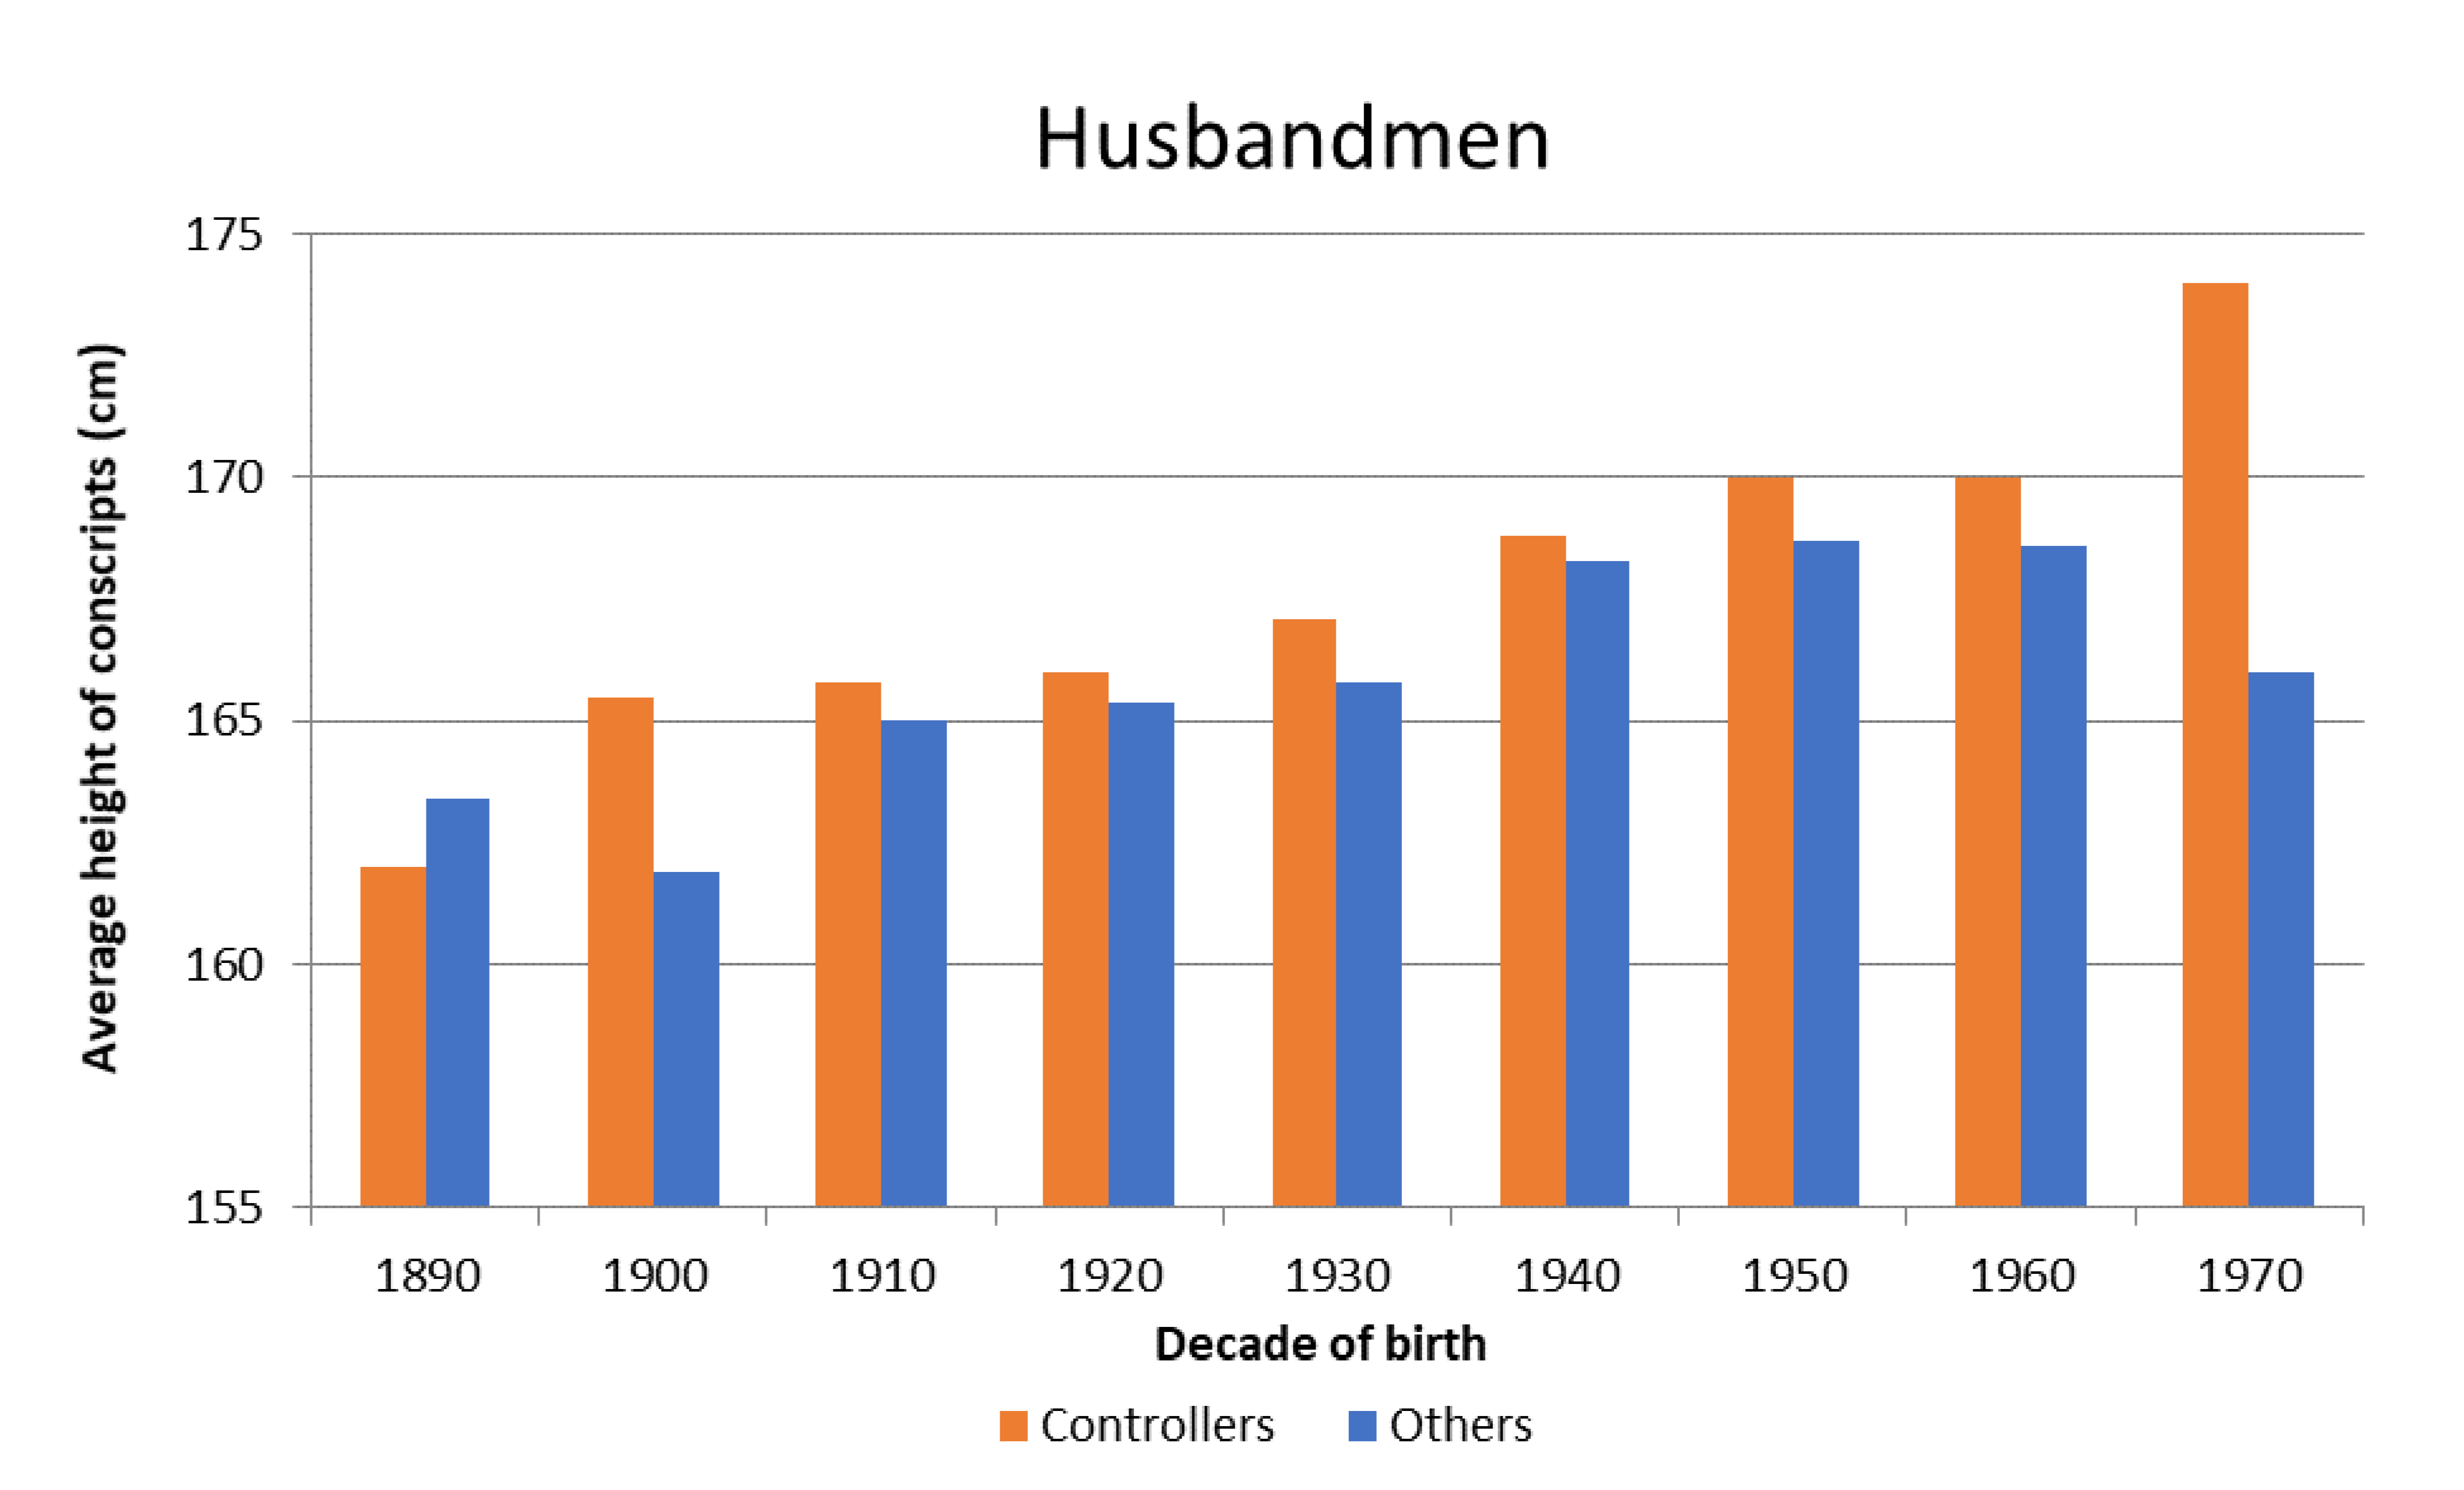
| 1890 | 1 | 162.0 | - | - | - | 10 | 163.4 | 1.6 | 159.7 | 167.0 |
| 1900 | 12 | 165.5 | 1.5 | 162.3 | 168.8 | 22 | 161.9 | 1.1 | 159.6 | 164.3 |
| 1910 | 9 | 165.8 | 2.5 | 160.0 | 171.5 | 50 | 165.0 | 1.0 | 163.1 | 167.0 |
| 1920 | 25 | 166.0 | 1.4 | 163.0 | 169.0 | 77 | 165.4 | 0.6 | 164.2 | 166.6 |
| 1930 | 50 | 167.1 | 0.9 | 165.3 | 168.8 | 72 | 165.8 | 0.7 | 164.5 | 167.1 |
| 1940 | 35 | 168.8 | 1.3 | 166.1 | 171.5 | 49 | 168.3 | 0.8 | 166.7 | 169.8 |
| 1950 | 23 | 170.0 | 1.0 | 168.1 | 172.0 | 19 | 168.7 | 1.3 | 165.9 | 171.5 |
| 1960 | 12 | 170.0 | 1.7 | 166.2 | 173.8 | 8 | 168.6 | 2.0 | 163.8 | 173.4 |
| 1970 | 1 | 174.0 | - | - | - | 1 | 166.0 | - | - | - |
References
- Van de Walle, E. Fertility Transition, Conscious Choice, and Numeracy. Demography 1992, 29, 487–502. [Google Scholar] [CrossRef]
- Thompson, W.S. Population. Am. Sociol. Rev. 1929, 34, 959–975. [Google Scholar] [CrossRef]
- Landry, A. La Révolution Démographique. Études et Essais sur les Problèmes de Population; Recueil Sirey: Paris, France, 1934. [Google Scholar]
- Hirschman, C. Comment: Globalization and Theories of Fertility Decline. Popul. Dev. Rev. 2001, 27, 116–125. [Google Scholar]
- Reher, D.S. The Demographic Transition Revisited as a Global Process. Popul. Space Place 2004, 10, 19–41. [Google Scholar] [CrossRef]
- Aries, P. Two Successive Motivations for the Declining Birth Rate in the West. Popul. Dev. Rev. 1980, 6, 645–650. [Google Scholar] [CrossRef]
- Van Bavel, J. Deliberate Birth Spacing before the Fertility Transition in Europe: Evidence from Nineteenth-Century Belgium. Popul. Stud. J. Demogr. 2004, 58, 95–107. [Google Scholar] [CrossRef] [PubMed]
- Galor, O.; Weil, D.N. Population, technology, and growth: From Malthusian stagnation to the demographic transition and beyond. Am. Econ. Rev. 2000, 90, 806–828. [Google Scholar] [CrossRef]
- Galor, O. Unified Growth Theory; Princeton University Press: Princeton, NJ, USA, 2010. [Google Scholar]
- Voigtländer, N.; Voth, H.J. Why England? Demographic factors, structural change and physical capital accumulation during the industrial revolution. J. Econ. Growth 2006, 11, 319–361. [Google Scholar] [CrossRef]
- Dalgaard, C.J.; Strulik, H. The history augmented solow model. Eur. Econ. Rev. 2013, 63, 134–149. [Google Scholar] [CrossRef]
- Madsen, J.B.; Islam, M.R.; Tang, X. Was the post-1870 fertility transition a key contributor to growth in the West in the twentieth century? J. Econ. Growth 2020, 25, 431–454. [Google Scholar] [CrossRef]
- Lucas, R.; Beltrán, J.L.; Martínez-García, F. Planificación familiar: Resultados de una encuesta en el medio rural. Gac. Sanit. 1987, 1, 23–27. [Google Scholar] [CrossRef][Green Version]
- Ruiz-Salguero, M.T. La Regulación de la Fecundidad: Un Estudio Demográfico de la Anticoncepción, la Esterilización, el Aborto y el Tratamiento de la Esterilidad en España. Ph.D. Thesis, Autonomous University of Barcelona, Barcelona, Spain, 2002. [Google Scholar]
- McLaren, A. A History of Contraception: From Antiquity to the Present Day; Wiley-Blackwell: Oxford, MI, USA, 1992. [Google Scholar]
- Santow, G. Coitus interruptus and the Control of Natural Fertility. Popul. Stud. J. Demogr. 1995, 49, 19–43. [Google Scholar] [CrossRef]
- Marco-Gracia, F.J. How was the fertility transition carried out? Analysis of fertility control strategies and their evolution in rural Aragon, Spain (1880–1955). Hist. Agrar. 2018, 76, 221–250. [Google Scholar] [CrossRef]
- McDonald, P.F. Nuptiality and Completed Fertility: A Study of Starting, Stopping and Spacing Behaviour; International Statistical Institute: Voorburg, The Netherlands, 1984. [Google Scholar]
- Knodel, J. Starting, Stopping, and Spacing during the Early Stages of Fertility Transition: The Experience of German Village Populations in the 18th and 19th Centuries. Demography 1987, 24, 143–162. [Google Scholar] [CrossRef] [PubMed]
- Seccombe, W. Working-Class Fertility Decline in Britain: Reply. Past Present 1992, 134, 207–211. [Google Scholar] [CrossRef]
- Yamaguchi, K.; Ferguson, L.R. The Stopping and Spacing of Childbirths and Their Birth-History Predictors: Rational-Choice Theory and Event-History Analysis. Am. Sociol. Rev. 1995, 60, 272–298. [Google Scholar] [CrossRef]
- Hionidou, V. The Adoption of Fertility Control on Mykonos, 1879–1959: Stopping, Spacing or Both? Popul. Stud. J. Demogr. 1998, 52, 67–83. [Google Scholar] [CrossRef] [PubMed]
- Sanz-Gimeno, A.; González-Quiñones, F. Las mujeres y el control de la fecundidad: Propuesta metodológica para su identificación durante la transición demográfica. Rev. Demogr. Hist. 2001, 19, 57–78. [Google Scholar]
- Reher, D.S.; Sanz-Gimeno, A. Rethinking Historical Reproductive Change: Insights from Longitudinal Data for a Spanish Town. Popul. Dev. Rev. 2007, 33, 703–727. [Google Scholar] [CrossRef]
- Dribe, M.; Scalone, F. Social class and net fertility before, during and after the demographic transition: A micro-level analysis of Sweden 1880–1970. Demogr. Res. 2014, 30, 429–464. [Google Scholar] [CrossRef]
- Dribe, M.; Oris, M.; Pozzi, L. Socioeconomic status and fertility before, during and after the demographic transition: An introduction. Demogr. Res. 2014, 30, 161–182. [Google Scholar] [CrossRef]
- Komlos, J.; Baten, J. (Eds.) The Biological Standards of Living in Comparative Perspective; Franz Steiner Verlag: Stuttgart, Germany, 1998. [Google Scholar]
- Komlos, J.; Baten, J. Looking backward and looking forward. Anthropometric research and the development of social science history. Soc. Sci. Hist. 2004, 28, 191–210. [Google Scholar] [CrossRef][Green Version]
- Steckel, R.H. Biological measures of the standard of living. J. Econ. Perspect. 2008, 22, 129–152. [Google Scholar] [CrossRef]
- Komlos, J. Anthropometric history: An overview of a quarter century of research. Anthropol. Anz. 2009, 67, 343–356. [Google Scholar] [CrossRef] [PubMed]
- Salvatore, R.D.; Coasworth, J.H.; Challú, A.E. (Eds.) Living Standards in Latin American History: Height, Welfare and Development, 1750–2000; Harvard University David Rockefeller Center for Latin American Studies: Cambridge, MA, USA, 2010. [Google Scholar]
- Mironov, B. The Standard of Living and Revolutions in Russia, 1700–1917; Routledge: London, UK, 2012. [Google Scholar]
- Silventoinen, K. Determinants of variation in adult body height. J. Biosoc. Sci. 2003, 35, 263–285. [Google Scholar] [CrossRef]
- Guntupalli, A.M.; Baten, J. The development and inequality of heights in north, west, and east India 1915–1944. Econ. Hum. Biol. 2006, 43, 578–608. [Google Scholar] [CrossRef]
- Akachi, Y.; Canning, D. The height of women in sub-Saharan Africa: The role of health, nutrition, and income in childhood. Ann. Hum. Biol. 2007, 34, 397–410. [Google Scholar] [CrossRef] [PubMed]
- López-Alonso, M. Growth with inequality: Living standards in Mexico, 1850–1950. J. Lat. Am. Stud. 2007, 39, 81–105. [Google Scholar] [CrossRef]
- Steckel, R.H. Heights and human welfare: Recent developments and new directions. Explor. Econ. Hist. 2009, 46, 1–23. [Google Scholar] [CrossRef]
- Schoch, T.; Staub, K.; Pfister, C.H. Social inequality and the biological standard of living: An anthropometric analysis of Swiss conscription data, 1875–1950. Econ. Hum. Biol. 2012, 10, 154–173. [Google Scholar] [CrossRef]
- Blum, M. The influence of inequality on the standard of living: Worldwide anthropometric evidence from the 19th and 20th centuries. Econ. Hum. Biol. 2013, 11, 436–452. [Google Scholar] [CrossRef] [PubMed]
- Hatton, T.J. How Have Europeans Grown so Tall? Oxf. Econ. Pap. 2014, 66, 349–372. [Google Scholar] [CrossRef]
- Ayuda, M.I.; Puche-Gil, J. Determinants of height and biological inequality in Mediterranean Spain, 1859–1967. Econ. Hum. Biol. 2014, 15, 101–119. [Google Scholar] [CrossRef] [PubMed]
- McEvoy, B.P.; Visscher, P.M. Genetics of human height. Econ. Hum. Biol. 2009, 7, 294–306. [Google Scholar] [CrossRef] [PubMed]
- Grasgruber, P.; Cacek, J.; Kalina, T.; Sebera, M. The role of nutrition and genetics as key determinants of the positive height trend. Econ. Hum. Biol. 2014, 15, 81–100. [Google Scholar] [CrossRef] [PubMed]
- Martínez-Carrión, J.M.; Salvatore, R.D. Inequality and Well-Being in Iberian and Latin American Regions since 1820. New Approaches from Anthropometric History. Rev. Hist. Econ. 2019, 37, 193–204. [Google Scholar] [CrossRef]
- Cámara, A.D.; Martínez-Carrión, J.M.; Puche, J.; Ramón-Muñoz, J.M. Height and Inequality in Spain: A Long-Term Perspective. Rev. Hist. Econ. 2019, 37, 205–238. [Google Scholar] [CrossRef]
- Varea, C.; Sánchez-García, E.; Bogin, B.; Ríos, L.; Gómez-Salinas, B.; López-Canorea, A.; Martínez-Carrión, J.M. Disparities in Height and Urban Social Stratification in the First Half of the 20th Century in Madrid (Spain). Int. J. Environ. Res. Public Health 2019, 16, 2048. [Google Scholar] [CrossRef]
- Marco-Gracia, F.J. Adapting family size and composition: Childhood mortality and human agency in fertility decisions in rural Spain, 1750–1949. J. Interdiscip. Hist. 2021, 51, 1–23. [Google Scholar]
- Puel de la Villa, F. El Soldado Desconocido: De la Leva a la ‘Mili’ (1700–1912); Biblioteca Nueva: Madrid, Spain, 1996. [Google Scholar]
- Verdejo Lucas, J.M. Ejército, Política y Sociedad en el Reinado de Alfonso XIII. Ph.D. Thesis, Ministerio de Defensa, Madrid, Spain, 2004. [Google Scholar]
- Puche-Gil, J. Evolución de los Niveles de Vida Biológicos en la Comunidad Valenciana, 1840–1948. Ph.D. Thesis, Universidad Pablo de Olavide, Sevilla, Spain, 2009. [Google Scholar]
- Puche-Gil, J. Evolución de los Niveles de vida Biológicos en la Comunidad Valenciana, 1840–1948. Invest. Hist. Econ. 2011, 21, 380–394. [Google Scholar] [CrossRef]
- Fleury, M.; Henry, L. Des Registres Paroissiaux à L’histoire de la Population: Manuel de Dépouillement et D’exploitation d L’état Civil Ancien; Institut National d’Études Démographiques: Paris, France, 1956. [Google Scholar]
- Inwood, K.; Maxwell-Stewart, H. Selection Bias and Social Science History. Soc. Sci. Hist. 2020, 44, 411–416. [Google Scholar] [CrossRef]
- Inwood, K.; Kippen, R.; Maxwell-Stewart, H.; Steckel, R. The Short and the Tall: Comparing Stature and Socioeconomic Status for Male Prison and Military Populations. Soc. Sci. Hist. 2020, 44, 411–416. [Google Scholar] [CrossRef]
- Quanjer, B.; Kok, J. Drafting the Dutch: Selection Biases in Dutch Conscript Records in the Second Half of the Nineteenth Century. Soc. Sci. Hist. 2020, 44, 501–524. [Google Scholar] [CrossRef]
- Hatton, T.J.; Martin, R.M. Fertility decline and the heights of children in Britain, 1886–1938. Explor. Econ. Hist. 2010, 47, 505–519. [Google Scholar] [CrossRef]
- Weir, D.R. Parental consumption decisions and child health during the early French fertility decline, 1790–1914. J. Econ. Hist. 1993, 53, 259–274. [Google Scholar] [CrossRef]
- Aliaga Cabetas, M. Recuperando Nuestra Memoria II; Grafistudio: María de Huerva, Spain; Zaragoza, Spain, 2002. [Google Scholar]
- Marco-Gracia, F.J. Alfamén: De la Guerra de la Independencia al Siglo XXI; Diputación Provincial de Zaragoza: Zaragoza, Spain, 2011.
- Quintana-Domeque, C.; Bozzoli, C.; Bosch, M. The evolution of adult height across Spanish regions, 1950–1980. Econ. Hum. Biol. 2012, 10, 264–275. [Google Scholar] [CrossRef]
- Martínez-Carrión, J.M.; Cámara, A.D.; Pérez-Castroviejo, P.M. Parámetros antropométricos de los reclutas españoles antes de la transición nutricional. Análisis de las desigualdades territoriales (1858–1913). Nutr. Hosp. 2016, 33, 1477–1486. [Google Scholar] [CrossRef] [PubMed]
- Hatton, T.J.; Bray, B.E. Long run trends in the heights of European men, 19th–20th centuries. Econ. Hum. Biol. 2010, 8, 405–413. [Google Scholar] [CrossRef]
- Germán, L. Crecimiento económico, disparidades y especialización en España. Siglos XIX y XX. Cuad. Aragoneses Ec. 1993, 3, 203–212. [Google Scholar]
- Germán, L. Historia Económica del Aragón Contemporáneo; Prensas Universitarias de Zaragoza: Zaragoza, Spain, 2012. [Google Scholar]
- Germán, L. Hacia una tipología del crecimiento económico regional moderno en España. En torno al éxito de las regiones ibéricas. El caso de la provincia de Zaragoza. Ec. Aragonesa 2000, 11, 81–98. [Google Scholar]
- Calatayud, S. Economía en transformación. Agricultura e industria en la época contemporánea (1800–1950). In De la Revolución Liberal a la Democracia Parlamentaria: Valencia (1808–1975); Preston, P., Saz, I., Eds.; Biblioteca Nueva y Universitat de Valencia: Valencia, Spain, 2001; pp. 163–200. [Google Scholar]
- Carreras, A. Industria. In Estadísticas Históricas de España; Carreras, A., Tafunell, X., Eds.; FBBVA: Barcelona, Spain, 2005; pp. 357–453. [Google Scholar]
- Pinilla, V.; Ayuda, M.I. Foreign markets, globalization and agricultural change in Spain 1850–1935. In Markets and Agricultural Change in Europe from the Thirteenth to the Twentieth Century; Pinilla, V., Ed.; Brepols Publisher: Turnhout, Belgium, 2009; pp. 173–208. [Google Scholar]
- Pinilla, V.; Ayuda, M.I. Taking advantage of globalization? Spain and the building of the international market in Mediterranean horticultural products, 1850–1935. Eur. Rev. Econ. Hist. 2010, 14, 239–274. [Google Scholar] [CrossRef]
- Silvestre, J. Internal migrations in Spain, 1877–1930. Eur. Rev. Econ. Hist. 2005, 9, 233–265. [Google Scholar] [CrossRef]
- Domínguez, R.; Guijarro, M. Hacia una reconstrucción normativa del bienestar: Evolución del índice físico de calidad de vida en España. Estud. Econ. Aplic. 2001, 18, 157–174. [Google Scholar]
- Germán, L.; Llopis, E.; Maluquer De Motes, J.; Zapata, S. (Eds.) Historia Económica Regional de España, Siglos XIX y XX; Crítica: Barcelona, Spain, 2001. [Google Scholar]
- Núñez, C.E. Educación. In Estadísticas Históricas de España; Carreras, A., Tafunell, X., Eds.; FBBVA: Barcelona, Spain, 2005; pp. 157–244. [Google Scholar]
- Ramón Muñoz, J.M. Industrialización, urbanización y bienestar biológico en Cataluña, 1840–1935: Una aproximación antropométrica. Rev. Hist. Ind. 2011, 46, 41–71. [Google Scholar]
- Marco-Gracia, F.J. Influence of the Social and Economic Changes in the Fertility Control: An Analysis of Rural Spain Based on Microdata (16th–21st Centuries). Ph.D. Thesis, University of Zaragoza, Zaragoza, Spain, 2017. [Google Scholar]
- Marco-Gracia, F.J. Fertility control due to short-term economic stress in rural Aragón (Spain), 1801–1909. Rev. Hist. Econ. 2021, 39, 129–155. [Google Scholar] [CrossRef]
- Marco-Gracia, F.J.; Beltrán-Tapia, F.J. Son preference, gender discrimination and missing girls in rural Spain, 1750–1950. Popul. Dev. Rev 2021. Online first. [Google Scholar] [CrossRef]
- Shaw-Taylor, L.; Saito, O. (Eds.) Occupational Structure and Industrialization in a Comparative Perspective; Unpublished; Manuscript in preparation.
- Shaw-Taylor, L.; Wrigley, E.A. Occupational Structure and Population Change. In The Cambridge Economic History of Modern Britain; Floud, R., Humphries, J., Johnson, P., Eds.; Cambridge University Press: Cambridge, UK, 2014; Volume I, pp. 53–88. [Google Scholar]
- Van Bavel, J. Detecting stopping and spacing behaviour in historical fertility transitions: A critical review of methods. Population 2004, 59, 117–128. [Google Scholar] [CrossRef]
- Van Poppel, F.; Reher, D.S.; Sanz-Gimeno, A.; Sánchez-Domínguez, M.; Beeking, E. Mortality decline and reproductive change during the Dutch demographic transition: Revisiting a traditional debate with new data. Demogr. Res. 2012, 27, 299–338. [Google Scholar] [CrossRef]
- Reher, D.; Sandström, G. Dimensions of Rational Decisions-Making during the Demographic Transition; Aranjuez (Spain) Revisited. Hist. Life Course St. 2015, 2, 20–36. [Google Scholar]
- Reher, D.S.; Sandström, G.; Sanz-Gimeno, A.; Van Poppel, F. Agency in Fertility Decisions in Western Europe during the Demographic Transition. A comparative perspective. Demography 2017, 54, 3–22. [Google Scholar] [CrossRef] [PubMed]
- Sarasúa, C.; Gálvez, L. Mujeres y hombres en los mercados de trabajo. ¿Privilegios o eficiencia? In ¿Privilegios o Eficiencia? Mujeres y Hombres en los Mercados de Trabajo; Sarasúa, C., Gálvez, L., Eds.; Publicaciones de la Universidad de Alicante: Alicante, Spain, 2003; pp. 9–33. [Google Scholar]
- Camps Cura, E. La Formación del Mercado de Trabajo Industrial en la Cataluña del Siglo XIX; Ministerio de Trabajo y Seguridad Social: Madrid, Spain, 1995.
- Borderías, C. La transición de la actividad femenina en el mercado de trabajo barcelonés (1856–1930): Teoría social y realidad histórica en el sistema estadístico moderno. In ¿Privilegios o Eficiencia? Mujeres y Hombres en los Mercados de Trabajo; Sarasúa, C., Gálvez, L., Eds.; Publicaciones de la Universidad de Alicante: Alicante, Spain, 2003; pp. 242–273. [Google Scholar]
- López-Antón, M. Tras los pasos de Francisco de Zamora. Trabajo de las mujeres y reconstrucción de las tasas de actividad en Cataluña (siglos XVIII–XIX). Ph.D. Thesis, Autonomous University of Barcelona, Barcelona, Spain, 2021. [Google Scholar]
- Muñoz-Abeledo, L. Women in the rural and industrial labor force in nineteenth-century Spain. Fem. Econ. 2012, 18, 121–144. [Google Scholar] [CrossRef]
- Muñoz-Abeledo, L.; Taboada Mella, S.; Verdugo Matés, R.S. Condicionantes de la actividad femenina en la Galicia de mediados del siglo XIX. Rev. Hist. Ind. 2015, 59, 39–80. [Google Scholar]
- Campos-Luque, C. La tasa de actividad femenina a mediados del siglo XIX en Andalucía: El caso de Antequera. Invest. Hist. Econ. 2014, 10, 191–201. [Google Scholar] [CrossRef]
- Sear, R.; Coall, D. How much does family matter? Cooperative breeding and the demographic transition. Popul. Dev. Rev. 2011, 37, 81–112. [Google Scholar] [CrossRef] [PubMed]
- Scelza, B.A.; Hinde, K. A biocultural study of Grandmothering during the perinatal period. Hum. Nat. 2019, 30, 10017. [Google Scholar] [CrossRef] [PubMed]
- Nenko, I.; Chapman, S.N.; Lahdenperä, M.; Pettay, J.E.; Lummaa, V. Will granny save me? Birth status, survival, and the role of grandmothers in historical Finland. Evol. Hum. Behav 2020. online first. [Google Scholar] [CrossRef]
- Amorim, N.; Marco-Gracia, F.J.; Salgado, F. Microanálisis comparado de la transición demográfica en el medio rural en tres islas de las Azores, siglos XVIII–XX. Diferencias en el pasado, semejanzas en el presente. Hist. Agrar. 2021, 84, 73–106. [Google Scholar] [CrossRef]
- Lana-Berasain, J.M. El poder de compra de jornaleros y criados. Salarios reales y mercados de trabajo en la Navarra rural, 1781–1936. Invest. Hist. Econ. 2007, 7, 37–68. [Google Scholar] [CrossRef]
- Cussó, X.; Garrabou, R. La transición nutricional en la España contemporánea: Las variaciones en el consumo de pan, patatas y legumbres (1850–2000). Invest. Hist. Econ. 2007, 3, 69–100. [Google Scholar] [CrossRef]
- Case, A.; Paxson, C. Stature and status: Height, ability, and labor market outcomes. J. Polit. Econ. 2008, 116, 499–532. [Google Scholar] [CrossRef]
- Schick, A.; Steckel, R.H. Height, Human Capital, and Earnings: The Contributions of Cognitive and Noncognitive Ability. J. Hum. Cap. 2015, 9, 94–115. [Google Scholar] [CrossRef]
- Hacker, J.D. Economic, demographic, and anthropometric correlates of first marriage in the mid-nineteenth-century United States. Soc. Sci. Hist. 2008, 32, 307–345. [Google Scholar] [CrossRef]
- Manfredini, M.; Breschi, M.; Fornasin, A.; Seghieri, C. Heights, socioeconomic status and marriage in Italy around 1900. Econ. Hum. Biol. 2013, 11, 465–473. [Google Scholar] [CrossRef] [PubMed]
- Marco-Gracia, F.J. Why did they not get married? Biological, economic and family determinants of celibacy in rural Spain (1785–2010). Invest. Hist. Econ. 2018, 14, 140–153. [Google Scholar] [CrossRef]
- Francesconi, M.; Heckman, J.J. Child development and parental investment: Introduction. Econ. J. 2016, 126, 1–27. [Google Scholar] [CrossRef]
- Hõrak, P.; Valge, M. Why did children grow so well at hard times? The ultimate importance of pathogen control during puberty. Evol. Med. Public Health 2015, 1, 167–178. [Google Scholar] [CrossRef] [PubMed]
- Vasilyeva, M.; Dearing, E.; Ivanova, A.; Shen, C.; Kardanova, E. Testing the family investment model in Russia: Estimating indirect effects of SES and parental beliefs on the literacy skills of first-graders. Early Child. Res. Q. 2018, 42, 11–20. [Google Scholar] [CrossRef]
| Population | ||||
|---|---|---|---|---|
| 1860 | 1900 | 1940 | 1981 | |
| Alfamén | 604 | 639 | 1347 | 1283 |
| Aylés | 45 | 26 | 47 | 0 |
| Botorrita | 294 | 350 | 557 | 382 |
| Codos | 1232 | 1195 | 938 | 355 |
| Cosuenda | 1451 | 1270 | 929 | 482 |
| Jaulín | 390 | 348 | 528 | 334 |
| Longares | 1120 | 1329 | 1385 | 959 |
| Mezalocha | 544 | 482 | 660 | 357 |
| Mozota | 292 | 372 | 404 | 158 |
| Muel | 1223 | 1206 | 1605 | 1330 |
| Torrecilla de Valmadrid | 164 | 77 | 94 | 32 |
| Tosos | 682 | 865 | 801 | 297 |
| Valmadrid | 203 | 210 | 219 | 89 |
| Villanueva de Huerva | 690 | 970 | 1158 | 771 |
| TOTAL | 7926 | 8196 | 10,672 | 6829 |
| Birth Decade | Number of Obs. | Birth Decade | Number of Obs. |
|---|---|---|---|
| 1890s | 113 | 1940s | 386 |
| 1900s | 312 | 1950s | 251 |
| 1910s | 330 | 1960s | 113 |
| 1920s | 561 | 1970s | 11 |
| 1930s | 463 | TOTAL | 2510 |
| Sons | ||||
|---|---|---|---|---|
| Short | Medium | Tall | ||
| FATHERS | Short | 59 | 26 | 15 |
| Medium | 32 | 50 | 18 | |
| Tall | 9 | 24 | 67 | |
| Sons | ||||
|---|---|---|---|---|
| Short | Medium | Tall | ||
| FATHERS | Short | 45 | 45 | 10 |
| Medium | 29 | 26 | 45 | |
| Tall | 26 | 29 | 45 | |
| Controllers | Others | |||||||||
|---|---|---|---|---|---|---|---|---|---|---|
| Decade | Observation | Average | Standard Deviation | 95% Confidence Interval | Observation | Average | Standard Deviation | 95% Confidence Interval | ||
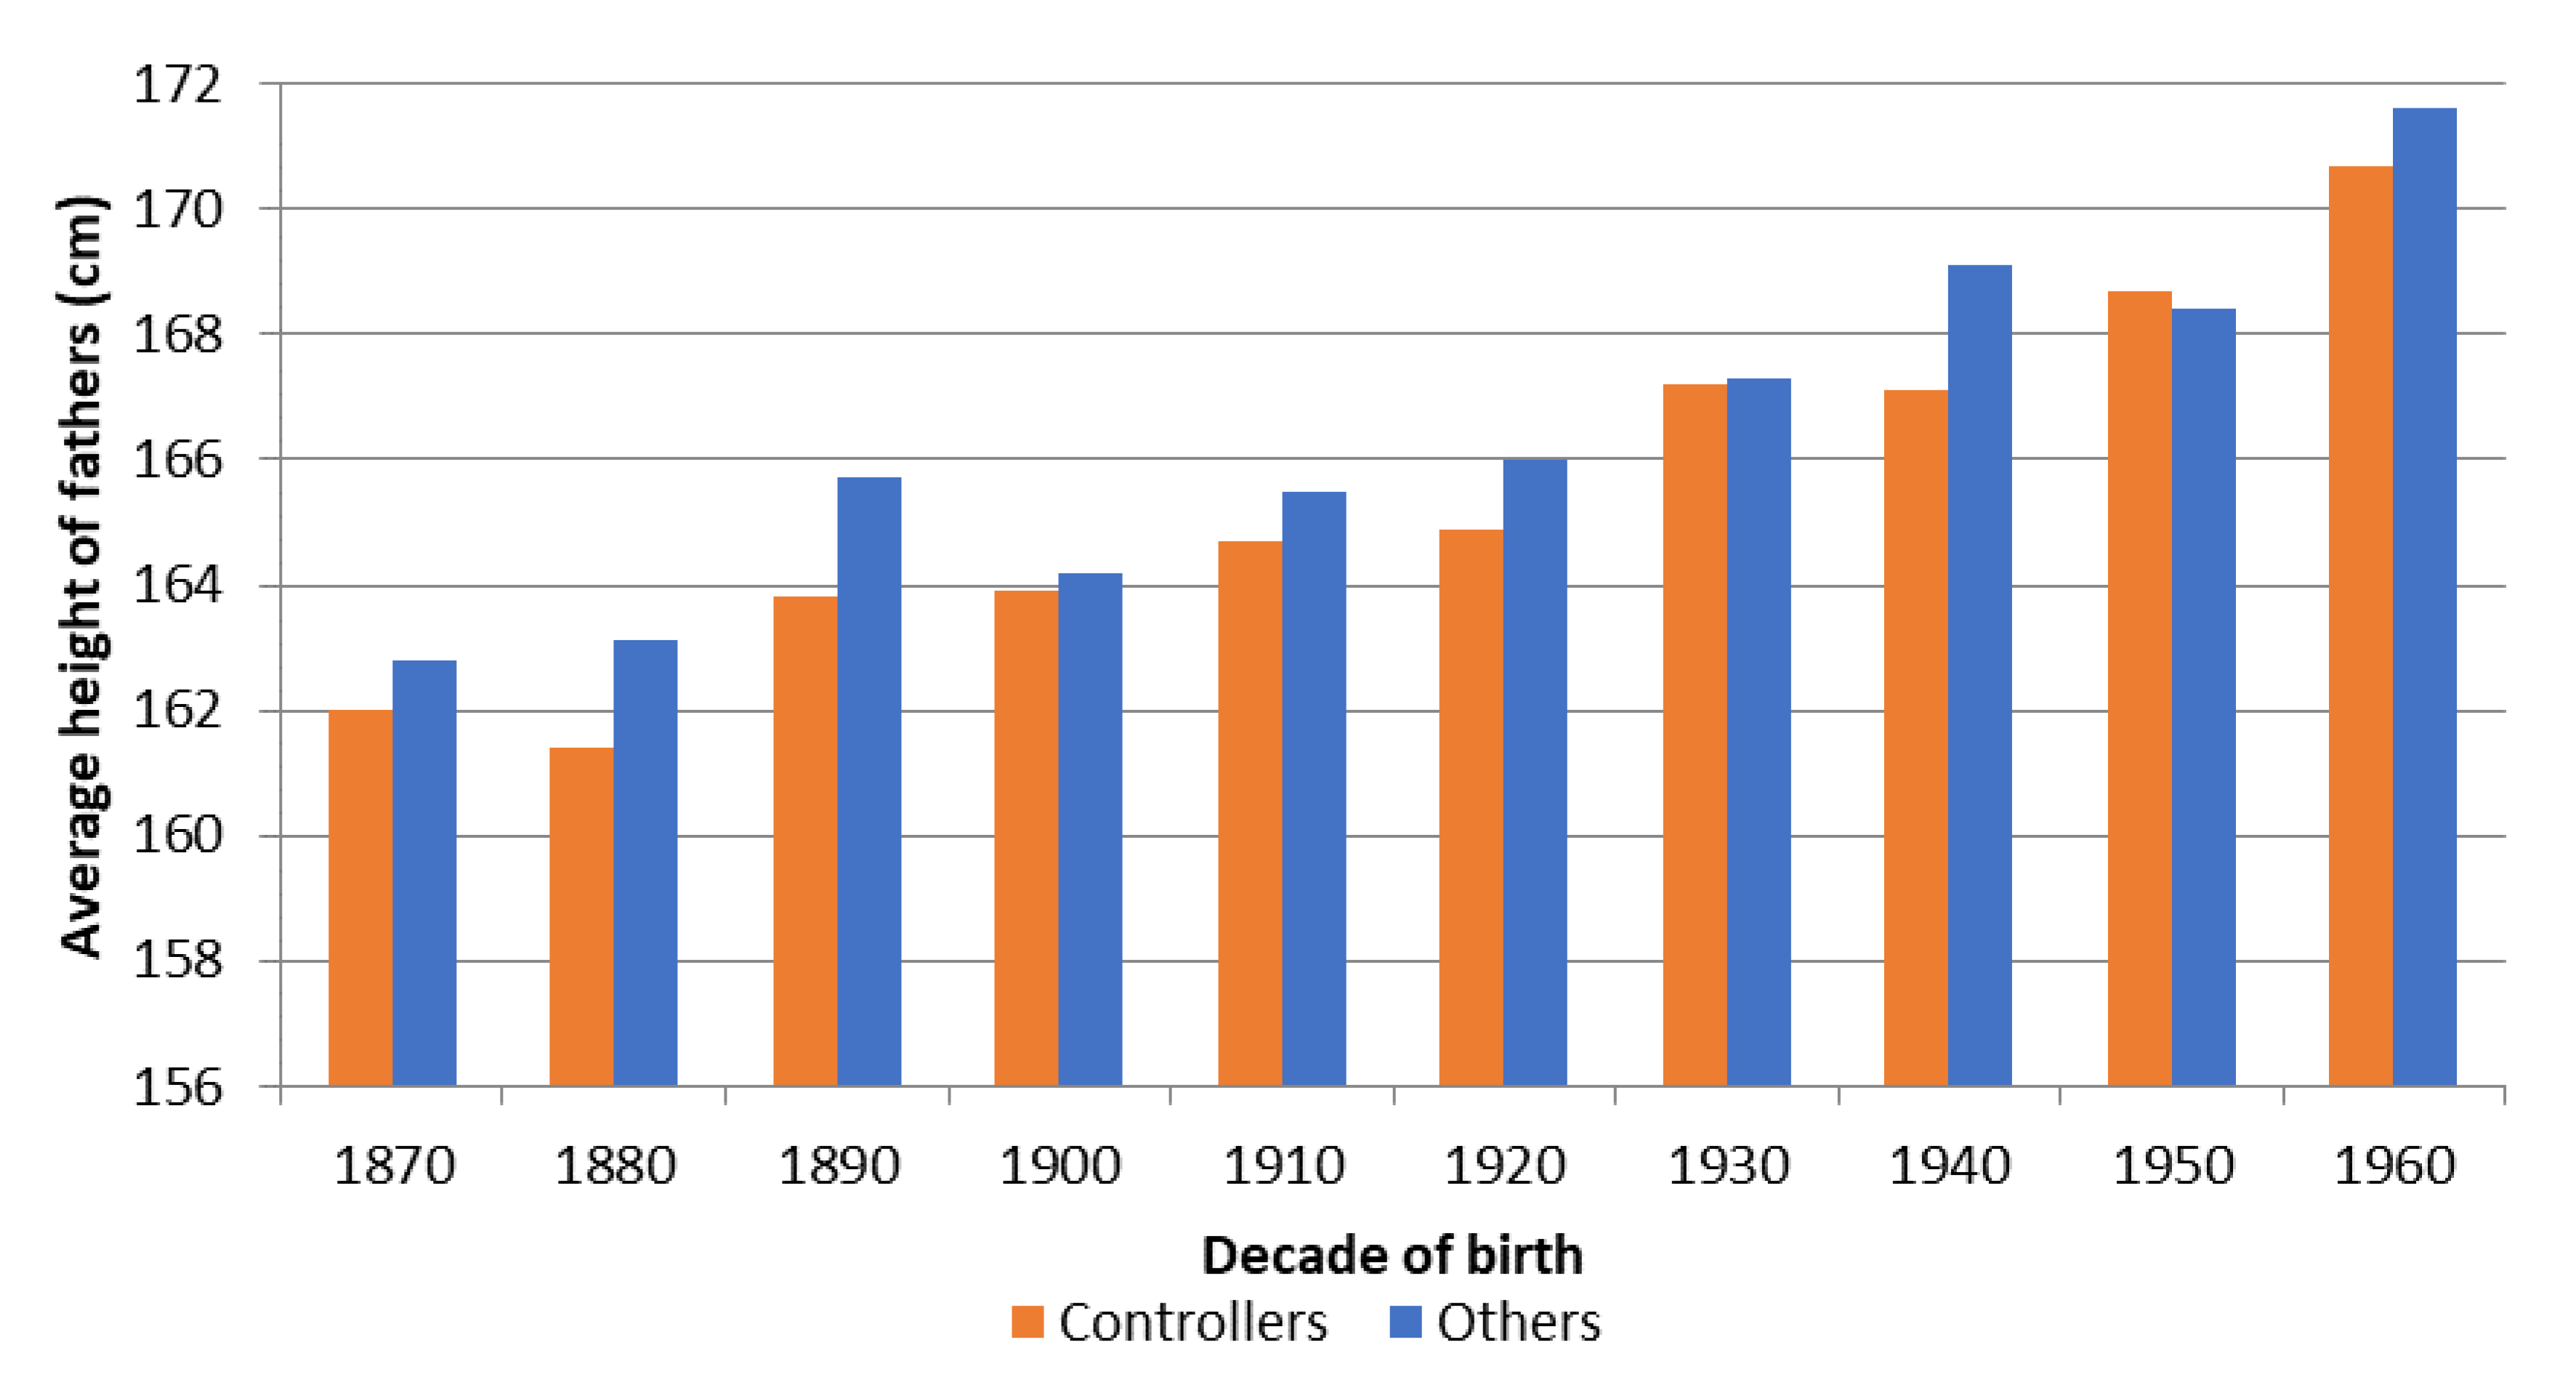
| 1870 | 8 | 162.0 | 1.3 | 159.1 | 165.1 | 25 | 162.8 | 0.9 | 160.9 | 164.7 |
| 1880 | 15 | 161.4 | 1.0 | 159.2 | 163.7 | 25 | 163.1 | 1.2 | 160.6 | 165.6 |
| 1890 | 29 | 163.8 | 1.1 | 162.8 | 164.9 | 24 | 165.7 | 1.0 | 163.7 | 167.8 |
| 1900 | 107 | 163.9 | 0.5 | 162.8 | 164.9 | 70 | 164.2 | 0.7 | 162.8 | 165.7 |
| 1910 | 62 | 164.7 | 0.7 | 163.3 | 166.2 | 71 | 165.5 | 0.8 | 164.0 | 167.0 |
| 1920 | 153 | 164.9 | 0.4 | 164.2 | 165.7 | 106 | 166.0 | 0.6 | 164.8 | 167.2 |
| 1930 | 98 | 167.2 | 0.6 | 166.1 | 168.3 | 70 | 167.3 | 0.6 | 166.1 | 168.6 |
| 1940 | 61 | 167.1 | 0.6 | 165.9 | 168.4 | 54 | 169.1 | 0.7 | 167.7 | 170.6 |
| 1950 | 48 | 168.7 | 0.7 | 167.4 | 170.1 | 39 | 168.4 | 0.9 | 166.6 | 170.2 |
| 1960 | 24 | 170.7 | 1.2 | 168.2 | 173.3 | 13 | 171.6 | 1.3 | 168.9 | 174.4 |
| 1820s–1860s | 1870s | 1880s | 1890s | 1900s | 1910s | 1920s | 1930s | |
|---|---|---|---|---|---|---|---|---|
| Whole group | 3.9 | 3.8 | 3.6 | 2.5 | 2.1 | 2.2 | 1.7 | 1.8 |
| Controllers | - | 2.7 | 2.6 | 1.7 | 1.7 | 1.6 | 1.5 | 1.4 |
| Others | - | 4.1 | 4.0 | 3.3 | 2.4 | 2.6 | 2.0 | 2.1 |
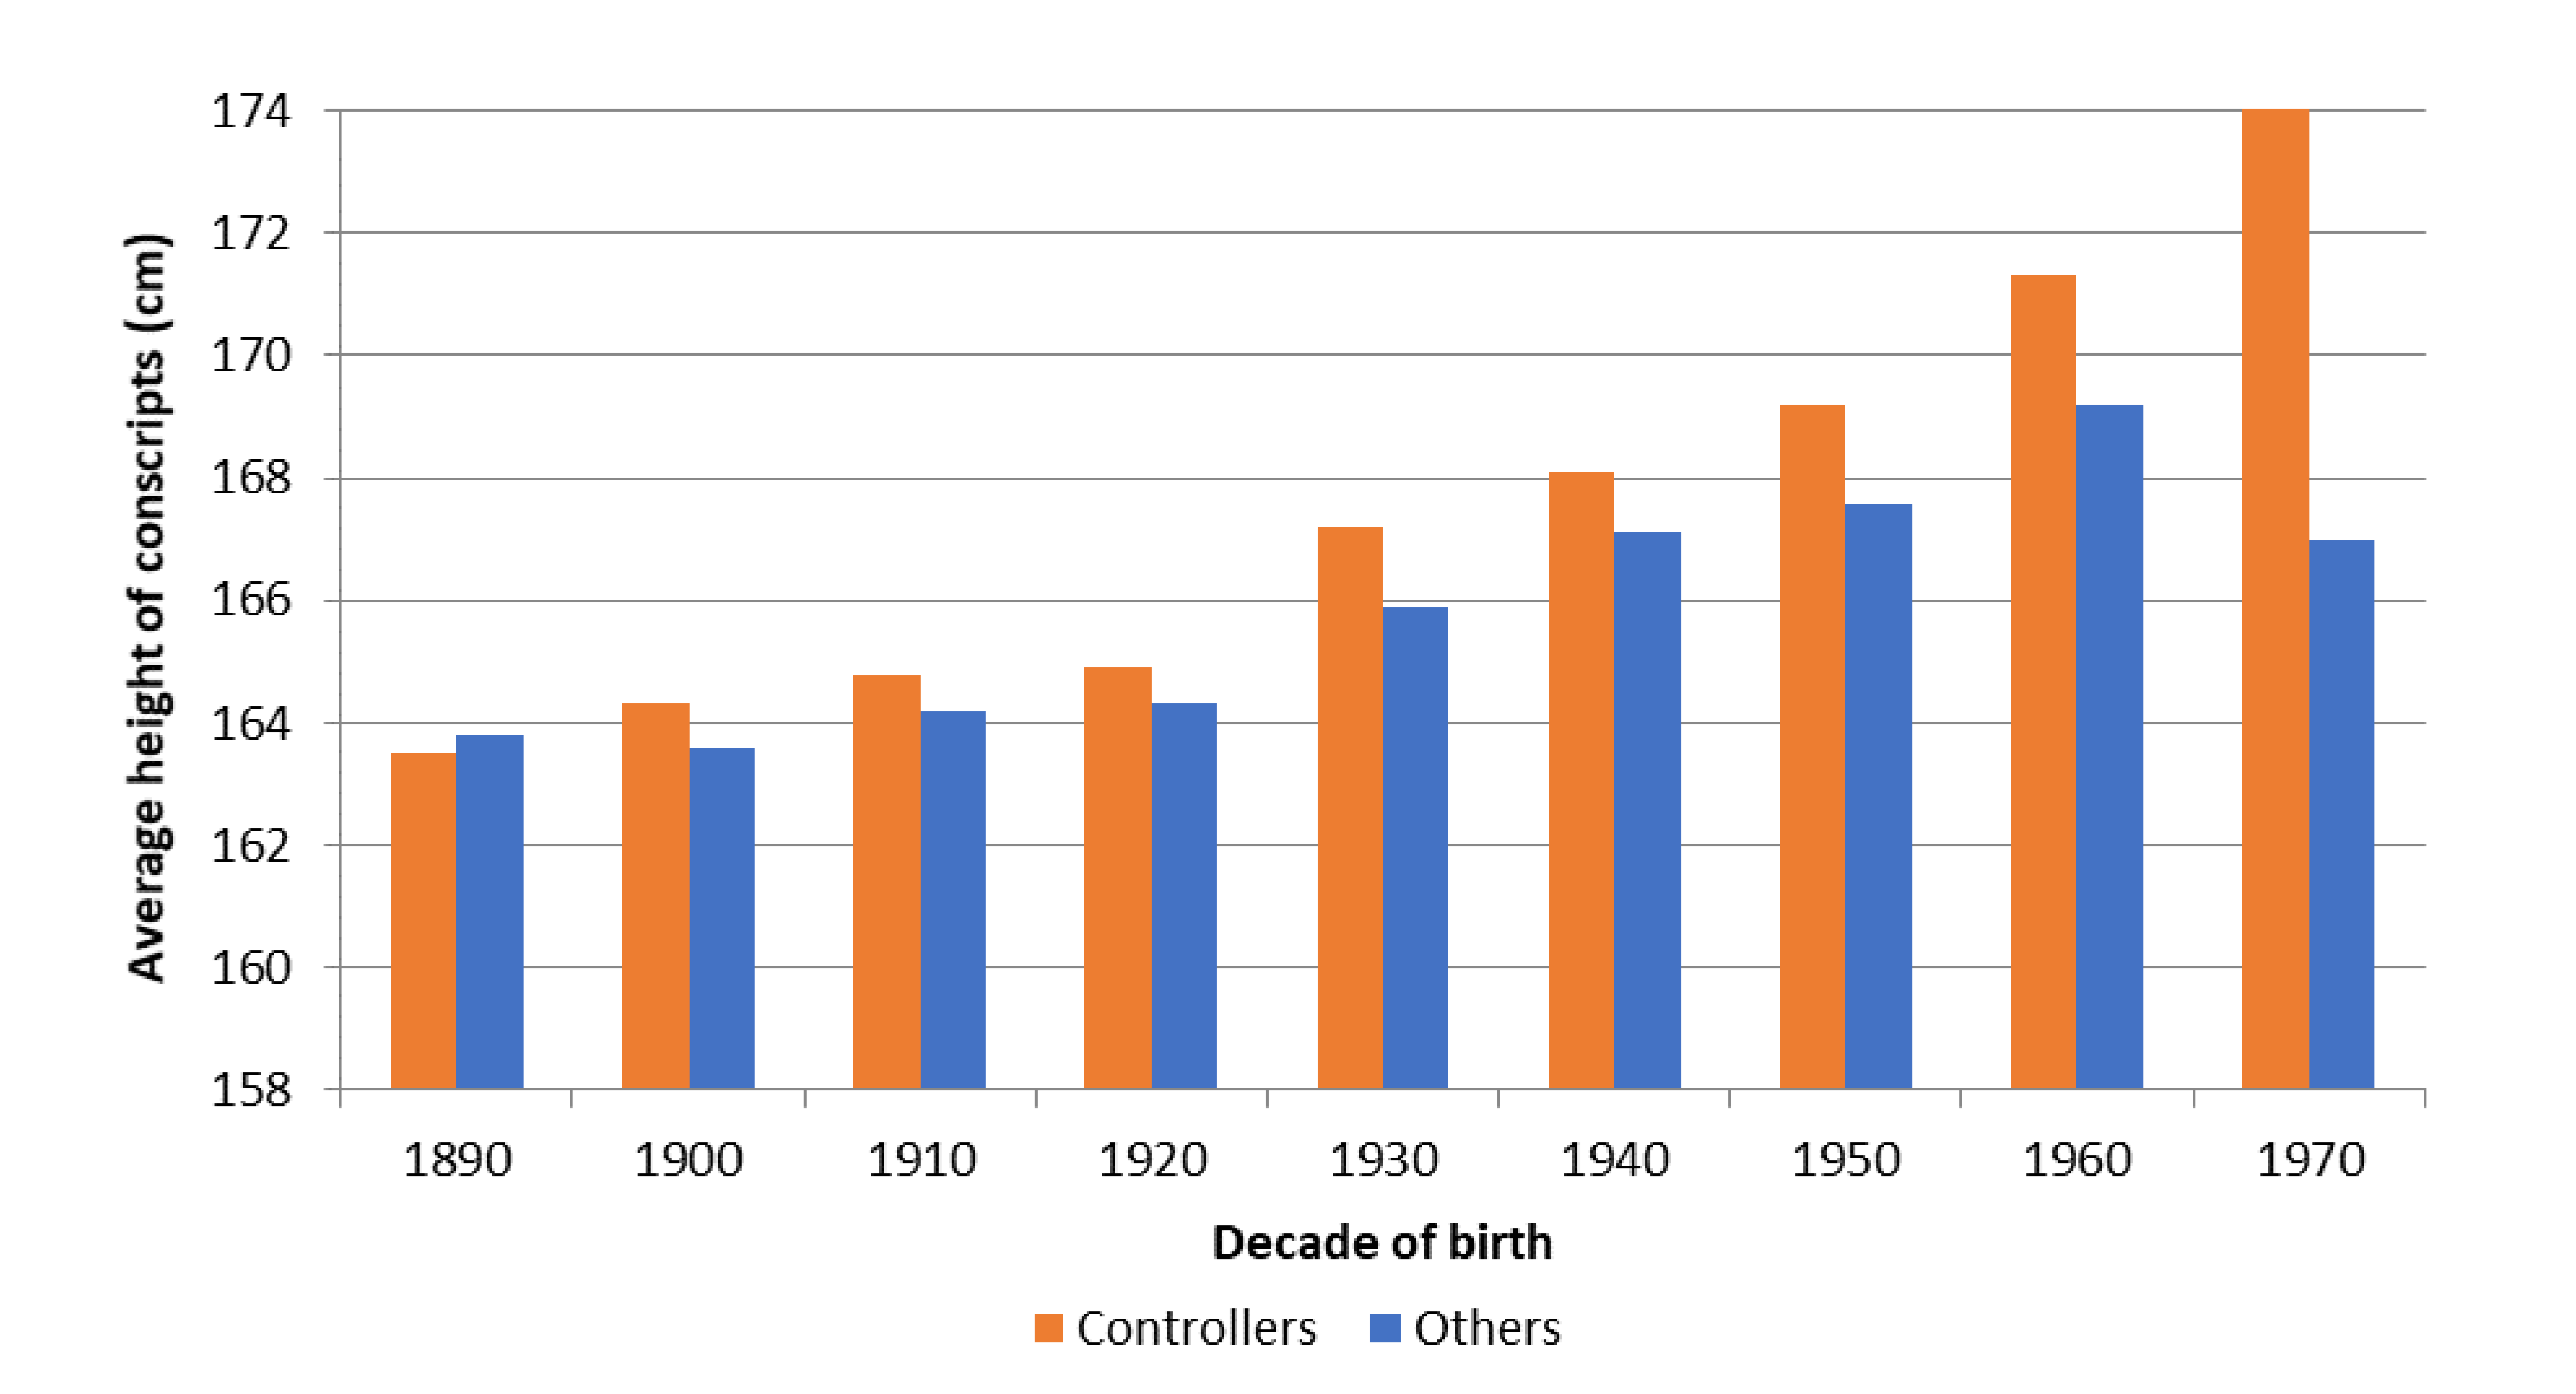
| Controllers | Others | |||||||||
|---|---|---|---|---|---|---|---|---|---|---|
| Decade | Observation | Average | Standard Deviation | 95% Confidence Interval | Observation | Average | Standard Deviation | 95% Confidence Interval | ||
| 1890 | 15 | 163.5 | 1.4 | 160.5 | 166.5 | 98 | 163.8 | 0.6 | 162.6 | 164.9 |
| 1900 | 50 | 164.3 | 0.8 | 162.7 | 166.0 | 262 | 163.6 | 0.4 | 162.9 | 164.4 |
| 1910 | 55 | 164.8 | 0.8 | 163.2 | 166.5 | 245 | 164.2 | 0.4 | 163.4 | 165.1 |
| 1920 | 164 | 164.9 | 0.5 | 163.9 | 165.9 | 397 | 164.3 | 0.3 | 163.8 | 165.0 |
| 1930 | 195 | 167.2 | 0.4 | 166.4 | 168.0 | 268 | 165.9 | 0.4 | 165.2 | 166.6 |
| 1940 | 156 | 168.1 | 0.5 | 167.1 | 169.2 | 230 | 167.1 | 0.4 | 166.4 | 167.9 |
| 1950 | 110 | 169.2 | 0.6 | 168.1 | 170.3 | 141 | 167.6 | 0.5 | 166.6 | 168.6 |
| 1960 | 51 | 171.3 | 0.9 | 169.4 | 173.2 | 62 | 169.2 | 0.8 | 167.7 | 170.7 |
| 1970 | 8 | 174.2 | 2.5 | 168.3 | 180.1 | 3 | 167.0 | 4.4 | 148.2 | 185.7 |
| Dependent Variable: Height at 21 Years (Min. 1300 mm–Max. 1950 mm) | |||||||
|---|---|---|---|---|---|---|---|
| Variable | Categories | (1) | (2) | (3) | (4) | (5) | (6) |
| Controllers | No (ref.) | ||||||
| Yes | 10.11 *** (2.67) | 16.53 *** (2.74) | 9.81 *** (2.67) | 9.85 *** (2.67) | 13.10 *** (2.96) | 10.96 *** (2.83) | |
| Father’s occupation | Farmer (ref.) | ||||||
| Low skilled worker | −8.01 * (3.41) | −5.65 ** (3.40) | −5.63 * (3.40) | −8.01 ** (3.40) | −5.63 * (3.40) | ||
| Artisan | 1.50 (6.69) | 2.34 (6.45) | 2.44 (6.44) | 0.33 (6.68) | 2.70 (6.45) | ||
| Upper class | 29.56 *** (9.36) | 21.71 ** (10.47) | 21.32 ** (10.46) | 29.31 *** (9.33) | 20.59 ** (10.47) | ||
| Other or unknown | −13.45 *** (4.03) | −3.01 (3.99) | −3.78 (3.99) | −13.10 *** (4.02) | −3.67 (3.99) | ||
| Literacy | Illiterate (ref.) | ||||||
| Literate | 14.77 ** (6.29) | 1.98 (6.12) | 1.50 * (6.11) | 12.38 * (6.30) | 1.92 (6.12) | ||
| Unknown | −16.05 (12.00) | −11.53 (11.43) | −11.95 (11.41) | −15.22 (11.96) | −12.10 (11.41) | ||
| Exemption appeals | No (ref.) | ||||||
| Physical | −12.14 *** (3.92) | −14.58 *** (4.11) | −12.06 *** (3.92) | ||||
| Social | 8.34 (7.72) | −11.55 (7.82) | 8.56 (7.72) | ||||
| Number of living siblings (>5 years) | 0–1 (ref.) | ||||||
| 2–3 | −10.56 ** (3.67) | −0.30 (3.55) | |||||
| 4–6 | −13.79 *** (3.95) | 1.46 (3.96) | |||||
| 7+ | −10.41 ** (5.01) | 7.22 (5.06) | |||||
| Intercept | 1629.5 *** (6.90) | 1632.1 *** (6.78) | 1646.1 *** (9.03) | 1635.0 *** (9.09) | 1661.0 *** (7.63) | 1632.2 *** (9.90) | |
| Village fixed-effects | YES | NO | YES | YES | NO | YES | |
| Birth decade fixed-effects | YES | NO | YES | YES | NO | YES | |
| Sample size | 2510 | 2510 | 2510 | 2510 | 2510 | 2510 | |
| Adjusted R2 | 0.144 | 0.150 | 0.037 | 0.154 | 0.047 | 0.155 | |
| 1890–1969 | 1890–1909 | 1910–1929 | 1930–1949 | 1950–1969 | |
|---|---|---|---|---|---|
| 0–2 people | 165.4 | 163.6 | 164.0 | 166.4 | 168.8 |
| 3–5 people | 165.9 | 163.7 | 164.5 | 166.6 | 169.1 |
| 6 or more people | 167.0 | 162.6 | 165.9 | 168.1 | 169.1 |
Publisher’s Note: MDPI stays neutral with regard to jurisdictional claims in published maps and institutional affiliations. |
© 2021 by the authors. Licensee MDPI, Basel, Switzerland. This article is an open access article distributed under the terms and conditions of the Creative Commons Attribution (CC BY) license (https://creativecommons.org/licenses/by/4.0/).
Share and Cite
Marco-Gracia, F.J.; López-Antón, M. Rethinking the Fertility Transition in Rural Aragón (Spain) Using Height Data. Int. J. Environ. Res. Public Health 2021, 18, 8338. https://doi.org/10.3390/ijerph18168338
Marco-Gracia FJ, López-Antón M. Rethinking the Fertility Transition in Rural Aragón (Spain) Using Height Data. International Journal of Environmental Research and Public Health. 2021; 18(16):8338. https://doi.org/10.3390/ijerph18168338
Chicago/Turabian StyleMarco-Gracia, Francisco J., and Margarita López-Antón. 2021. "Rethinking the Fertility Transition in Rural Aragón (Spain) Using Height Data" International Journal of Environmental Research and Public Health 18, no. 16: 8338. https://doi.org/10.3390/ijerph18168338
APA StyleMarco-Gracia, F. J., & López-Antón, M. (2021). Rethinking the Fertility Transition in Rural Aragón (Spain) Using Height Data. International Journal of Environmental Research and Public Health, 18(16), 8338. https://doi.org/10.3390/ijerph18168338


