
Effect of Resonant Frequency Vibration on Delayed Onset Muscle Soreness and Resulting Stiffness as Measured by Shear-Wave Elastography

 and
and
Abstract
:1. Introduction
2. Materials and Methods
2.1. Experimental Design
2.2. Participants
2.3. Maximal Isometric Strength and EIMD Protocol
2.4. Muscle Soreness
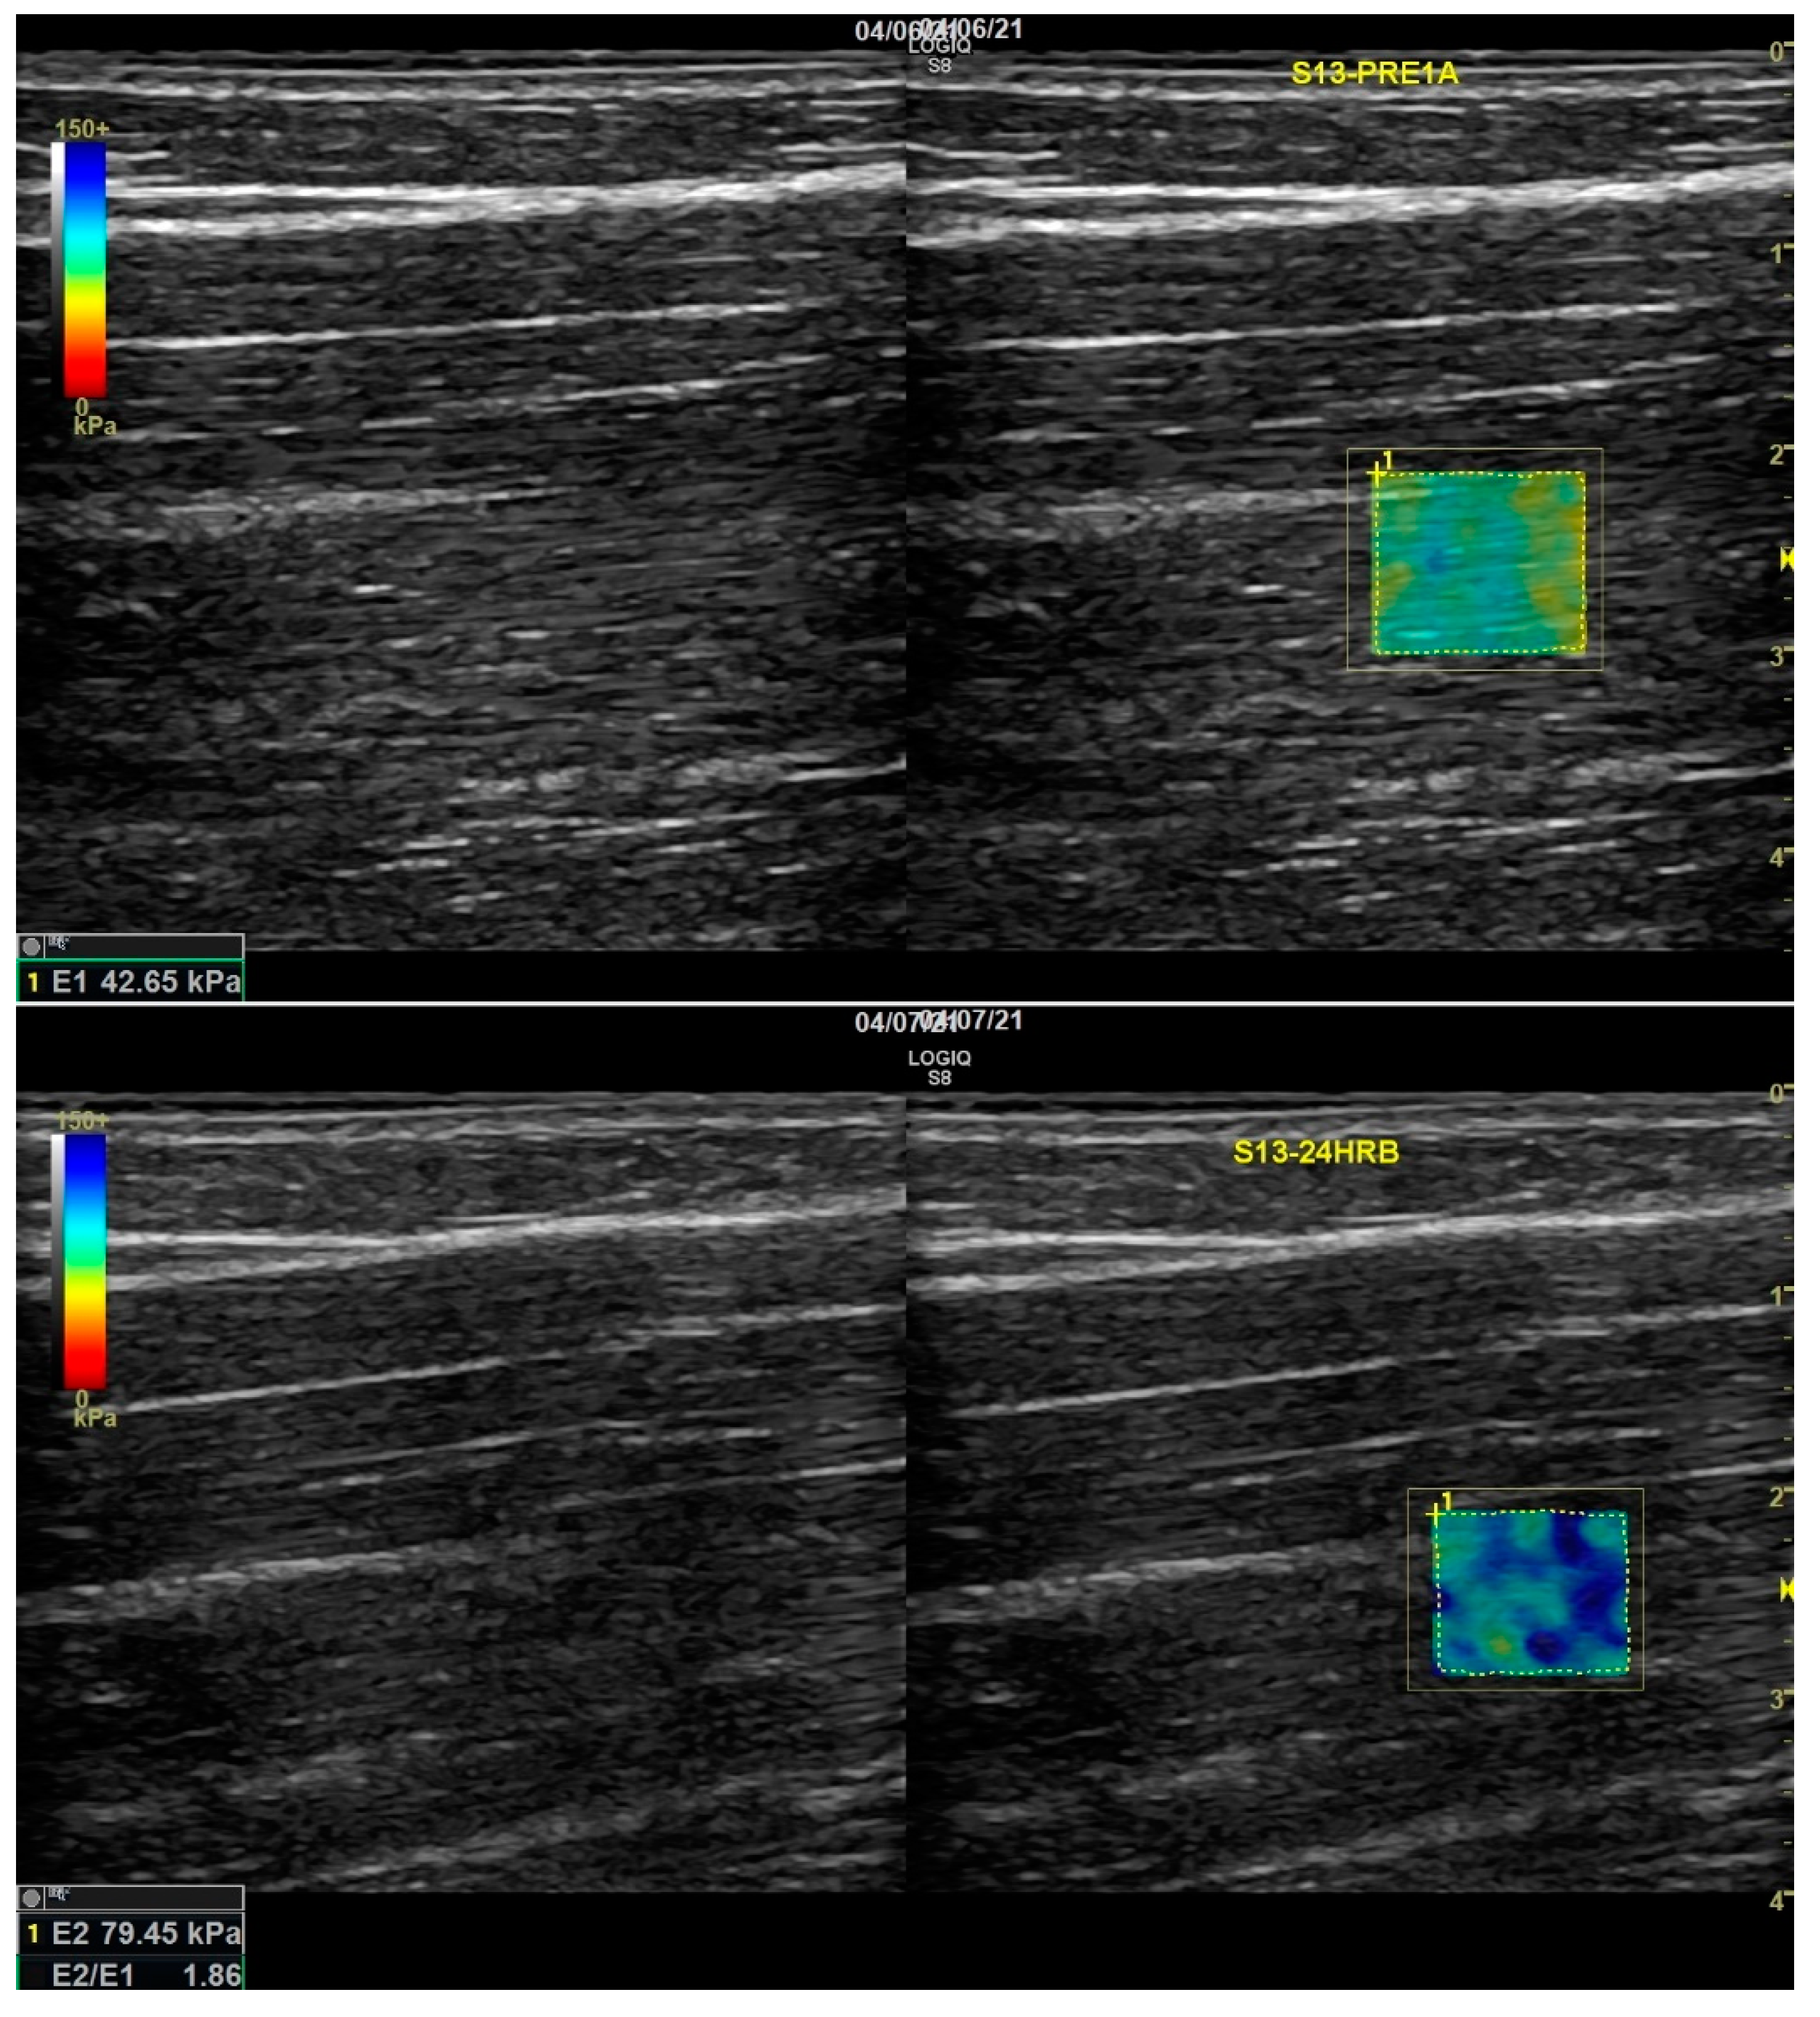
2.5. Shear Wave Elastography (Stiffness)
2.6. WBV
2.6.1. Calculating Vibration Resonance of the Biceps Brachii
2.6.2. Whole-Body Vibration Platform Assessment
2.7. Statistical Analysis
3. Results
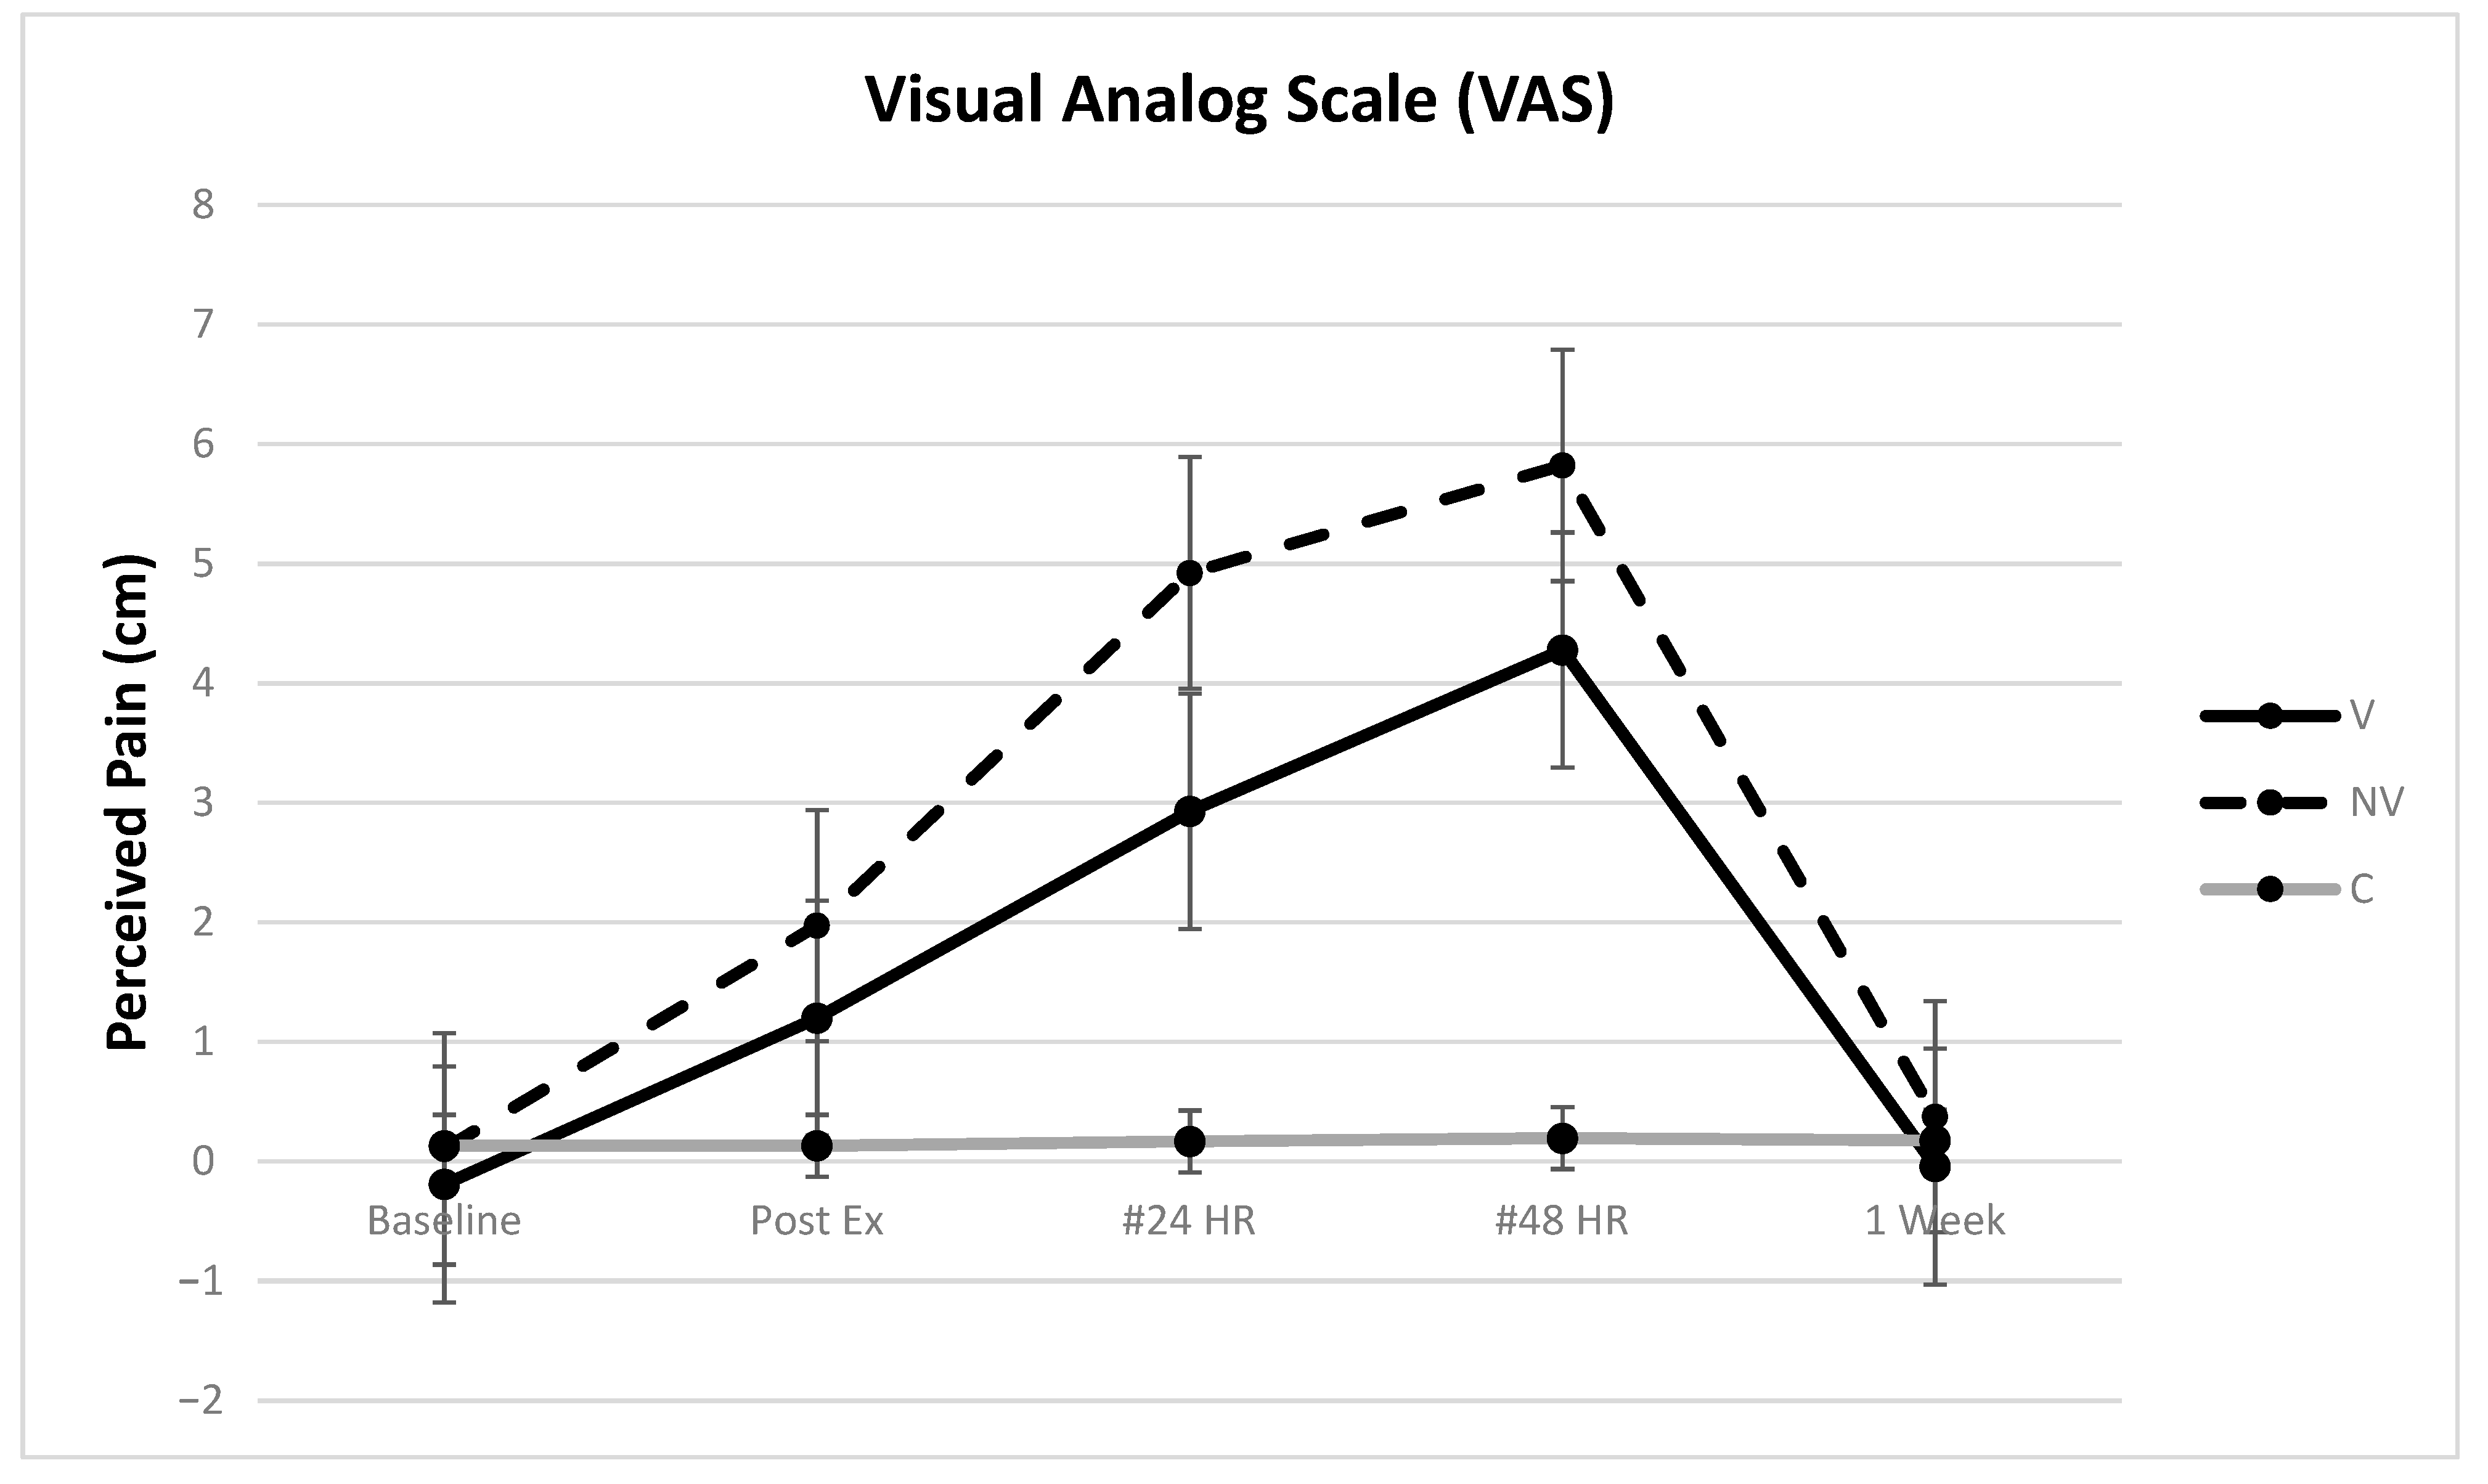
3.1. VAS
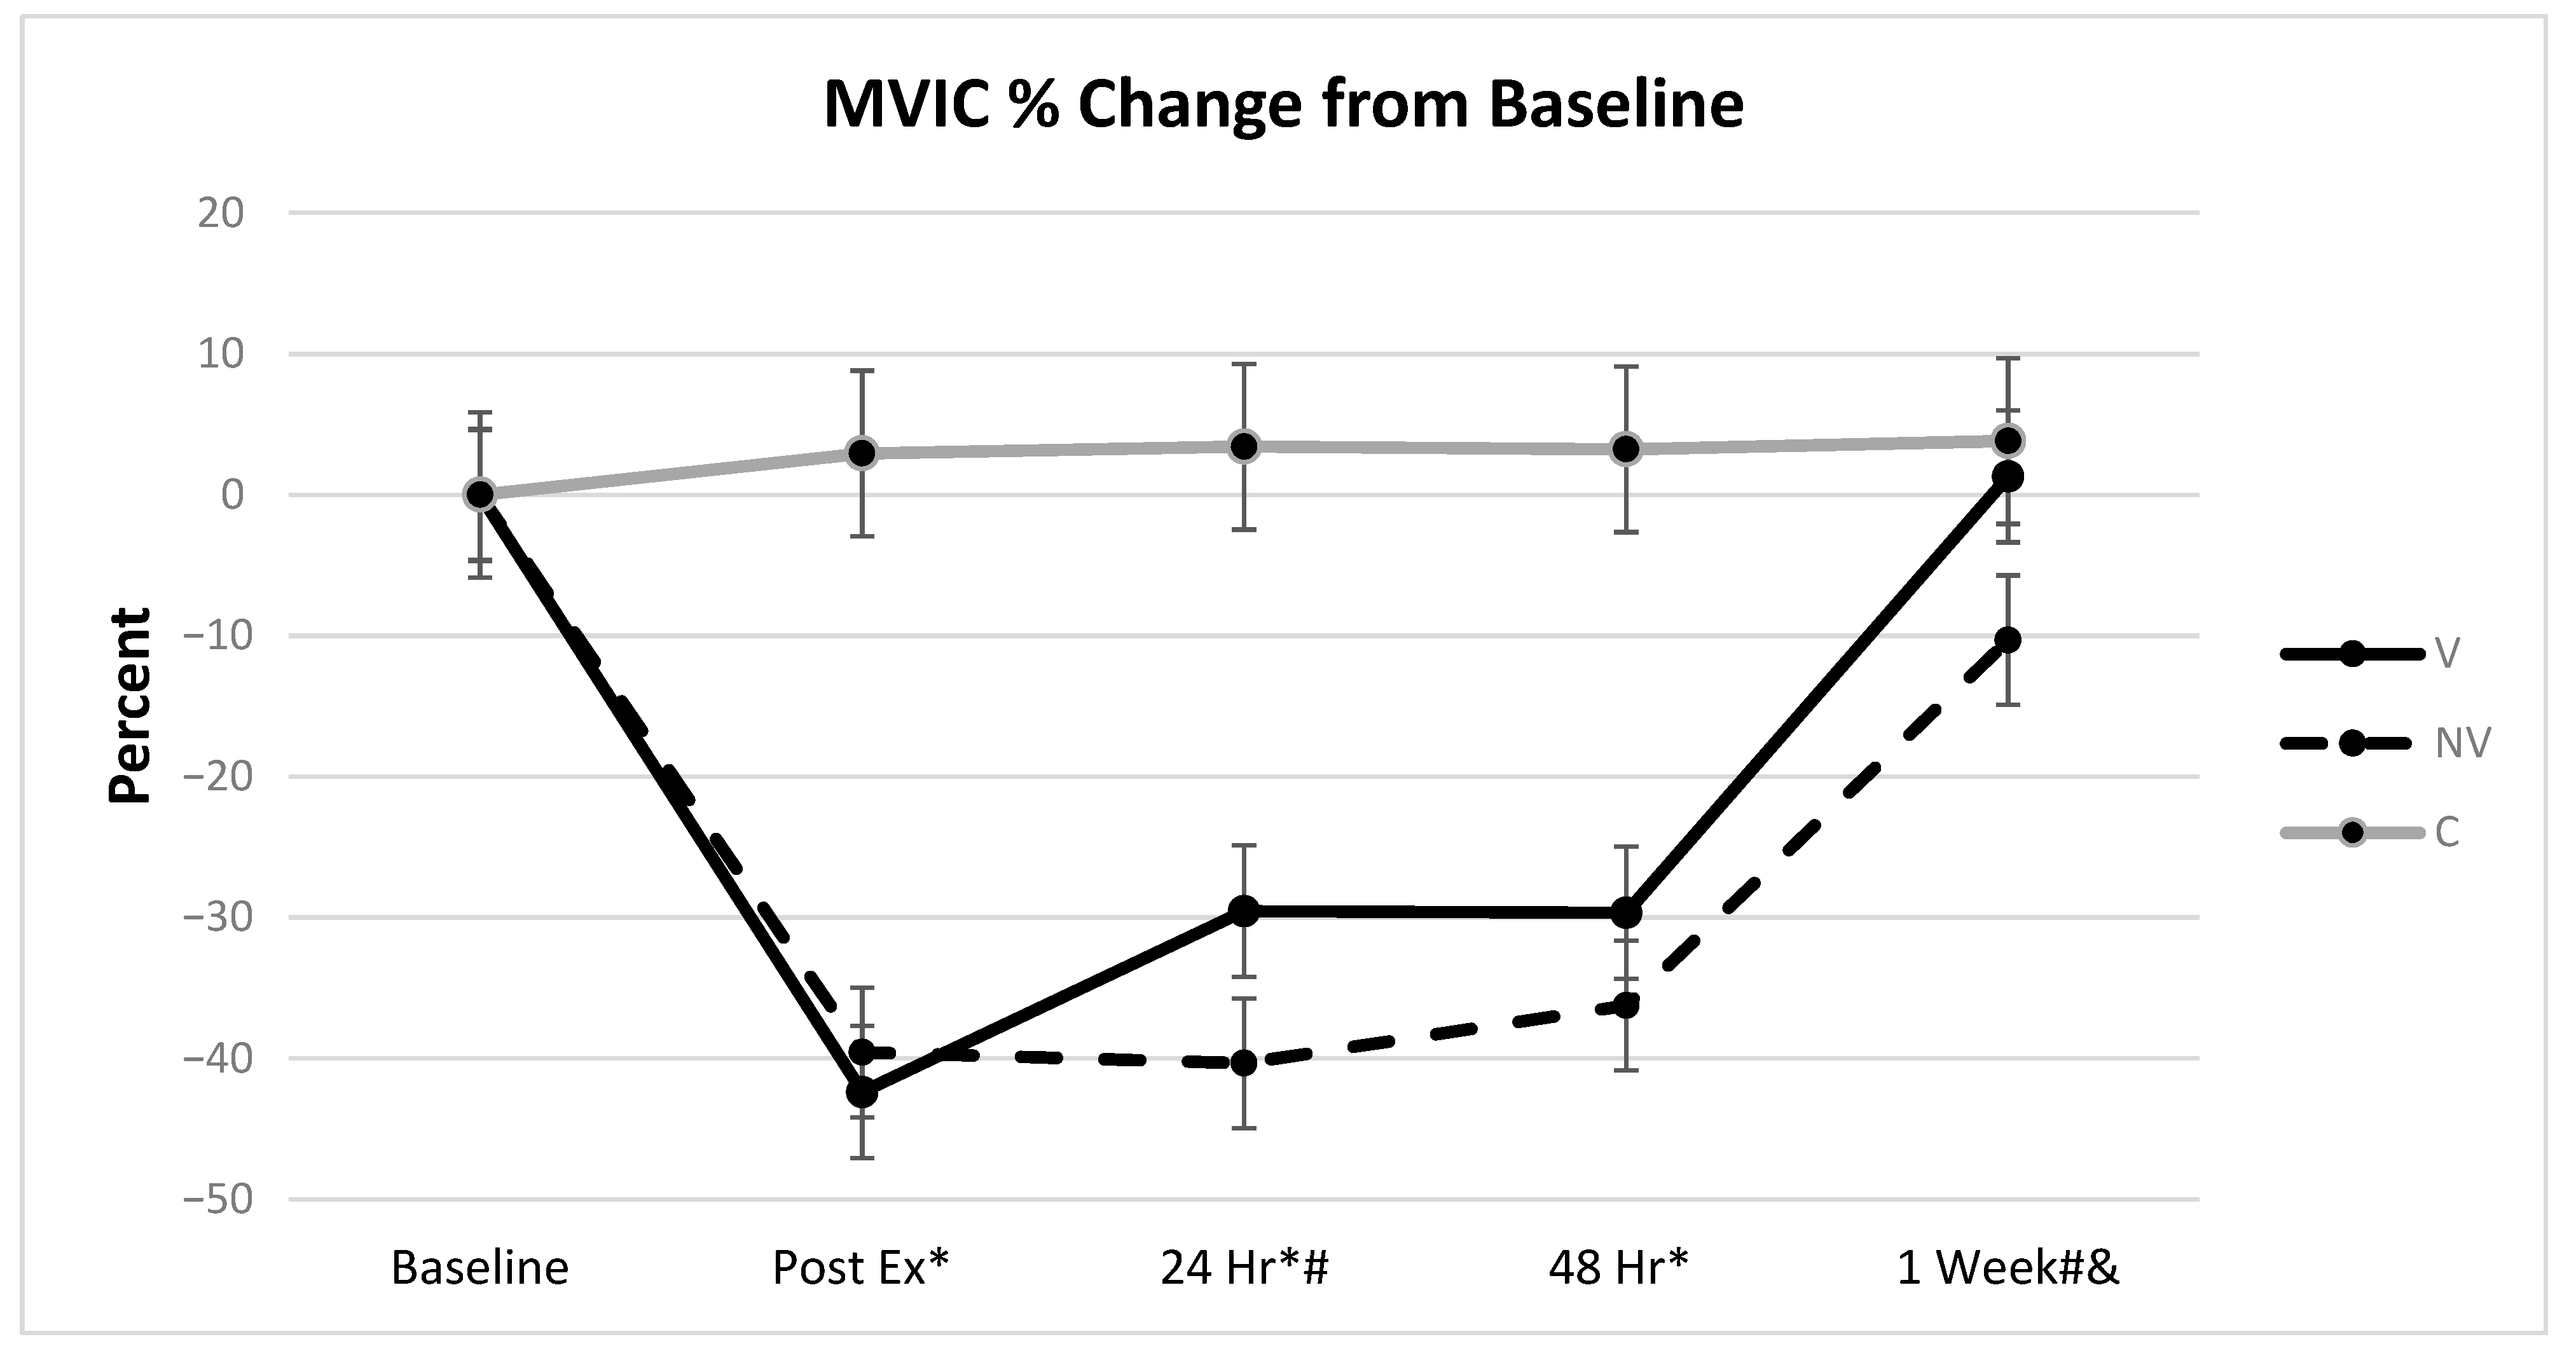
3.2. MVIC
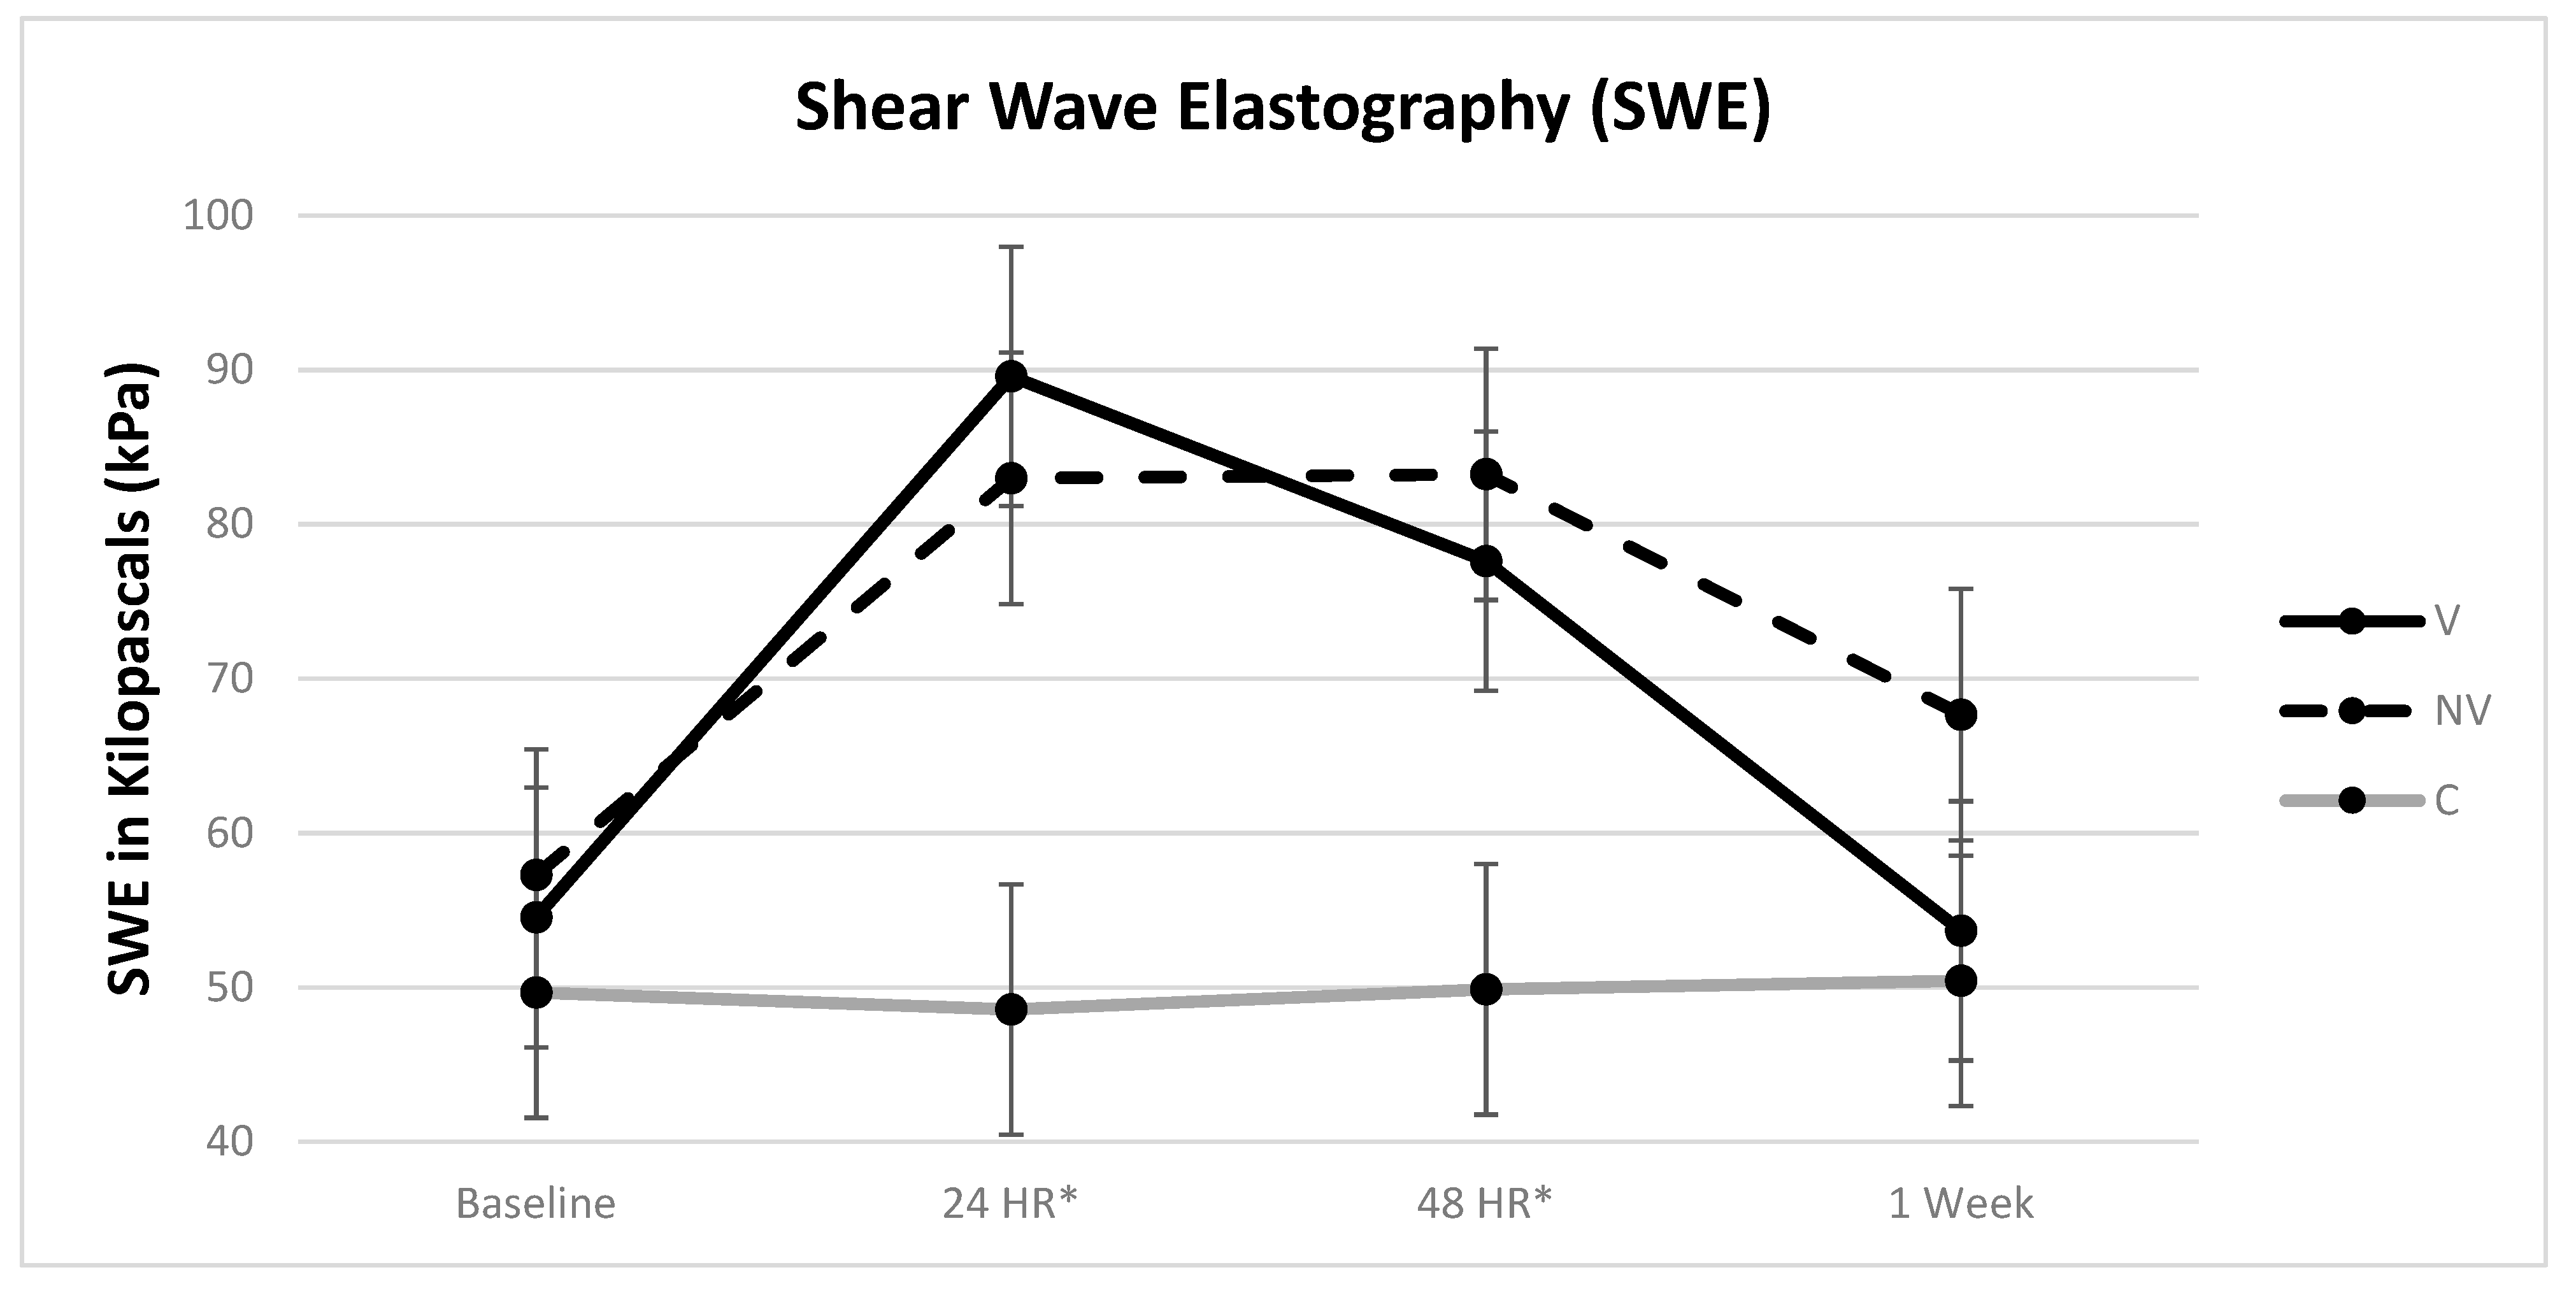
3.3. SWE (Stiffness)
4. Discussion
5. Conclusions
Author Contributions
Funding
Institutional Review Board Statement
Informed Consent Statement
Data Availability Statement
Acknowledgments
Conflicts of Interest
References
- Kohne, J.L.; Ormsbee, M.J.; McKune, A.J. Supplementation Strategies to Reduce Muscle Damage and Improve Recovery Following Exercise in Females: A Systematic Review. Sports 2016, 4, 51. [Google Scholar] [CrossRef] [Green Version]
- Hedayatpour, N.; Falla, D.; Arendt-Nielsen, L.; Farina, D. Effect of delayed-onset muscle soreness on muscle recovery after a fatiguing isometric contraction. Scand. J. Med. Sci. Sports 2010, 20, 145–153. [Google Scholar] [CrossRef]
- Raastad, T.; Owe, S.G.; Paulsen, G.; Enns, D.; Overgaard, K.; Crameri, R.; Kiil, S.; Belcastro, A.; Bergersen, L.; Hallen, J. Changes in calpain activity, muscle structure, and function after eccentric exercise. Med. Sci. Sports Exerc. 2010, 42, 86–95. [Google Scholar] [CrossRef] [PubMed]
- Malm, C.; Yu, J.G. Exercise-induced muscle damage and inflammation: Re-evaluation by proteomics. Histochem. Cell Biol. 2012, 138, 89–99. [Google Scholar] [CrossRef]
- Brown, L.M.; Hill, L. Some observations on variations in filament overlap in tetanized muscle fibres and fibres stretched during a tetanus, detected in the electron microscope after rapid fixation. J. Muscle Res. Cell Motil. 1991, 12, 171–182. [Google Scholar] [CrossRef] [PubMed]
- van de Vyver, M.; Myburgh, K.H. Cytokine and satellite cell responses to muscle damage: Interpretation and possible confounding factors in human studies. J. Muscle Res. Cell Motil. 2012, 33, 177–185. [Google Scholar] [CrossRef] [Green Version]
- Peake, J.M.; Neubauer, O.; Della Gatta, P.A.; Nosaka, K. Muscle damage and inflammation during recovery from exercise. J. Appl. Physiol. 2017, 122, 559–570. [Google Scholar] [CrossRef]
- Paulsen, G.; Mikkelsen, U.R.; Raastad, T.; Peake, J.M. Leucocytes, cytokines and satellite cells: What role do they play in muscle damage and regeneration following eccentric exercise? Exerc. Immunol. Rev. 2012, 18, 42–97. [Google Scholar] [PubMed]
- Cheung, K.; Hume, P.; Maxwell, L. Delayed onset muscle soreness: Treatment strategies and performance factors. Sports Med. 2003, 33, 145–164. [Google Scholar] [CrossRef]
- Sellwood, K.L.; Brukner, P.; Williams, D.; Nicol, A.; Hinman, R. Ice-water immersion and delayed-onset muscle soreness: A randomised controlled trial. Br. J. Sports Med. 2007, 41, 392–397. [Google Scholar] [CrossRef] [PubMed] [Green Version]
- Peake, J.M.; Roberts, L.A.; Figueiredo, V.C.; Egner, I.; Krog, S.; Aas, S.N.; Suzuki, K.; Markworth, J.F.; Coombes, J.S.; Cameron-Smith, D.; et al. The effects of cold water immersion and active recovery on inflammation and cell stress responses in human skeletal muscle after resistance exercise. J. Physiol. 2017, 595, 695–711. [Google Scholar] [CrossRef] [PubMed]
- Guo, J.; Li, L.; Gong, Y.; Zhu, R.; Xu, J.; Zou, J.; Chen, X. Massage Alleviates Delayed Onset Muscle Soreness after Strenuous Exercise: A Systematic Review and Meta-Analysis. Front. Physiol. 2017, 8, 747. [Google Scholar] [CrossRef] [Green Version]
- Marques-Jimenez, D.; Calleja-Gonzalez, J.; Arratibel, I.; Delextrat, A.; Terrados, N. Are compression garments effective for the recovery of exercise-induced muscle damage? A systematic review with meta-analysis. Physiol. Behav. 2016, 153, 133–148. [Google Scholar] [CrossRef]
- Leeder, J.; Gissane, C.; van Someren, K.; Gregson, W.; Howatson, G. Cold water immersion and recovery from strenuous exercise: A meta-analysis. Br. J. Sports Med. 2012, 46, 233–240. [Google Scholar] [CrossRef]
- Kosar, A.C.; Candow, D.G.; Putland, J.T. Potential beneficial effects of whole-body vibration for muscle recovery after exercise. J. Strength Cond. Res. 2012, 26, 2907–2911. [Google Scholar] [CrossRef]
- Magoffin, R.D.; Parcell, A.C.; Hyldahl, R.D.; Fellingham, G.W.; Hopkins, J.T.; Feland, J.B. Whole-Body Vibration as a Warm-up Before Exercise-Induced Muscle Damage on Symptoms of Delayed-Onset Muscle Soreness in Trained Subjects. J. Strength Cond. Res. 2018. [Google Scholar] [CrossRef]
- Aminian-Far, A.; Hadian, M.R.; Olyaei, G.; Talebian, S.; Bakhtiary, A.H. Whole-body vibration and the prevention and treatment of delayed-onset muscle soreness. J. Athl. Train. 2011, 46, 43–49. [Google Scholar] [CrossRef] [Green Version]
- Kerschan-Schindl, K.; Grampp, S.; Henk, C.; Resch, H.; Preisinger, E.; Fialka-Moser, V.; Imhof, H. Whole-body vibration exercise leads to alterations in muscle blood volume. Clin. Physiol. 2001, 21, 377–382. [Google Scholar] [CrossRef] [PubMed]
- Betik, A.C.; Parker, L.; Kaur, G.; Wadley, G.D.; Keske, M.A. Whole-Body Vibration Stimulates Microvascular Blood Flow in Skeletal Muscle. Med. Sci. Sports Exerc. 2021, 53, 375–383. [Google Scholar] [CrossRef]
- Fuller, J.T.; Thomson, R.L.; Howe, P.R.; Buckley, J.D. Effect of vibration on muscle perfusion: A systematic review. Clin. Physiol. Funct. Imaging 2013, 33, 1–10. [Google Scholar] [CrossRef] [PubMed]
- Cochrane, D.J.; Stannard, S.R.; Firth, E.C.; Rittweger, J. Comparing muscle temperature during static and dynamic squatting with and without whole-body vibration. Clin. Physiol. Funct. Imaging 2010, 30, 223–229. [Google Scholar] [CrossRef]
- Dabbs, N.C.; Black, C.D.; Garner, J. Whole-Body Vibration While Squatting and Delayed-Onset Muscle Soreness in Women. J. Athl. Train. 2015, 50, 1233–1239. [Google Scholar] [CrossRef] [Green Version]
- Wheeler, A.A.; Jacobson, B.H. Effect of whole-body vibration on delayed onset muscular soreness, flexibility, and power. J. Strength Cond. Res. 2013, 27, 2527–2532. [Google Scholar] [CrossRef] [PubMed]
- Rhea, M.R.; Bunker, D.; Marin, P.J.; Lunt, K. Effect of iTonic whole-body vibration on delayed-onset muscle soreness among untrained individuals. J. Strength Cond. Res. 2009, 23, 1677–1682. [Google Scholar] [CrossRef] [Green Version]
- Andonian, P.; Viallon, M.; Le Goff, C.; de Bourguignon, C.; Tourel, C.; Morel, J.; Giardini, G.; Gergele, L.; Millet, G.P.; Croisille, P. Shear-Wave Elastography Assessments of Quadriceps Stiffness Changes prior to, during and after Prolonged Exercise: A Longitudinal Study during an Extreme Mountain Ultra-Marathon. PLoS ONE 2016, 11, e0161855. [Google Scholar] [CrossRef]
- Lacourpaille, L.; Nordez, A.; Hug, F.; Doguet, V.; Andrade, R.; Guilhem, G. Early detection of exercise-induced muscle damage using elastography. Eur. J. Appl. Physiol. 2017, 117, 2047–2056. [Google Scholar] [CrossRef] [PubMed]
- Xie, Y.; Thomas, L.; Hug, F.; Johnston, V.; Coombes, B.K. Quantifying cervical and axioscapular muscle stiffness using shear wave elastography. J. Electromyogr. Kinesiol. 2019, 48, 94–102. [Google Scholar] [CrossRef] [PubMed]
- Alfuraih, A.M.; Tan, A.L.; O’Connor, P.; Emery, P.; Wakefield, R.J. The effect of ageing on shear wave elastography muscle stiffness in adults. Aging Clin. Exp. Res. 2019, 31, 1755–1763. [Google Scholar] [CrossRef] [Green Version]
- Davis, L.C.; Baumer, T.G.; Bey, M.J.; Holsbeeck, M.V. Clinical utilization of shear wave elastography in the musculoskeletal system. Ultrasonography 2019, 38, 2–12. [Google Scholar] [CrossRef]
- Eby, S.F.; Song, P.; Chen, S.; Chen, Q.; Greenleaf, J.F.; An, K.N. Validation of shear wave elastography in skeletal muscle. J. Biomech. 2013, 46, 2381–2387. [Google Scholar] [CrossRef] [PubMed] [Green Version]
- Lacourpaille, L.; Gross, R.; Hug, F.; Guevel, A.; Pereon, Y.; Magot, A.; Hogrel, J.Y.; Nordez, A. Effects of Duchenne muscular dystrophy on muscle stiffness and response to electrically-induced muscle contraction: A 12-month follow-up. Neuromuscul. Disord. 2017, 27, 214–220. [Google Scholar] [CrossRef] [PubMed]
- Alfuraih, A.M.; O’Connor, P.; Tan, A.L.; Hensor, E.M.A.; Ladas, A.; Emery, P.; Wakefield, R.J. Muscle shear wave elastography in idiopathic inflammatory myopathies: A case-control study with MRI correlation. Skeletal Radiol. 2019, 48, 1209–1219. [Google Scholar] [CrossRef] [PubMed] [Green Version]
- Delecluse, C.; Roelants, M.; Verschueren, S. Strength increase after whole-body vibration compared with resistance training. Med. Sci. Sports Exerc. 2003, 35, 1033–1041. [Google Scholar] [CrossRef] [PubMed]
- von Elm, E.; Altman, D.G.; Egger, M.; Pocock, S.J.; Gotzsche, P.C.; Vandenbroucke, J.P.; Initiative, S. The Strengthening the Reporting of Observational Studies in Epidemiology (STROBE) Statement: Guidelines for reporting observational studies. Int. J. Surg. 2014, 12, 1495–1499. [Google Scholar] [CrossRef] [Green Version]
- Williamson, A.; Hoggart, B. Pain: A review of three commonly used pain rating scales. J. Clin. Nurs. 2005, 14, 798–804. [Google Scholar] [CrossRef] [PubMed]
- Dubois, G.; Kheireddine, W.; Vergari, C.; Bonneau, D.; Thoreux, P.; Rouch, P.; Tanter, M.; Gennisson, J.L.; Skalli, W. Reliable protocol for shear wave elastography of lower limb muscles at rest and during passive stretching. Ultrasound Med. Biol. 2015, 41, 2284–2291. [Google Scholar] [CrossRef] [Green Version]
- Taljanovic, M.S.; Gimber, L.H.; Becker, G.W.; Latt, L.D.; Klauser, A.S.; Melville, D.M.; Gao, L.; Witte, R.S. Shear-Wave Elastography: Basic Physics and Musculoskeletal Applications. Radiographics 2017, 37, 855–870. [Google Scholar] [CrossRef] [Green Version]
- Agten, C.A.; Buck, F.M.; Dyer, L.; Fluck, M.; Pfirrmann, C.W.; Rosskopf, A.B. Delayed-Onset Muscle Soreness: Temporal Assessment With Quantitative MRI and Shear-Wave Ultrasound Elastography. AJR Am. J. Roentgenol. 2017, 208, 402–412. [Google Scholar] [CrossRef]
- Alfuraih, A.M.; O’Connor, P.; Tan, A.L.; Hensor, E.; Emery, P.; Wakefield, R.J. An investigation into the variability between different shear wave elastography systems in muscle. Med. Ultrason 2017, 19, 392–400. [Google Scholar] [CrossRef] [Green Version]
- Cochrane, D.J.; Black, M.J.; Barnes, M.J. Does acute side-alternating vibration exercise enhance ballistic upper-body power? Int. J. Sports Med. 2014, 35, 1006–1011. [Google Scholar] [CrossRef] [PubMed]
- Marin, P.J.; Herrero, A.J.; Milton, J.G.; Hazell, T.J.; Garcia-Lopez, D. Whole-body vibration applied during upper body exercise improves performance. J. Strength Cond. Res. 2013, 27, 1807–1812. [Google Scholar] [CrossRef] [Green Version]
- Marin, P.J.; Herrero, A.J.; Sainz, N.; Rhea, M.R.; Garcia-Lopez, D. Effects of different magnitudes of whole-body vibration on arm muscular performance. J. Strength Cond. Res. 2010, 24, 2506–2511. [Google Scholar] [CrossRef] [PubMed] [Green Version]
- Marin, P.J.; Torres-Luque, G.; Hernandez-Garcia, R.; Garcia-Lopez, D.; Garatachea, N. Effects of different vibration exercises on bench press. Int. J. Sports Med. 2011, 32, 743–748. [Google Scholar] [CrossRef] [PubMed]
- Cochrane, D.J.; Loram, I.D.; Stannard, S.R.; Rittweger, J. Changes in joint angle, muscle-tendon complex length, muscle contractile tissue displacement, and modulation of EMG activity during acute whole-body vibration. Muscle Nerve 2009, 40, 420–429. [Google Scholar] [CrossRef] [PubMed]
- Fratini, A.; La Gatta, A.; Bifulco, P.; Romano, M.; Cesarelli, M. Muscle motion and EMG activity in vibration treatment. Med. Eng. Phys. 2009, 31, 1166–1172. [Google Scholar] [CrossRef] [PubMed]
- Rauch, F.; Sievanen, H.; Boonen, S.; Cardinale, M.; Degens, H.; Felsenberg, D.; Roth, J.; Schoenau, E.; Verschueren, S.; Rittweger, J.; et al. Reporting whole-body vibration intervention studies: Recommendations of the International Society of Musculoskeletal and Neuronal Interactions. J. Musculoskelet. Neuronal Interact. 2010, 10, 193–198. [Google Scholar] [PubMed]
- Lau, W.Y.; Nosaka, K. Effect of Vibration Treatment on Symptoms Associated with Eccentric Exercise-Induced Muscle Damage. Am. J. Phys. Med. Rehab. 2011, 90, 648–657. [Google Scholar] [CrossRef] [PubMed]
- Timon, R.; Tejero, J.; Brazo-Sayavera, J.; Crespo, C.; Olcina, G. Effects of whole-body vibration after eccentric exercise on muscle soreness and muscle strength recovery. J. Phys. Ther. Sci. 2016, 28, 1781–1785. [Google Scholar] [CrossRef] [Green Version]
- Cochrane, D.J. Effectiveness of using wearable vibration therapy to alleviate muscle soreness. Eur. J. Appl. Physiol. 2017, 117, 501–509. [Google Scholar] [CrossRef] [PubMed]
- Fuller, J.T.; Thomson, R.L.; Howe, P.R.; Buckley, J.D. Vibration Therapy Is No More Effective Than the Standard Practice of Massage and Stretching for Promoting Recovery from Muscle Damage After Eccentric Exercise. Clin. J. Sport Med. 2015, 25, 332–337. [Google Scholar] [CrossRef]
- Romero-Moraleda, B.; Gonzalez-Garcia, J.; Cuellar-Rayo, A.; Balsalobre-Fernandez, C.; Munoz-Garcia, D.; Morencos, E. Effects of Vibration and Non-Vibration Foam Rolling on Recovery after Exercise with Induced Muscle Damage. J. Sports Sci. Med. 2019, 18, 172–180. [Google Scholar]
- Barnes, M.J.; Perry, B.G.; Mundel, T.; Cochrane, D.J. The effects of vibration therapy on muscle force loss following eccentrically induced muscle damage. Eur. J. Appl. Physiol. 2012, 112, 1189–1194. [Google Scholar] [CrossRef]
- Bakhtiary, A.H.; Safavi-Farokhi, Z.; Aminian-Far, A. Influence of vibration on delayed onset of muscle soreness following eccentric exercise. Br. J. Sports Med. 2007, 41, 145–148. [Google Scholar] [CrossRef] [Green Version]
- Serravite, D.H.; Perry, A.; Jacobs, K.A.; Adams, J.A.; Harriell, K.; Signorile, J.F. Effect of whole-body periodic acceleration on exercise-induced muscle damage after eccentric exercise. Int. J. Sports Physiol. Perform. 2014, 9, 985–992. [Google Scholar] [CrossRef]
- Adams, J.A.; Wu, H.; Bassuk, J.A.; Arias, J.; Uryash, A.; Jorapur, V.; Lamas, G.A.; Kurlansky, P. Periodic acceleration (pGz) prior to whole body ischemia reperfusion injury provides early cardioprotective preconditioning. Life Sci. 2010, 86, 707–715. [Google Scholar] [CrossRef] [PubMed]
- Lopez, J.R.; Uryash, A.; Kolster, J.; Esteve, E.; Zhang, R.; Adams, J.A. Enhancing Endogenous Nitric Oxide by Whole Body Periodic Acceleration Elicits Neuroprotective Effects in Dystrophic Neurons. Mol. Neurobiol. 2018, 55, 8680–8694. [Google Scholar] [CrossRef] [PubMed]
- Johnson, P.K.; Feland, J.B.; Johnson, A.W.; Mack, G.W.; Mitchell, U.H. Effect of whole body vibration on skin blood flow and nitric oxide production. J. Diabetes Sci. Technol. 2014, 8, 889–894. [Google Scholar] [CrossRef] [PubMed] [Green Version]
- Maloney-Hinds, C.; Petrofsky, J.S.; Zimmerman, G.; Hessinger, D.A. The role of nitric oxide in skin blood flow increases due to vibration in healthy adults and adults with type 2 diabetes. Diabetes Technol. Ther. 2009, 11, 39–43. [Google Scholar] [CrossRef]
- Games, K.E.; Sefton, J.M.; Wilson, A.E. Whole-body vibration and blood flow and muscle oxygenation: A meta-analysis. J. Athl. Train. 2015, 50, 542–549. [Google Scholar] [CrossRef] [PubMed] [Green Version]
- Rittweger, J. Vibration as an exercise modality: How it may work, and what its potential might be. Eur. J. Appl. Physiol. 2010, 108, 877–904. [Google Scholar] [CrossRef] [Green Version]
- Otsuki, T.; Takanami, Y.; Aoi, W.; Kawai, Y.; Ichikawa, H.; Yoshikawa, T. Arterial stiffness acutely decreases after whole-body vibration in humans. Acta Physiol. 2008, 194, 189–194. [Google Scholar] [CrossRef]
- Rittweger, J.; Ehrig, J.; Just, K.; Mutschelknauss, M.; Kirsch, K.A.; Felsenberg, D. Oxygen uptake in whole-body vibration exercise: Influence of vibration frequency, amplitude, and external load. Int. J. Sports Med. 2002, 23, 428–432. [Google Scholar] [CrossRef] [PubMed] [Green Version]
- Kelly, A.M. Does the clinically significant difference in visual analog scale pain scores vary with gender, age, or cause of pain? Acad. Emerg. Med. 1998, 5, 1086–1090. [Google Scholar] [CrossRef] [PubMed]
- Bills, K.B.; Clarke, T.; Major, G.H.; Jacobson, C.B.; Blotter, J.D.; Feland, J.B.; Steffensen, S.C. Targeted Subcutaneous Vibration With Single-Neuron Electrophysiology As a Novel Method for Understanding the Central Effects of Peripheral Vibrational Therapy in a Rodent Model. Dose Response 2019, 17, 1559325818825172. [Google Scholar] [CrossRef]
- Bills, K.B.; Obray, J.D.; Clarke, T.; Parsons, M.; Brundage, J.; Yang, C.H.; Kim, H.Y.; Yorgason, J.T.; Blotter, J.D.; Steffensen, S.C. Mechanical stimulation of cervical vertebrae modulates the discharge activity of ventral tegmental area neurons and dopamine release in the nucleus accumbens. Brain Stimul. 2020, 13, 403–411. [Google Scholar] [CrossRef] [PubMed] [Green Version]
- Peake, J.M.; Suzuki, K.; Wilson, G.; Hordern, M.; Nosaka, K.; Mackinnon, L.; Coombes, J.S. Exercise-induced muscle damage, plasma cytokines, and markers of neutrophil activation. Med. Sci. Sports Exerc. 2005, 37, 737–745. [Google Scholar] [CrossRef] [Green Version]
- Tsuchiya, Y.; Yanagimoto, K.; Ueda, H.; Ochi, E. Supplementation of eicosapentaenoic acid-rich fish oil attenuates muscle stiffness after eccentric contractions of human elbow flexors. J. Int. Soc. Sports Nutr. 2019, 16, 19. [Google Scholar] [CrossRef] [Green Version]
- Sadeghi, S.; Newman, C.; Cortes, D.H. Change in skeletal muscle stiffness after running competition is dependent on both running distance and recovery time: A pilot study. PeerJ 2018, 6. [Google Scholar] [CrossRef] [Green Version]
- Niitsu, M.; Michizaki, A.; Endo, A.; Takei, H.; Yanagisawa, O. Muscle hardness measurement by using ultrasound elastography: A feasibility study. Acta Radiol. 2011, 52, 99–105. [Google Scholar] [CrossRef] [PubMed]
- Hotfiel, T.; Kellermann, M.; Swoboda, B.; Wildner, D.; Golditz, T.; Grim, C.; Raithel, M.; Uder, M.; Heiss, R. Application of Acoustic Radiation Force Impulse Elastography in Imaging of Delayed Onset Muscle Soreness: A Comparative Analysis with 3T MRI. J. Sport Rehabil. 2018, 27, 348–356. [Google Scholar] [CrossRef] [PubMed]
- Heiss, R.; Kellermann, M.; Swoboda, B.; Grim, C.; Lutter, C.; May, M.S.; Wuest, W.; Uder, M.; Nagel, A.M.; Hotfiel, T. Effect of Compression Garments on the Development of Delayed-Onset Muscle Soreness: A Multimodal Approach Using Contrast-Enhanced Ultrasound and Acoustic Radiation Force Impulse Elastography. J. Orthop. Sports Phys. Ther. 2018, 48, 887–894. [Google Scholar] [CrossRef] [PubMed]
- Saeki, J.; Ikezoe, T.; Nakamura, M.; Nishishita, S.; Ichihashi, N. The reliability of shear elastic modulus measurement of the ankle plantar flexion muscles is higher at dorsiflexed position of the ankle. J. Foot Ankle Res. 2017, 10, 18. [Google Scholar] [CrossRef] [PubMed]
- Nosaka, K.; Clarkson, P.M. Changes in indicators of inflammation after eccentric exercise of the elbow flexors. Med. Sci. Sports Exerc. 1996, 28, 953–961. [Google Scholar] [CrossRef] [PubMed]
- Miyamoto, N.; Hirata, K.; Inoue, K.; Hashimoto, T. Muscle Stiffness of the Vastus Lateralis in Sprinters and Long-Distance Runners. Med. Sci. Sports Exerc. 2019, 51, 2080–2087. [Google Scholar] [CrossRef] [PubMed]


| Dependent Variable | Effect | F-Value | p-Value | η2 | Comparison | MDC |
|---|---|---|---|---|---|---|
| VAS | Height | 5.23 | 0.0590 | 0.0177 | C-NV | 1.76 cm |
| Treatment | 16.19 | <0.0001 | 0.1812 | C-V | 1.81 cm | |
| Day | 42.09 | <0.0001 | 0.3060 | V-NV | 1.83 cm | |
| Treatment * Day | 11.41 | <0.0001 | 0.1659 | |||
| MVIC | Age | 12.67 | 0.0006 | 0.0090 | C-NV | 8.42% |
| Height | 7.30 | 0.0083 | 0.0052 | C-V | 8.60% | |
| Treatment | 266.61 | <0.0001 | 0.3798 | V-NV | 8.77% | |
| Day | 69.73 | <0.0001 | 0.3171 | |||
| Treatment * Day | 18.96 | <0.0001 | 0.1984 | |||
| SWE | Height | 2.95 | 0.0898 | 0.0258 | C-NV | 14.95 kPa |
| Treatment | 11.97 | 0.0002 | 0.2839 | C-V | 15.83 kPa | |
| Day | 57.92 | <0.0001 | 0.1803 | V-NV | 15.76 kPa | |
| Treatment * Day | 20.17 | <0.0001 | 0.1256 |
Publisher’s Note: MDPI stays neutral with regard to jurisdictional claims in published maps and institutional affiliations. |
© 2021 by the authors. Licensee MDPI, Basel, Switzerland. This article is an open access article distributed under the terms and conditions of the Creative Commons Attribution (CC BY) license (https://creativecommons.org/licenses/by/4.0/).
Share and Cite
Jones, G.C.; Blotter, J.D.; Smallwood, C.D.; Eggett, D.L.; Cochrane, D.J.; Feland, J.B. Effect of Resonant Frequency Vibration on Delayed Onset Muscle Soreness and Resulting Stiffness as Measured by Shear-Wave Elastography. Int. J. Environ. Res. Public Health 2021, 18, 7853. https://doi.org/10.3390/ijerph18157853
Jones GC, Blotter JD, Smallwood CD, Eggett DL, Cochrane DJ, Feland JB. Effect of Resonant Frequency Vibration on Delayed Onset Muscle Soreness and Resulting Stiffness as Measured by Shear-Wave Elastography. International Journal of Environmental Research and Public Health. 2021; 18(15):7853. https://doi.org/10.3390/ijerph18157853
Chicago/Turabian StyleJones, Garrett C., Jonathan D. Blotter, Cameron D. Smallwood, Dennis L. Eggett, Darryl J. Cochrane, and J. Brent Feland. 2021. "Effect of Resonant Frequency Vibration on Delayed Onset Muscle Soreness and Resulting Stiffness as Measured by Shear-Wave Elastography" International Journal of Environmental Research and Public Health 18, no. 15: 7853. https://doi.org/10.3390/ijerph18157853
APA StyleJones, G. C., Blotter, J. D., Smallwood, C. D., Eggett, D. L., Cochrane, D. J., & Feland, J. B. (2021). Effect of Resonant Frequency Vibration on Delayed Onset Muscle Soreness and Resulting Stiffness as Measured by Shear-Wave Elastography. International Journal of Environmental Research and Public Health, 18(15), 7853. https://doi.org/10.3390/ijerph18157853