
Recurrent Home Flooding in Detroit, MI 2012–2020: Results of a Household Survey

 , , ,
, , ,
Abstract
:1. Introduction
Research Goals
2. Materials and Methods
2.1. Survey of Home Flooding in Detroit
2.2. Neighborhood and Environmental Data
Statistical Methods
3. Results
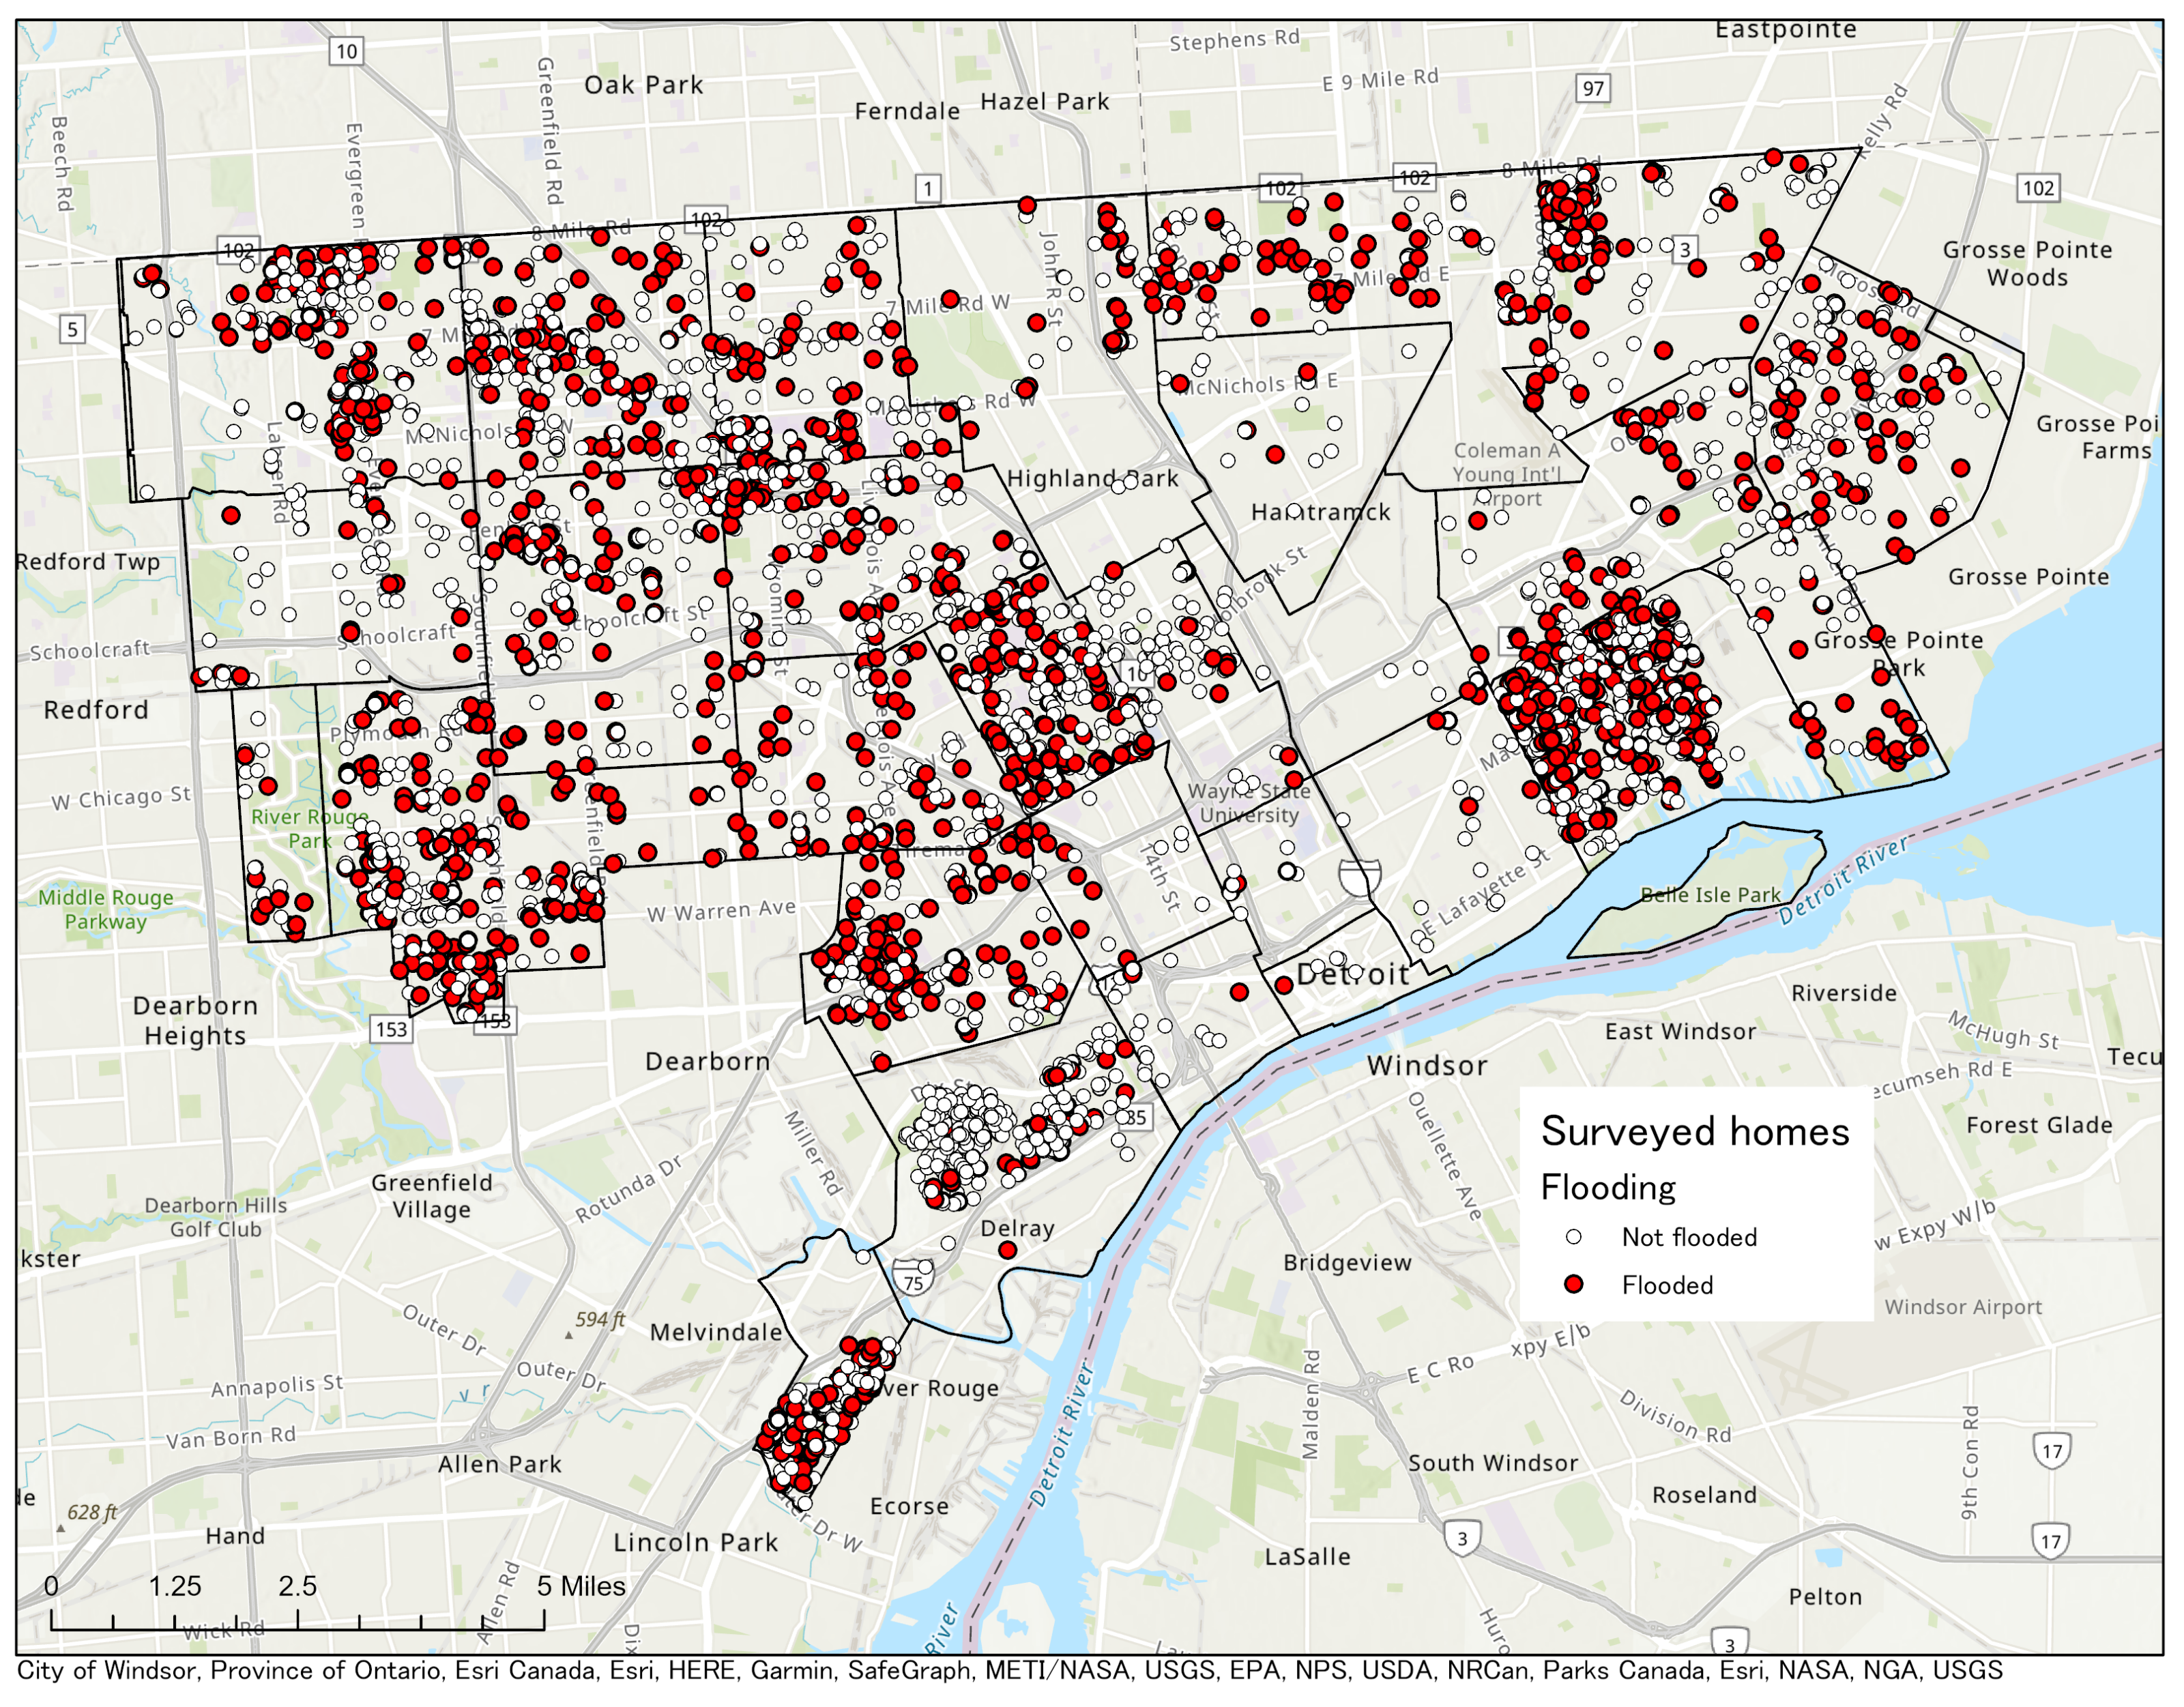
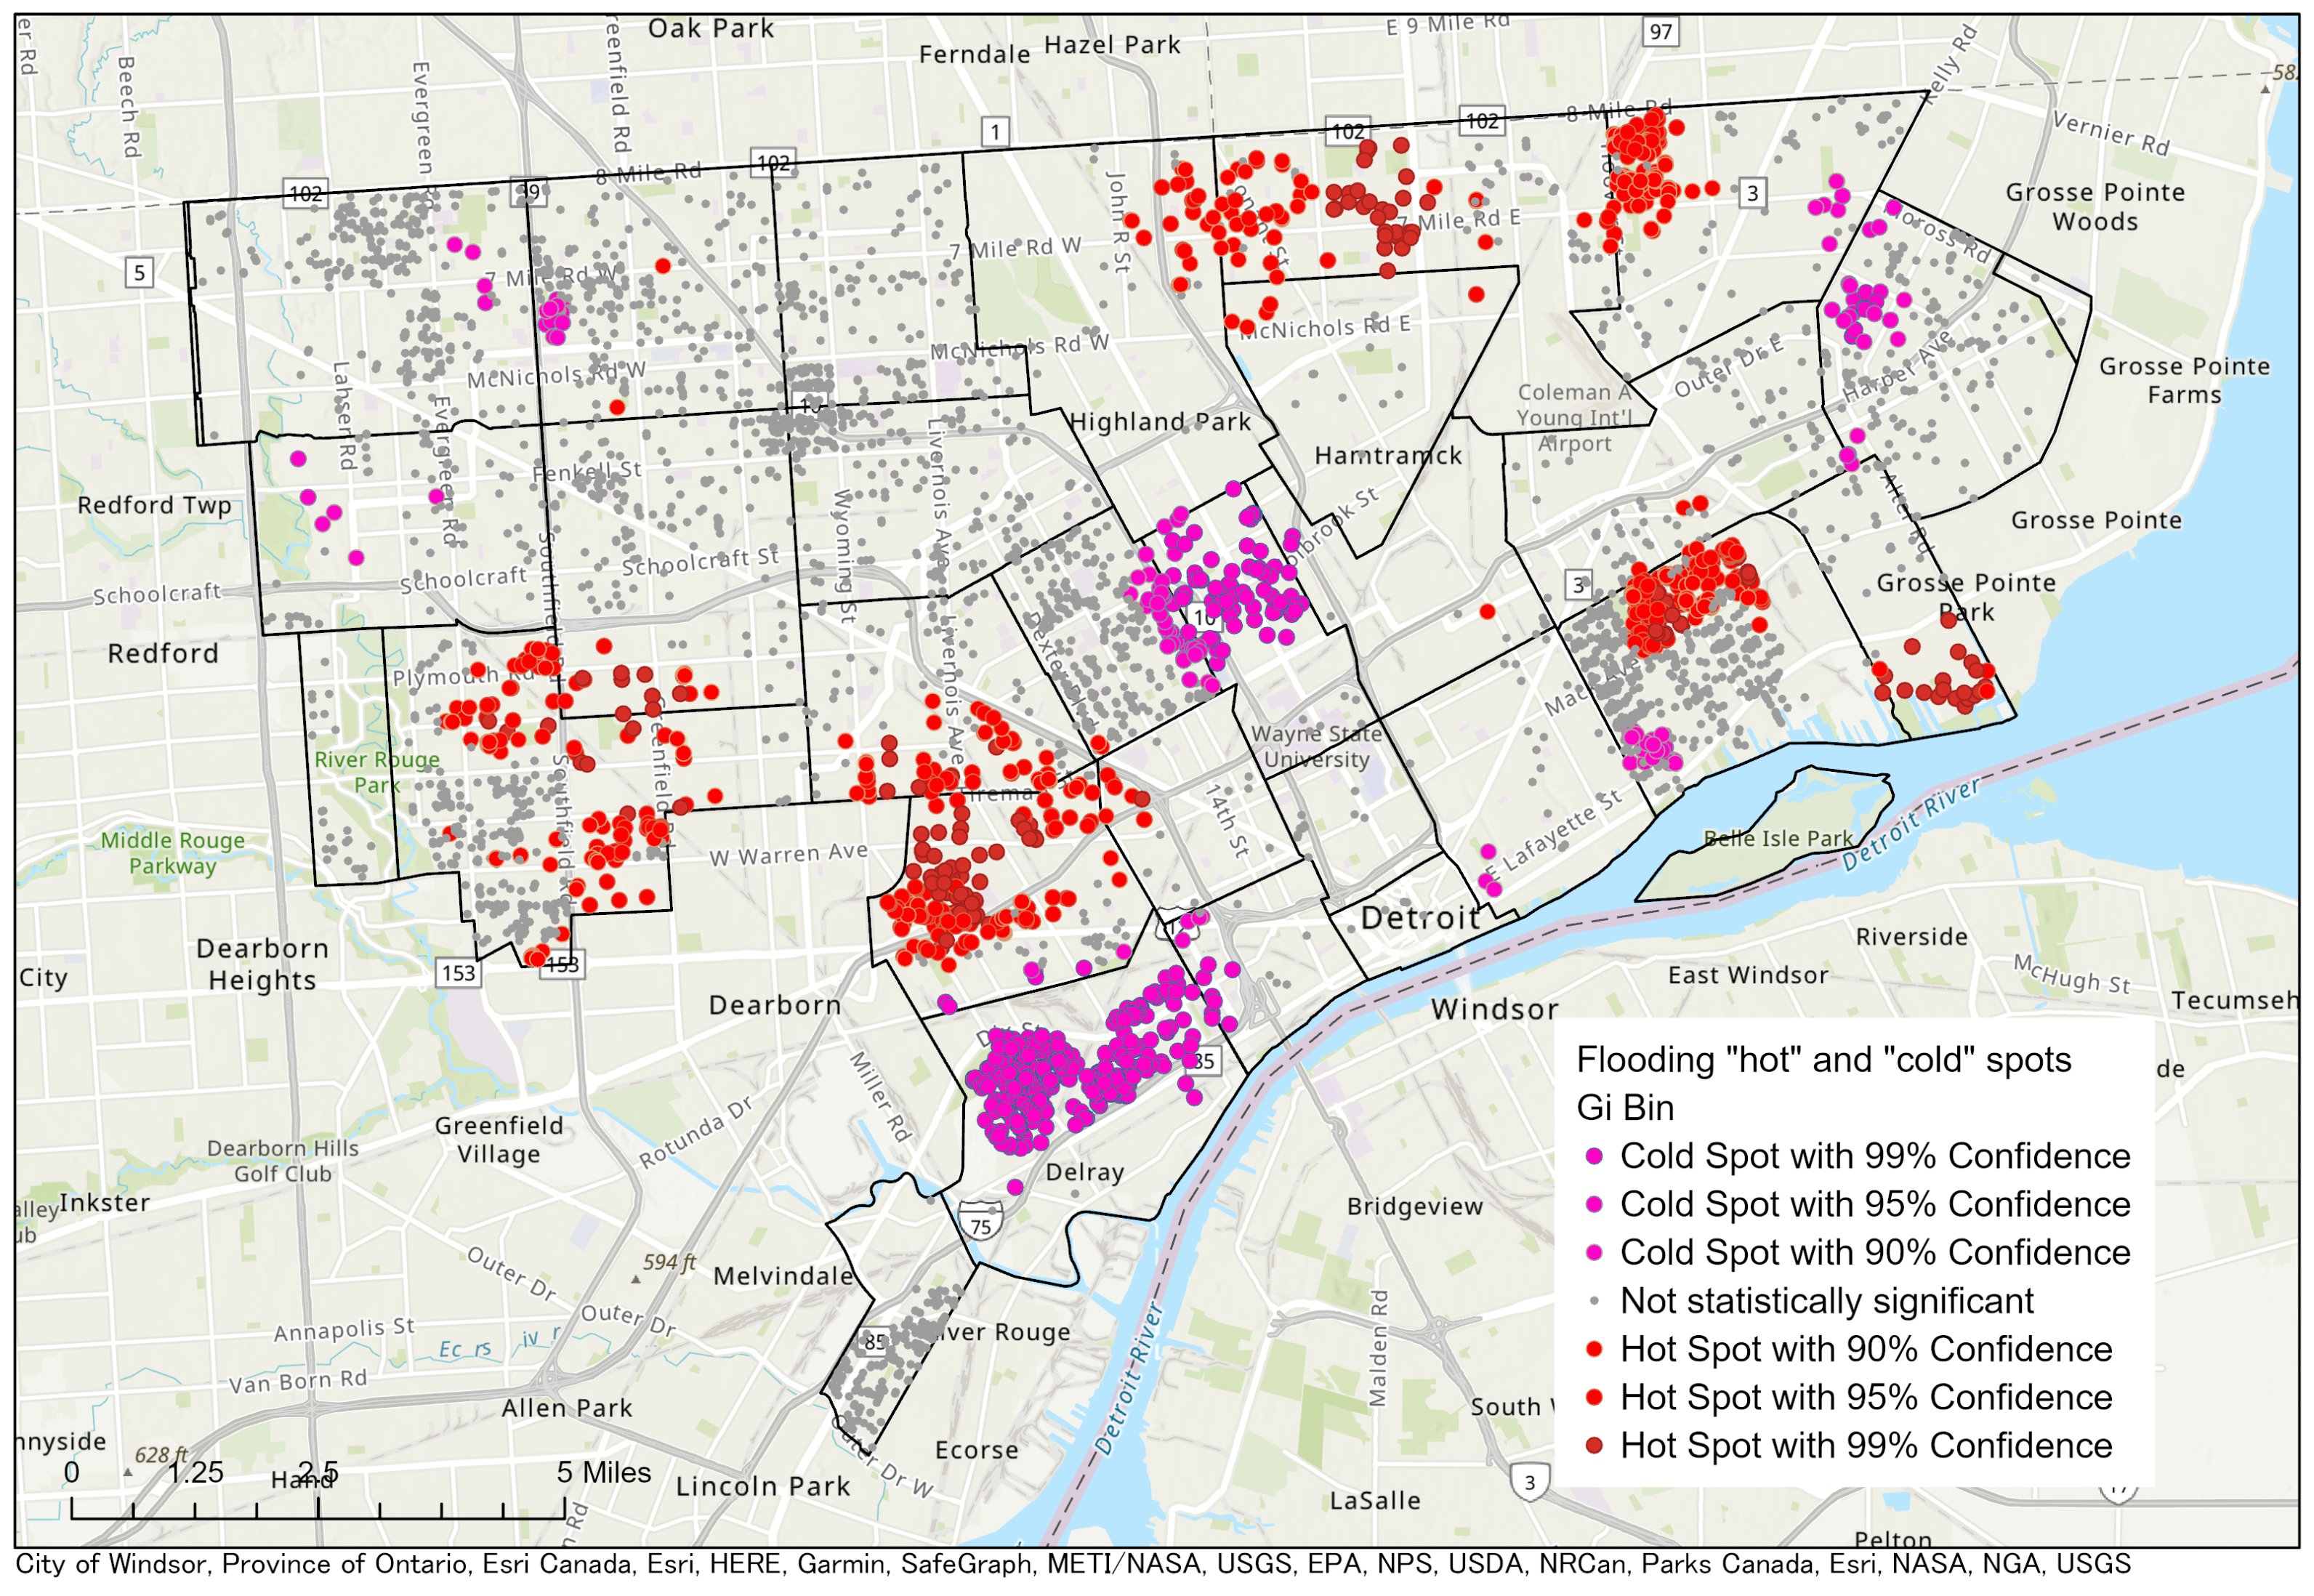
3.1. Spatial Distribution of Flood Risk in Detroit
3.1.1. Household Level Correlates of Home Flooding
3.1.2. Neighborhood (Census Tract) and Environmental Correlates of Home Flooding
3.1.3. Multivariate Model of Home Flooding
3.1.4. Asthma and Home Flooding
4. Discussion
5. Conclusions
Author Contributions
Funding
Institutional Review Board Statement
Informed Consent Statement
Data Availability Statement
Acknowledgments
Conflicts of Interest
Appendix A
References
- Mulder, A.C.; Pijnacker, R.; De Man, H.; Van De Kassteele, J.; Van Pelt, W.; Mughini-Gras, L.; Franz, E. “Sickenin’ in the rain”—Increased risk of gastrointestinal and respiratory infections after urban pluvial flooding in a population-based cross-sectional study in the Netherlands. BMC Infect. Dis. 2019, 19. [Google Scholar] [CrossRef]
- Wade, T.J.; Lin, C.J.; Jagai, J.S.; Hilborn, E.D. Flooding and Emergency Room Visits for Gastrointestinal Illness in Massachusetts: A Case-Crossover Study. PLoS ONE 2014, 9, e110474. [Google Scholar] [CrossRef]
- Jagai, J.S.; Deflorio-Barker, S.; Lin, C.J.; Hilborn, E.D.; Wade, T.J. Sanitary Sewer Overflows and Emergency Room Visits for Gastrointestinal Illness: Analysis of Massachusetts Data, 2006–2007. Environ. Health Perspect. 2017, 125, 117007. [Google Scholar] [CrossRef] [PubMed] [Green Version]
- De Man, H.; Mughini Gras, L.; Schimmer, B.; Friesema, I.H.M.; De Roda Husman, A.M.; Van Pelt, W. Gastrointestinal, influenza-like illness and dermatological complaints following exposure to floodwater: A cross-sectional survey in The Netherlands. Epidemiol. Infect. 2016, 144, 1445–1454. [Google Scholar] [CrossRef] [PubMed]
- Oluyomi, A.O.; Panthagani, K.; Sotelo, J.; Gu, X.; Armstrong, G.; Luo, D.N.; Hoffman, K.L.; Rohlman, D.; Tidwell, L.; Hamilton, W.J.; et al. Houston hurricane Harvey health (Houston-3H) study: Assessment of allergic symptoms and stress after hurricane Harvey flooding. Environ. Health 2021, 20. [Google Scholar] [CrossRef] [PubMed]
- Flores, A.B.; Castor, A.; Grineski, S.E.; Collins, T.W.; Mullen, C. Petrochemical releases disproportionately affected socially vulnerable populations along the Texas Gulf Coast after Hurricane Harvey. Popul. Environ. 2021, 42, 279–301. [Google Scholar] [CrossRef]
- Anenberg, S.C.; Kalman, C. Extreme Weather, Chemical Facilities, and Vulnerable Communities in the U.S. Gulf Coast: A Disastrous Combination. GeoHealth 2019, 3, 122–126. [Google Scholar] [CrossRef] [PubMed]
- Greene, G.; Paranjothy, S.; Palmer, S.R. Resilience and vulnerability to the psychological harm from flooding: The role of social cohesion. Am. J. Public Health 2015, 105, 1792–1795. [Google Scholar] [CrossRef]
- Lamond, J.E.; Joseph, R.D.; Proverbs, D.G. An exploration of factors affecting the long term psychological impact and deterioration of mental health in flooded households. Environ. Res. 2015, 140, 325–334. [Google Scholar] [CrossRef] [Green Version]
- Mason, V.; Andrews, H.; Upton, D. The psychological impact of exposure to floods. Psychol. Health Med. 2010, 15, 61–73. [Google Scholar] [CrossRef] [PubMed]
- Lowe, D.; Ebi, K.L.; Forsberg, B. Factors increasing vulnerability to health effects before, during and after floods. Int. J. Environ. Res. Public Health 2013, 10, 7015–7067. [Google Scholar] [CrossRef]
- Haynes, K.; Coates, L.; van den Honert, R.; Gissing, A.; Bird, D.; Dimer de Oliveira, F.; D’Arcy, R.; Smith, C.; Radford, D. Exploring the circumstances surrounding flood fatalities in Australia—1900–2015 and the implications for policy and practice. Environ. Sci. Policy 2017, 76, 165–176. [Google Scholar] [CrossRef]
- Ashley, S.T.; Ashley, W.S. Flood Fatalities in the United States. J. Appl. Meteorol. Climatol. 2008, 47, 805–818. [Google Scholar] [CrossRef]
- Salvati, P.; Petrucci, O.; Rossi, M.; Bianchi, C.; Pasqua, A.A.; Guzzetti, F. Gender, age and circumstances analysis of flood and landslide fatalities in Italy. Sci. Total Environ. 2018, 610–611, 867–879. [Google Scholar] [CrossRef] [PubMed]
- Jonkman, S.N.; Kelman, I. An Analysis of the Causes and Circumstances of Flood Disaster Deaths. Disasters 2005, 29, 75–97. [Google Scholar] [CrossRef] [PubMed]
- Pereira, S.; Diakakis, M.; Deligiannakis, G.; Zêzere, J. Comparing flood mortality in Portugal and Greece (Western and Eastern Mediterranean). Int. J. Disaster Risk Reduct. 2017, 22, 147–157. [Google Scholar] [CrossRef]
- Jermacane, D.; Waite, T.D.; Beck, C.R.; Bone, A.; Amlôt, R.; Reacher, M.; Kovats, S.; Armstrong, B.; Leonardi, G.; Rubin, G.J.; et al. The English national cohort study of flooding and health: The change in the prevalence of psychological morbidity at year two. BMC Public Health 2018, 18. [Google Scholar] [CrossRef]
- Mulchandani, R.; Armstrong, B.; Beck, C.R.; Waite, T.D.; Amlôt, R.; Kovats, S.; Leonardi, G.; Rubin, G.J.; Oliver, I. The English national cohort study of flooding and health: Psychological morbidity at three years of follow up. BMC Public Health 2020, 20, 321. [Google Scholar] [CrossRef] [Green Version]
- Gray, S. Long-term health effects of flooding. J. Public Health 2008, 30, 353–354. [Google Scholar] [CrossRef]
- Wang, P.S.; Gruber, M.J.; Powers, R.E.; Schoenbaum, M.; Speier, A.H.; Wells, K.B.; Kessler, R.C. Disruption of existing mental health treatments and failure to initiate new treatment after Hurricane Katrina. Am. J. Psychiatry 2008, 165, 34–41. [Google Scholar] [CrossRef] [Green Version]
- Zhong, S.; Yang, L.; Toloo, S.; Wang, Z.; Tong, S.; Sun, X.; Crompton, D.; Fitzgerald, G.; Huang, C. The long-term physical and psychological health impacts of flooding: A systematic mapping. Sci. Total Environ. 2018, 626, 165–194. [Google Scholar] [CrossRef] [PubMed]
- Stephens, K.U.; Grew, D.; Chin, K.; Kadetz, P.; Greenough, P.G.; Burkle, F.M.; Robinson, S.L.; Franklin, E.R. Excess mortality in the aftermath of Hurricane Katrina: A preliminary report. Disaster Med. Public Health Prep. 2007, 1, 15–20. [Google Scholar] [CrossRef] [PubMed]
- Andrade, L.; O’Dwyer, J.; O’Neill, E.; Hynds, P.D. Surface water flooding, groundwater contamination, and enteric disease in developed countries: A scoping review of connections and consequences. Environ. Pollut. 2018, 236, 540–549. [Google Scholar] [CrossRef] [PubMed]
- Woodhall-Melnik, J.; Grogan, C. Perceptions of mental health and wellbeing following residential displacement and damage from the 2018 St. John River flood. Int. J. Environ. Res. Public Health 2019, 16, 4174. [Google Scholar] [CrossRef] [PubMed] [Green Version]
- Poole, J.A.; Barnes, C.S.; Demain, J.G.; Bernstein, J.A.; Padukudru, M.A.; Sheehan, W.J.; Fogelbach, G.G.; Wedner, J.; Codina, R.; Levetin, E.; et al. Impact of weather and climate change with indoor and outdoor air quality in asthma: A work group report of the AAAAI Environmental Exposure and Respiratory Health Committee. J. Allergy Clin. Immunol. 2019, 143, 1702–1710. [Google Scholar] [CrossRef] [PubMed] [Green Version]
- Phillippi, S.W.; Beiter, K.; Thomas, C.L.; Sugarman, O.K.; Wennerstrom, A.; Wells, K.B.; Trapido, E. Medicaid utilization before and after a natural disaster in the 2016 Baton Rouge—Area flood. Am. J. Public Health 2019, 109, S316–S321. [Google Scholar] [CrossRef]
- Lal, A.; Fearnley, E.; Wilford, E. Local weather, flooding history and childhood diarrhoea caused by the parasite Cryptosporidium spp.: A systematic review and meta-analysis. Sci. Total Environ. 2019, 674, 300–306. [Google Scholar] [CrossRef]
- Demain, J.G. Climate change and the impact on respiratory and allergic disease: 2018. Curr. Allergy Asthma Rep. 2018, 18. [Google Scholar] [CrossRef]
- Graham, H.; White, P.; Cotton, J.; McManus, S. Flood- and weather-damaged homes and mental health: An analysis using England’s Mental Health Survey. Int. J. Environ. Res. Public Health 2019, 16, 3256. [Google Scholar] [CrossRef] [Green Version]
- Rorie, A.; Poole, J.A. The Role of Extreme Weather and Climate-Related Events on Asthma Outcomes. Immunol. Allergy Clin. North Am. 2021, 41, 73–84. [Google Scholar] [CrossRef]
- Hayes, D., Jr.; Jhaveri, M.A.; Mannino, D.M.; Strawbridge, H.; Temprano, J. The effect of mold sensitization and humidity upon allergic asthma. Clin. Respir. J. 2013, 7, 135–144. [Google Scholar] [CrossRef] [PubMed]
- Tischer, C.; Chen, C.M.; Heinrich, J. Association between domestic mould and mould components, and asthma and allergy in children: A systematic review. Eur. Respir. J. 2011, 38, 812–824. [Google Scholar] [CrossRef] [PubMed] [Green Version]
- Chew, G.L.; Wilson, J.; Rabito, F.A.; Grimsley, F.; Iqbal, S.; Reponen, T.; Muilenberg, M.L.; Thorne, P.S.; Dearborn, D.G.; Morley, R.L.; et al. Mold and Endotoxin Levels in the Aftermath of Hurricane Katrina: A Pilot Project of Homes in New Orleans Undergoing Renovation. Environ. Health Perspect. 2006, 114, 1883–1889. [Google Scholar] [CrossRef] [PubMed] [Green Version]
- Fisk, W.J.; Eliseeva, E.A.; Mendell, M.J. Association of residential dampness and mold with respiratory tract infections and bronchitis: A meta-analysis. Environ. Health 2010, 9, 72. [Google Scholar] [CrossRef] [PubMed] [Green Version]
- Dales, R.E.; Burnett, R.; Zwanenburg, H. Adverse Health Effects Among Adults Exposed to Home Dampness and Molds. Am. Rev. Respir. Dis. 1991, 143, 505–509. [Google Scholar] [CrossRef] [PubMed]
- Taylor, J.; Lai, K.M.; Davies, M.; Clifton, D.; Ridley, I.; Biddulph, P. Flood management: Prediction of microbial contamination in large-scale floods in urban environments. Environ. Int. 2011, 37, 1019–1029. [Google Scholar] [CrossRef]
- Angel, J.; Swanston, C.; Mayes Boustead, B.; Conlon, K.C.; Hall, K.R.; Jorns, J.L.; Kunkel, K.E.; Lemos, M.C.; Lofgren, B.; Ontl, T.A.; et al. Impacts, Risks, and Adaptation in the United States: Fourth National Climate Assessment Chapter 21: Midwest; U.S. Global Change Research Program: Washington, DC, USA, 2018; pp. 872–940. [CrossRef]
- Dai, S.; Shulski, M.D.; Hubbard, K.G.; Takle, E.S. A spatiotemporal analysis of Midwest US temperature and precipitation trends during the growing season from 1980 to 2013. Int. J. Climatol. 2016, 36, 517–525. [Google Scholar] [CrossRef] [Green Version]
- Guneralp, B.; Guneralp, I.; Liu, Y. Changing global patterns of urban exposure to flood and drought hazards. Glob. Environ. Chang. 2015, 31, 217–225. [Google Scholar] [CrossRef]
- Limaye, V.S.; Max, W.; Constible, J.; Knowlton, K. Estimating the health-related costs of 10 climate-sensitive U.S. events during 2012. GeoHealth 2019, 3, 245–265. [Google Scholar] [CrossRef]
- Hsiang, S.; Kopp, R.; Jina, A.; Rising, J.; Delgado, M.; Mohan, S.; Rasmussen, D.J.; Muir-Wood, R.; Wilson, P.; Oppenheimer, M.; et al. Estimating economic damage from climate change in the United States. Science 2017, 356, 1362–1369. [Google Scholar] [CrossRef] [Green Version]
- Melillo, J.M.; Richmond, T.T.; Yohe, G.W. Climate Change Impacts in the United States: The Third National Climate Assessment; U.S. Global Change Research Program: Washington, DC, USA, 2014. [CrossRef]
- Sandink, D. Urban flooding and ground-related homes in Canada: An overview. J. Flood Risk Manag. 2016, 9, 208–223. [Google Scholar] [CrossRef]
- Howell, J.; Elliott, J.R. Damages done: The longitudinal impacts of natural hazards on wealth inequality in the United States. Soc. Probl. 2019, 66, 66–448. [Google Scholar] [CrossRef] [Green Version]
- Depietri, Y.; McPhearson, T. Changing urban risk: 140 years of climatic hazards in New York City. Clim. Chang. 2018, 148, 95–108. [Google Scholar] [CrossRef] [Green Version]
- Field, C.B.; Barros, V.; Stocker, T.F.; Dahe, Q.; Dokken, D.J.; Ebi, K.L.; Mastrandrea, M.D.; Mach, K.J.; Plattner, G.K.; Allen, S.K.; et al. Managing the Risks of Extreme Events and Disasters to Advance Climate Change Adaptation: Special Report of the Intergovernmental Panel on Climate Change; Cambridge University Press: Cambridge, UK, 2012. [Google Scholar] [CrossRef]
- Sugrue, T.J. The Origins of the Urban Crisis: Race and Inequality in Postwar Detroit Race and Inequality in Postwar Detroit; Central Michigan University: Mt Pleasant, MI, USA, 2014; Volume 24, pp. 188–190. [Google Scholar]
- United States Census Bureau. 2015–2019 American Community Survey (ACS) 5-Year Public Use Microdata Sample (PUMS); United States Census Bureau: Hillcrest Heights, MD, USA, 2020.
- Dewar, M.; Thomas, J.M. The City after Abandonment; University of Pennsylvania Press: Philadelphia, PA, USA, 2013; Volume 13. [Google Scholar]
- Nassauer, J.; Dewar, M.; McElmurry, S.; Sampson, N.; Alvarez, A.; Burton, A.; Riseng, C.; Schulz, A.; Webster, N.; Lichten, N. NEW-GI: Neighborhood, Environment and Water Research Collaborations for Green Infrastructure; University of Michigan Water Center: Ann Arbor, MI, USA, 2016. [Google Scholar]
- Sampson, N.R.; Price, C.E.; Kassem, J.; Doan, J.; Hussein, J. “We’re just sitting ducks”: Recurrent household flooding as an underreported environmental health threat in Detroit’s changing climate. Int. J. Environ. Res. Public Health 2019, 16, 6. [Google Scholar] [CrossRef] [PubMed] [Green Version]
- Office of Sustainability. The Sustainability Action Agenda: Summary Survey Results [Presentation]; City of Detroit: Philadelphia, PA, USA, 2019.
- Festing, H.; Copp, C.; Sprague, H.; Wolf, D.; Shorofsky, B.; Nichols, K. The prevalence and Cost of Urban Flooding: A Case Study of Cook County, IL; Center for Neighborhood Technology: Chicago, IL, USA, 2014. [Google Scholar]
- Michigan Department of Environment, Great Lakes, and Energy. Combined Sewer Overflow (CSO), Sanitary Sewer Overflow (SSO), and Retention Treatment Basin (RTB) Discharge 2018 Annual Report; Michigan Department of Environment, Great Lakes, and Energy: Lansing, MI, USA, 2018.
- Steis Thorsby, J.; Miller, C.J.; Treemore-Spears, L. The role of green stormwater infrastructure in flood mitigation (Detroit, MI USA)—Case study. Urban Water J. 2020, 17, 838–846. [Google Scholar] [CrossRef]
- Sampson, N.; Hill Knott, K.; Smith, D.; Mekias, L.; Howrani Heeres, J.; Sagovac, S. Planning for climate change in legacy cities: The case of Detroit, Michigan. Mich. J. Sustain. 2014, 2. [Google Scholar] [CrossRef] [Green Version]
- State of Michigan. GIS Open Data; State of Michigan GIS Portal: Detroit, MI, USA, 2021.
- NASA METI AIST Japan Spacesystems and U.S./Japan ASTER Science Team. ASTER DEM Product; NASA EOSDIS Land Processes DAAC: Sioux Falls, SD, USA, 2021. [CrossRef]
- CoreLogic. CoreLogic Parcel Level Real Estate Data; CoreLogic Tax Records: Exton, PA, USA, 2021. [Google Scholar]
- Environmental Systems Research Institute. ArcGIS Desktop; Environmental Systems Research Institute: West Redlands, CA, USA, 2011. [Google Scholar]
- Getis, A.; Ord, J.K. The analysis of spatial association by use of distance statistics. Geogr. Anal. 1992, 24, 189–206. [Google Scholar] [CrossRef]
- Ord, J.K.; Getis, A. Local spatial autocorrelation statistics: Distributional issues and an application. Geogr. Anal. 1995, 27, 286–306. [Google Scholar] [CrossRef]
- Schuster, S. Boom and Bust: Detroit’s Housing Construction Trends; Data Driven Detroit: Detroit, MI, USA, 2018. [Google Scholar]
- Van Buuren, S.; Groothuis-Oudshoorn, K. Mice: Multivariate imputation by chained equations in R. J. Stat. Softw. 2011, 45, 1–67. [Google Scholar] [CrossRef] [Green Version]
- Akaike, H. Likelihood of a model and information criteria. J. Econom. 1981, 16, 3–14. [Google Scholar] [CrossRef]
- Grothmann, T.; Reusswig, F. People at Risk of Flooding: Why Some Residents Take Precautionary Action While Others Do Not. Nat. Hazards 2006, 38, 101–120. [Google Scholar] [CrossRef]
- First Street Foundation. First Street Foundation’s First National Flood Risk Assessment; First Street Foundation: Brooklyn, NY, USA, 2020. [Google Scholar] [CrossRef]
- DeGuire, P.; Cao, B.; Wisnieski, L.; Strane, D.; Wahl, R.; Lyon-Callo, S.; Garcia, E. Detroit: The Current Status of the Asthma Burden; Michigan Department of Health and Human Services, Bureau of Disease Control, Prevention and Epidemiology. Available online: https://datadrivendetroit.org/blog/2018/07/10/boom-and-bust-detroits-housing-contruction-trends/ (accessed on 1 July 2021).
- Gautier, C.; Charpin, D. Environmental triggers and avoidance in the management of asthma. J. Asthma Allergy 2017, 10, 47–56. [Google Scholar] [CrossRef] [PubMed] [Green Version]
- Childhood Lead Poisoning Prevention Program, Division of Environmental Health. Childhood Lead Poisoning Prevention in Michigan, Fiscal Year 2017 Report to the Legislature; Michigan Department of Health and Human Services: Lansing, MI, USA, 2018.
- Rao, C.Y.; Riggs, M.A.; Chew, G.L.; Muilenberg, M.L.; Thorne, P.S.; Van Sickle, D.; Dunn, K.H.; Brown, C. Characterization of Airborne Molds, Endotoxins, and Glucans in Homes in New Orleans after Hurricanes Katrina and Rita. Appl. Environ. Microbiol. 2007, 73, 1630–1634. [Google Scholar] [CrossRef] [Green Version]
- Saporta, D.; Hurst, D. Increased Sensitization to Mold Allergens Measured by Intradermal Skin Testing following Hurricanes. J. Environ. Public Health 2017, 2017, 1–5. [Google Scholar] [CrossRef] [PubMed] [Green Version]

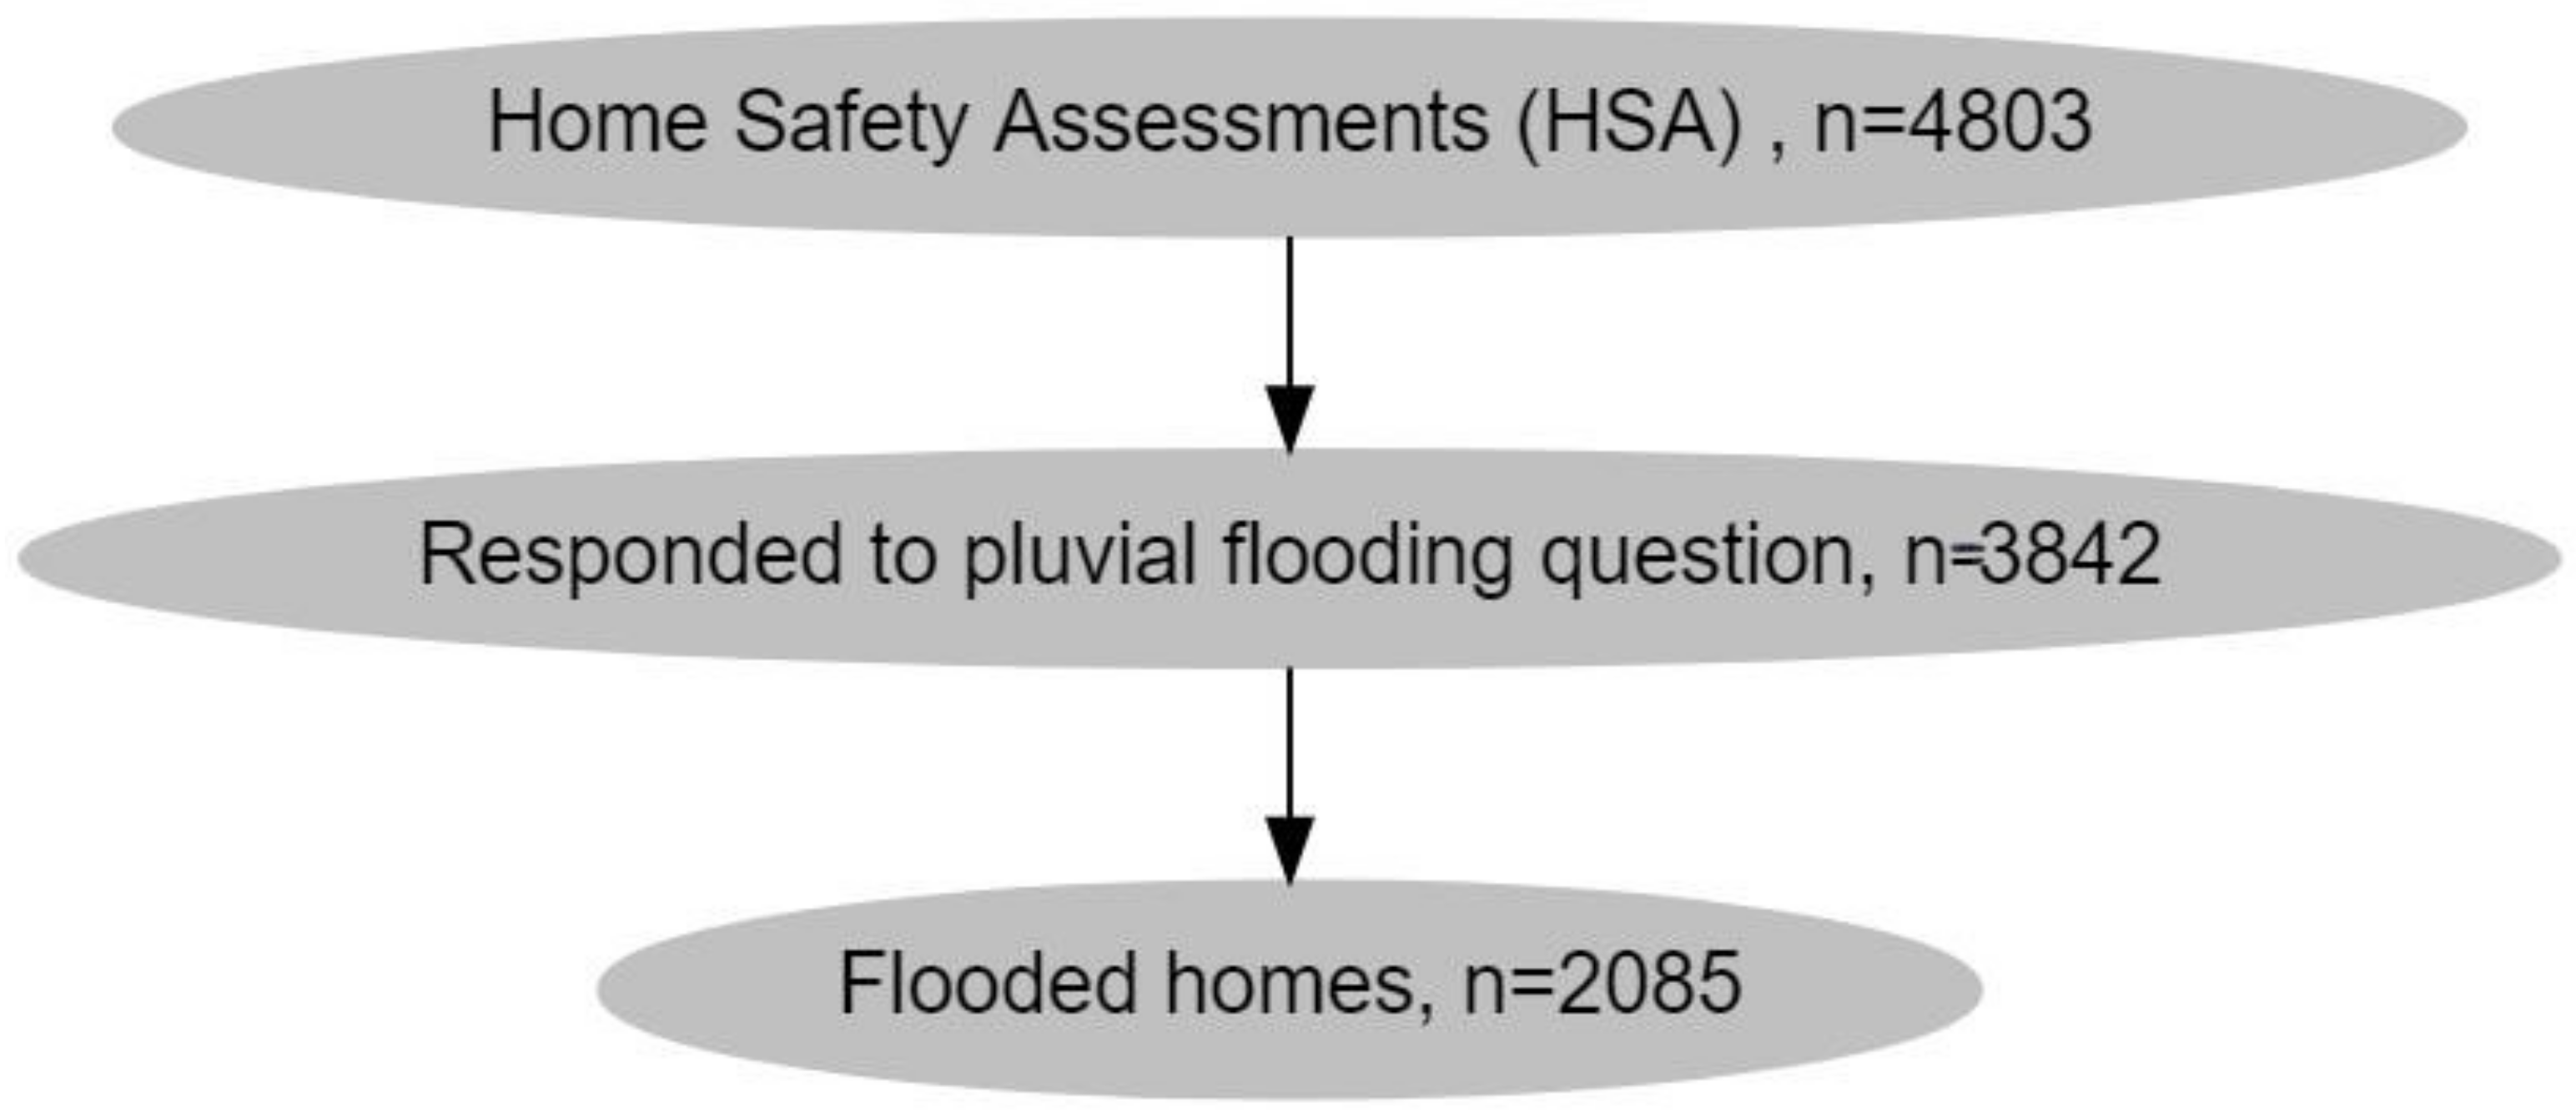
| [ALL] | No Flood | Flood | OR | p.ratio | |
|---|---|---|---|---|---|
| N = 3842 | N = 1757 | N = 2085 | |||
| Own or rent home: | |||||
| Own | 2458 (64.0%) | 1241 (70.6%) | 1217 (58.4%) | Ref. | Ref. |
| Rent | 1225 (31.9%) | 456 (26.0%) | 769 (36.9%) | 1.72 [1.49;1.98] | <0.001 |
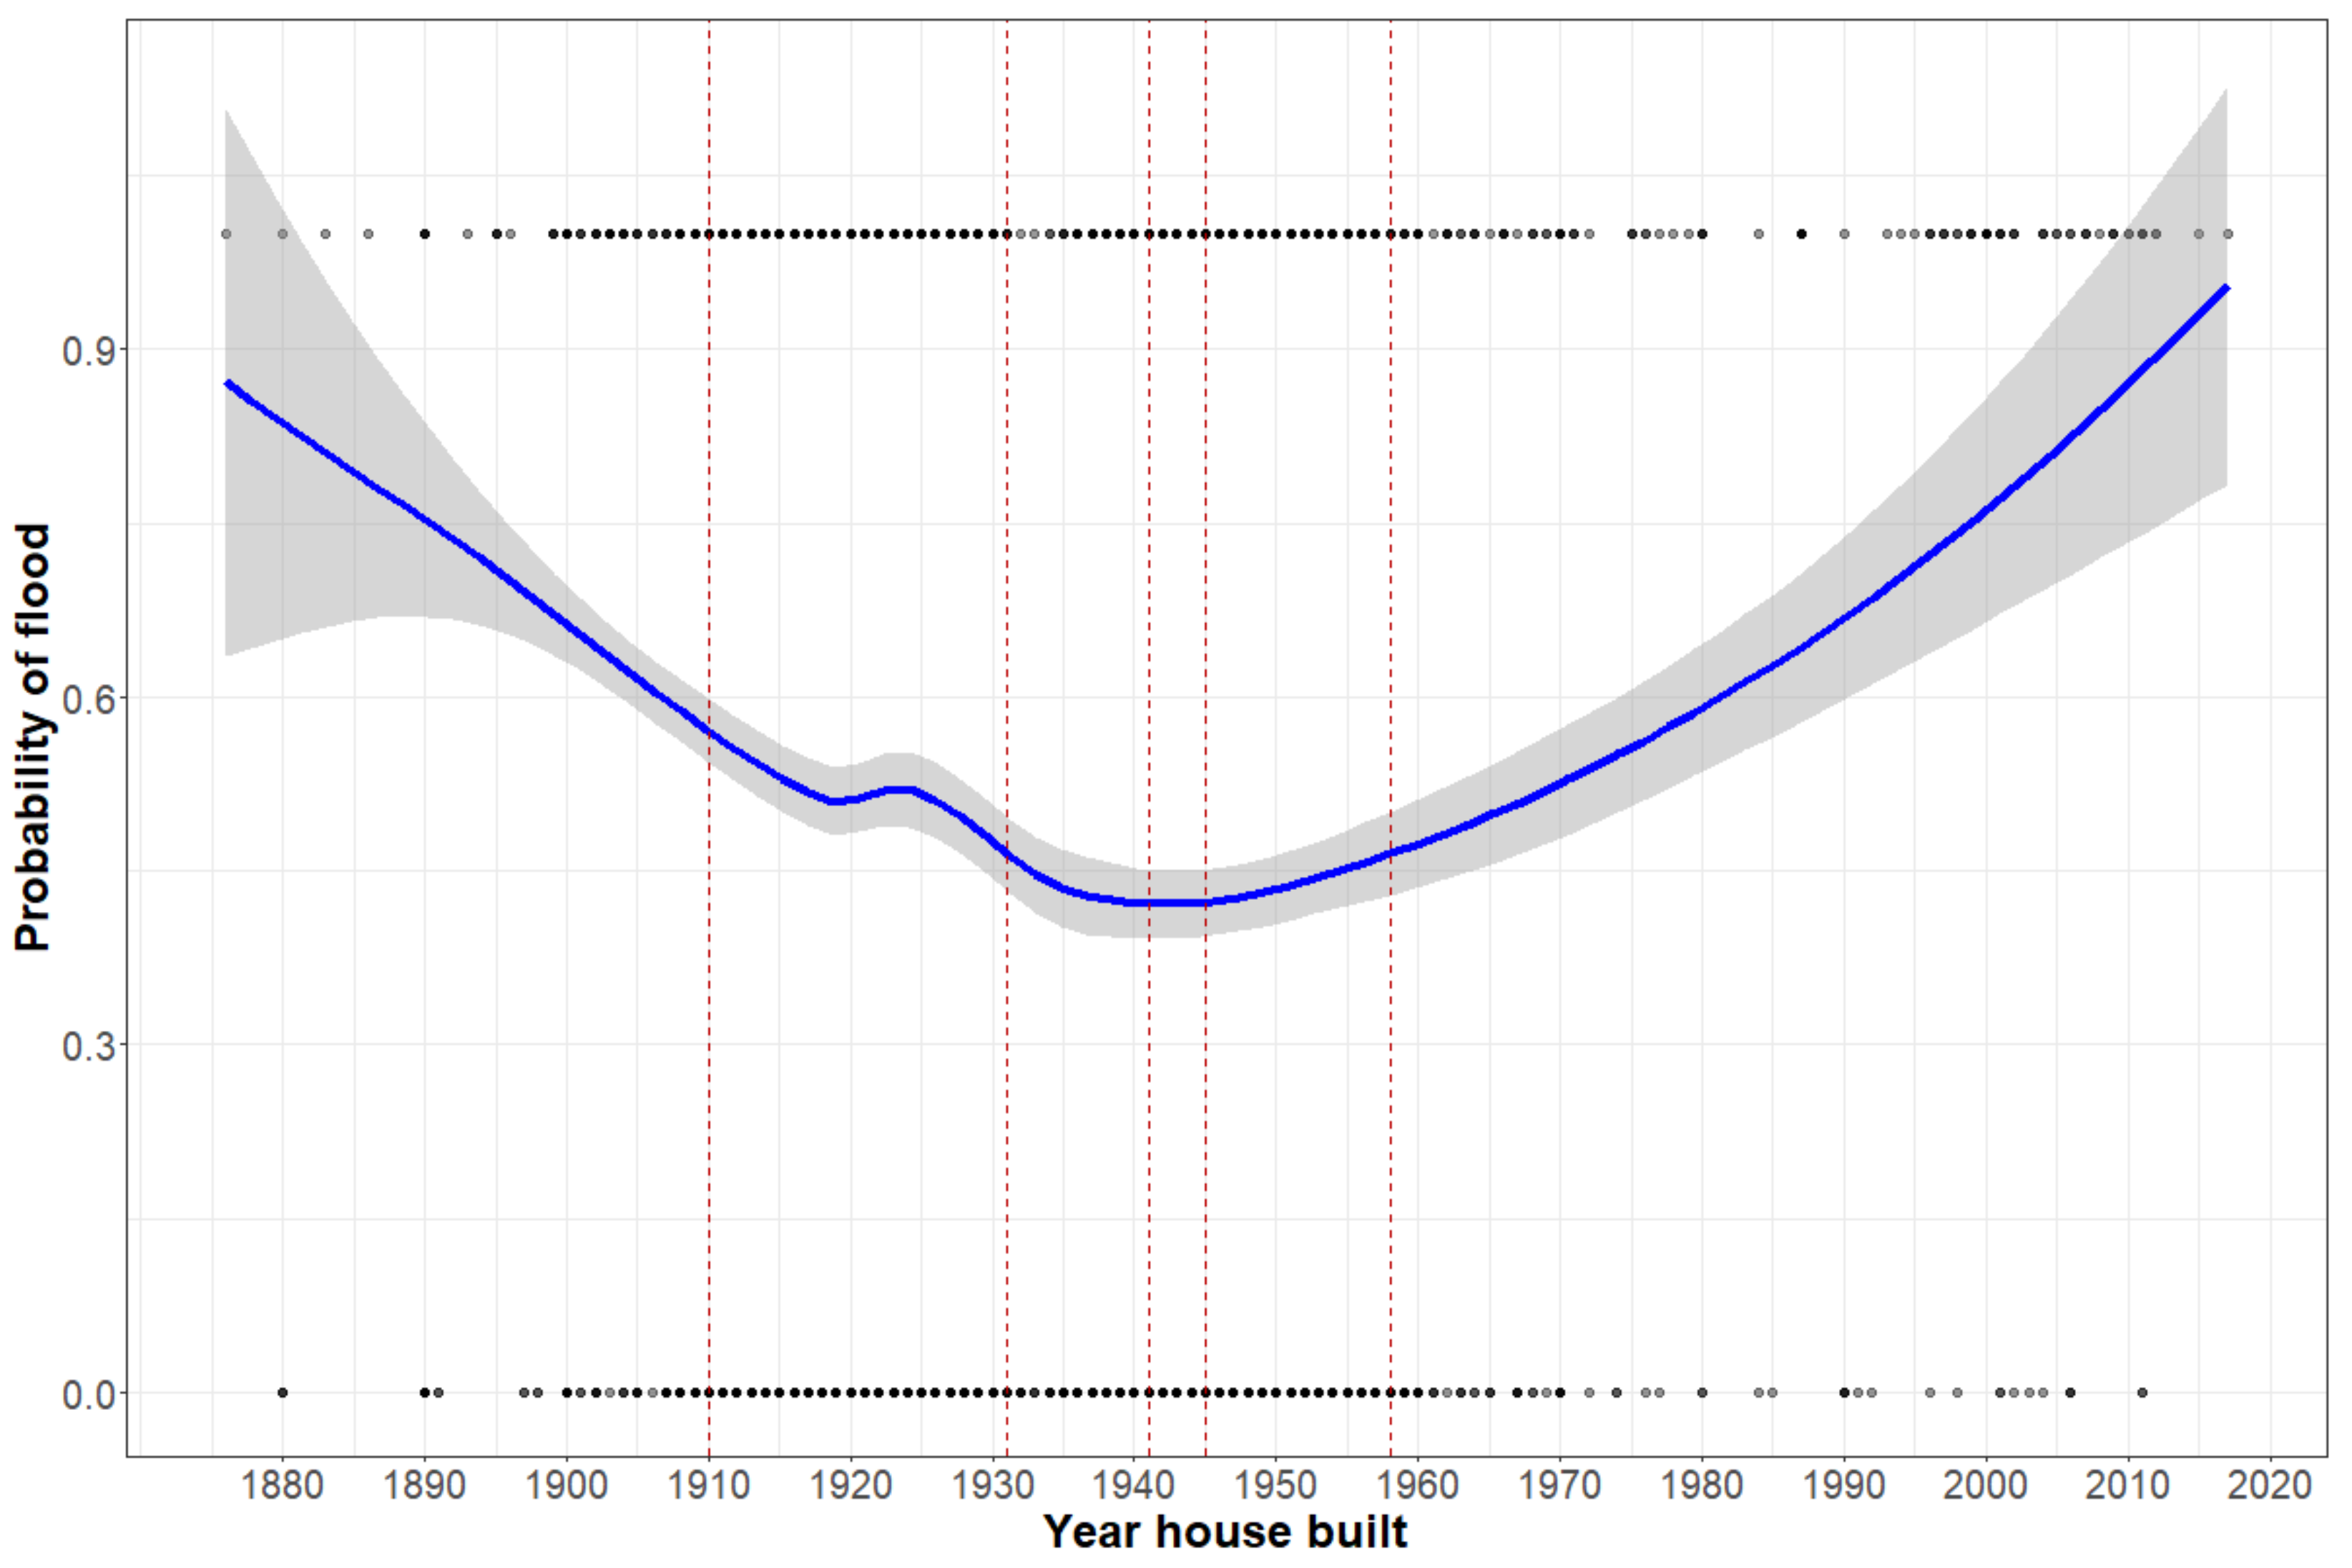
| Approximate year house was built | 1929 (22.7) | 1931 (20.0) | 1927 (24.8) | 0.99 [0.99;1.00] | <0.001 |
| Year house built (categories): | |||||
| Pre 1910 | 653 (17.0%) | 219 (12.5%) | 434 (20.8%) | Ref. | Ref. |
| 1910–1930 | 986 (25.7%) | 496 (28.2%) | 490 (23.5%) | 0.50 [0.41;0.61] | <0.001 |
| 1931–1940 | 319 (8.30%) | 192 (10.9%) | 127 (6.09%) | 0.33 [0.25;0.44] | <0.001 |
| 1941–1945 | 88 (2.29%) | 47 (2.68%) | 41 (1.97%) | 0.44 [0.28;0.69] | <0.001 |
| 1946–1957 | 540 (14.1%) | 297 (16.9%) | 243 (11.7%) | 0.41 [0.33;0.52] | <0.001 |
| 1958 or later | 197 (5.13%) | 83 (4.72%) | 114 (5.47%) | 0.69 [0.50;0.96] | 0.029 |
| Building sq ft | 1367 (720) | 1354 (690) | 1379 (746) | 1.04 [0.97;1.11] | 0.325 |
| Living space sq ft | 1364 (712) | 1353 (689) | 1374 (732) | 1.03 [0.96;1.11] | 0.404 |
| Basement sq ft | 819 (274) | 807 (261) | 830 (285) | 1.09 [1.01;1.17] | 0.019 |
| Type of basement: | |||||
| Finished | 402 (12.5%) | 211 (13.8%) | 191 (11.3%) | Ref. | Ref. |
| Unfinished | 2819 (87.5%) | 1322 (86.2%) | 1497 (88.7%) | 1.25 [1.01;1.54] | 0.036 |
| [ALL] | No Flood | Flood | OR | p.ratio | |
|---|---|---|---|---|---|
| N = 3842 | N = 1757 | N = 2085 | |||
| Roof in good condition: | 680 (17.7%) | 378 (21.5%) | 302 (14.5%) | 0.59 [0.50;0.70] | <0.001 |
| Mold on walls of basement: | 2720 (70.8%) | 973 (55.4%) | 1747 (83.8%) | 6.03 [5.09;7.17] | 0.000 |
| Moldy smells: | 2633 (68.5%) | 925 (52.6%) | 1708 (81.9%) | 5.51 [4.70;6.49] | 0.000 |
| Basement needs repair: | 2639 (68.7%) | 948 (54.0%) | 1691 (81.1%) | 12.4 [10.0;15.5] | 0.000 |
| Roof leaks: | 2997 (78.0%) | 1304 (74.2%) | 1693 (81.2%) | 2.04 [1.67;2.49] | <0.001 |
| Window leaks: | 3248 (84.5%) | 1465 (83.4%) | 1783 (85.5%) | 1.64 [1.24;2.18] | <0.001 |
| Chimney leaks: | 3383 (88.1%) | 1538 (87.5%) | 1845 (88.5%) | 2.06 [1.31;3.32] | 0.002 |
| Plumbing leaks: | 3131 (81.5%) | 1360 (77.4%) | 1771 (84.9%) | 2.88 [2.26;3.69] | 0.000 |
| No leaks: | 1068 (27.8%) | 647 (36.8%) | 421 (20.2%) | 0.42 [0.36;0.49] | 0.000 |
| Foundation cracks: | 2945 (76.7%) | 1243 (70.7%) | 1702 (81.6%) | 2.74 [2.26;3.35] | 0.000 |
| Sinks and bathtub drain properly: | 1026 (26.7%) | 541 (30.8%) | 485 (23.3%) | 0.67 [0.58;0.78] | <0.001 |
| Uncapped sewer outlets: | 2542 (66.2%) | 1034 (58.9%) | 1508 (72.3%) | 2.21 [1.91;2.57] | 0.000 |
| Ever had sewer backups: | 2465 (64.2%) | 638 (36.3%) | 1827 (87.6%) | 16.1 [13.5;19.3] | 0.000 |
| [ALL] | No Flood | Flood | OR | p.ratio | |
|---|---|---|---|---|---|
| N = 3842 | N = 1757 | N = 2085 | |||
| Census tract poverty (%) | 43.1 (11.5) | 43.0 (11.4) | 43.1 (11.5) | 1.02 [0.95;1.08] | 0.648 |
| Census tract under 18 poverty (%) | 59.6 (17.5) | 59.4 (17.6) | 59.8 (17.4) | 1.02 [0.96;1.09] | 0.458 |
| Percent African-American | 86.0 (24.1) | 85.8 (23.7) | 86.2 (24.4) | 1.02 [0.94;1.10] | 0.671 |
| Percent Hispanic | 7.52 (18.8) | 7.28 (18.4) | 7.73 (19.2) | 1.03 [0.95;1.12] | 0.499 |
| Distance to nearest waterway (m) | 4.85 (2.99) | 4.92 (3.04) | 4.79 (2.95) | 0.96 [0.90;1.02] | 0.186 |
| Elevation (m) | 189 (7.22) | 189 (7.12) | 189 (7.30) | 0.97 [0.91;1.03] | 0.286 |
| Percent of homes owner occupied | 51.0 (13.8) | 51.7 (13.0) | 50.5 (14.3) | 0.92 [0.86;0.98] | 0.008 |
| Percent of home built before 1939 | 39.5 (24.3) | 38.9 (24.1) | 40.0 (24.5) | 1.05 [0.98;1.11] | 0.166 |
| Dependent Variable: | ||
|---|---|---|
| Flooding | ||
| Full Model | Reduced Model | |
| (1) | (2) | |
| Census tract poverty (%) | 1.029 (0.895, 1.163) | |
| Census tract under 18 poverty (%) | 0.968 (0.846, 1.090) | |
| Percent African-American | 1.210 (0.967, 1.453) | 1.073 (0.977, 1.168) |
| Distance to nearest waterway (m) | 1.138 (0.904, 1.371) | |
| Elevation (m) | 0.975 (0.870, 1.081) | |
| Homes owner occupied (%) | 1.009 (0.891, 1.128) | |
| Home built before 1939 (%) | 0.941 (0.865, 1.017) | 0.941 (0.869, 1.014) |
| Own or rent home | 1.164 (1.059, 1.270) | 1.179 (1.087, 1.270) |
| Mold on walls of basement | 1.547 (1.296, 1.797) | 1.551 (1.302, 1.801) |
| Moldy smells | 2.017 (1.539, 2.495) | 2.037 (1.556, 2.518) |
| Basement needs repair | 1.783 (1.380, 2.187) | 1.777 (1.376, 2.179) |
| Roof leaks | 6.753 (5.250, 8.256) | 6.836 (5.323, 8.349) |
| Window leaks | 0.965 (0.710, 1.221) | |
| Chimney leaks | 0.687 (0.430, 0.945) | 0.684 (0.446, 0.922) |
| Plumbing leaks | 0.809 (0.335, 1.283) | |
| Foundation cracks | 1.225 (0.854, 1.597) | |
| Sinks and bathtub drain properly | 1.339 (0.998, 1.680) | 1.380 (1.045, 1.716) |
| Uncapped sewer outlets | 0.916 (0.758, 1.073) | |
| Ever had sewer backups | 1.663 (1.384, 1.942) | 1.668 (1.390, 1.946) |
| Gaps large enough for animals and insects | 1.282 (1.029, 1.535) | 1.300 (1.047, 1.553) |
| Constant | 0.059 (0.024, 0.095) | 0.052 (0.032, 0.072) |
| Observations | 3842 | 3842 |
| Log Likelihood | −2088.269 | −2090.988 |
| Akaike Inf. Crit. | 4218.538 | 4205.976 |
| No | Yes | OR | p | |
|---|---|---|---|---|
| N = 1057 | N = 3072 | |||
| Experienced flooding | 448 (47.5%) | 1542 (56.2%) | 1.42 [1.22;1.64] | <0.001 |
| Child in the home with asthma: Yes | 497 (62.2%) | 2005 (88.2%) | 4.54 [3.75;5.50] | 0.000 |
| Breathing problems: Yes | 389 (39.7%) | 2355 (80.8%) | 6.40 [5.47;7.50] | 0.000 |
| Smoker in the home: Yes | 514 (49.9%) | 1774 (59.5%) | 1.47 [1.28;1.70] | <0.001 |
| Year house was built: | ||||
| Pre 1910 | 137 (18.3%) | 512 (22.9%) | Ref. | Ref. |
| 1910–1930 | 275 (36.7%) | 780 (34.9%) | 0.76 [0.60;0.96] | 0.020 |
| 1931–1940 | 93 (12.4%) | 251 (11.2%) | 0.72 [0.53;0.98] | 0.037 |
| 1941–1945 | 28 (3.74%) | 84 (3.76%) | 0.80 [0.51;1.30] | 0.358 |
| 1946–1957 | 170 (22.7%) | 444 (19.9%) | 0.70 [0.54;0.91] | 0.007 |
| 1958 or later | 46 (6.14%) | 165 (7.38%) | 0.96 [0.66;1.41] | 0.825 |
| Roof in good condition | 186 (23.9%) | 490 (21.8%) | 0.88 [0.73;1.07] | 0.214 |
| Mold on walls of basement | 637 (69.4%) | 2020 (76.3%) | 1.42 [1.20;1.68] | <0.001 |
| Moldy smells: Yes | 610 (66.5%) | 1951 (73.5%) | 1.40 [1.19;1.64] | <0.001 |
| Basement needs repair | 619 (70.3%) | 1937 (77.2%) | 1.43 [1.21;1.70] | <0.001 |
| Roof leaks | 830 (85.6%) | 2402 (86.3%) | 1.06 [0.86;1.31] | 0.579 |
| Window leaks | 896 (92.4%) | 2617 (94.0%) | 1.30 [0.97;1.71] | 0.079 |
| Chimney leaks | 937 (96.6%) | 2727 (98.0%) | 1.69 [1.08;2.59] | 0.022 |
| Plumbing leaks | 854 (88.0%) | 2521 (90.6%) | 1.30 [1.03;1.64] | 0.028 |
| No leaks | 338 (34.8%) | 850 (30.5%) | 0.82 [0.70;0.96] | 0.013 |
| Foundation cracks | 758 (83.8%) | 2221 (85.7%) | 1.16 [0.94;1.42] | 0.169 |
| Sinks and bathtub drain properly | 297 (28.6%) | 772 (25.8%) | 0.87 [0.74;1.02] | 0.077 |
| Uncapped sewer outlets | 624 (68.1%) | 1908 (72.0%) | 1.20 [1.02;1.41] | 0.028 |
| Ever had sewer backups | 581 (62.8%) | 1796 (66.9%) | 1.20 [1.02;1.40] | 0.025 |
| Gaps large enough for animals and insects | 672 (71.6%) | 2089 (77.4%) | 1.36 [1.15;1.60] | <0.001 |
| Census tract poverty (%) | 42.7 (11.4) | 42.9 (11.7) | 1.00 [1.00;1.01] | 0.639 |
| Census tract under 18 poverty (%) | 59.1 (17.8) | 59.2 (17.8) | 1.00 [1.00;1.00] | 0.888 |
| Percent African-American (%) | 85.7 (24.3) | 85.5 (24.5) | 1.00 [1.00;1.00] | 0.838 |
| Distance to nearest waterway (m) | 4.93 (3.09) | 4.85 (3.01) | 0.99 [0.97;1.01] | 0.479 |
| Elevation (m) | 189 (7.22) | 189 (7.18) | 1.00 [0.99;1.01] | 0.488 |
| Homes owner occupied (%) | 51.3 (13.3) | 50.8 (14.1) | 1.00 [0.99;1.00] | 0.296 |
| Homes built before 1939 (%) | 39.1 (24.1) | 39.0 (24.2) | 1.00 [1.00;1.00] | 0.958 |
Publisher’s Note: MDPI stays neutral with regard to jurisdictional claims in published maps and institutional affiliations. |
© 2021 by the authors. Licensee MDPI, Basel, Switzerland. This article is an open access article distributed under the terms and conditions of the Creative Commons Attribution (CC BY) license (https://creativecommons.org/licenses/by/4.0/).
Share and Cite
Larson, P.S.; Gronlund, C.; Thompson, L.; Sampson, N.; Washington, R.; Steis Thorsby, J.; Lyon, N.; Miller, C. Recurrent Home Flooding in Detroit, MI 2012–2020: Results of a Household Survey. Int. J. Environ. Res. Public Health 2021, 18, 7659. https://doi.org/10.3390/ijerph18147659
Larson PS, Gronlund C, Thompson L, Sampson N, Washington R, Steis Thorsby J, Lyon N, Miller C. Recurrent Home Flooding in Detroit, MI 2012–2020: Results of a Household Survey. International Journal of Environmental Research and Public Health. 2021; 18(14):7659. https://doi.org/10.3390/ijerph18147659
Chicago/Turabian StyleLarson, Peter S., Carina Gronlund, Lyke Thompson, Natalie Sampson, Ramona Washington, Jamie Steis Thorsby, Natalie Lyon, and Carol Miller. 2021. "Recurrent Home Flooding in Detroit, MI 2012–2020: Results of a Household Survey" International Journal of Environmental Research and Public Health 18, no. 14: 7659. https://doi.org/10.3390/ijerph18147659