
Particulate Matter and Premature Mortality: A Bayesian Meta-Analysis

 , , ,
, , ,  ,
, 
Abstract
1. Introduction
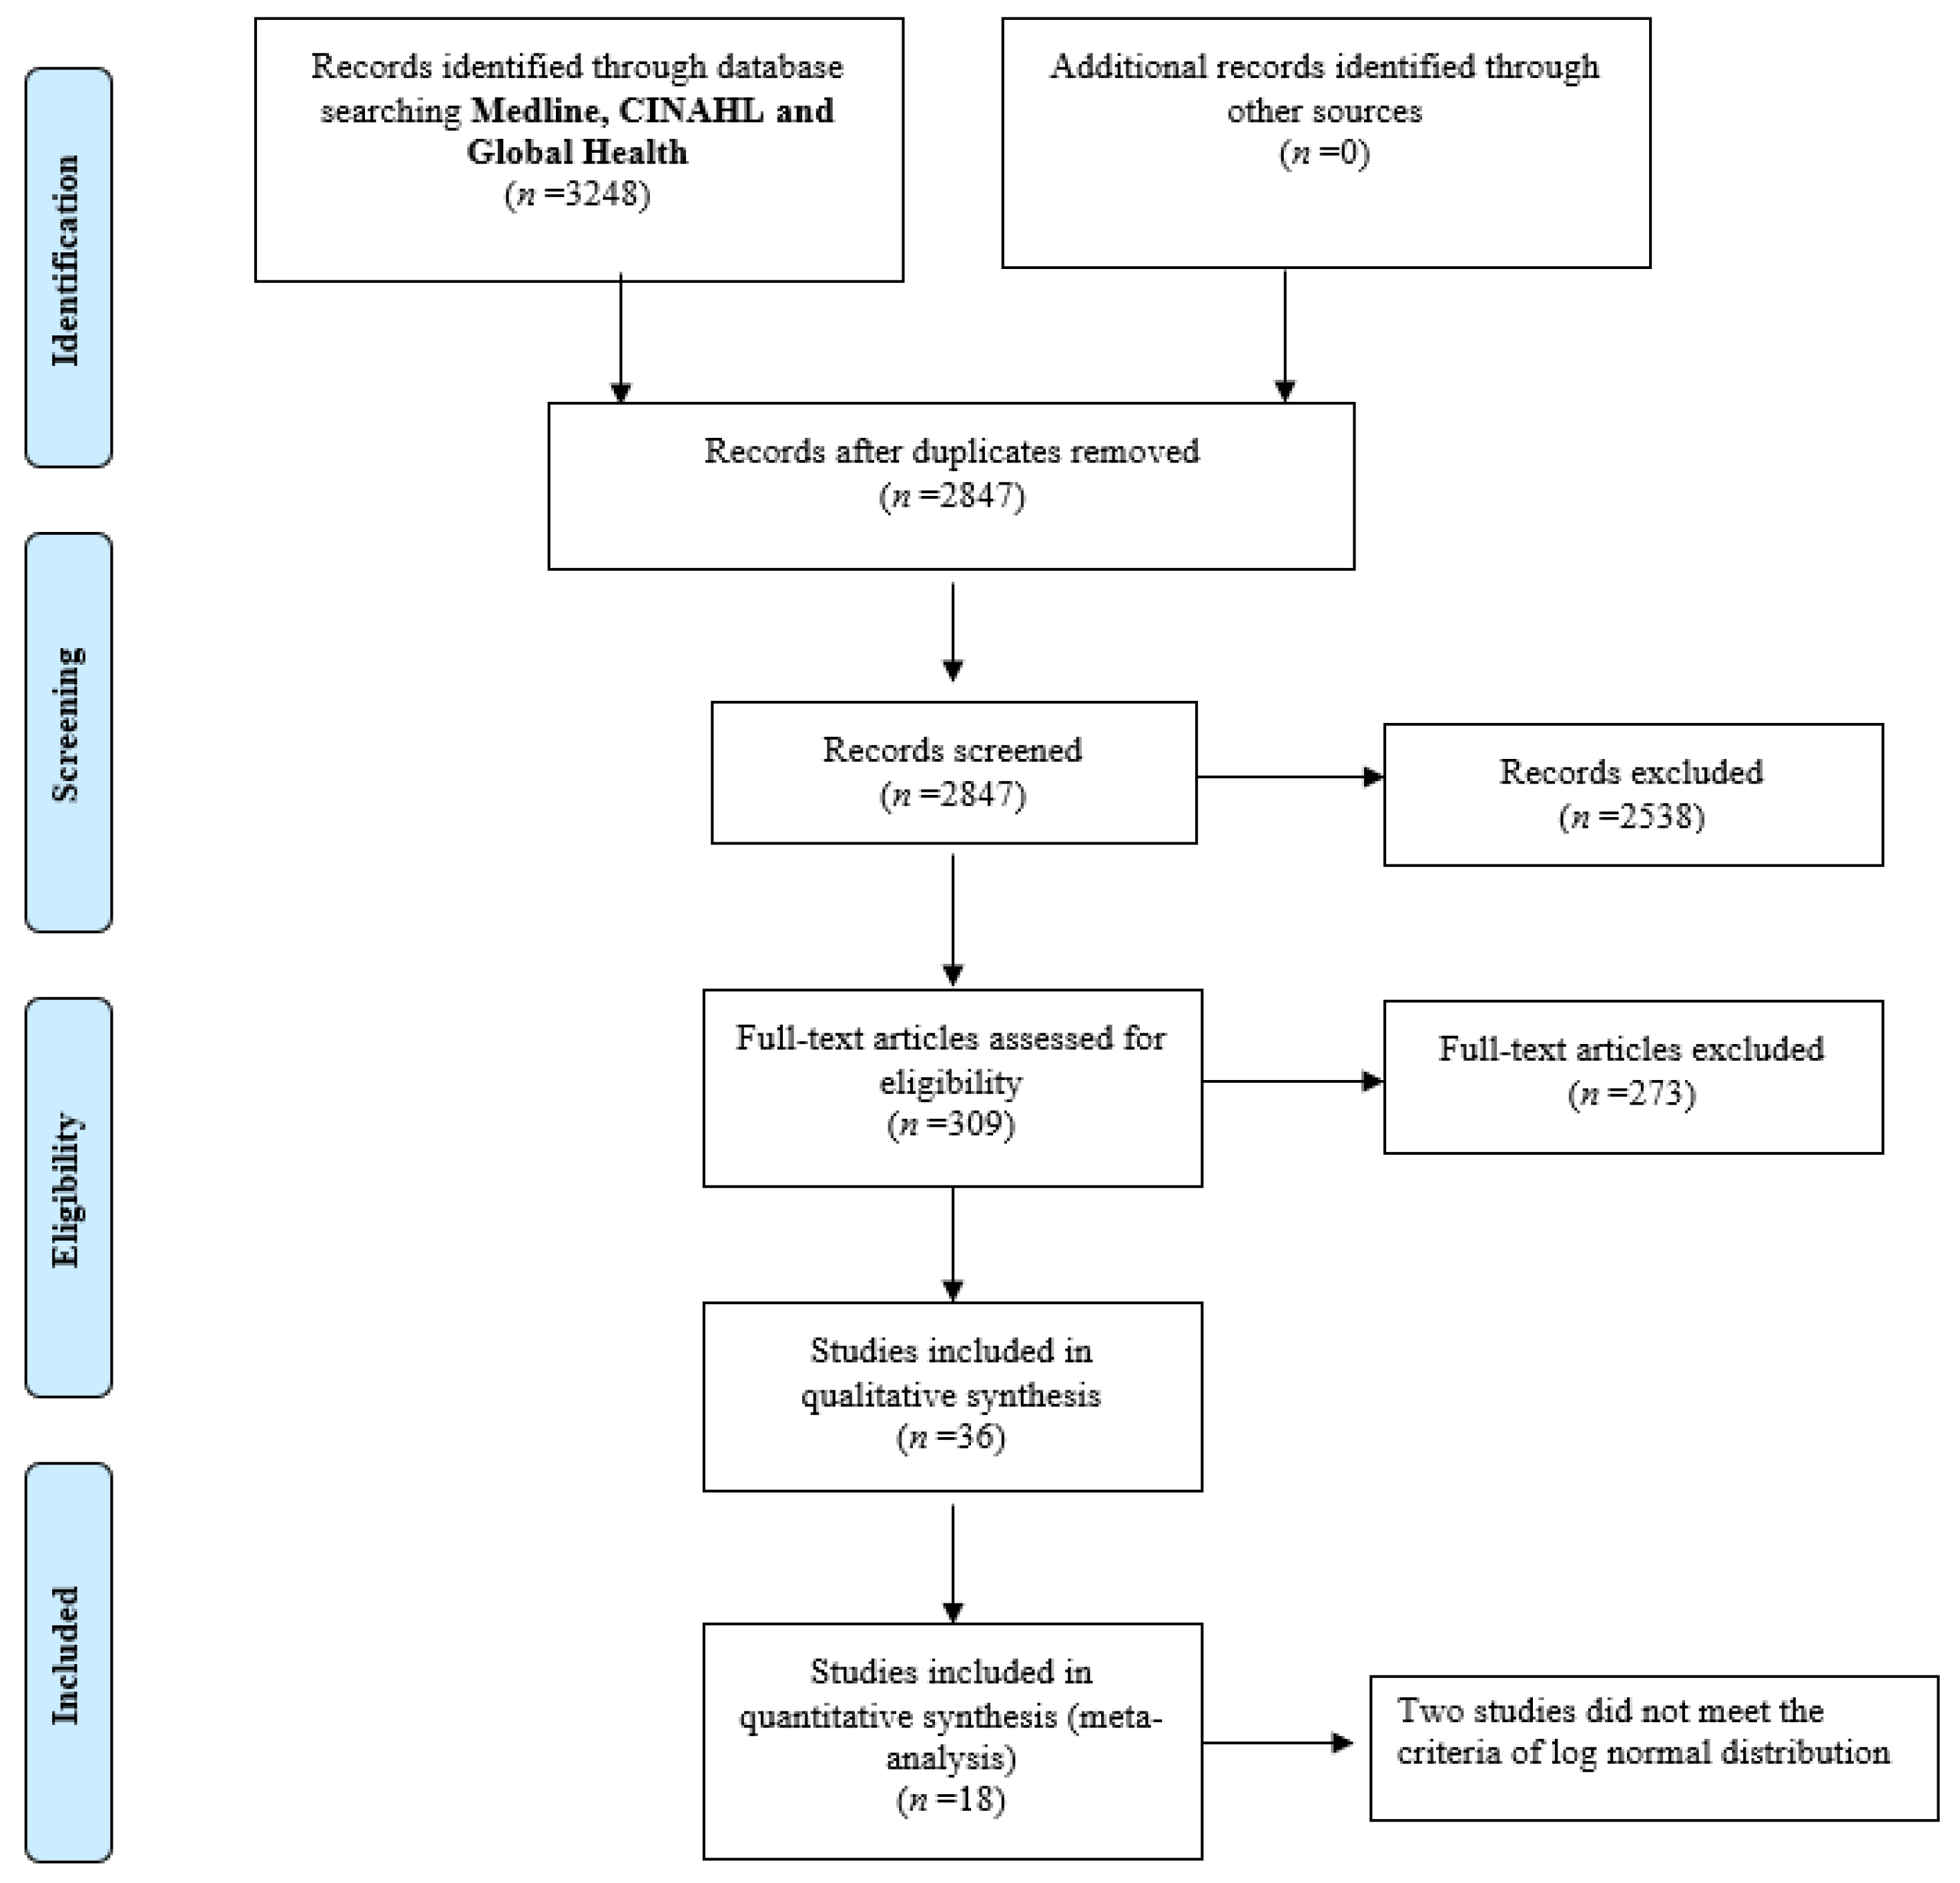
2. Methods
- Studies that measured PM2.5 or PM10;
- Outcome measured as premature mortality;
- Studies based on any study design;
- From any population group (no ethnic groups were excluded);
- Published in English in a peer reviewed journal;
- Available in Medline, CINAHL and Global Health electronic databases from inception to January 2020.
- Studies which assessed pollutants other than PM2.5 and PM10, or measured these pollutants in combination with other pollutants;
- Literature reviews;
- Conference papers, abstracts and editorials.
- PM10: inhalable particles, with diameters that are 10 micrometers and smaller; and
- PM2.5: fine inhalable particles, with diameters that are 2.5 micrometers and smaller.
- (i)
- Four stars are allocated to study group selection (the first element);
- (ii)
- Two stars are allocated to comparability of the groups (the second element); and
- (iii)
- Three stars are allocated to ascertainment of the exposure and outcome (the final element).
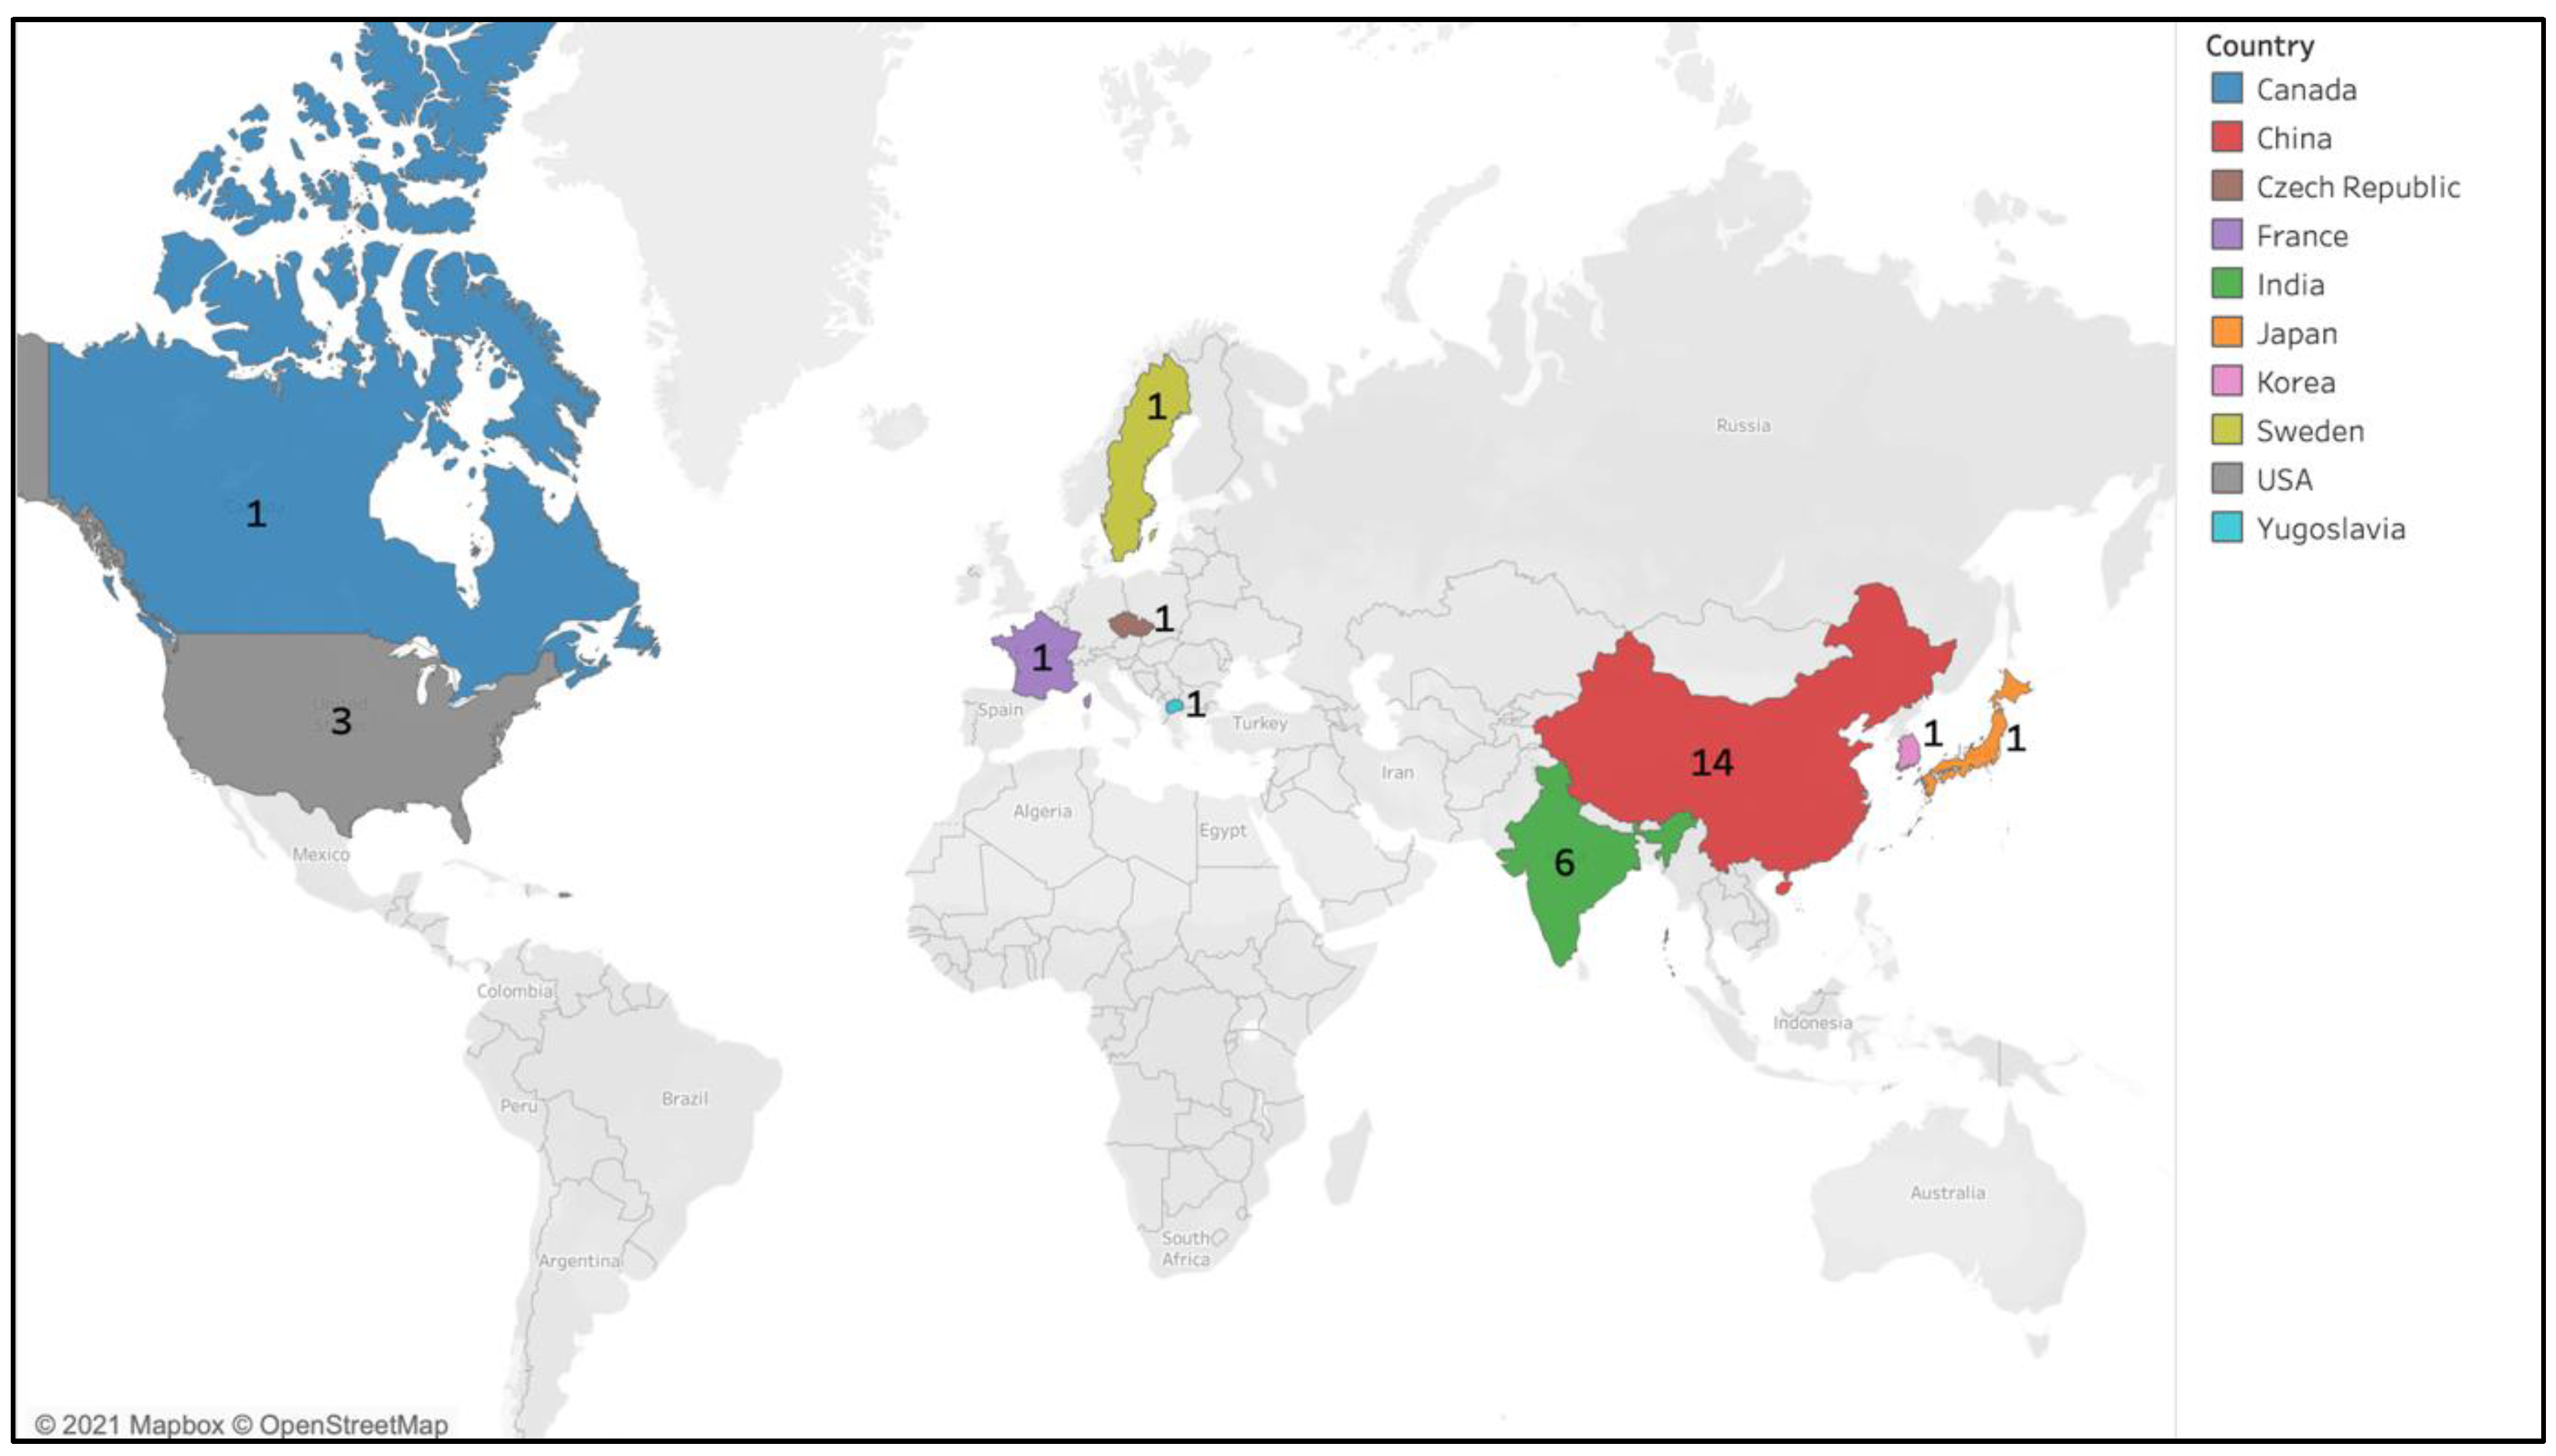
3. Results
3.1. Studies Not Included in the Bayesian Meta-Analyses
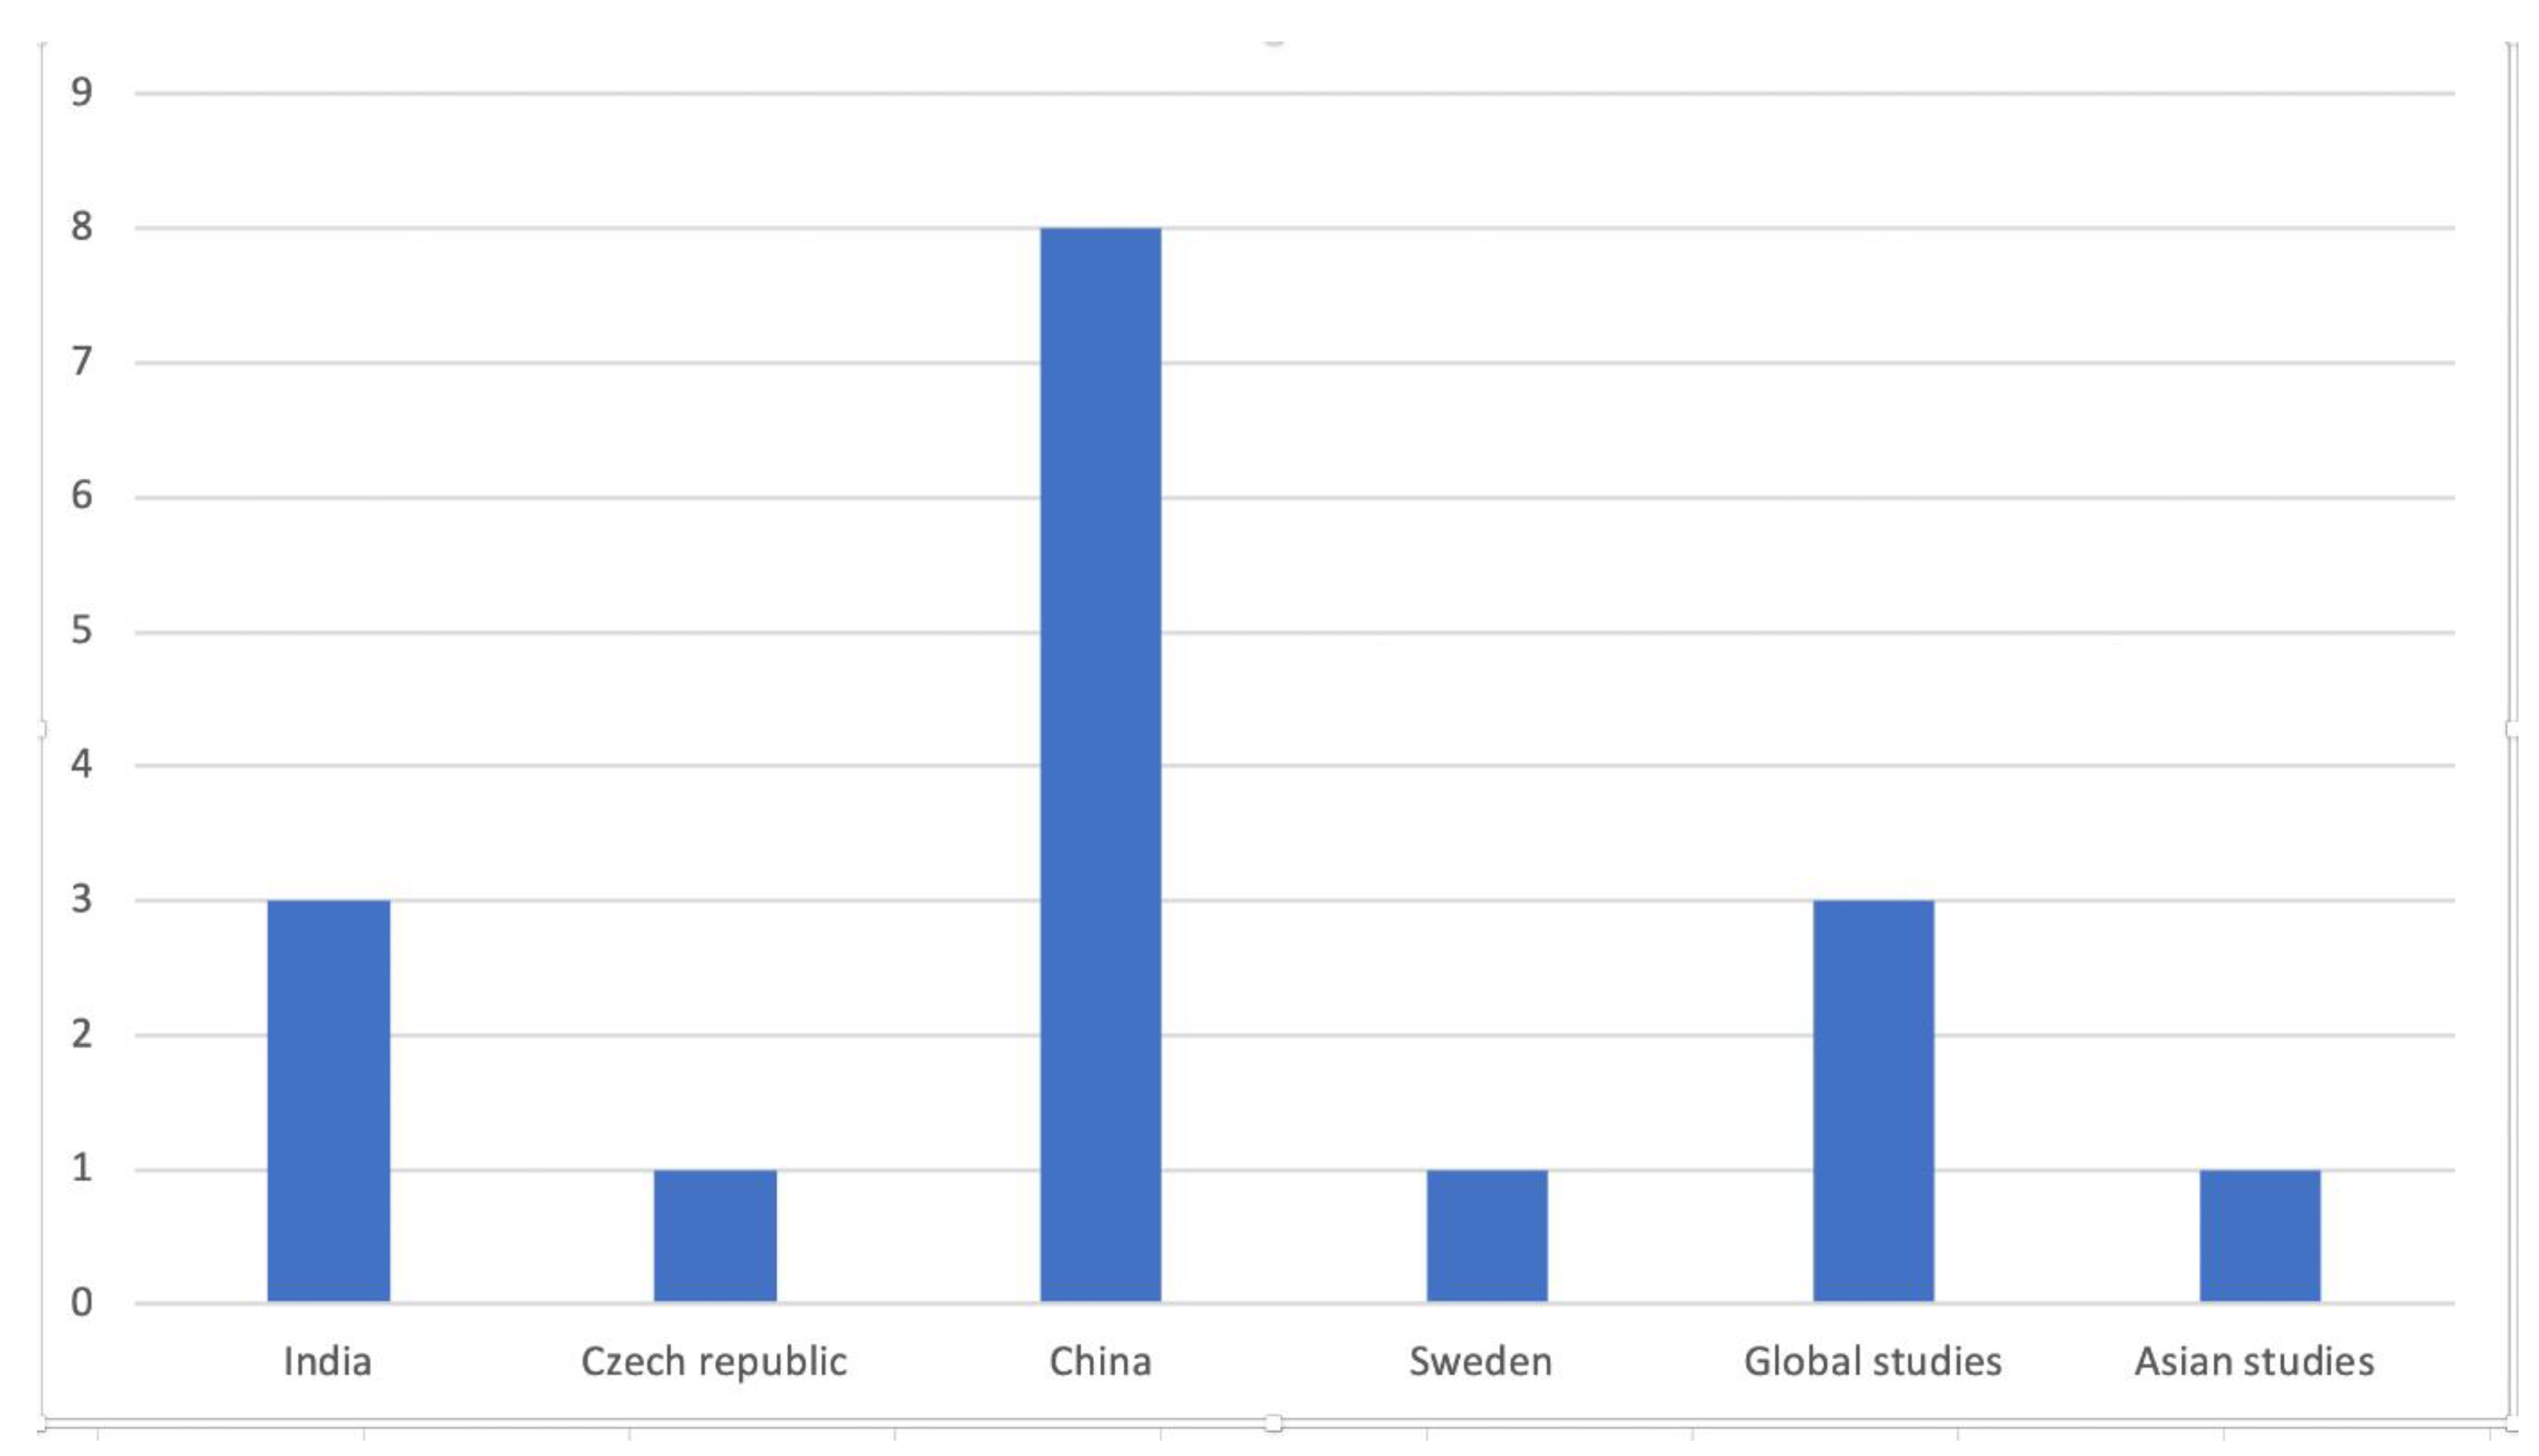
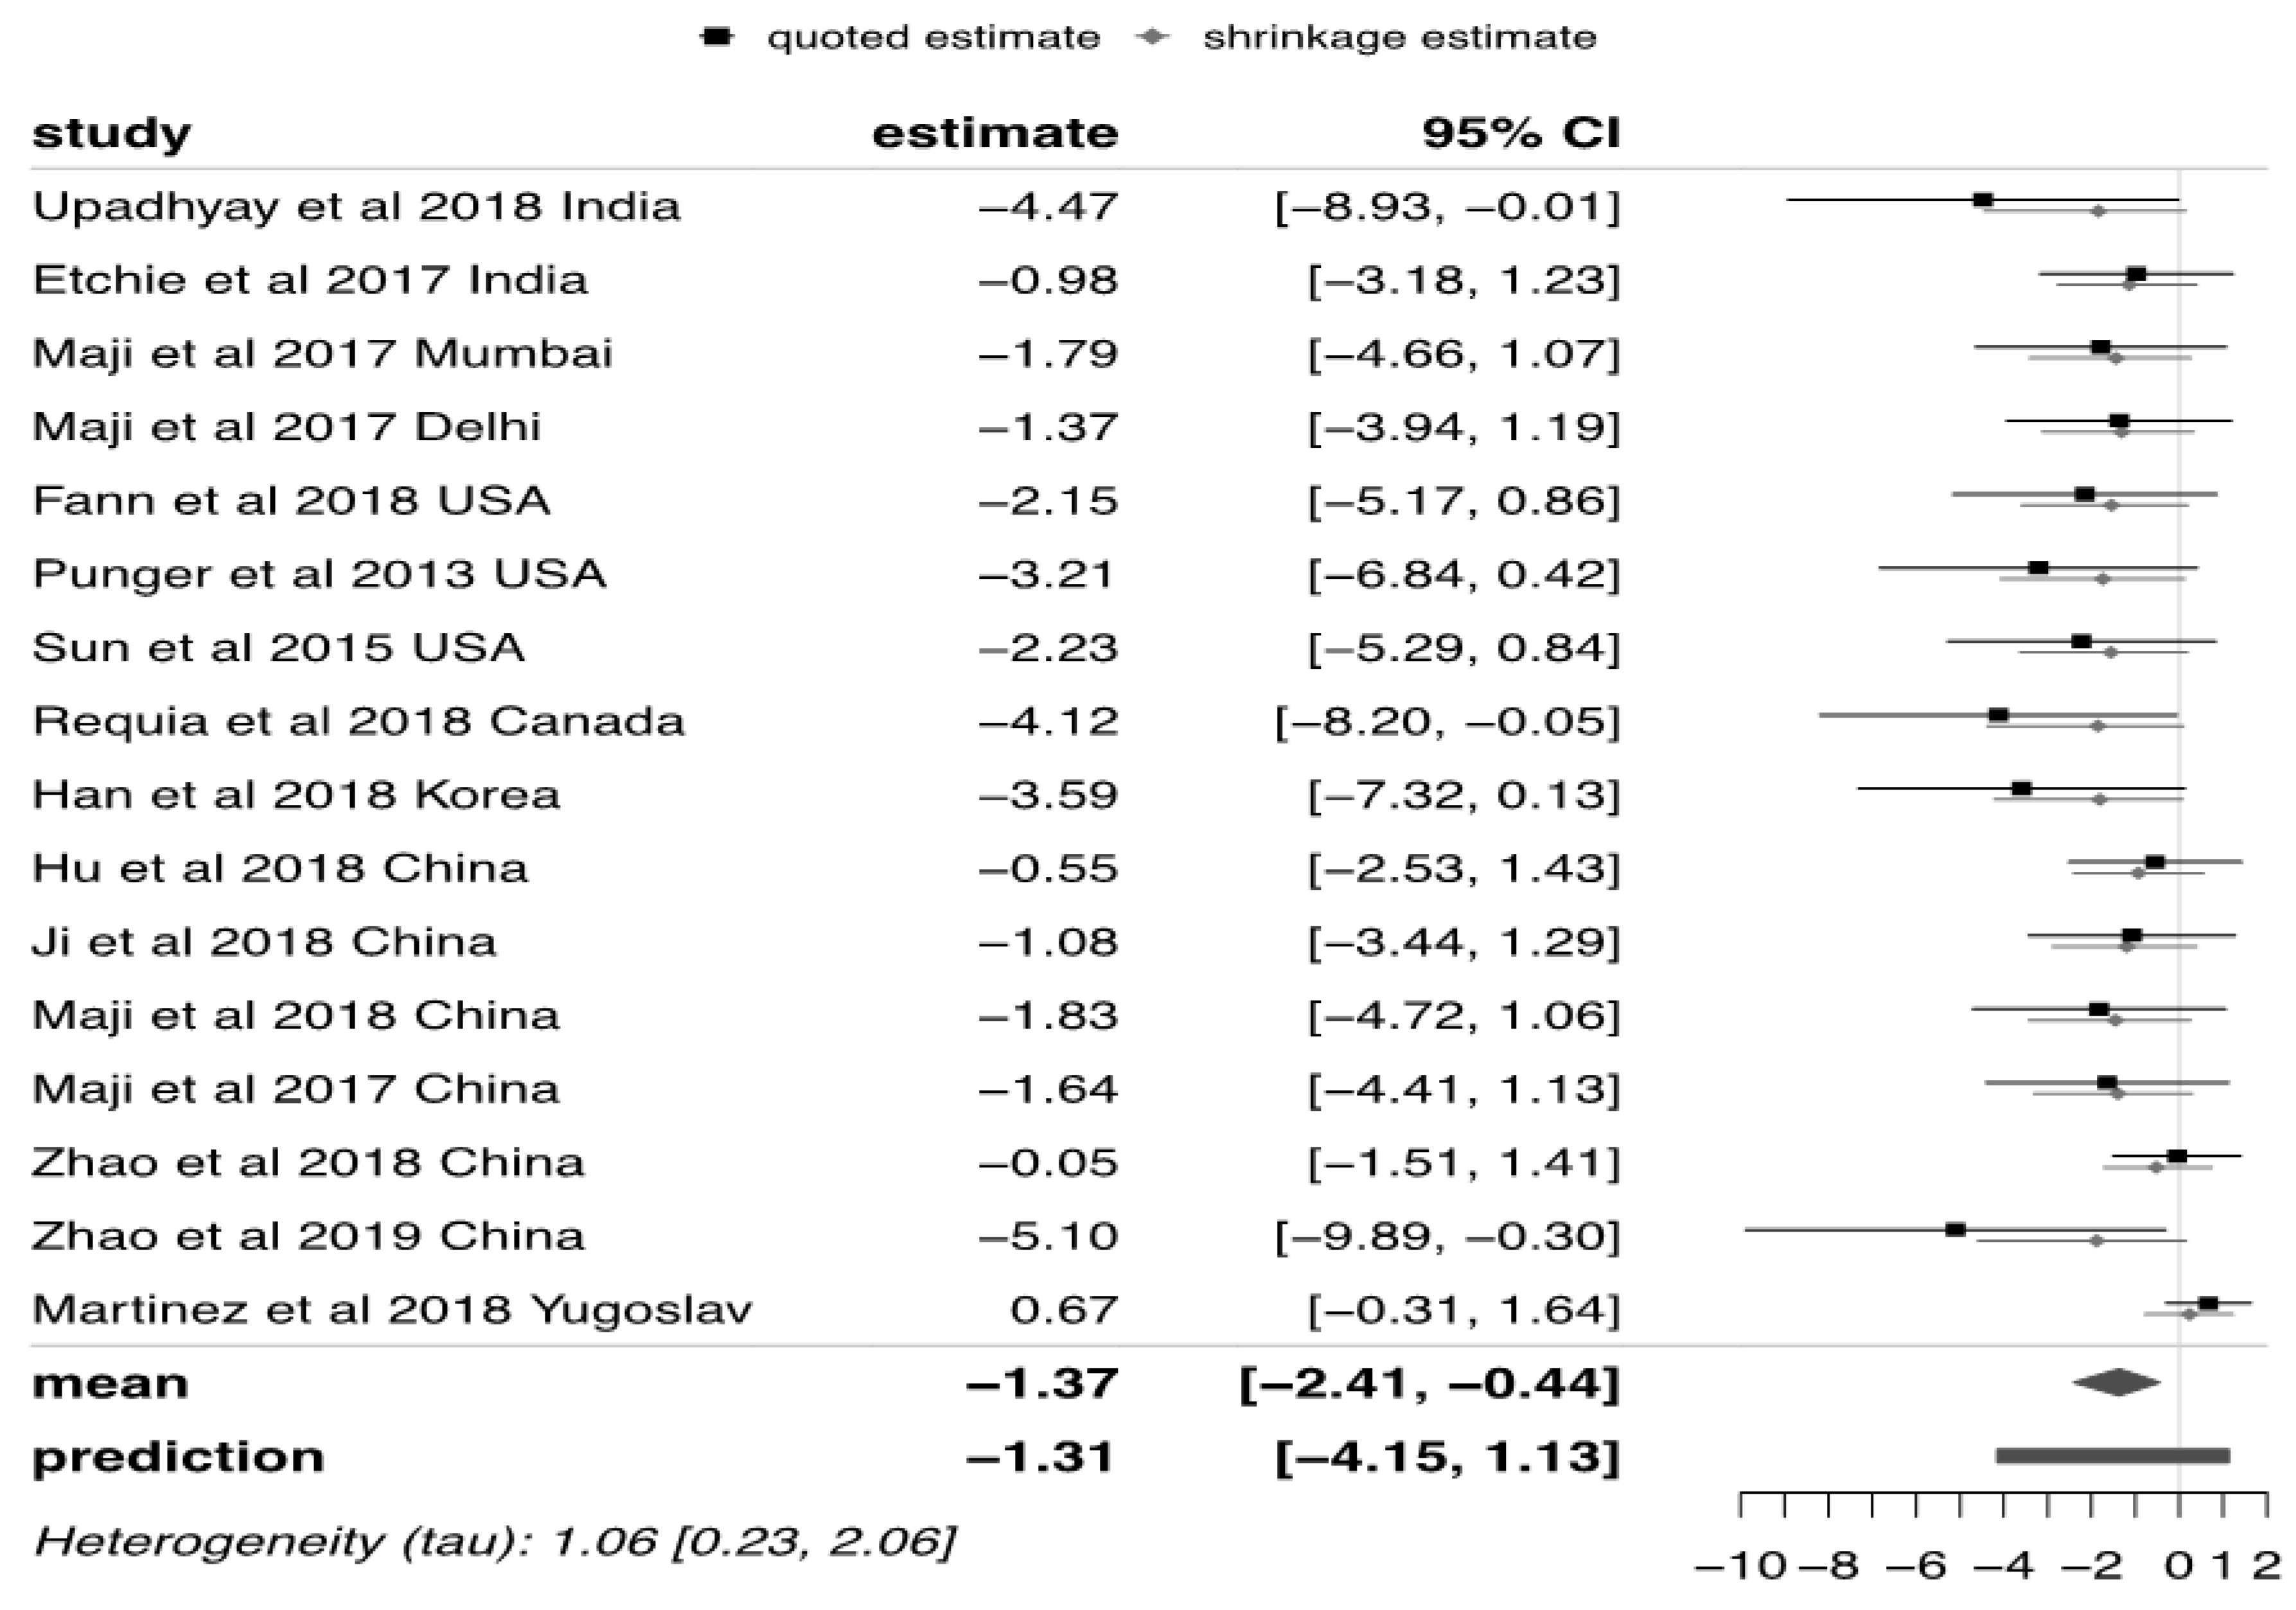
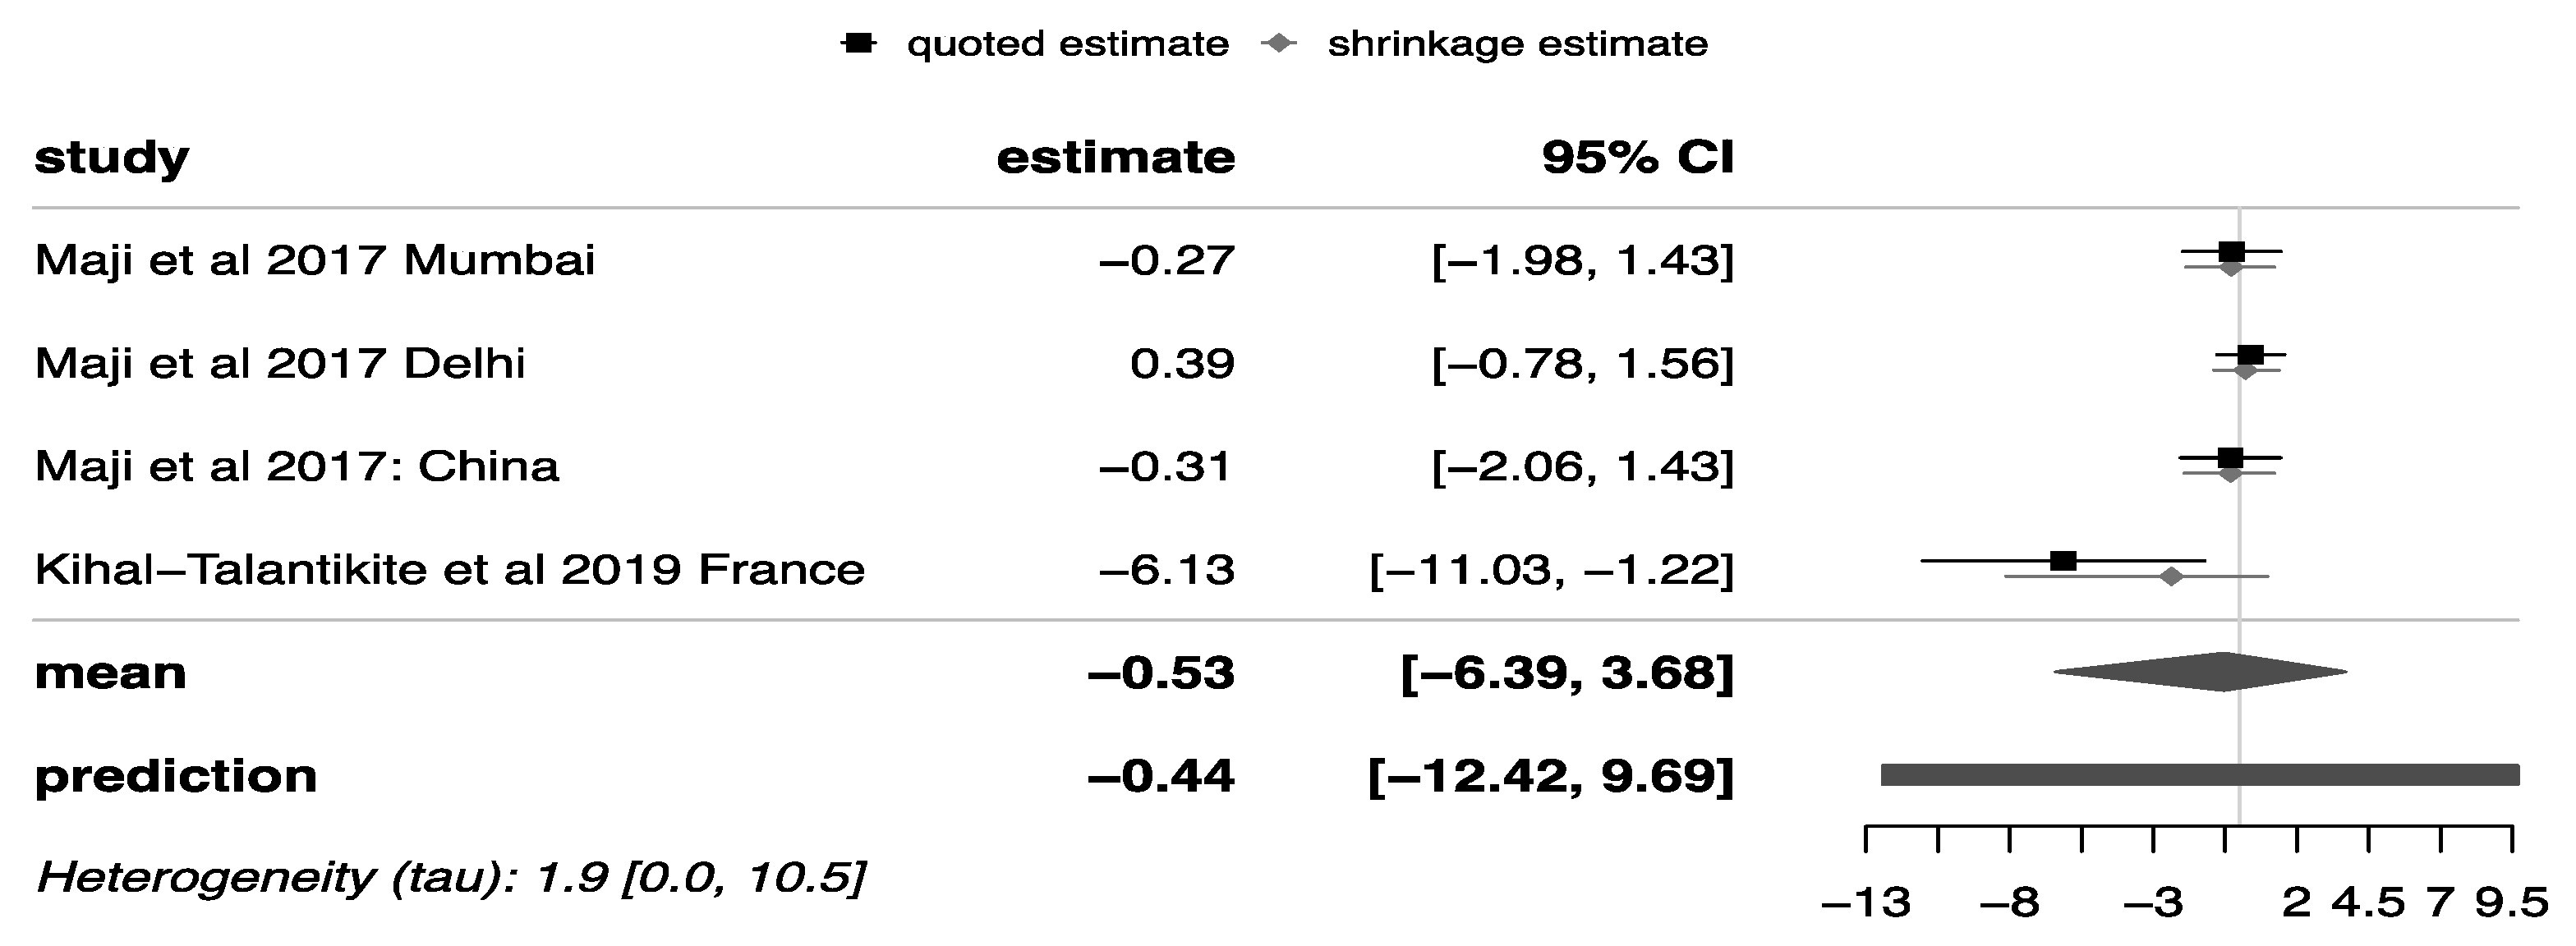
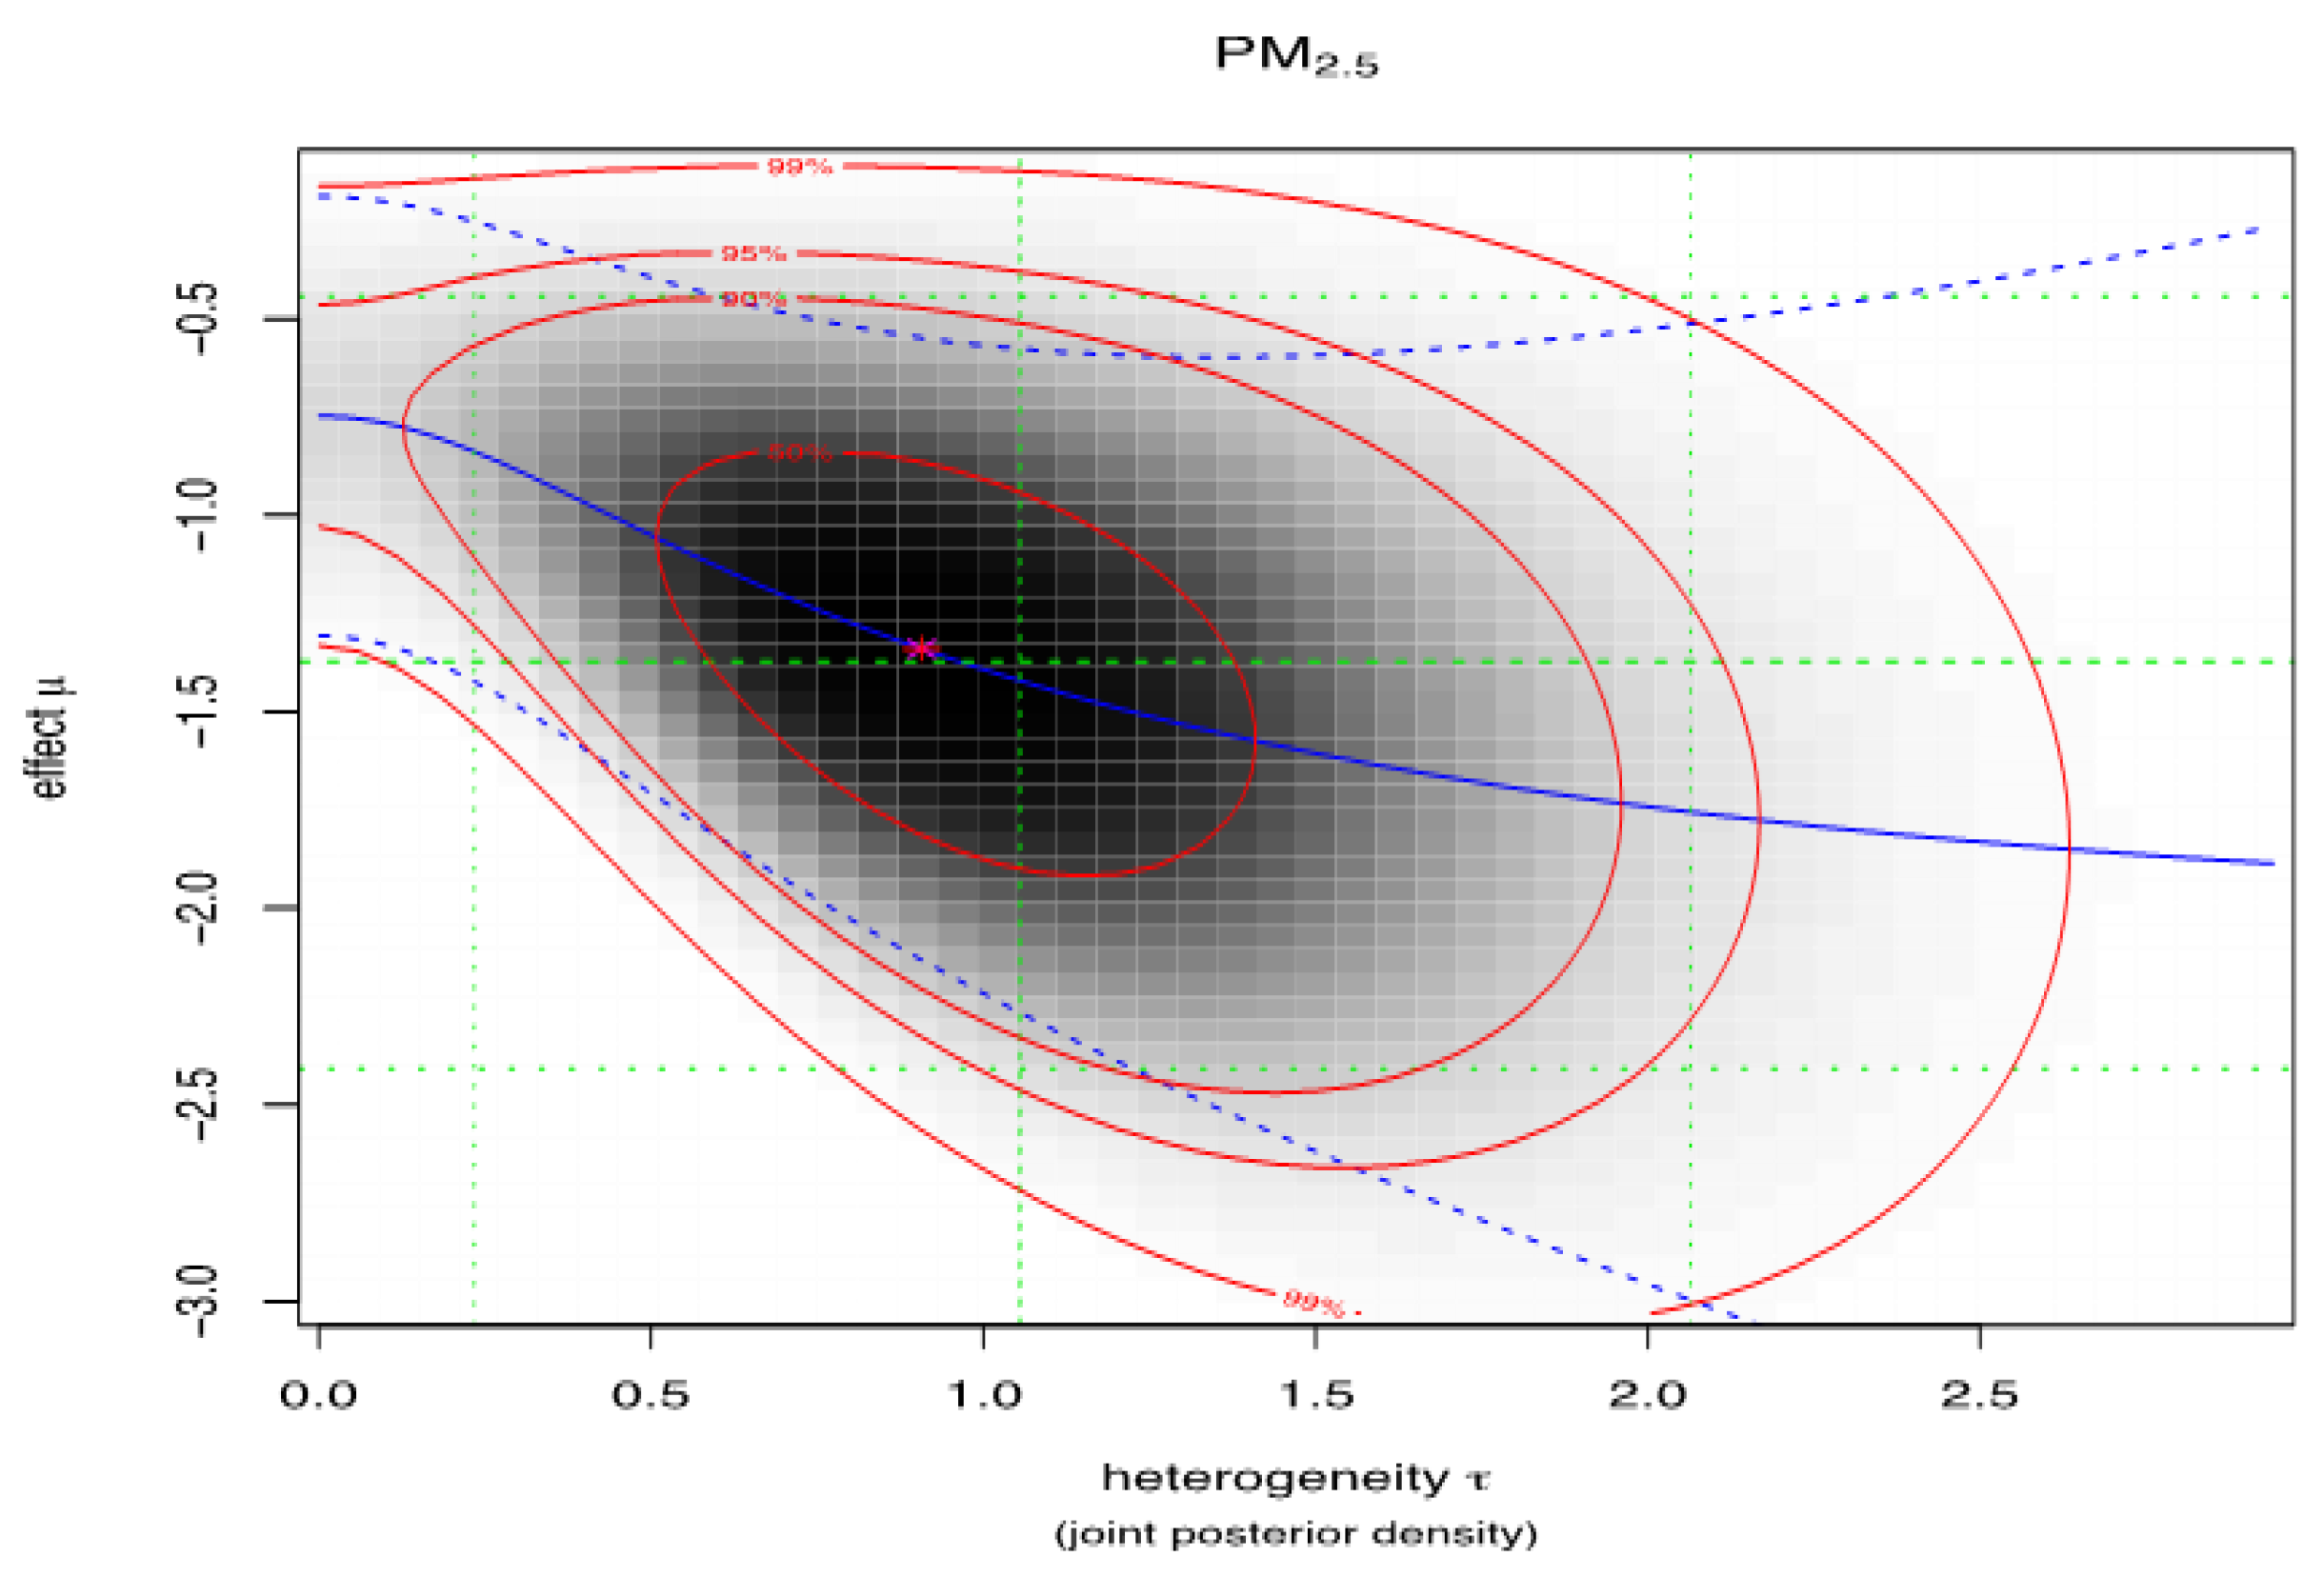
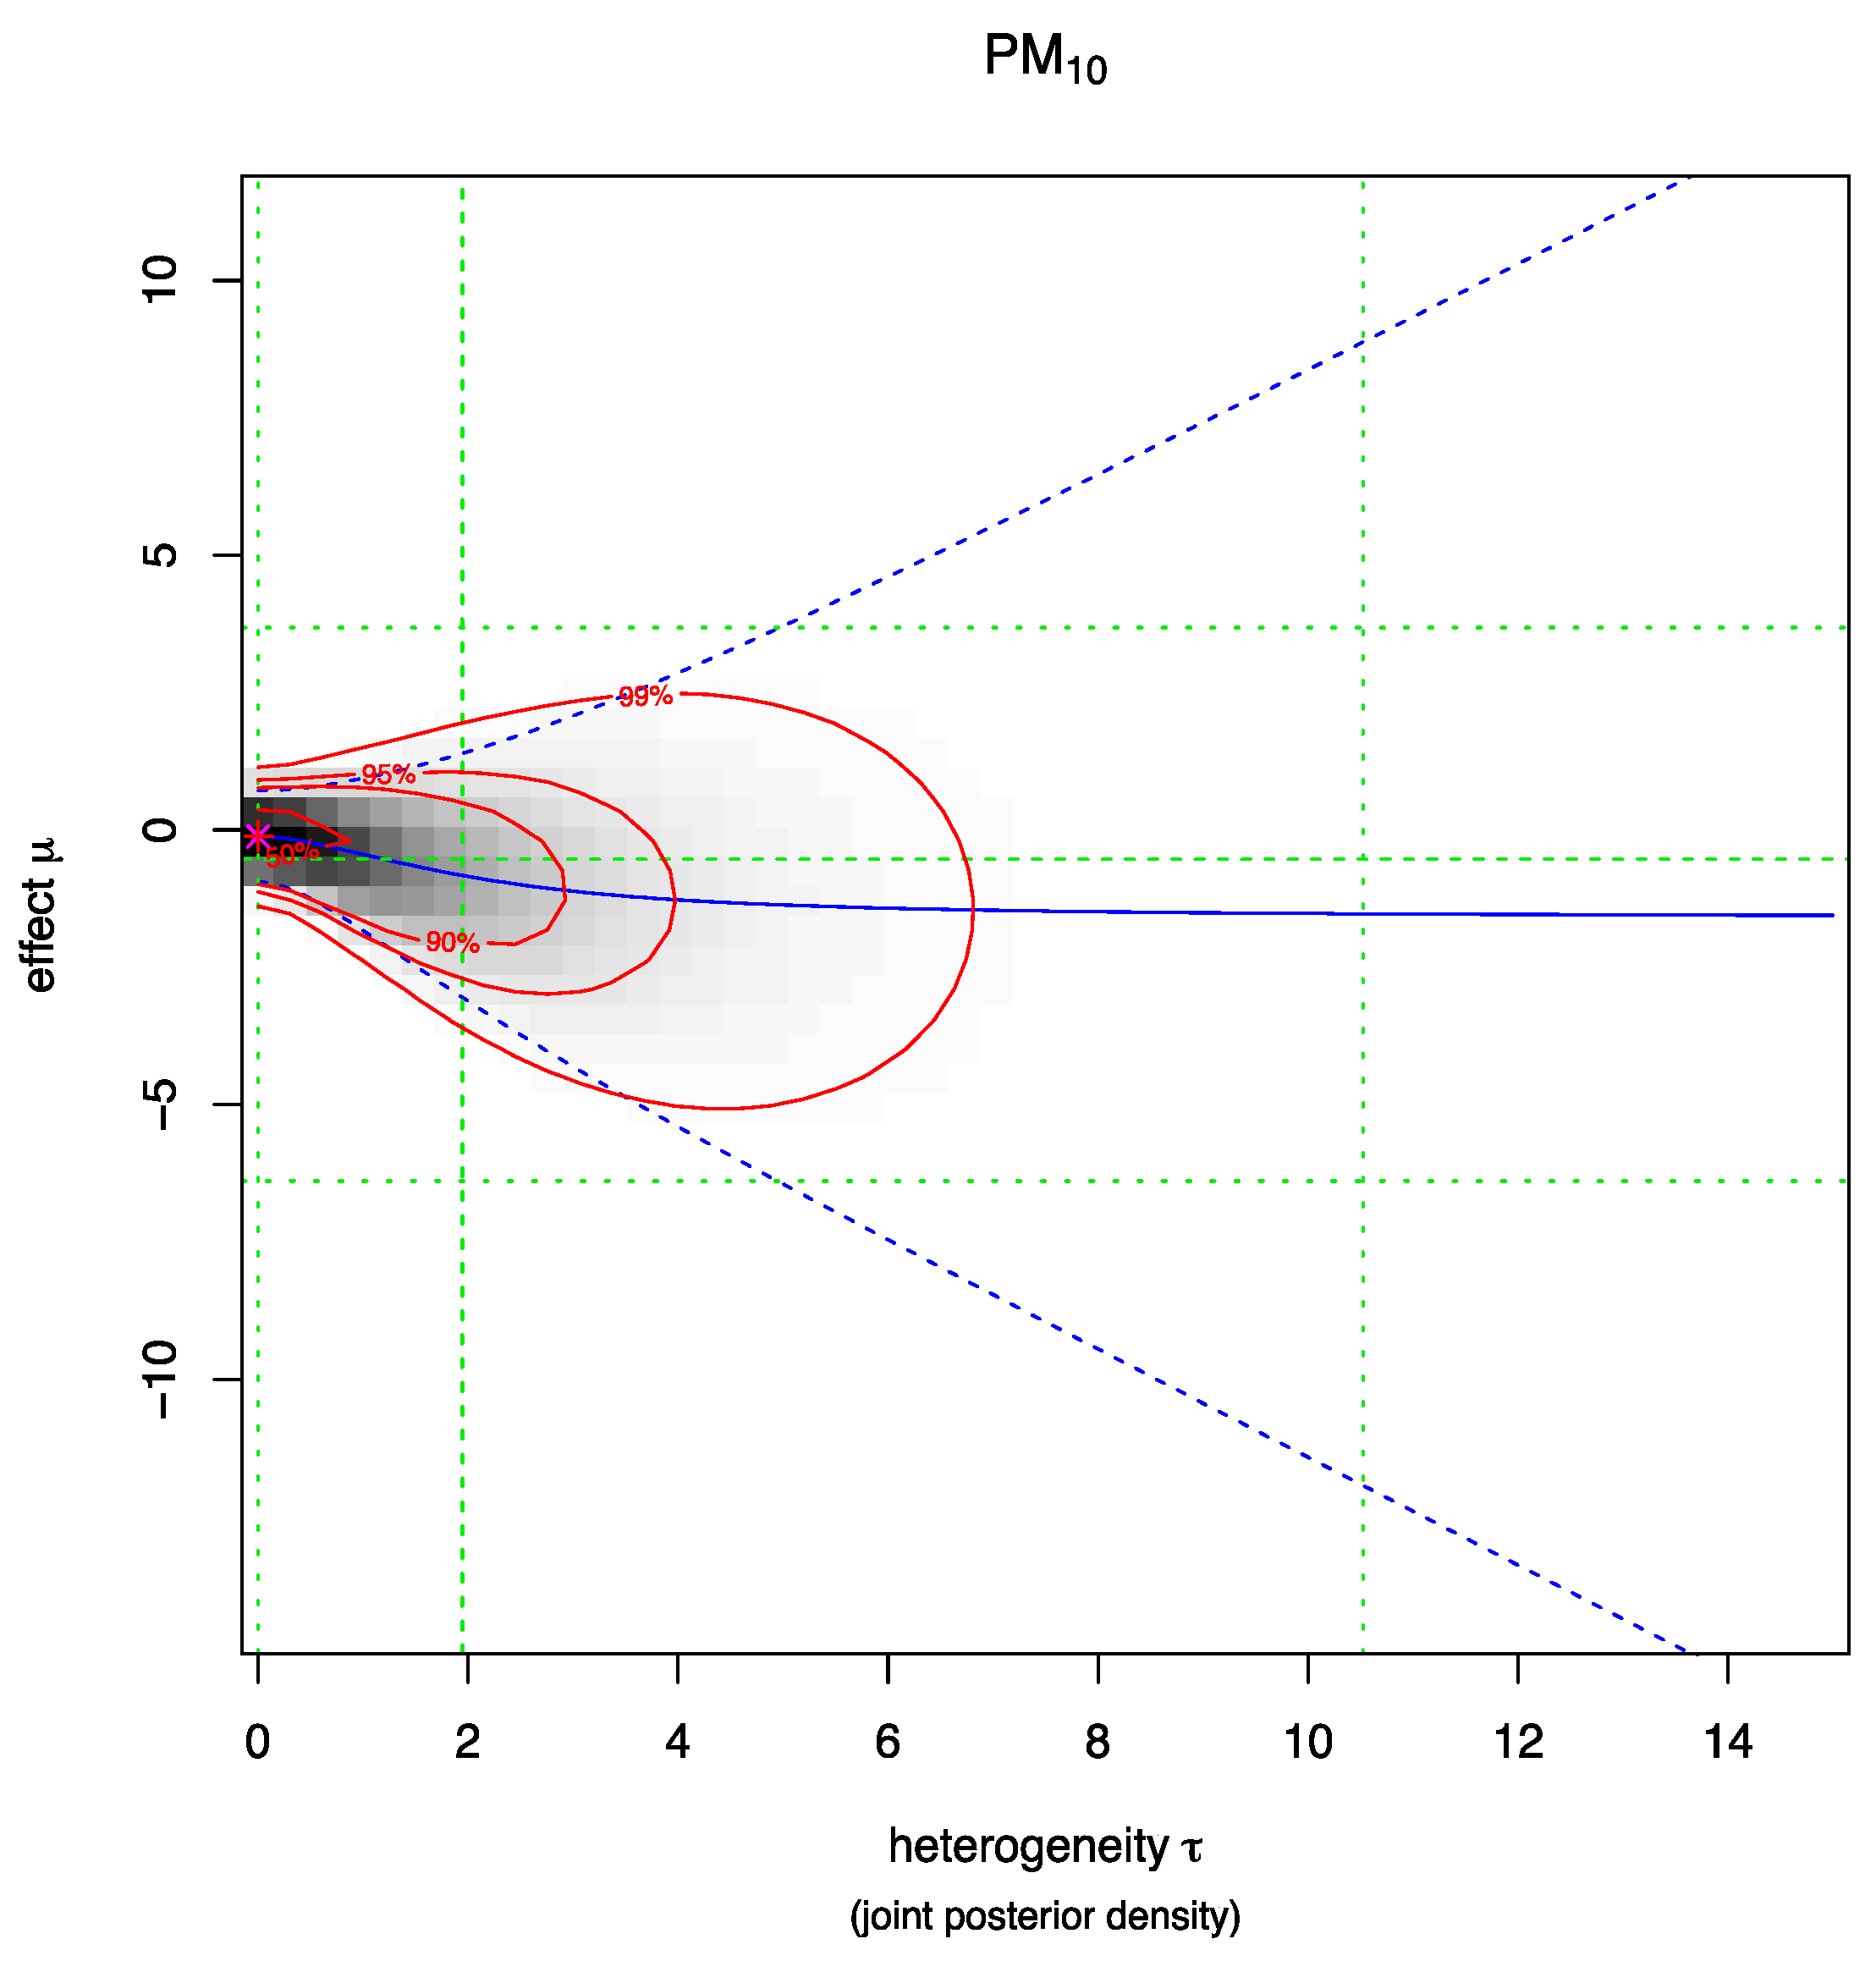
3.2. Results of the Bayesian Meta-Analysis
3.3. Heterogeneity of the Studies
4. Discussion
5. Conclusions
Supplementary Materials
Author Contributions
Funding
Institutional Review Board Statement
Informed Consent Statement
Data Availability Statement
Acknowledgments
Conflicts of Interest
Abbreviations
| PM | Particulate Matter |
| PROSPERO | International Prospective Register of Systematic Reviews |
| NOS | Newcastle-Ottawa Scale |
| PRISMA | Preferred Reporting Items for Systematic Reviews and Meta-Analyses |
| WHO | World Health Organization |
| COPD | Chronic Obstructive Pulmonary diseases |
| IHD | Ischaemic Heart Diseases |
| EPA | Environmental Protection Authority |
| AOD | Aerosol Optimal depth |
| UCI | Upper Confidence Interval |
| LCI | Lower Confidence Interval |
| USA | United States of America |
References
- Wang, J.; Xing, J.; Mathur, R.; Pleim, J.E.; Wang, S.; Hogrefe, C.; Gan, C.M.; Wong, D.C.; Hao, J. Historical, Trends in PM2.5-Related Premature Mortality during 1990–2010 across the Northern Hemisphere. Environ. Health Perspect. 2017, 125, 400–408. [Google Scholar] [CrossRef]
- Li, Y.; Zhao, X.; Liao, Q.; Tao, Y.; Bai, Y. Specific differences and responses to reductions for premature mortality attributable to ambient PM2.5 in China. Sci. Total Environ. 2020, 742, 140643. [Google Scholar] [CrossRef] [PubMed]
- Zhu, J.; Zhang, X.; Zhang, X.; Dong, M.; Wu, J.; Dong, Y.; Chen, R.; Ding, X.; Huang, C.; Zhang, Q.; et al. The burden of ambient air pollution on years of life lost in Wuxi, China, 2012-2015: A time-series study using a distributed lag non-linear model. Environ. Pollut. 2017, 224, 689–697. [Google Scholar] [CrossRef] [PubMed]
- Jain, V.; Dey, S.; Chowdhury, S. Ambient PM2.5 exposure and premature mortality burden in the holy city Varanasi, India. Environ. Pollut. (Barking Essex: 1987) 2017, 226, 182–189. [Google Scholar] [CrossRef]
- Li, J.; Hu, Y.; Liu, L.; Wang, Q.; Zeng, J.; Chen, C. PM2.5 exposure perturbs lung microbiome and its metabolic profile in mice. Sci. Total. Environ. 2020, 721, 137432. [Google Scholar] [CrossRef] [PubMed]
- Zhao, J.; Li, M.; Wang, Z.; Chen, J.; Zhao, J.; Xu, Y.; Wei, W.; Wang, J.; Xie, J. Role of PM2.5 in the development and progression of COPD and its mechanisms. Respir. Res. 2019, 20, 1–13. [Google Scholar] [CrossRef] [PubMed]
- Du, Y.; Xu, X.; Chu, M.; Guo, Y.; Wang, J. Air particulate matter and cardiovascular disease: The epidemiological, biomedical and clinical evidence. J. Thorac. Dis. 2016, 8, E8–E19. [Google Scholar] [PubMed]
- Hayes, R.B.; Lim, C.; Zhang, Y.; Cromar, K.; Shao, Y.; Reynolds, H.R.; Silverman, D.T.; Jones, R.R.; Park, Y.; Jerrett, M.; et al. PM2.5 air pollution and cause-specific cardiovascular disease mortality. Int. J. Epidemiol. 2020, 49, 25–35. [Google Scholar] [CrossRef]
- Norbäck, D.; Lu, C.; Zhang, Y.; Li, B.; Zhao, Z.; Huang, C.; Zhang, X.; Qian, H.; Sun, Y.; Wang, J.; et al. Sources of indoor particulate matter (PM) and outdoor air pollution in China in relation to asthma, wheeze, rhinitis and eczema among pre-school children: Synergistic effects between antibiotics use and PM10 and second hand smoke. Environ. Int. 2019, 125, 252–260. [Google Scholar] [CrossRef] [PubMed]
- Hamanaka, R.B.; Mutlu, G.M. Particulate Matter Air Pollution: Effects on the Cardiovascular System. Front. Endocrinol (Lausanne) 2018, 9, 680. [Google Scholar] [CrossRef]
- Vodonos, A.; Awad, Y.A.; Schwartz, J. The concentration-response between long-term PM2.5 exposure and mortality; A meta-regression approach. Environ. Res. 2018, 166, 677–689. [Google Scholar] [CrossRef]
- Wadud, Z.; Waitz, I.A. Comparison of air quality-related mortality impacts of different transportation modes in the United States. Transp. Res. Rec. 2011, 2233, 99–109. [Google Scholar] [CrossRef]
- Liu, C.; Chen, R.; Sera, F.; Vicedo-Cabrera, A.M.; Guo, Y.; Tong, S.; Coelho, M.S.; Saldiva, P.H.; Lavigne, E.; Matus, P.; et al. Ambient Particulate Air Pollution and Daily Mortality in 652 Cities. N. Engl. J. Med. 2019, 381, 705–715. [Google Scholar] [CrossRef]
- Ford, B.; Heald, C.L. Exploring the Uncertainty Associated with Satellite-Based Estimates of Premature Mortality due to Exposure to Fine Particulate Matter. Atmos. Chem. Phys. 2016, 16, 3499–3523. [Google Scholar] [CrossRef]
- Lo, C.K.L.; Mertz, D.; Loeb, M. Newcastle-Ottawa Scale: Comparing reviewers’ to authors’ assessments. BMC Med. Res. Methodol. 2014, 14, 1–5. [Google Scholar] [CrossRef] [PubMed]
- Lunn, D.; Barrett, J.; Sweeting, M.; Thompson, S. Fully Bayesian hierarchical modelling in two stages, with application to meta-analysis. J. R. Stat. Soc. Ser. C Appl. Stat. 2013, 62, 551. [Google Scholar] [CrossRef]
- Röver, C. Bayesian Random Effect meta-analysis using bayesmeta R package. arXiv 2017, arXiv:1711.08683. [Google Scholar] [CrossRef]
- Nawahda, A. Reductions of PM2.5 air concentrations and possible effects on premature mortality in Japan. Water Air Soil Pollut. 2013, 224, 1–7. [Google Scholar] [CrossRef]
- Huang, D.; Xu, J.; Zhang, S. Valuing the health risks of particulate air pollution in the Pearl River Delta, China. Environ. Sci. Policy 2012, 15, 38–47. [Google Scholar] [CrossRef]
- Corlett, W.J. The Lognormal Distribution: With Special Reference to Its Uses in Economics; Cambridge University Press: Cambridge, UK, 1957. [Google Scholar]
- Limpert, E.; Stahel, W.A. The log-normal distribution. Significance 2017, 14, 8–9. [Google Scholar]
- R Statistical Software, Statistical Computing, Austria. Available online: https://www.R-project.org/ (accessed on 20 January 2020).
- Dokoumetzidis, A.; Aarons, L. Propagation of Population Pharmacokinetic Information Using a Bayesian Approach: Comparison with Meta-Analysis. J. Pharmacokinet. Pharmacodyn. 2005, 32, 4014–4018. [Google Scholar] [CrossRef]
- Upadhyay, A.; Dey, S.; Chowdhury, S.; Goyal, P. Expected health benefits from mitigation of emissions from major anthropogenic PM2.5 sources in India: Statistics at state level. Environ. Pollut. 2018, 242, 1817–1826. [Google Scholar] [CrossRef]
- Chowdhury, S.; Dey, S.; Smith, K.R. Ambient PM2.5 exposure and expected premature mortality to 2100 in India under climate change scenarios. Nat. Commun. 2018, 9, 1–10. [Google Scholar] [CrossRef] [PubMed]
- Etchie, T.O.; Sivanesan, S.; Adewuyi, G.O.; Krishnamurthi, K.; Rao, P.S.; Etchie, A.T.; Pillarisetti, A.; Arora, N.K.; Smith, K.R. The health burden and economic costs averted by ambient PM2.5 pollution reductions in Nagpur, India. Environ. Int. 2017, 102, 145–156. [Google Scholar] [CrossRef] [PubMed]
- Guttikunda, S.K.; Rahul, G. Health impacts of particulate pollution in a megacity-Delhi, India. Environ. Dev. 2013, 6, 8–20. [Google Scholar] [CrossRef]
- Maji, K.J.; Dikshit, A.K.; Deshpande, A. Disability-adjusted life years and economic cost assessment of the health effects related to PM2.5 and PM10 pollution in Mumbai and Delhi, in India from 1991 to 2015. Environ. Sci. Pollut. Res. Int. 2017, 24, 4709–4730. [Google Scholar] [CrossRef]
- Fann, N.; Coffman, E.; Timin, B.; Kelly, J.T. The estimated change in the level and distribution of PM2.5-attributable health impacts in the United States: 2005–2014. Environ. Res. 2018, 167, 506–514. [Google Scholar] [CrossRef] [PubMed]
- Punger, E.M.; West, J.J. The effect of grid resolution on estimates of the burden of ozone and fine particulate matter on premature mortality in the USA. Air Qual. Atmos. Health. 2013, 6, 563–573. [Google Scholar] [CrossRef]
- Sun, J.; Fu, J.S.; Huang, K.; Gao, Y. Estimation of future PM2.5- and ozone-related mortality over the continental United States in a changing climate: An application of high-resolution dynamical downscaling technique. J. Air Waste Manag. Assoc. 2015, 65, 611–623. [Google Scholar] [CrossRef]
- Hu, J.; Huang, L.; Chen, M.; Liao, H.; Zhang, H.; Wang, S.; Zhang, Q.; Ying, Q. Premature Mortality Attributable to Particulate Matter in China: Source Contributions and Responses to Reductions. Environ. Sci. Technol. 2017, 51, 9950–9959. [Google Scholar] [CrossRef]
- Ji, W.; Zhou, B.; Zhao, B. Potential reductions in premature mortality attributable to PM2.5 by reducing indoor pollution: A model analysis for Beijing-Tianjin-Hebei of China. Environ. Pollut. (Barking Essex: 1987) 2019, 245, 260–271. [Google Scholar] [CrossRef]
- Li, T.; Zhang, Y.; Wang, J.; Xu, D.; Yin, Z.; Chen, H.; Lv, Y.; Luo, J.; Zeng, Y.; Liu, Y.; et al. All-cause mortality risk associated with long-term exposure to ambient PM2·5 in China: A cohort study. Lancet Public Health. 2018, 3, e470–e477. [Google Scholar] [CrossRef]
- Lu, X.; Lin, C.; Li, W.; Chen, Y.; Huang, Y.; Lau, A.K. Analysis of the adverse health effects of PM2.5 from 2001 to 2017 in China and the role of urbanization in aggravating the health burden. Sci. Total Environ. 2019, 652, 683–695. [Google Scholar] [CrossRef]
- Ma, G.; Wang, J.; Yu, F.; Guo, X.; Zhang, Y.; Li, C. Assessing the premature death due to ambient particulate matter in China’s urban areas from 2004 to 2013. Front. Environ. Sci. Eng. 2016, 10, 1–10. [Google Scholar] [CrossRef]
- Maji, K.J.; Dikshit, A.K.; Arora, M.; Deshpande, A. Estimating premature mortality attributable to PM2.5 exposure and benefit of air pollution control policies in China for 2020. Sci. Total Environ. 2018, 612, 683–693. [Google Scholar] [CrossRef]
- Maji, K.J.; Mohit, A.; Dikshit, A.K. Burden of disease attributed to ambient PM2.5 and PM10 exposure in 190 cities in China. Environ. Sci. Pollut. Res. 2017, 24, 11559–11572. [Google Scholar] [CrossRef]
- Nie, D.; Chen, M.; Wu, Y.; Ge, X.; Hu, J.; Zhang, K.; Ge, P. Characterization of Fine Particulate Matter and Associated Health Burden in Nanjing. Int. J. Environ. Res. Public Health 2018, 15, 602. [Google Scholar] [CrossRef] [PubMed]
- Zhao, X.; Yu, X.; Wang, Y.; Fan, C. Economic evaluation of health losses from air pollution in Beijing, China. Environ. Sci. Pollut. Res. 2016, 23, 11716–11728. [Google Scholar] [CrossRef] [PubMed]
- Zhao, B.; Zheng, H.; Wang, S.; Smith, K.R.; Lu, X.; Aunan, K.; Gu, Y.; Wang, Y.; Ding, D.; Xing, J.; et al. Change in household fuels dominates the decrease in PM2.5 exposure and premature mortality in China in 2005–2015. Proc. Natl. Acad. Sci. USA 2018, 115, 12401–12406. [Google Scholar] [CrossRef] [PubMed]
- Zhao, B.; Wang, S.; Ding, D.; Wu, W.; Chang, X.; Wang, J.; Xing, J.; Jang, C.; Fu, J.S.; Zhu, Y.; et al. Nonlinear relationships between air pollutant emissions and PM2.5-related health impacts in the Beijing-Tianjin-Hebei region. Sci. Total Environ. 2019, 661, 375–385. [Google Scholar] [CrossRef] [PubMed]
- Xie, R.; Sabel, C.E.; Lu, X.; Zhu, W.; Kan, H.; Nielsen, C.P.; Wang, H. Long-term trend and spatial pattern of PM2.5 induced premature mortality in China. Environ. Int. 2016, 97, 180–186. [Google Scholar] [CrossRef] [PubMed]
- Wang, Q.; Wang, J.; He, M.Z.; Kinney, P.L.; Li, T. A county-level estimate of PM2.5 related chronic mortality risk in China based on multi-model exposure data. Environ. Int. 2018, 110, 105–112. [Google Scholar] [CrossRef]
- Han, C.; Kim, S.; Lim, Y.-H.; Bae, H.-J.; Hong, Y.-C. Spatial and Temporal Trends of Number of Deaths Attributable to Ambient PM2.5 in the Korea. J. Korean Med. Sci. 2018, 33, e193. [Google Scholar] [CrossRef] [PubMed]
- Bulejko, P.; Adamec, V.; Skeřil, R.; Schüllerová, B.; Bencko, V. Levels and Health Risk Assessment of PM10 Aerosol in Brno, Czech Republic. Cent. Eur. J. Public Health 2017, 25, 129–134. [Google Scholar] [CrossRef][Green Version]
- Requia, W.J.; Koutrakis, P. Mapping distance-decay of premature mortality attributable to PM2.5-related traffic congestion. Environ. Pollut. 2018, 243, 9–16. [Google Scholar] [CrossRef] [PubMed]
- Kihal-Talantikite, W.; Legendre, P.; Le Nouveau, P.; Deguen, S. Premature Adult Death and Equity Impact of a Reduction of NO2, PM10, and PM2.5 Levels in Paris—A Health Impact Assessment Study Conducted at the Census Block Level. Int. J. Environ. Res. Public Health 2018, 16, 38. [Google Scholar] [CrossRef]
- Martinez, G.S.; Spadaro, J.V.; Chapizanis, D.; Kendrovski, V.; Kochubovski, M.; Mudu, P. Health Impacts and Economic Costs of Air Pollution in the Metropolitan Area of Skopje. Int. J. Environ. Res. Public Health 2018, 15, 626. [Google Scholar] [CrossRef] [PubMed]
- Segersson, D.; Eneroth, K.; Gidhagen, L.; Johansson, C.; Omstedt, G.; Nylén, A.E.; Forsberg, B. Health Impact of PM10, PM2.5 and Black Carbon Exposure Due to Different Source Sectors in Stockholm, Gothenburg and Umea, Sweden. Int. J. Environ. Res. Public Health 2017, 14, 742. [Google Scholar] [CrossRef] [PubMed]
- Fang, Y.Y.; Mauzerall, D.L.; Liu, J.; Fiore, A.M.; Horowitz, L.W. Impacts of 21st century climate change on global air pollution-related premature mortality. Clim. Chang. 2013, 121, 239–253. [Google Scholar] [CrossRef]
- Silva, R.A.; Adelman, Z.; Fry, M.M.; West, J.J. The Impact of Individual Anthropogenic Emissions Sectors on the Global Burden of Human Mortality due to Ambient Air Pollution. Environ. Health Perspect. 2016, 124, 1776–1784. [Google Scholar] [CrossRef] [PubMed]
- Silva, R.A.; West, J.J.; Lamarque, J.F.; Shindell, D.T.; Collins, W.J.; Dalsoren, S.; Faluvegi, G.; Folberth, G.; Horowitz, L.W.; Nagashima, T.; et al. The effect of future ambient air pollution on human premature mortality to 2100 using output from the ACCMIP model ensemble. Atmos. Chem. Phys. 2016, 16, 9847–9862. [Google Scholar] [CrossRef] [PubMed]
- Nawahda, A.; Yamashita, K.; Ohara, T.; Kurokawa, J.; Yamaji, K. Evaluation of premature mortality caused by exposure to PM2.5 and ozone in East Asia: 2000, 2005, 2020. Water Air Soil Pollut. 2012, 223, 3445–3459. [Google Scholar] [CrossRef]
- Shi, Y.; Matsunaga, T.; Yamaguchi, Y.; Zhao, A.; Li, Z.; Gu, X. Long-term trends and spatial patterns of PM2.5-induced premature mortality in South and Southeast Asia from 1999 to 2014. Sci. Total Environ. 2018, 631, 1504–1514. [Google Scholar] [CrossRef]
- Ridley, D.A.; Heald, C.L.; Ridley, K.J.; Kroll, J.H. Causes and consequences of decreasing atmospheric organic aerosol in the United States. Proc. Natl. Acad. Sci. USA 2018, 115, 290–295. [Google Scholar] [CrossRef] [PubMed]
- Shi, Y.; Zhao, A.; Matsunaga, T.; Yamaguchi, Y.; Zang, S.; Li, Z.; Yu, T.; Gu, X. Underlying causes of PM2.5-induced premature mortality and potential health benefits of air pollution control in South and Southeast Asia from 1999 to 2014. Environ. Int. 2018, 121, 814–823. [Google Scholar] [CrossRef] [PubMed]
- Shi, Y.; Matsunaga, T.; Yamaguchi, Y.; Li, Z.; Gu, X.; Chen, X. Long-term trends and spatial patterns of satellite-retrieved PM2.5 concentrations in South and Southeast Asia from 1999 to 2014. Sci. Total Environ. 2018, 615, 177–1786. [Google Scholar] [CrossRef]
- Hanigan, I.C.; Broome, R.A.; Chaston, T.B.; Cope, M.; Dennekamp, M.; Heyworth, J.S.; Heathcote, K.; Horsley, J.A.; Jalaludin, B.; Jegasothy, E.; et al. Avoidable Mortality Attributable to Anthropogenic Fine Particulate Matter (PM2.5) in Australia. Int. J. Environ. Res Public Health 2020, 18, 254. [Google Scholar] [CrossRef]
- Chen, J.; Hoek, G. Long-term exposure to PM and all-cause and cause-specific mortality: A systematic review and meta-analysis. Environ. Int. 2020, 143, 105974. [Google Scholar] [CrossRef]
- Gronlund, C.J.; Humbert, S.; Shaked, S.; O’Neill, M.S.; Jolliet, O. Characterizing the burden of disease of particulate matter for life cycle impact assessment. Air Qual. Atmos. Health 2015, 8, 29–46. [Google Scholar] [CrossRef]
- Lelieveld, J.; Evans, J.S.; Fnais, M.; Giannadaki, D.; Pozzer, A. The contribution of outdoor air pollution sources to premature mortality on a global scale. Nature 2015, 525, 367–371. [Google Scholar] [CrossRef]
- Brook, R.D.; Rajagopalan, S.; Pope, C.A., III; Brook, J.R.; Bhatnagar, A.; Diez-Roux, A.V.; Holguin, F.; Hong, Y.; Luepker, R.V.; Mittleman, M.A.; et al. Particulate matter air pollution and cardiovascular disease: An update to the scientific statement from the American Heart Association. Circulation 2010, 121, 2331–2378. [Google Scholar] [CrossRef] [PubMed]
- Pope, C.A.; Coleman, N.; Pond, Z.A.; Burnett, R.T. Fine particulate air pollution and human mortality: 25+ years of cohort studies. Environ. Res. 2020, 183, 108924. [Google Scholar] [CrossRef] [PubMed]
- Thurston, G.D.; Newman, J.D. Walking to a pathway for cardiovascular effects of air pollution. Lancet 2018, 391, 291–292. [Google Scholar] [CrossRef]
- Spiegelhalter, D.J. Incorporating Bayesian Ideas into Health-Care Evaluation. Stat. Sci. 2004, 19, 156–174. [Google Scholar] [CrossRef]
- Chen, D.G.; Peace, K.E. Applied Meta-Analysis with R; CRC Press: Boca Raton, FL, USA, 2013. [Google Scholar]


| Researcher, Year of the Publication Country | Size of the PM Exposure Ascertained by: | Referred Data to Calculate Premature Mortality: | Results: | Study Quality | ||||
|---|---|---|---|---|---|---|---|---|
| Chowdhury 2018 India [25] | PM2.5 annual average Estimate up to 2100 by applying changes in PM2.5 from baseline period (2001–2005) derived from Coupled Model Inter-comparison Project 5 (CMIP5) models to the satellite-derived baseline PM2.5 | Global Burden of Disease data | Time | Estimated premature deaths Annual mean for 1,000,000 population | Good | |||
| 2031–2040 | 18.1 ± 4.6 | |||||||
| 2061–2070 | 10.5 ± 3.5 | |||||||
| 2091–2100 | 6.5 ± 2.6 | |||||||
| Guttikunda et al., 2012 [27] India Delhi and its satellite cities—Gurgaon, Noida, Greater Noida, Faridabad, and Ghaziabad | PM2.5 and PM10 Annual average Calculated using Atmospheric Transport Modelling System (ATMoS) | 2010 mortality data India | Estimated premature deaths for the year 2010 is between 7350–16,200 | Good | ||||
| Jain et al. 2017 India [4] Holy city Varanasi | PM2.5 Annual average Measured using Satellite-retrieved AOD | Global Burden of Disease data | 5700 (2800; 7500) annual premature deaths were estimated due to PM2.5 (0.16% of the population) | Fair | ||||
| Buleiko et al. 2017 Czech Republic [46] | PM10 annual average Automatic and gravimetric sampling methods | Health Statistic Yearbook data for the country | Year | PM10 annual average (SD) Premature deaths: annual (SD) | Good | |||
| T1 (Traffic, Urban, Residential) | T2 (Traffic, Urban, Trade) | B1 (Background, Urban, Residential) | B2 (Background, Urban, Residential, Trade) | |||||
| 2009 | 30.13 ± 8.66 22 ± 16 | 33.19 ± 15.35 32 ± 21 | 24.43 ± 5.71 15 ± 12 | 34.52 ± 8.81 31 ± 14 | ||||
| 2010 | 34.33 ± 11.52 29 ± 19 | 33.84 ± 17.26 48 ± 14 | 27.00 ± 7.57 22 ± 14 | 31.43 ± 9.21 24 ± 17 | ||||
| 2011 | 30.90 ± 12.28 28 ± 19 | 30.33 ± 15.92 35 ± 22 | 26.97 ± 9.70 21 ± 17 | 29.58 ± 12.74 26 ± 20 | ||||
| 2012 | 30.32 ± 8.33 27 ± 14 | 27.98 ± 13.03 31 ± 17 | 24.15 ± 4.27 13 ± 9 | 33.30 ± 9.04 28 ± 16 | ||||
| 2013 | 27.29 ± 8.26 27 ± 11 | 34.87 ± 12.03 35 ± 18 | 22.48 ± 6.76 19 ± 7 | 27.13 ± 7.20 22 ± 12 | ||||
| Li et al. 2018 China [34] | PM2.5 annual mean GEOS-Chem chemical transport model by Satellite data | Direct follow-up data | 1,765,820 people aged 65 years and older in China in 2010 had premature deaths related to PM2.5 exposure | Fair | ||||
| Lu et al. 2019 China [35] | PM2.5 annual satellite-retrieved | Global health data exchange | For the year 2017: 962,900 | Fair | ||||
| Ma et al. 2016 China [36] | PM10 annual average Directly measured | China statistical yearbook | 2004 to 2013, annual premature deaths attributable to China’s outdoor air pollution ranged from 350,000 to 520,000 | Good | ||||
| Nie et al. 2018 China [39] | PM2.5 hourly and daily and annually Directly measured | China Public Health and Family Planning Statistical Yearbook | In 2014, the AFs (%) for COPD, LC, IHD, and stroke were 23% (95% CI: 12, 32%), 29% (95% CI: 11, 40%), 30% (95% CI: 21, 48%), and 46% (95% CI: 17, 57%), respectively. In 2015, with the decrease of PM2.5, the AFs had fallen to 20% (95% CI: 10, 29%), 25% (95% CI: 8, 35%), 28% (95% CI: 19, 44%), and 44% (95% CI: 15, 55%). | Good | ||||
| Zhao et al. 2016 China [40] | PM10 Directly measured daily calculated for the year | Health statistic yearbook | Air pollutant | Disease causing premature deaths | Dose response coefficient | Fair | ||
| PM10 | Respiratory disease | 0.0048 | ||||||
| Cardiovascular diseases | 0.0019 | |||||||
| Xie et al. 2016 China [43] | PM2.5 Satellite derived analysis | Global Burden of Disease data 2000–2010 | In total 1.25 million premature deaths due to anthropogenic PM2.5 in 2010 | Fair | ||||
| Wang et al. 2018 China [44] | PM2.5 annual average Satellite derived analysis | Provincial level data and global burden of disease data | Premature deaths attributed to PM2.5 nationwide amounted to 1.27 million in total | Fair | ||||
| Nawahda et al. 2013 Japan [18] | PM7.5–10 Directly monitored by the National Institute of Environmental studies | Japan Statistics Bureau | 2006–2009 total of 40,000 premature deaths attributed In 2009: 8347 (95%CI: 2087, 16,695) | Good | ||||
| Huang et al. 2011 China [19] Pearl River | PM10 annual average Directly measured by Environmental monitoring center | Health Statistic Yearbook data 5.71 × 10⁷ | Mean (95%CI) | Good | ||||
| Acute PM10 effect | 12,786 (3449, 20,837) | |||||||
| Chronic PM10 effect | 15 (4, 26) | |||||||
| Segersson et al. 2017 [50] Sweden | PM2.5 and PM10 annual mean dispersion modelling to assess annual mean exposure | Swedish Cause of Death Register | Number of premature deaths: PM2.5: 256 PM2.5–10: 54 | Good | ||||
| Fang et al. 2013 Global [51] | PM2.5 modelled annually Using AM3 design | WHO data | Global estimate over 21st century annually (accounts for climate change): 100,000 95%CI: (95% CI: 66,000, 130,000) | Good | ||||
| Wang et al. 2017 Global [1] | PM2.5 annually CMAQ modelling | Global Burden of Disease data | PM2.5-mortalities in East Asia and South Asia increased by 21% and 85% respectively, from 866,000 and 578,000 in 1990, to 1,048,000 and 1,068,000 in 2010. PM2.5-mortalities in developed regions (i.e., Europe and high-income North America) decreased substantially by 67% and 58% respectively | Good | ||||
| Silva et al. 2016 Global [52] | PM2.5 Annually Integrated exposure–response model | Global Burden of Disease data | 2.23 (95% CI: 1.04; 3.33) million premature mortalities/year in 2005 | Good | ||||
| Silva et al. 2016 Global [53] | PM2.5 Annually to forecast ACCMIP models | Global Burden of Disease data | 2030: 17,200 (95%CI: −386,000, 661,000) 2050: −1,210,000 (95%CI: −1,730,000, −835,000) 2100: −1,310,000 (95%CI: −2,040,000, −174,000) | Good | ||||
| Nawahda et al. 2012 [54] South East Asia | PM2.5 annually CMAQ modelling | WHO data | 2000: 237,665 (95%CI: 59, 416,475) 2005: 405,035 (95%CI: 101,259, 810,070) 2020: 313,438 (95%CI: 78,360, 626,876) | Good | ||||
| Shi et al. 2018 [57] South and South East Asia | PM2.5 Annual GEOS-Chem chemical transport model | Global Burden of Disease data | During 1999–2014, the estimated total average annual premature deaths mortality due to PM2.5 exposure in SSEA reached 1,447,000 (95% CI: 9,353,00l, 2,541,100) | Good | ||||
| Researcher, Year of the Publication Country | Size of the PM Exposure Ascertained by: | Referred Data to Calculate Premature Mortality and the Baseline Population: | Results: | Quality of the Study: | |
|---|---|---|---|---|---|
| Upadhyay et al., 2018 [24] India | PM2.5 annual average Calculated using WRF-Chem simulation | Global Burden of Disease data and Indian census data 1.23 × 10⁹ | PM2.5 level µg m−3 | Number of premature deaths avoided annually if completely mitigated | Good |
| Transport: 3.8 ± 4.3 Industrial: 5.5 ± 2.7 Energy: 2.2 ± 2.3 | 92,380 (95%CI: 40,978, 140,741) | ||||
| Residential: 26.2 ± 12.5 | 378,295 (95%CI: 175,002, 575,293) | ||||
| Pooled estimate: 187,400 (95%CI: 47,073;746,038) premature deaths annually if completely mitigated the effect of PM2.5 annually | |||||
| Etchie et al. 2017 India [26] Nagpur city | PM2.5 & PM10 Annual average Directly measured | Life tables 4.65 × 10⁶ | Premature deaths in 2013 (95%CI) due to PM2.5 was 3300 (2600, 4200) Population in Nagpur is 4,653,570 | Good | |
| Maji et al. 2017 India [28] Mumbai and Delhi | PM2.5 and PM10 annualDirectly measured if unavailable in some stations a conversion factor was used | Global Burden of Disease data Mumbai: 2.25 × 10⁷ Delhi: 1.82 × 10⁷ | The annual average deaths attribute to PM2.5 in Mumbai and Delhi was 10,880 (95%CI: 5520, 16,387) and 10,900 (95%CI: 6118, 15,879). Annual average premature deaths attributable to PM10 was around 25,006 (95%CI: 16,550; 32,346) and 32,115 (95%CI: 22,619; 39,192) for year 1991–2015 in the urban area of Mumbai and Delhi. | Good | |
| Fann et al. 2018 USA [29] | PM2.5 annual average CMAQ modelling | BenMAP-CE software (USA Environmental protection agency. Washington, DC, USA) Using country level data 3.18 × 10⁸ | Year | Number of premature deaths and 95%CI | Good |
| 2005 | 150,000 (100,000, 200,000) | ||||
| 2011 | 124,000 (84,000, 160,000) | ||||
| 2014 | 121,000 (83,000, 160,000) | ||||
| Punger et al. 2013 USA [30] | PM2.5 annual average CMAQ modelling | BenMAP Based on centre for Disease Control Data 2.95 × 10⁸ | 66,000 (95%CI: 39,300; 84,500) premature deaths in 2005 | Good | |
| Sun et al. 2015 USA [31] | PM2.5 annual WRF/CMAQ modelling | BenMAP-CE software Using country level data 2.82 × 10⁸ | 103,300 (70,400; 135,700) for the year 2000 60,700 (35,000; 86,000) for the year 2050 | Good | |
| Requia et al. 2018 Canada [47] Hamilton | PM2.5 annual estimates EPA’s MOVES model | Statistics Canada 5.19 × 10⁵ | Total premature deaths over Hamilton to be 73.10 (95%CI: 39.05; 82.11) deaths per year. | Good | |
| Kihal-Talantikite et al., 2018 [48] France | PM2.5 and PM10 The ESMERALDA Atmospheric Modelling system | Paris Death Registry | 2007–2009, the number of attributable deaths was equal 3209 (95%CI: 1938, 3355) and 2662 (95% CI: 2859, 3553) | Good | |
| Han et al. 2018 Korea [45] | PM2.5 annual average Directly measured CMAQ method | Using population census data 5.10 × 10⁷ | In 2015 the number of premature deaths due to PM2.5: 8539 (8428; 8649) | Good | |
| Hu et al. 2018 China [32] | PM2.5 annual average Mean exposure taken from average from 60 cities CMAQ model | China Public Health and Family Planning Statistical Yearbook 2014 1.35 × 10⁹ | In 2013 PM2.5 related premature deaths for adults ≥30 years old is approximately 1.30 million, 95%CI: 0.69l, 1.78 million | Good | |
| Ji et al. 2019 China [33] Beijing-Tianjin-Heibei | PM2.5 Directly measuredModelled with previous data | Global Burden of Disease data 1.05 × 10⁸ | 74,000 (95% confidence interval CI: 43,000, 111,000) premature deaths were attributable to PM2.5 exposure in 2013. | Good | |
| Maji et al. 2018 China [37] | PM2.5 Air quality monitoring network measurements | Global burden of disease data 1.37 × 10⁹ | PM2.5 in 161 cities was 652 thousand (95%CI:298, 902) thousand premature deaths in 2015 | Good | |
| Maji et al. 2017 China [38] | PM2.5 and 10 Air quality monitoring network | Global Burden of disease data 1.37 × 10⁹ | Total premature deaths in China from 2014–2015 PM2.5 722,370 (95%CI: 322,716, 987,519 PM10 pollution has caused 1,491,774 (95%CI: 972,770, 1,960,303) premature deaths (age > 30) in China | Good | |
| Zhao et al. 2018 China [41] | PM2.5 annual average CMAQ modelling | Global Burden of Disease Data 1.37 × 10⁹ | PM2.5 related premature deaths in 2005 amounted to 1.72 (95%CI: 1.47, 1.99) million. The marginal contribution of household fuels was estimated at 0.91 (0.72, 1.13) million, 53% (46, 60%) of the total | Good | |
| Zhao et al. 2019 China [42] Beijing, Tianjin, Hebei | PM2.5 meteorologically assessed CMAQ modelling | Global Burden of Disease data 1.12 × 10⁸ | Exposure:long term PM2.5 | Good | |
| COPD | 17.42(95%CI: 9.45, 24.40) thousand | ||||
| IHD | 36.29(95%CI: 27.24, 48.48) thousand | ||||
| Lung cancer | 13.53(95%CI: 5.19, 18.19) thousand | ||||
| Stroke | 61.91(95%CI: 27.71, 79.93) thousand | ||||
| Acute lower respiratory infection | 0.91(95%CI: 0.62, 1.14) thousand | ||||
| Annual premature deaths: Short term PM2.5 18.7 thousand Long term PM2.5 130.1 thousand | |||||
| Martinez et al. 2018 Yugoslav Republic of Macedonia [49] | PM2.5 and PM10 annual average Directly measured | State statistical office 5.44 × 10⁵ | PM2.5: 1199 premature deaths (95%CI: 821, 1519) in the year 2012 | Good | |
Publisher’s Note: MDPI stays neutral with regard to jurisdictional claims in published maps and institutional affiliations. |
© 2021 by the authors. Licensee MDPI, Basel, Switzerland. This article is an open access article distributed under the terms and conditions of the Creative Commons Attribution (CC BY) license (https://creativecommons.org/licenses/by/4.0/).
Share and Cite
Waidyatillake, N.T.; Campbell, P.T.; Vicendese, D.; Dharmage, S.C.; Curto, A.; Stevenson, M. Particulate Matter and Premature Mortality: A Bayesian Meta-Analysis. Int. J. Environ. Res. Public Health 2021, 18, 7655. https://doi.org/10.3390/ijerph18147655
Waidyatillake NT, Campbell PT, Vicendese D, Dharmage SC, Curto A, Stevenson M. Particulate Matter and Premature Mortality: A Bayesian Meta-Analysis. International Journal of Environmental Research and Public Health. 2021; 18(14):7655. https://doi.org/10.3390/ijerph18147655
Chicago/Turabian StyleWaidyatillake, Nilakshi T., Patricia T. Campbell, Don Vicendese, Shyamali C. Dharmage, Ariadna Curto, and Mark Stevenson. 2021. "Particulate Matter and Premature Mortality: A Bayesian Meta-Analysis" International Journal of Environmental Research and Public Health 18, no. 14: 7655. https://doi.org/10.3390/ijerph18147655
APA StyleWaidyatillake, N. T., Campbell, P. T., Vicendese, D., Dharmage, S. C., Curto, A., & Stevenson, M. (2021). Particulate Matter and Premature Mortality: A Bayesian Meta-Analysis. International Journal of Environmental Research and Public Health, 18(14), 7655. https://doi.org/10.3390/ijerph18147655