
Economic Burden of Stroke Disease: A Systematic Review

 ,
,  ,
,  ,
,
Abstract
:1. Introduction
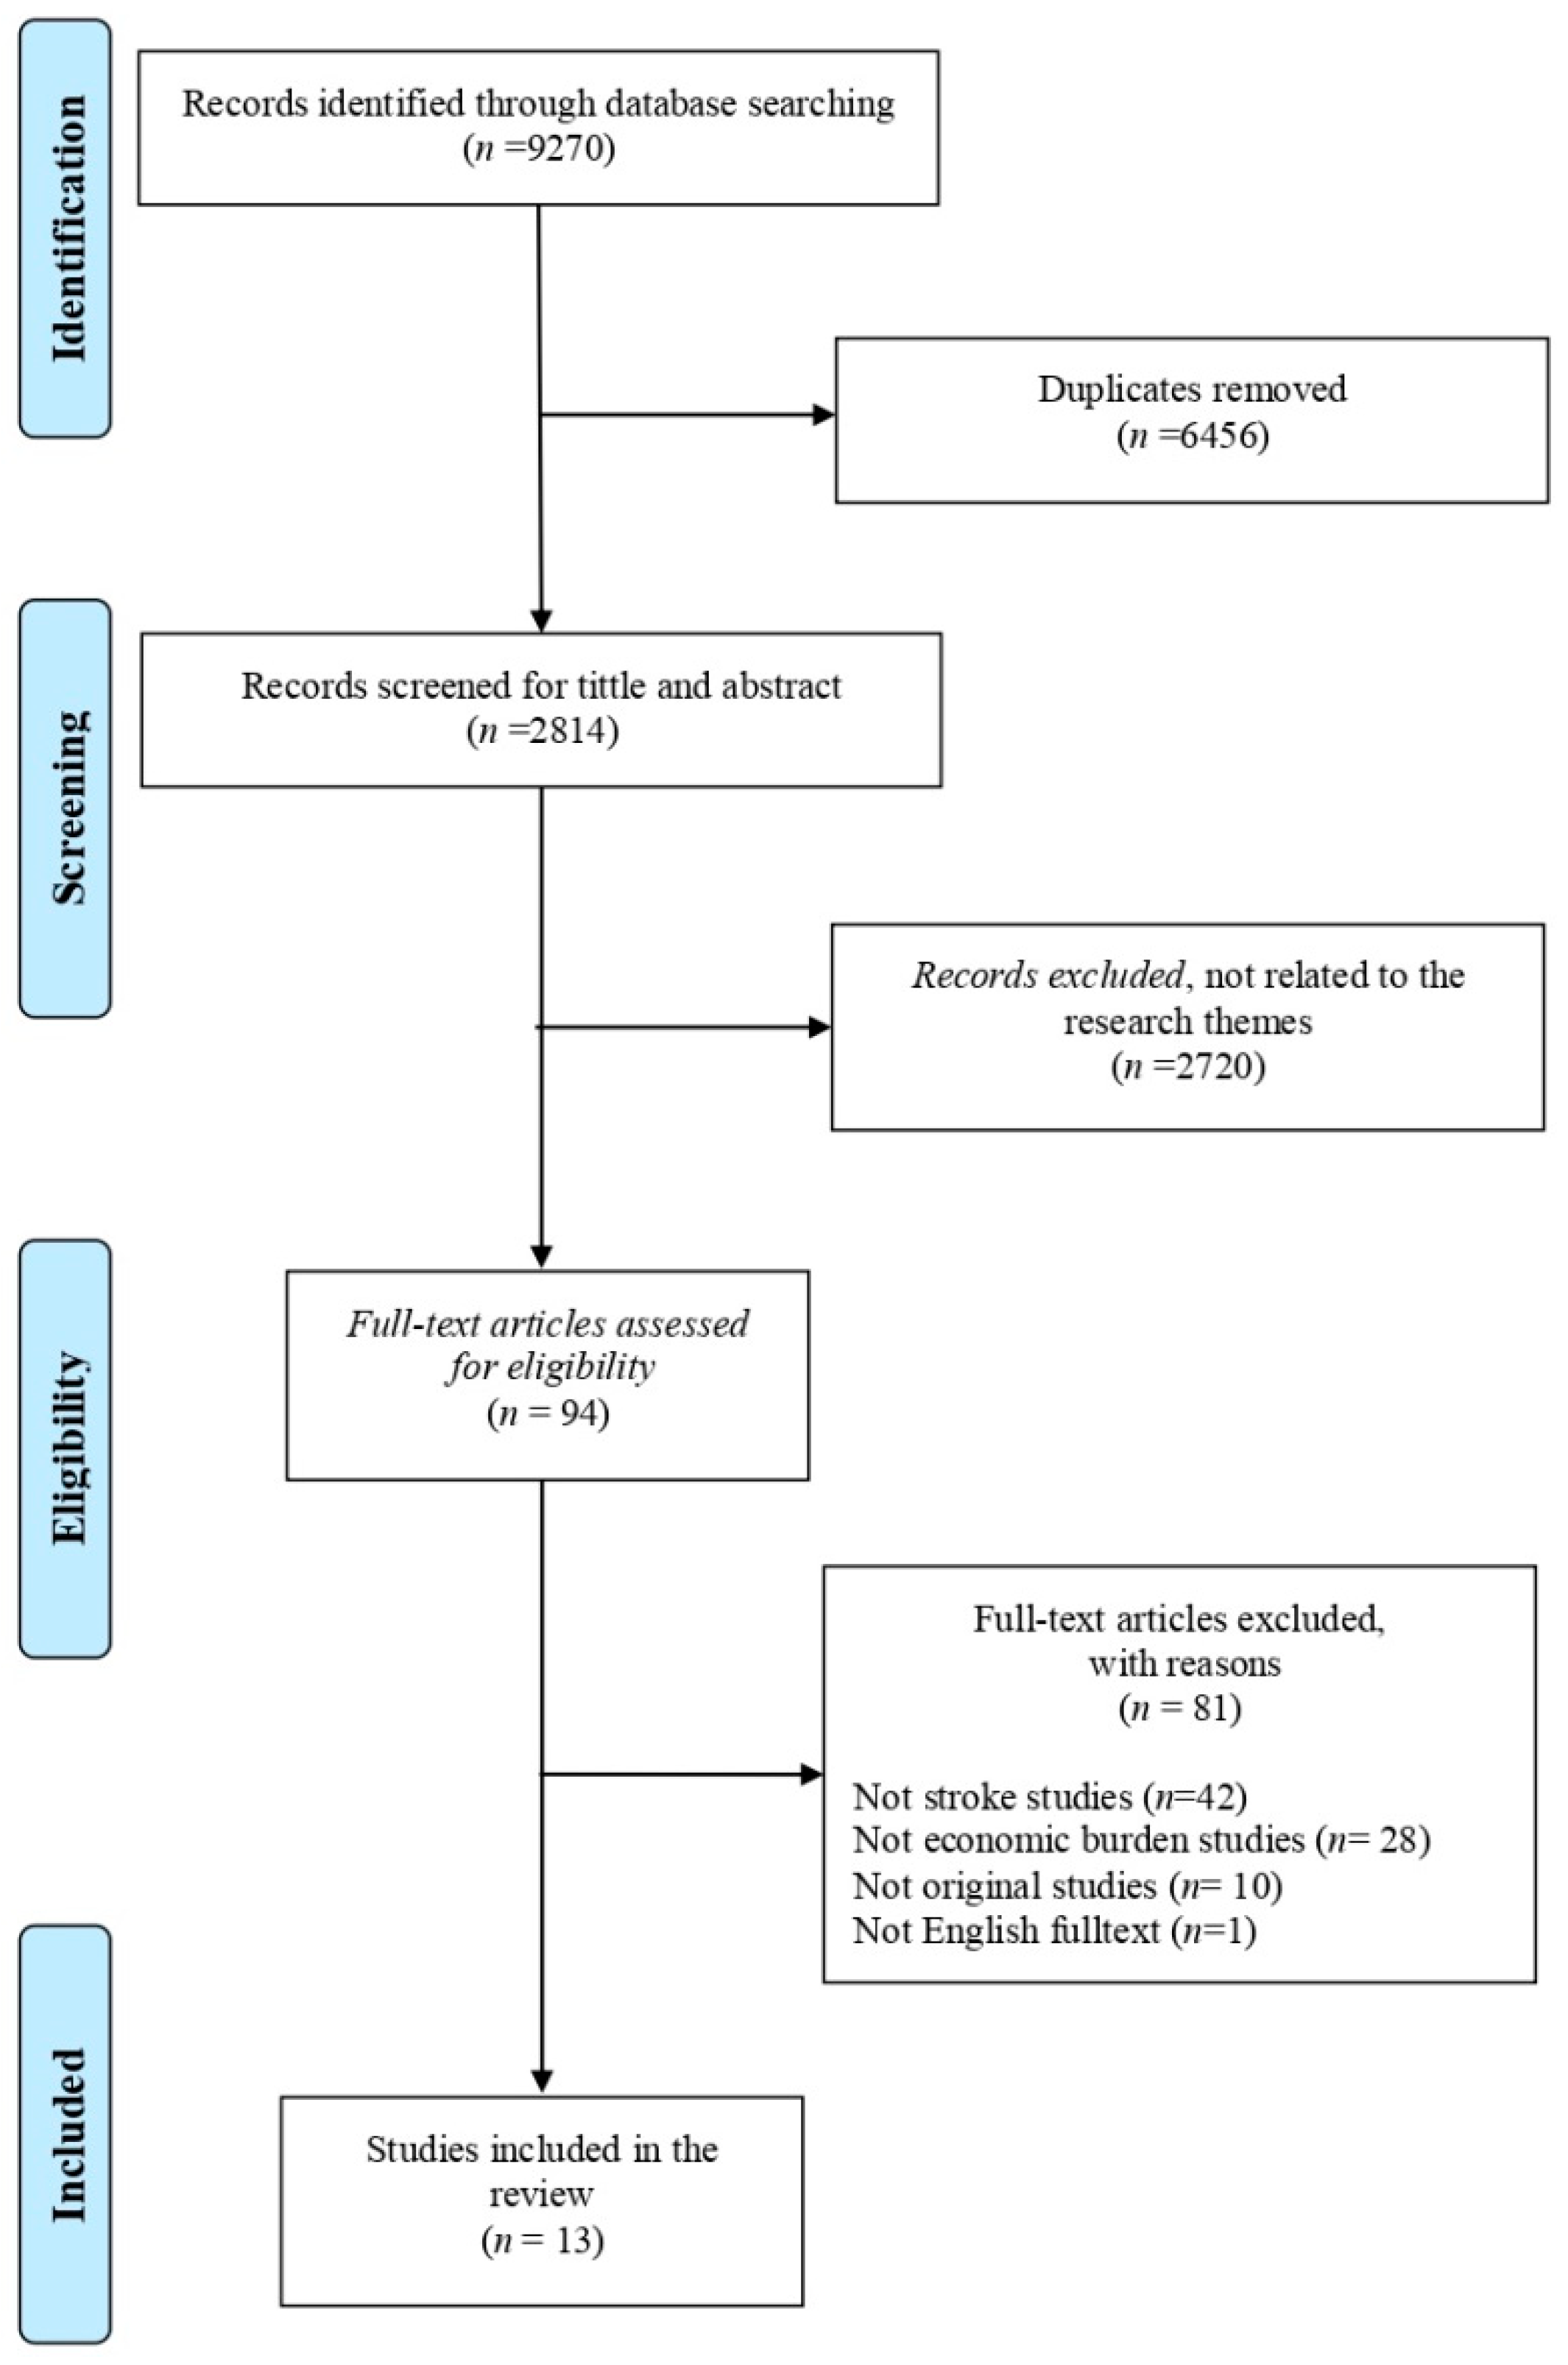
2. Methods
2.1. Search Strategy
2.2. Inclusion and Exclusion Criteria
2.3. Data Extraction and Data Analysis
2.4. Quality Assessments
3. Results
3.1. Quality of Included Studies
3.2. Characteristics of Included Studies
3.3. Average Length of Stay for Stroke
3.4. Cost Incurred by Stroke
4. Discussion
4.1. Strengths and Limitations
4.2. Implication
5. Conclusions
6. Patents
Supplementary Materials
Author Contributions
Funding
Institutional Review Board Statement
Informed Consent Statement
Acknowledgments
Conflicts of Interest
References
- World Health Organization. Monitoring Health for The SDGs; World Health Organization: Geneva, Switzerland, 2018; Volume 15. [Google Scholar]
- The George Institute for Global Health. Reducing the Burden of Cardiovascular Disease in Indonesia; The George Institute for Global Health: Sydney, Australia, 2017. [Google Scholar]
- Kementerian Kesehatan. Laporan Tahunan Badan Penelitian Dan Pengembangan Kesehatan 2019; Kementerian Kesehatan Republik Indonesia: Jakarta, Indonesia, 2019. [Google Scholar]
- Johnson, A.J.; Dudley, W.N.; Wideman, L.; Schulz, M. Physiological Risk Profiles and Allostatic Load: Using Latent Profile Analysis to Examine Socioeconomic Differences in Physiological Patterns of Risk. Eur. J. Environ. Public Health 2019, 3, 2–9. [Google Scholar] [CrossRef] [Green Version]
- Katan, M.; Luft, A. Global Health Neurology. Semin. Neurol. 2018, 38, 208–211. [Google Scholar] [CrossRef] [PubMed] [Green Version]
- Gorelick, P.B. The global burden of stroke: Persistent and disabling. Lancet Neurol. 2019, 18, 417–418. [Google Scholar] [CrossRef] [Green Version]
- Riskesdas, K. Hasil Utama Riset Kesehata Dasar (RISKESDAS). J. Phys. A Math. Theor. 2018, 44, 1–200. [Google Scholar] [CrossRef]
- Lilissuriani Saputra, I.; Ruby, M. Perbedaan Biaya Riil Rumah Sakit dan Rarif INA-CBG untuk kasus katastropik dengan penyakit Jantung Koroner pada Pasien Rawat inap Peserta Jaminan Kesehatan Nasional di RSUZA. J. Kesehat Masy. 2017, 3, 198–205. [Google Scholar]
- Tremmel, M.; Gerdtham, U.G.; Nilsson, P.M.; Saha, S. Economic burden of obesity: A systematic literature review. Int. J. Environ. Res. Public Health 2017, 14, 435. [Google Scholar] [CrossRef]
- Devleesschauwer, B.; Havelaar, A.H.; De Noordhout, C.M.; Haagsma, J.A.; Praet, N.; Dorny, P.; Speybroeck, N. DALY calculation in practice: A stepwise approach. Int. J. Public Health 2014, 59, 571–574. [Google Scholar] [CrossRef]
- Zhu, B.; Wang, Y.; Ming, J.; Chen, W.; Zhang, L. Disease burden of COPD in china: A systematic review. Int. J. COPD 2018, 13, 1353–1364. [Google Scholar] [CrossRef] [Green Version]
- The Joanna Briggs Institute. The Systematic Review of Economic Evaluation Evidence; The Joanna Briggs Institute & The University of Adelaide: Adelaide, Australia, 2014. [Google Scholar]
- Katsanos, A.H.; Hart, R.G. New Horizons in Pharmacologic Therapy for Secondary Stroke Prevention. JAMA Neurol. 2020, 77, 1308–1317. [Google Scholar] [CrossRef]
- Gheorghe, A.; Griffiths, U.; Murphy, A.; Legido-Quigley, H.; Lamptey, P.; Perel, P. The economic burden of cardiovascular disease and hypertension in low- and middle-income countries: A systematic review. BMC Public Health 2018, 18, 1–11. [Google Scholar] [CrossRef] [Green Version]
- Abdo, R.R.; Abboud, H.M.; Salameh, P.G.; Jomaa, N.A.; Rizk, R.G.; Hosseini, H.H. Direct medical cost of hospitalization for acute stroke in lebanon: A prospective incidence-based multicenter cost-of-illness study. Inquiry 2018, 55. [Google Scholar] [CrossRef]
- Camacho, S.; Maldonado, N.; Bustamante, J.; Llorente, B.; Cueto, E.; Cardona, F.; Arango, C. How much for a broken heart? Costs of cardiovascular disease in Colombia using a person-based approach. PLoS ONE 2018, 13, e0208513. [Google Scholar] [CrossRef]
- Cha, Y.J. The economic burden of stroke based on South Korea’s national health insurance claims database. Int. J. Health Policy Manag. 2018, 7, 904–909. [Google Scholar] [CrossRef]
- Ganapathy, V.; Graham, G.D.; Dibonaventura, M.D.; Gillard, P.J.; Goren, A.; Zorowitz, R.D. Caregiver burden, productivity loss, and indirect costs associated with caring for patients with poststroke spasticity. Clin. Interv. Aging 2015, 10, 1793–1802. [Google Scholar] [CrossRef] [Green Version]
- İçağasıoğlu, A.; Baklacıoğlu, H.Ş.; Mesci, E.; Yumuşakhuylu, Y.; Murat, S.; Mesci, N. Economic burden of stroke. Turk. Fiz. Tip. Rehabil. Derg. 2017, 63, 155–159. [Google Scholar] [CrossRef] [PubMed]
- Jennum, P.; Iversen, H.K.; Ibsen, R.; Kjellberg, J. Cost of stroke: A controlled national study evaluating societal effects on patients and their partners. BMC Health Serv. Res. 2015, 15, 466. [Google Scholar] [CrossRef] [PubMed] [Green Version]
- Joo, H.; Wang, G.; Yee, S.L.; Zhang, P.; Sleet, D. Economic Burden of Informal Caregiving Associated With History of Stroke and Falls Among Older Adults in the U.S. Am. J. Prev. Med. 2017, 53, S197–S204. [Google Scholar] [CrossRef] [PubMed] [Green Version]
- Lekander, I.; Willers, C.; Von Euler, M.; Lilja, M.; Sunnerhagen, K.S.; Pessah-Rasmussen, H.; Borgström, F. Relationship between functional disability and costs one and two years post stroke. PLoS ONE 2017, 12, e0174861. [Google Scholar] [CrossRef]
- Maredza, M.; Chola, L. Economic burden of stroke in a rural South African setting. eNeurol. Sci. 2016, 3, 26–32. [Google Scholar] [CrossRef]
- Persson, J.; Levin, L.Å.; Holmegaard, L.; Redfors, P.; Svensson, M.; Jood, K.; Forsberg-Wärleby, G. Long-term cost of spouses’ informal support for dependent midlife stroke survivors. Brain Behav. 2017, 7, 1–8. [Google Scholar] [CrossRef]
- Van Eeden, M.; Van Heugten, C.; Van Mastrigt, G.A.P.G.; Van Mierlo, M.; Visser-Meily, J.M.A.; Evers, S.M.A.A. The burden of stroke in the Netherlands: Estimating quality of life and costs for 1 year poststroke. BMJ Open 2015, 5. [Google Scholar] [CrossRef] [PubMed]
- Vieira, L.G.D.R.; Safanelli, J.; Araujo, T.D.; Schuch, H.A.; Kuhlhoff, M.H.R.; Nagel, V.; Cabral, N.L. The cost of stroke in private hospitals in Brazil: A one-year prospective study. Arq. Neuropsiquiatr. 2019, 77, 393–403. [Google Scholar] [CrossRef] [Green Version]
- Zhang, H.; Yin, Y.; Zhang, C.; Zhang, D. Costs of hospitalization for stroke from two urban health insurance claims data in Guangzhou City, southern China. BMC Health Serv. Res. 2019, 19, 671. [Google Scholar] [CrossRef] [PubMed]
- Salvatore, F.P.; Spada, A.; Fortunato, F.; Vrontis, D.; Fiore, M. Identification of health expenditures determinants: A model to manage the economic burden of cardiovascular disease. Int. J. Environ. Res. Public Health 2021, 18, 4652. [Google Scholar] [CrossRef]
- Gochi, T.; Matsumoto, K.; Amin, R.; Kitazawa, T.; Seto, K.; Hasegawa, T. Cost of illness of ishchemic heart disease in Japan: A time trend and future projections. Environ. Health Prev. Med. 2018, 13, 1–7. [Google Scholar] [CrossRef]
- Banefelt, J.; Hallberg, S.; Fox, K.M.; Mesterton, J.; Paoli, C.J.; Johansson, G.; Gandra, S.R. Work productivity loss and indirect costs associated with new cardiovascular events in high-risk patients with hyperlipidemia: Estimates from population-based register data in Sweden. Eur. J. Health Econ. 2016, 17, 1117–1124. [Google Scholar] [CrossRef] [PubMed]
- Warlow, C.P. Epidemiology of Stroke; Elsevier: Amsterdam, The Netherlands, 1998; Volume 354. [Google Scholar] [CrossRef]
- Indrayathi, P.A.; Noviyanti, R. Bahan Ajar Cost of Illness; Universitas Udayana: Bali, Indonesia, 2016. [Google Scholar]
- Voda, A.I.; Bostan, I. Public health care financing and the costs of cancer care: A cross-national analysis. Cancers 2018, 10, 117. [Google Scholar] [CrossRef] [PubMed] [Green Version]
- Curtain, J.P.; Yu, M.; Clark, A.B.; Gollop, N.D.; Bettencourt-Silva, J.H.; Metcalf, A.K.; Myint, P.K. Determinants of length of stay following total anterior circulatory stroke. Geriatrics 2017, 2, 26. [Google Scholar] [CrossRef] [Green Version]
- Saxena, R.; Kishore, P.; Saxena, S. To compare surgically induced astigmatism in SICS using two different incision sites–“superior vs. temporal”. Indian J. Clin. Exp. Ophthalmol. 2017, 3, 470–475. [Google Scholar] [CrossRef]
- Hoogervorst-Schilp, J.; Langelaan, M.; Spreeuwenberg, P.; De Bruijne, M.C.; Wagner, C. Excess length of stay and economic consequences of adverse events in Dutch hospital patients. BMC Health Serv. Res. 2015, 15, 531. [Google Scholar] [CrossRef] [Green Version]
- Lubis, I.K.; Susilawati, S. Analisis Length Of Stay (Los) Berdasarkan Faktor Prediktor Pada Pasien DM Tipe II di RS PKU Muhammadiyah Yogyakarta. J. Kesehat. Vokasional. 2018, 2, 161. [Google Scholar] [CrossRef] [Green Version]
- Wartawan, I.W. Analisis Lama Hari Rawat Pasien Yang Menjalani Pembedahan di Ruang Rawat Inap Bedah Kelas III RSUP Sanglah Denpasar Tahun 2011; Universitas Indonesia: Jakarta, Indonesia, 2012. [Google Scholar]
- Segel, J.E. Cost-of-Illness Studies—A Primer; RTI-UNC Center of Excellence in Health Promotion Economics. 2006. Available online: https://pdfs.semanticscholar.org/3bbf/0a03079715556ad816a25ae9bf232b45f2e6.pdf (accessed on 29 January 2021).
- Munawwaroh, A. Perhitungan Cost of Illness (COI) Pada Pasien Rawat Inap Penderita Stroke Peserta BPJS Di RSUD Dr. Mohamad Saleh Kota Probolinggo; Universitas Jember: Jawa Timur, Indonesia, 2019. [Google Scholar]
- Ye, Z.; Ritchey, M.; MacLeod, K.; Wang, G. A Literature Review of the Direct Medical Costs of Stroke Across the Care Continuum in the US. Circ. Cardiovasc. Qual. Outcomes 2020, 13 (Suppl. 1), A265. [Google Scholar] [CrossRef]
- Jo, C. Cost-of-illness studies: Concepts, scopes, and methods. Clin. Mol. Hepatol. 2014, 20, 327–337. [Google Scholar] [CrossRef] [PubMed]
- Ibrahim, N.; Pozo-Martin, F.; Gilbert, C. Direct non-medical costs double the total direct costs to patients undergoing cataract surgery in Zamfara state, Northern Nigeria: A case series. BMC Health Serv. Res. 2015, 15, 1–7. [Google Scholar] [CrossRef] [PubMed] [Green Version]
- Alvarez-Sabín, J.; Quintana, M.; Masjuan, J.; Oliva-Moreno, J.; Mar, J.; Gonzalez-Rojas, N.; Yebenes, M. Economic impact of patients admitted to stroke units in Spain. Eur. J. Health Econ. 2017, 18, 449–458. [Google Scholar] [CrossRef]
- Girotra, T.; Lekoubou, A.; Bishu, K.G.; Ovbiagele, B. A contemporary and comprehensive analysis of the costs of stroke in the United States. J. Neurol. Sci. 2020, 410, 116643. [Google Scholar] [CrossRef]
- Belarmino, A.D.C.; Rodrigues, M.E.N.G.; Anjos, S.D.J.S.B.D.; Ferreira Júnior, A.R. Collaborative practices from health care teams to face the covid-19 pandemic. Rev. Bras. Enferm. 2020, 73 (Suppl. 6), e20200470. [Google Scholar] [CrossRef]
- Shamseer, L.; Moher, D.; Clarke, M.; Ghersi, D.; Liberati, A.; Petticrew, M.; Shekelle, P.; Stewart, L.A.; PRISMA-P Group. Preferred reporting items for systematic review and meta-analysis protocols (prisma-p) 2015: Elaboration and explanation. BMJ 2015, 349, g7647. [Google Scholar] [CrossRef] [Green Version]

| No. | Researcher and Year | Research Setting | Country Group | Approach | Source of Data | Indicator of Calculated Disease Burden | |||
|---|---|---|---|---|---|---|---|---|---|
| Research Design | Calculation Method | Method | Cost Perspective | ||||||
| 1 | Abdo, et al. (2018) [15] | Lebanon | Upper-middleincome | Prospective | Cost of illness (COI) | Incidence-based | Healthcare system | 203 stroke patients | Direct medical cost |
| 2 | Camacho, et al. (2018) [16] | Colombia | Upper-middleincome | Retrospective | Health expenditure | Prevalence-based | Third-party payer | Data are provided by ACEMI, an association of Colombian private health insurance companies | Direct medical cost |
| 3 | Cha, Yu–Jin (2018) [17] | South Korea | High income | Retrospective | Cost of illness (COI) | Prevalence-based | Participant (patients) and families | Insurance claims data generated during 2015 in Korea (N = 515,848) | Direct medical cost, direct cost, indirect cost. |
| 4 | Ganapathy (2015) [18] | United States | High income | Cross-sectional | Health expenditure | Prevalence-based | Society | Internet survey data were collected from 153 caregivers of stroke patients | Indirect cost (productivity lost) |
| 5 | İçağasıoğlu, et al. (2017) [19] | Turkey | Upper-Middleincome | Retrospective | Cost of Illness (COI) | Prevalence-based | Healthcare system | 84 stroke patients | Direct and Indirect cost |
| 6 | Jennum, et al. (2015) [20] | Denmark | High income | Cross-sectional | Cost of illness (COI) | Prevalence-based | Society | Records from the Danish National Patient Registry of 93,047 ischemic, 26,012 hemorrhagic, and 128,824 stroke patients were unspecified and compared with 364,433, 103,741, and 500,490 matched controls, respectively. | Direct medical cost |
| 7 | Joo, et al. (2017) [21] | United States | High income | Retrospective | Health expenditure | Prevalence-based | Society | Using the 2010 Health and Pension Study, data on un-institutionalized adults aged ≥ 65 years (n = 10,129) in 2015–2017 | Indirect medical cost |
| 8 | Lekander, et al. (2017) [22] | Sweden | High income | Prospective | Health expenditure | Incidence-based | Society | 47,807 patients were diagnosed with stroke during 2007–2010, allowing for two years of follow-up | Total cost |
| 9 | Maredza and Chola (2016) [23] | South Africa | Upper-middleincome | Prospective | Cost of illness (COI) | Prevalence-based | Healthcare system | A population of around 90,000 people living in the Agincourt sub-district of Mpumalanga province, northeast South Africa, covered by a demographic and health surveillance system (health and demographic surveillance system, HDSS) | Direct cost |
| 10 | Persson, et al. (2017) [24] | Sweden | High income | Prospective | Health expenditure | Prevalence-based | Participant (patients) and families | 53 couples provided informal support, and 168 couples did not provide informal support | Indirect medical cost |
| 11 | Van Eeden, et al. (2015) [25] | The Netherlands | High income | Retrospective | Cost of illness (COI) | Prevalence-based | Society | 395 stroke patients | Total cost |
| 12 | Vieira, et al. (2019) [26] | Brazil | Upper-middleincome | Prospective | Cost of illness (COI) | Prevalence-based | Healthcare system | 173 stroke patients | Direct medical cost |
| 13 | Zhang, et al. (2019) [27] | China | Upper-middleincome | Retrospective | Cost of illness (COI) | Prevalence-based | Healthcare system | A total of 114,872 were hospitalized for five types of stroke | Direct medical cost |
| No. | Research Cited | Results of Research on Length of Hospitalization | Description on the Causes of Length of Hospitalization |
|---|---|---|---|
| 1 | Abdo et al. (2018) [15] | In Lebanon, the average stroke hospitalization was 13–18 days. | Predictors of higher LOS were high National Institution of Health Stroke Scale (NIHSS) at admission, ICU LOS, surgery, and infection complications. |
| 2 | İçağasıoğlu et al. (2017) [19] | In Turkey, the length of hospitalization of stroke patients ranged from 0 and 75 days, with a mean duration of 11–15 days. | NA |
| 3 | Zhang et al. (2019) [27] | In China, the average length of hospitalization in the hospital was 27 days. | NA |
| No. | Author | Country | Method | Calculated Indicator | Result | |||||||
|---|---|---|---|---|---|---|---|---|---|---|---|---|
| Economic Loss | Direct Medical Cost | Indirect Medical Cost | Indirect Cost | |||||||||
| Research Result | USD in 2020 | Research Result | USD in 2020 | Research Result | USD in 2020 | Research Result | USD 2020 | |||||
| 1 | Abdo, et al. (2018) [15] | Lebanon | Cost of Illness (COI) | Direct medical cost | N/A a | N/A | USD 6961 (2016 INT $) b | 7536.43 | N/A | N/A | N/A | N/A |
| 2 | Camacho et al. (2018) [16] | Colombia | Health expenditure | Direct medical cost | N/A | N/A | USD 4277–4846 (2012 INT $) | 4905.33–4905.33 | N/A | N/A | N/A | N/A |
| N/A | N/A | USD 6245 (2012 INT $) | 7162.45 | N/A | N/A | N/A | N/A | |||||
| 3 | Cha, Yu-Jin (2018) [17] | South Korea | Cost of illness (COI) | Direct medical cost, direct cost, indirect cost | USD 7247 (2015 INT $) | 7931.80 | N/A | N/A | N/A | N/A | N/A | N/A |
| 4 | Ganapathy (2015) [18] | United States | Health expenditure | Indirect cost (productivity lost) | N/A | N/A | N/A | N/A | N/A | N/A | Productivity loss of USD 269 for absenteeism and USD 598 for presenteeism. Total lost productivity of USD 835 per month (2012 INT $) | 308.52 685.85 957.67 |
| 5 | İçağasıoğlu et al. (2017) [19] | Turkey | Cost of illness (COI) | Direct and indirect cost | TL 17,253.50 (2014) c | 16,662.20 | TL 8668 (2014) | 8370.94 | N/A | N/A | TL 10,800 (2014) | 10,429.87 |
| 6 | Jennum et al. (2015) [20] | Denmark | Cost of illness (COI) | Direct medical cost | EUR 10,772–13,888 (2009) d | 1701.07–2193.13 | EUR 8297–10,088 (2009) | 1310.23–1593.05 | N/A | N/A | EUR 7377–10,720 (2009) | 1164.94–1692.86 |
| 7 | Joo et al. (2017) [21] | United States | Health expenditure | Indirect medical cost | N/A | N/A | N/A | N/A | N/A | N/A | USD 2883–5777 (2015 INT $) | 3155.43–6322.90 |
| 8 | Lekander et al. (2017) [22] | Sweden | Health expenditure | Total cost | EUR 10,000–120,000 | 5,367,715.39–64,412,584.69 | N/A | N/A | N/A | N/A | N/A | N/A |
| 9 | Maredza and Chola (2016) [23] | South Africa | Cost of illness (COI) | Direct cost | N/A | N/A | USD 283,465 (2012 INT $) | 325,108.84 | N/A | N/A | N/A | N/A |
| 10 | Persson et al. (2017) [24] | Sweden | Health expenditure | Indirect Cost (Informal care cost) | N/A | N/A | N/A | N/A | N/A | N/A | EUR 991–25,127 (€ INT 2015) | 123.80–3138.86 |
| 11 | Van Eeden et al. (2015) [25] | The Netherlands | Cost of illness (COI) | Total cost | EUR 29,484 (2012) | 25,043.49 | EUR 18,068.2 (2012) | 25,043.49 | N/A | N/A | EUR 11,416 (2012) | 15,823.18 |
| 12 | Vieira et al. (2019) [26] | Brazil | Cost of illness (COI) | Direct medical cost | N/A | N/A | USD 2595–31532 (2016 INT $) | 2809.51–34,138.58 | N/A | N/A | N/A | N/A |
| 13 | Zhang et al. (2019) [27] | China | Cost of illness (COI) | Direct medical cost | N/A | N/A | USD 3212.1 (2013 INT $) | 3620.45 | N/A | N/A | N/A | N/A |
Publisher’s Note: MDPI stays neutral with regard to jurisdictional claims in published maps and institutional affiliations. |
© 2021 by the authors. Licensee MDPI, Basel, Switzerland. This article is an open access article distributed under the terms and conditions of the Creative Commons Attribution (CC BY) license (https://creativecommons.org/licenses/by/4.0/).
Share and Cite
Rochmah, T.N.; Rahmawati, I.T.; Dahlui, M.; Budiarto, W.; Bilqis, N. Economic Burden of Stroke Disease: A Systematic Review. Int. J. Environ. Res. Public Health 2021, 18, 7552. https://doi.org/10.3390/ijerph18147552
Rochmah TN, Rahmawati IT, Dahlui M, Budiarto W, Bilqis N. Economic Burden of Stroke Disease: A Systematic Review. International Journal of Environmental Research and Public Health. 2021; 18(14):7552. https://doi.org/10.3390/ijerph18147552
Chicago/Turabian StyleRochmah, Thinni Nurul, Indana Tri Rahmawati, Maznah Dahlui, Wasis Budiarto, and Nabilah Bilqis. 2021. "Economic Burden of Stroke Disease: A Systematic Review" International Journal of Environmental Research and Public Health 18, no. 14: 7552. https://doi.org/10.3390/ijerph18147552
APA StyleRochmah, T. N., Rahmawati, I. T., Dahlui, M., Budiarto, W., & Bilqis, N. (2021). Economic Burden of Stroke Disease: A Systematic Review. International Journal of Environmental Research and Public Health, 18(14), 7552. https://doi.org/10.3390/ijerph18147552