
The Surplus Transplant Lung Allocation System in Italy: An Evaluation of the Allocation Process via Stochastic Modeling

 ,
,  , ,
, ,  ,
,  , ,
, , 
Abstract
1. Introduction
2. Materials and Methods
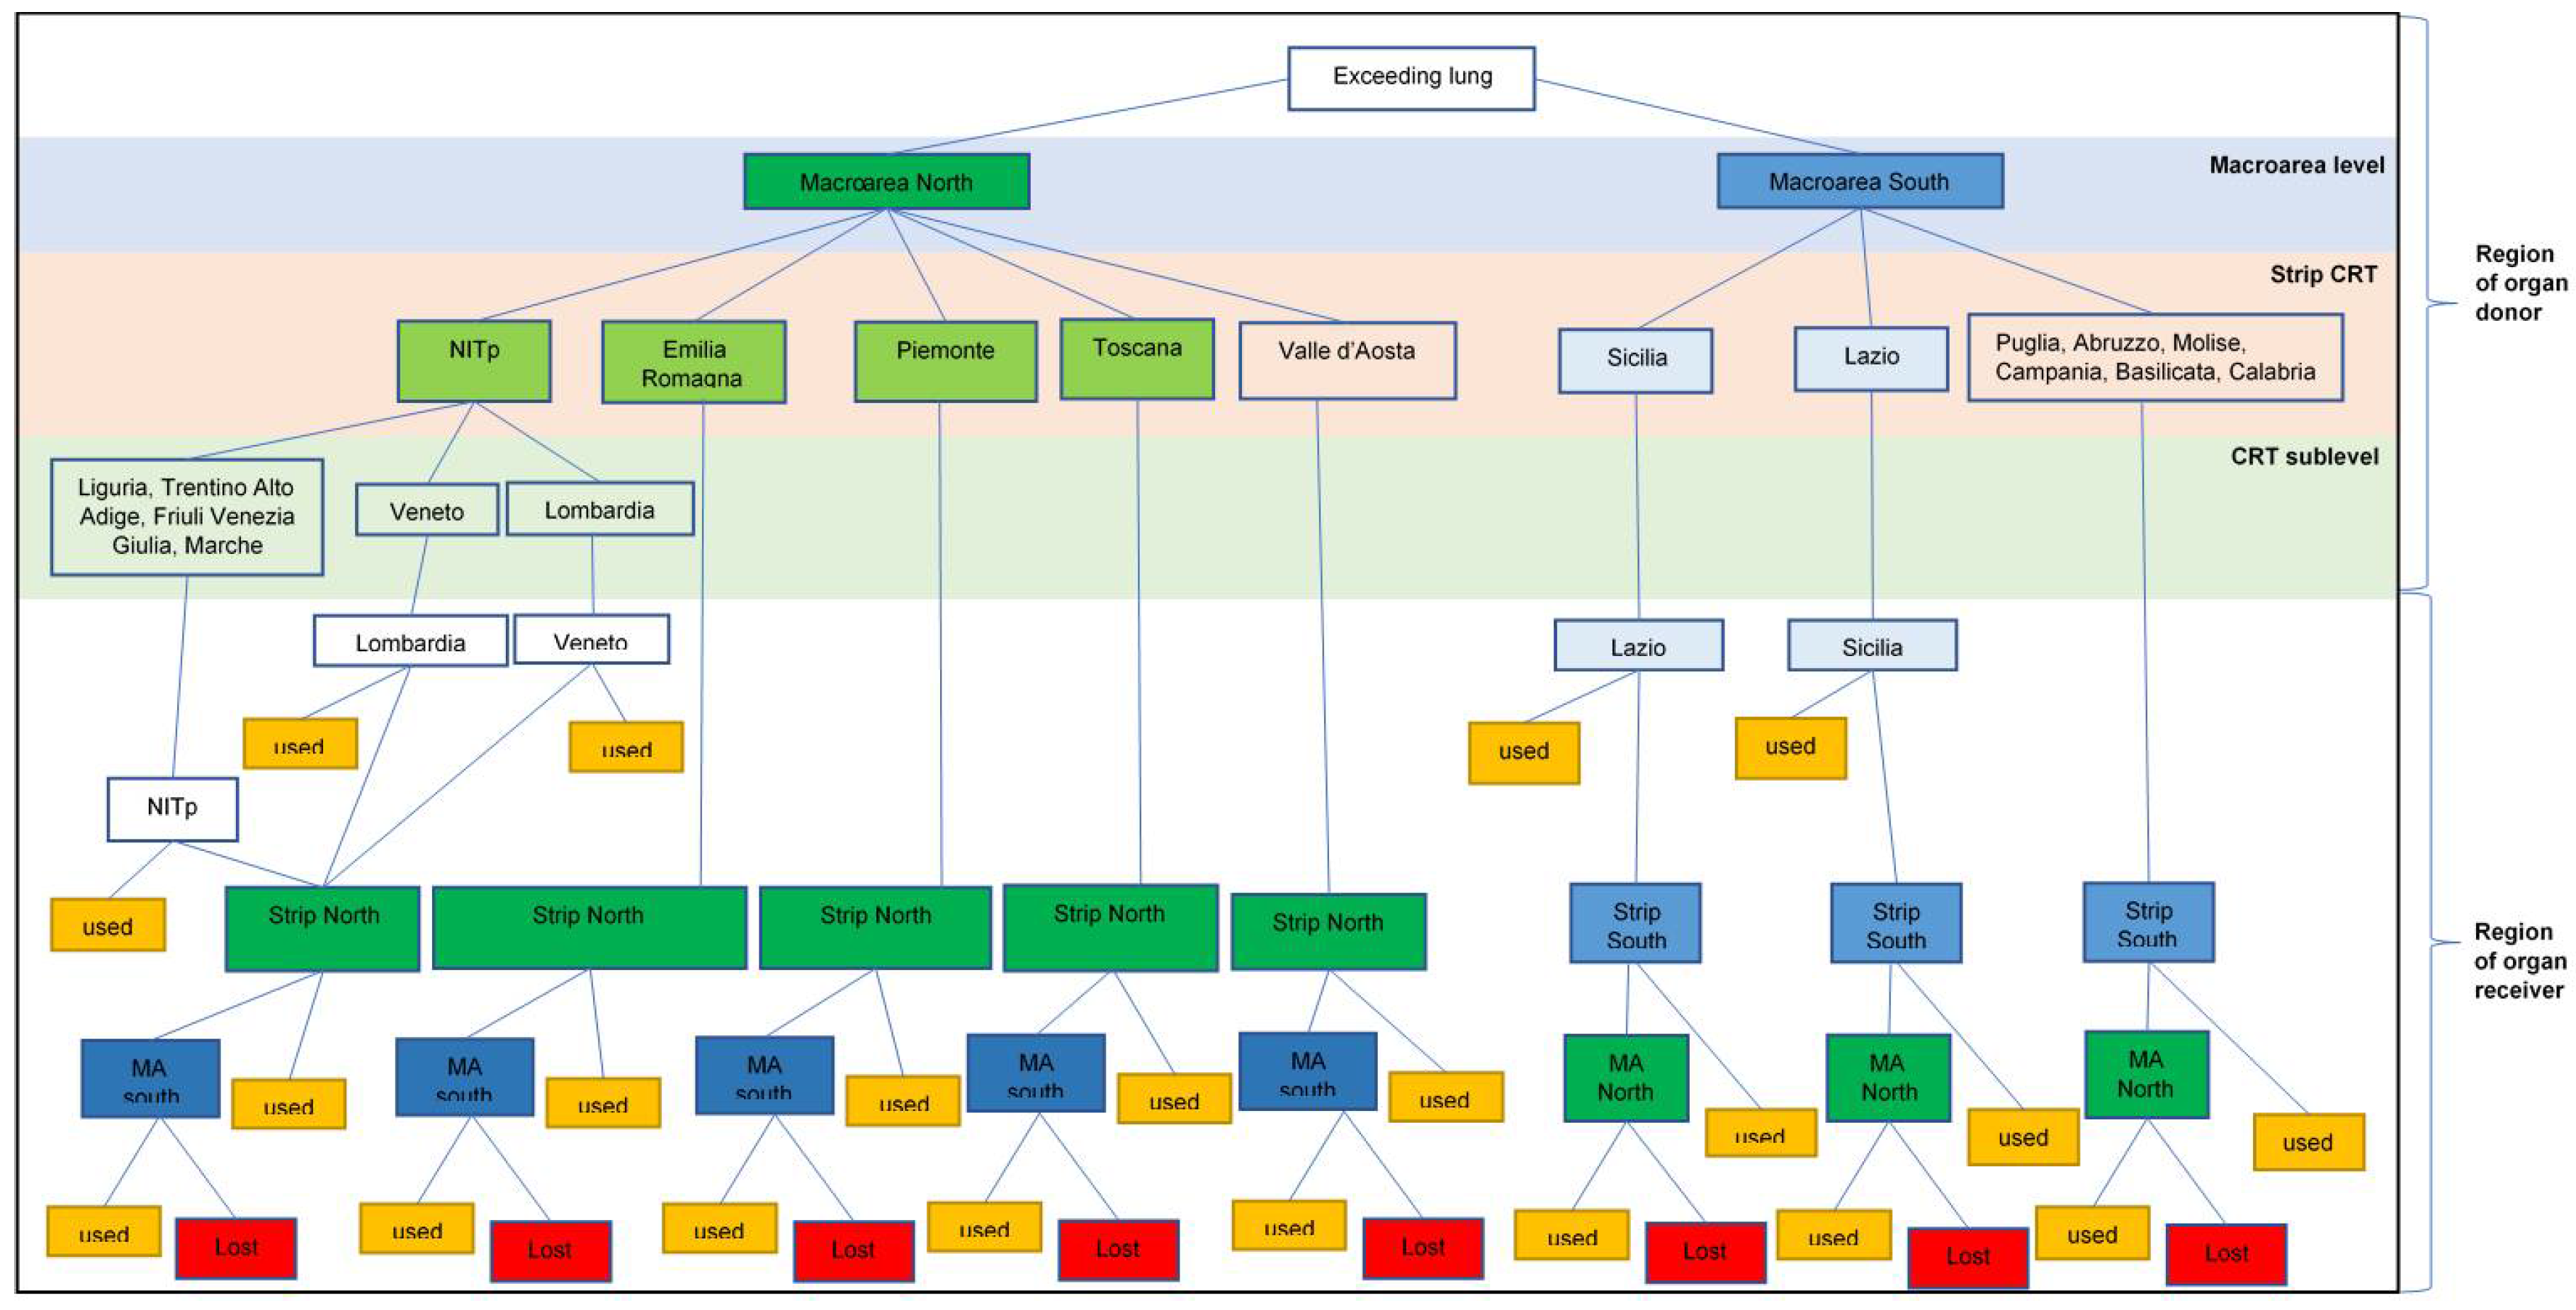
2.1. The Italian Surplus Transplant Protocol
2.2. Probability Models
2.2.1. Variable’s Convention
2.2.2. Macroarea Level
2.2.3. Macroregion Level
2.3. Clumpr Package
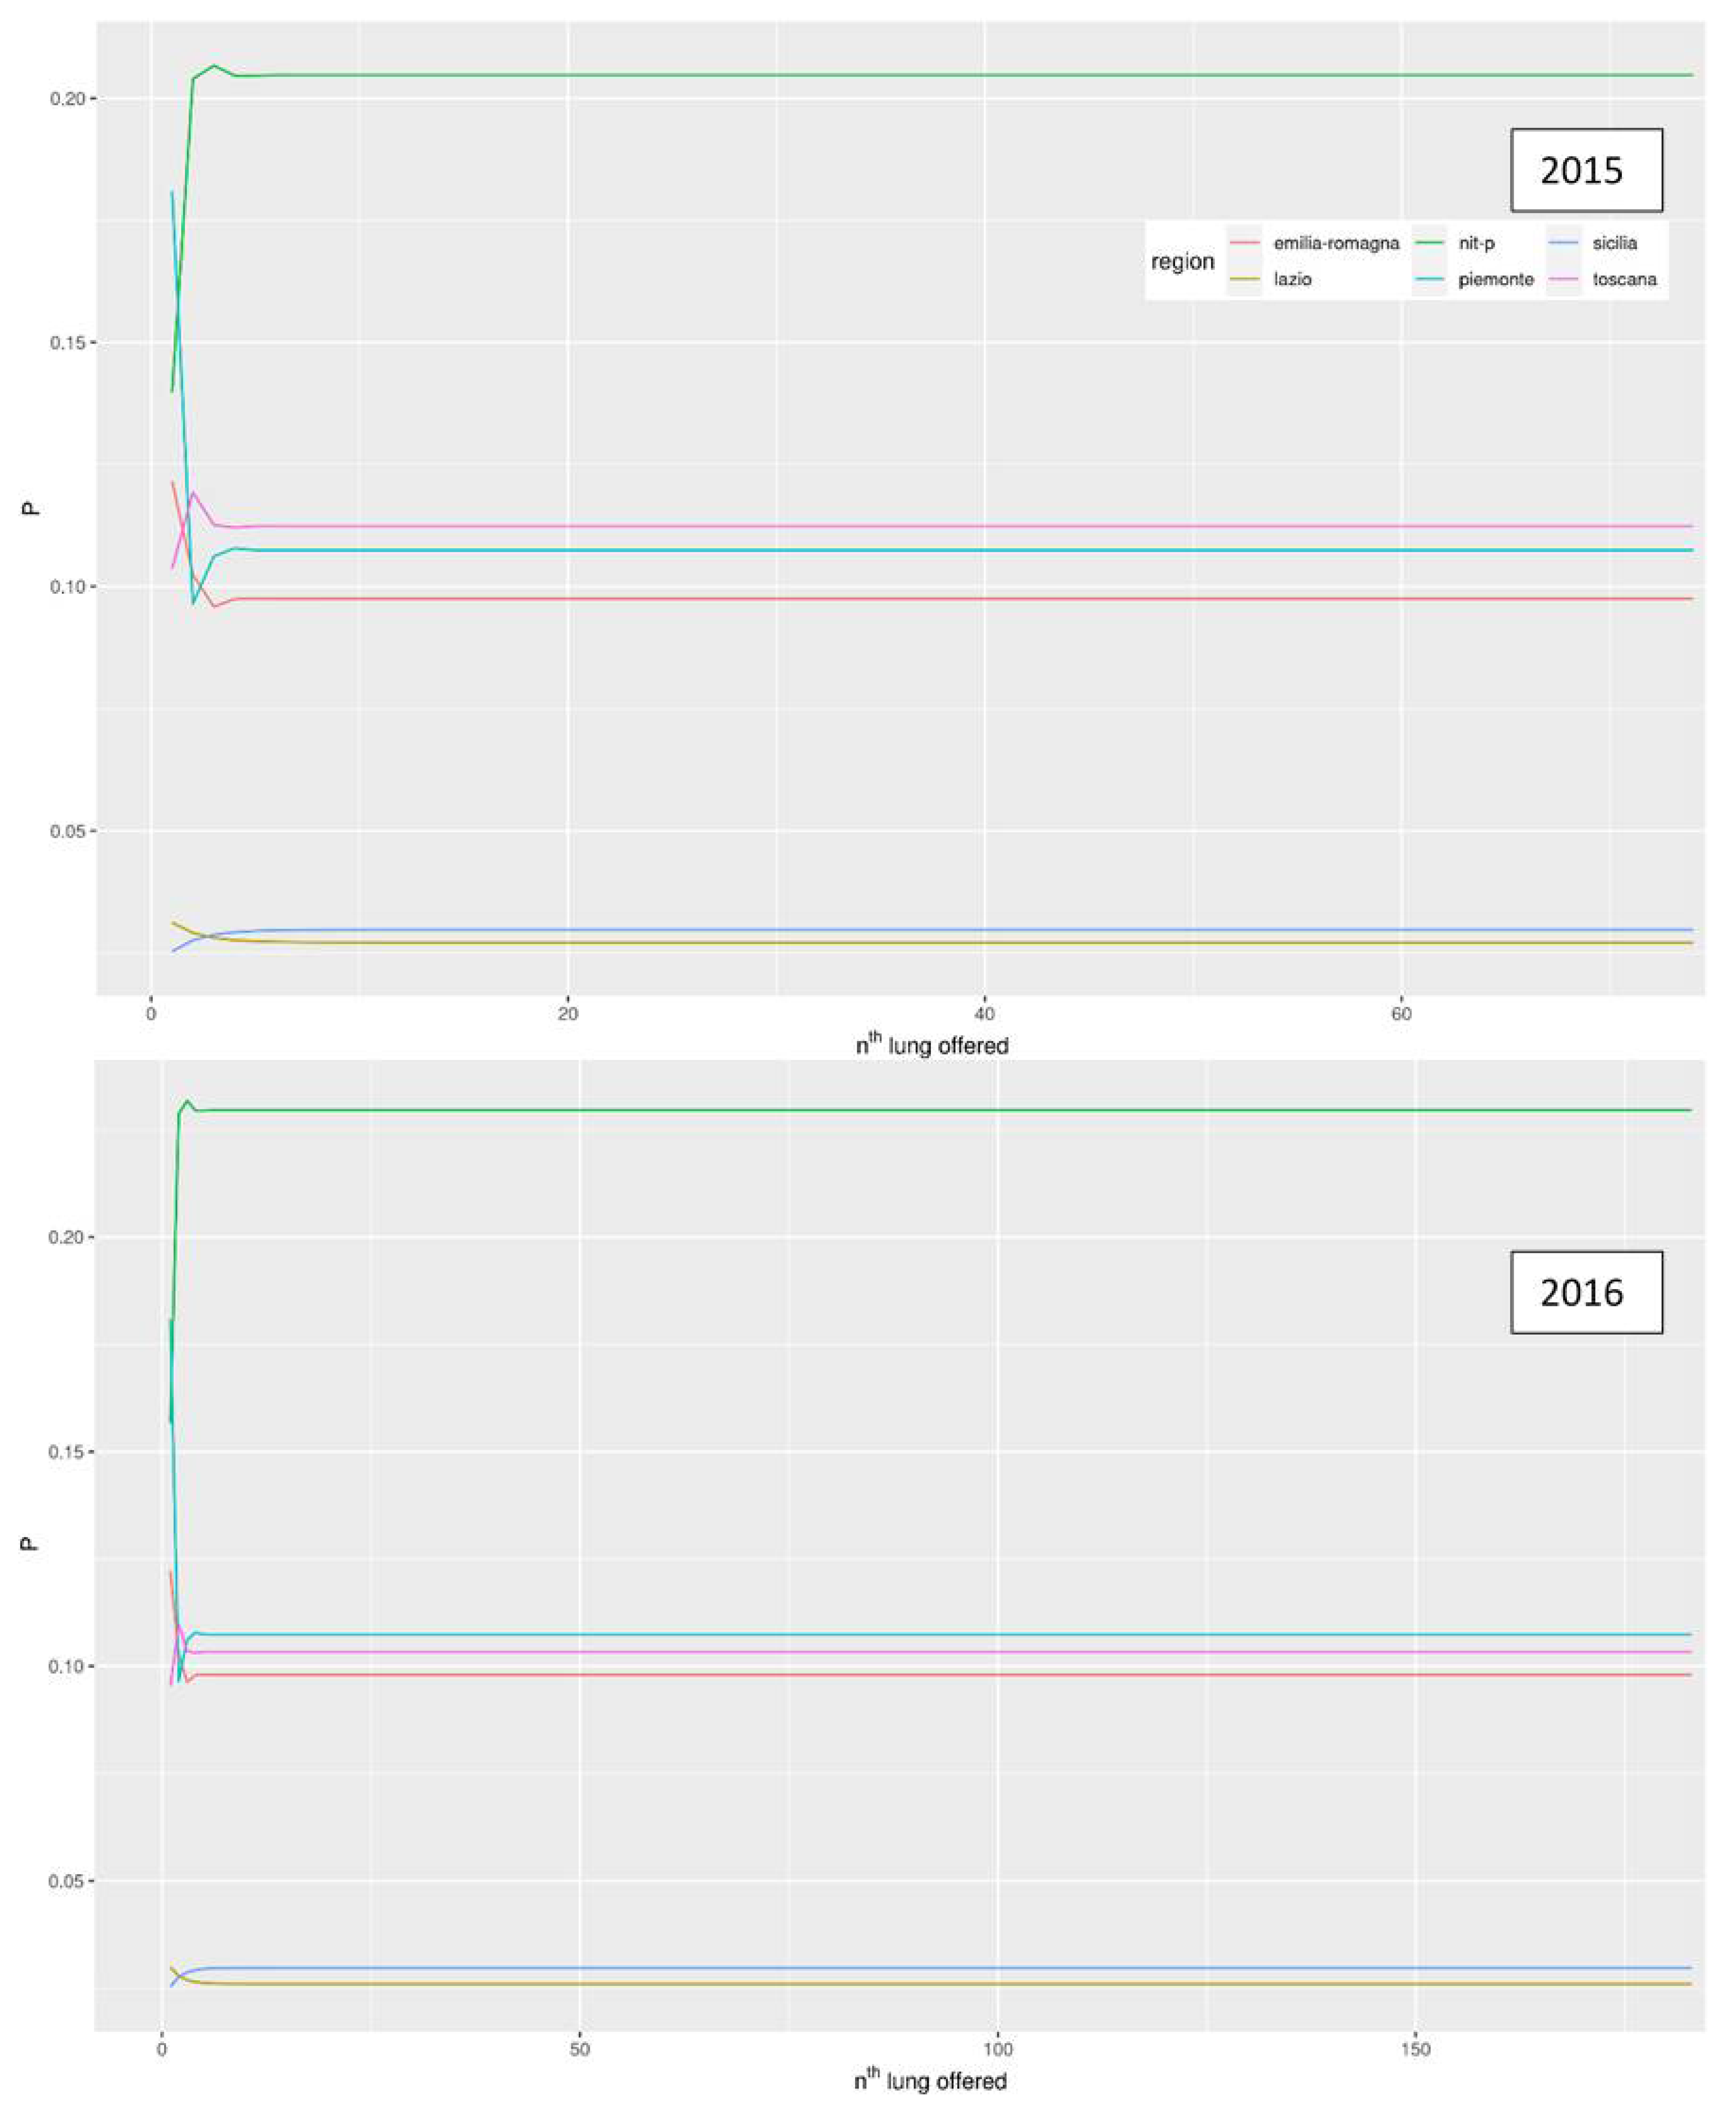
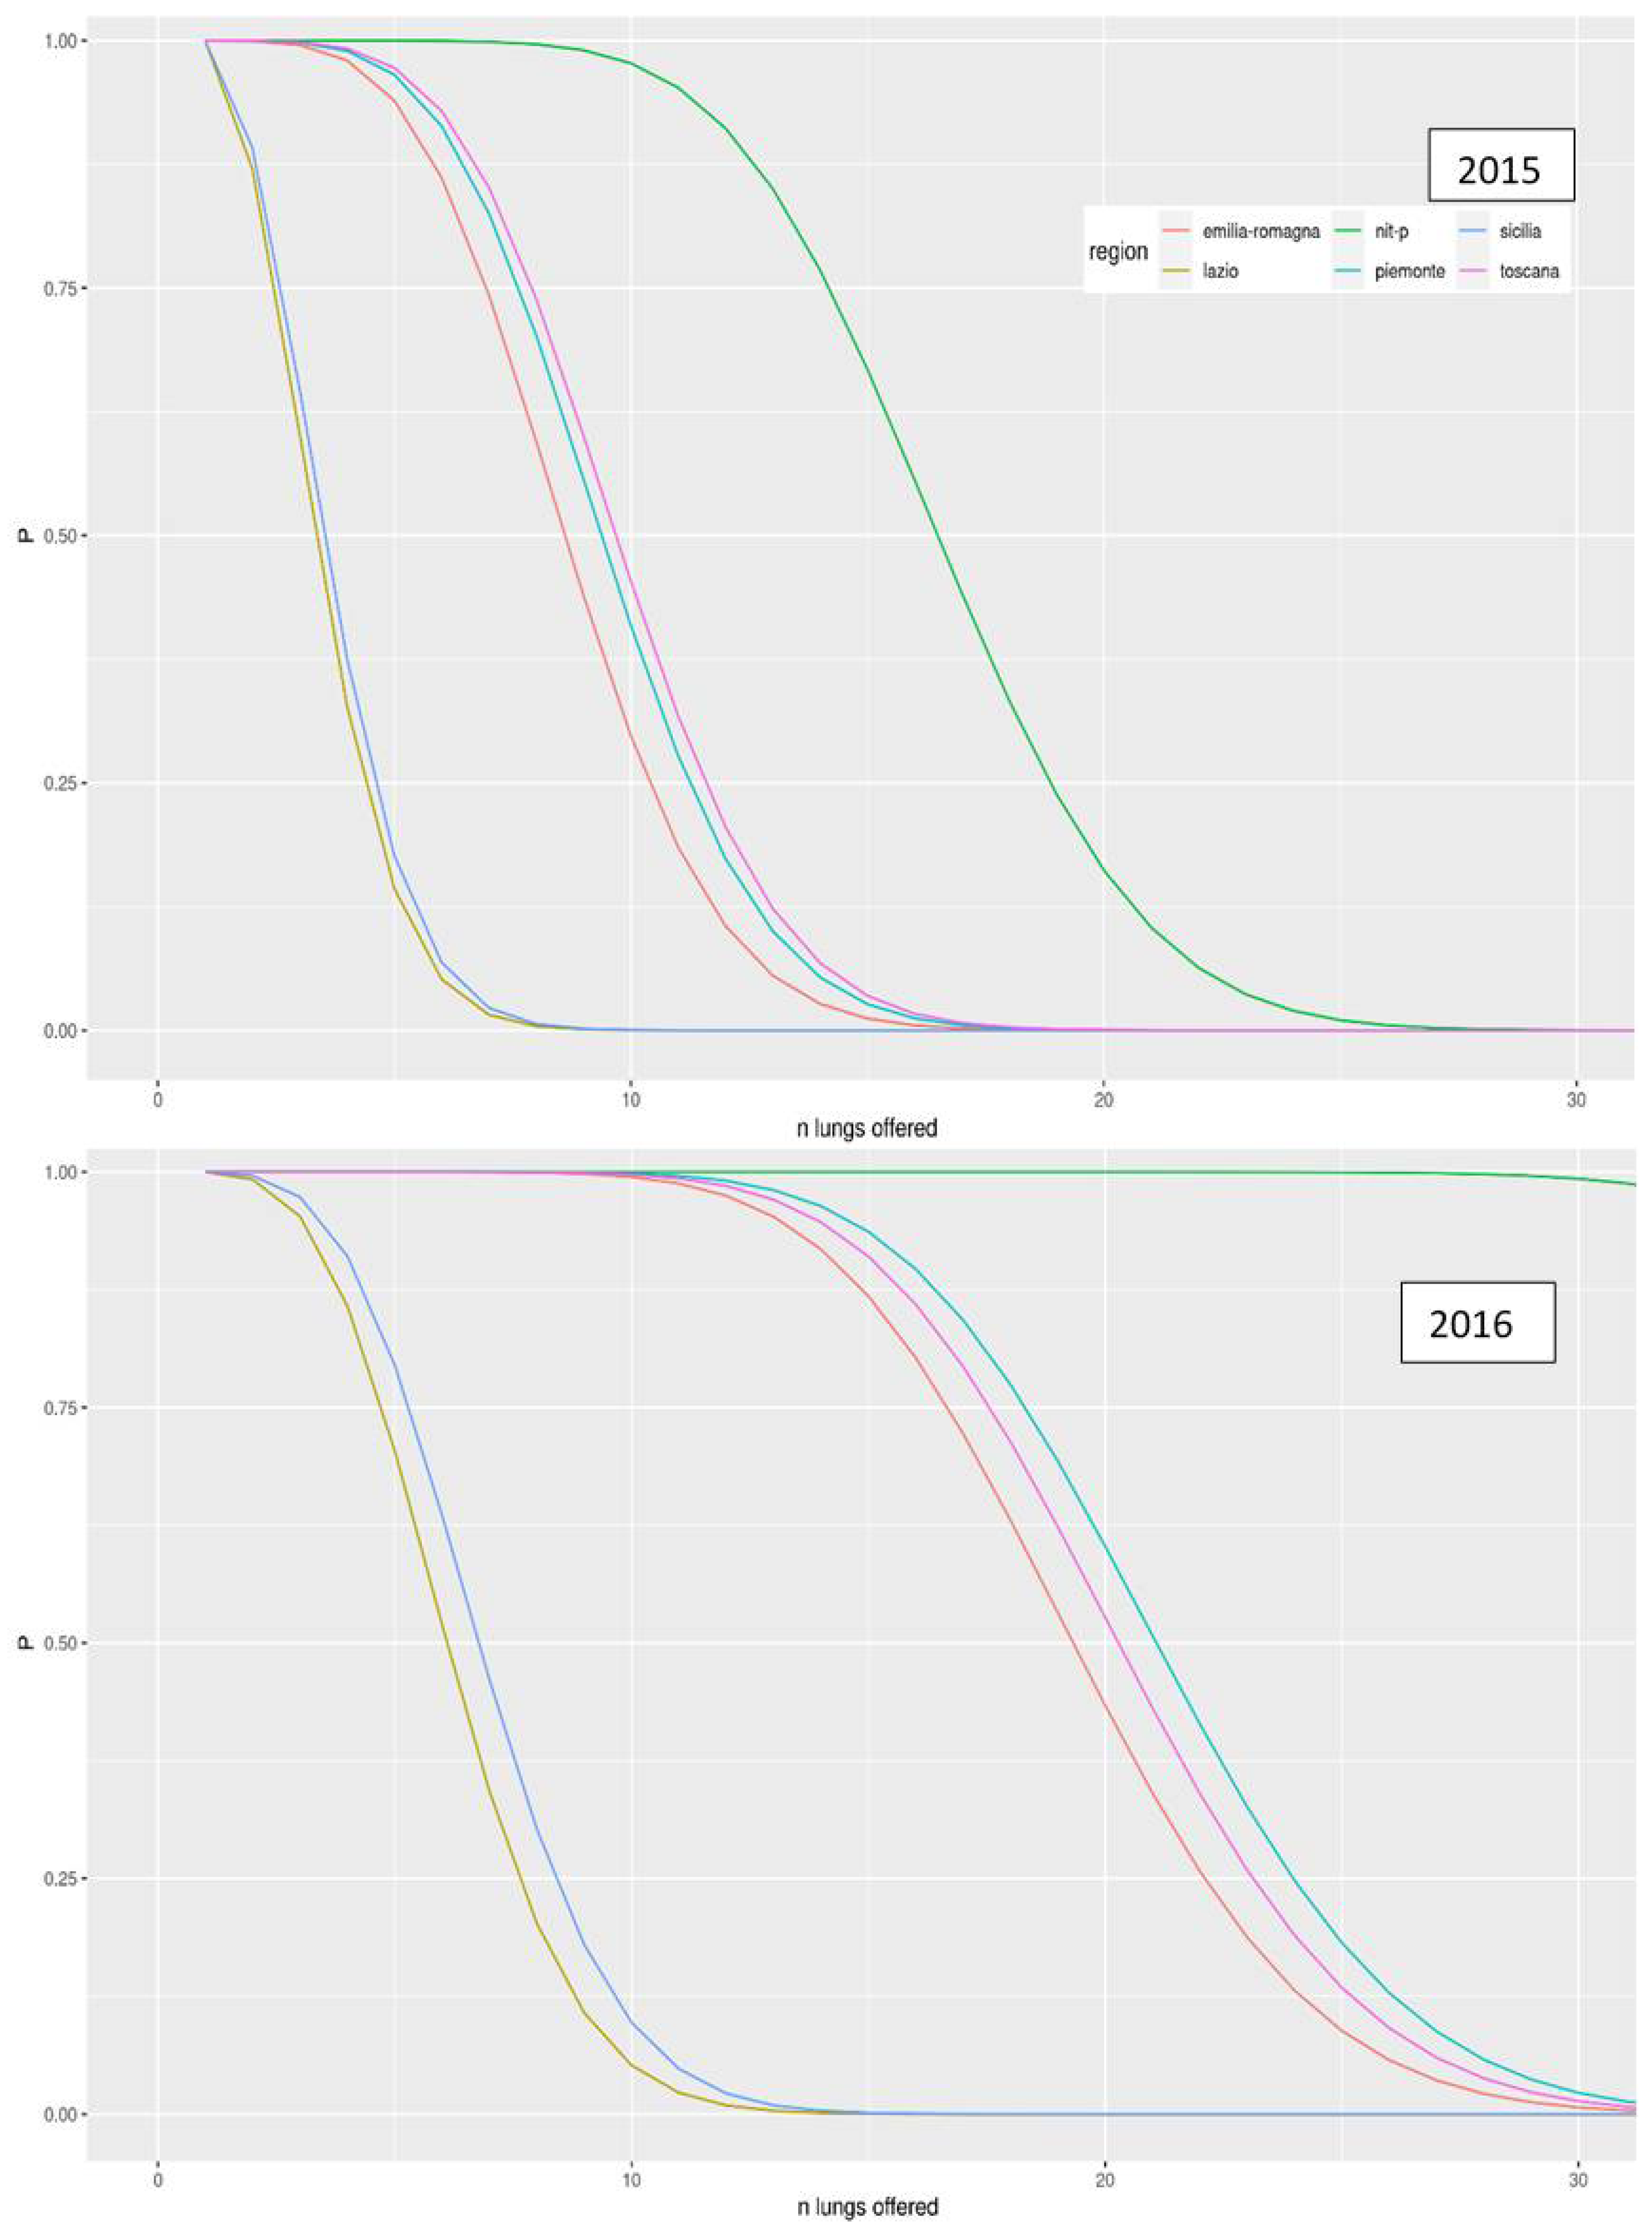
3. Results
The Equity of the Italian System of Surplus Allocation of Organ Transplants
4. Discussion
Limitations
5. Conclusions
Supplementary Materials
Author Contributions
Funding
Institutional Review Board Statement
Informed Consent Statement
Data Availability Statement
Conflicts of Interest
References
- Kotloff, R.M.; Thabut, G. Lung Transplantation. Am. J. Respir. Crit. Care Med. 2011, 184, 159–171. [Google Scholar] [CrossRef]
- Valapour, M.; Lehr, C.J.; Skeans, M.A.; Smith, J.M.; Miller, E.; Goff, R.; Foutz, J.; Israni, A.K.; Snyder, J.J.; Kasiske, B.L. OPTN/SRTR 2019 Annual Data Report: Lung. Am. J. Transplant. 2021, 21, 441–520. [Google Scholar] [CrossRef]
- Centro Nazionale Trapianti Report 2020 Attività Annuale Rete Nazionale Trapianti. Available online: http://www.trapianti.salute.gov.it/imgs/C_17_cntPubblicazioni_415_allegato.pdf (accessed on 25 June 2021).
- Chambers, D.C.; Cherikh, W.S.; Goldfarb, S.B.; Hayes, D.; Kucheryavaya, A.Y.; Toll, A.E.; Khush, K.K.; Levvey, B.J.; Meiser, B.; Rossano, J.W.; et al. The International Thoracic Organ Transplant Registry of the International Society for Heart and Lung Transplantation: Thirty-Fifth Adult Lung and Heart-Lung Transplant Report—2018; Focus Theme: Multiorgan Transplantation. J. Heart Lung Transplant. 2018, 37, 1169–1183. [Google Scholar] [CrossRef]
- Stehlik, J.; Stevenson, L.W.; Edwards, L.B.; Crespo-Leiro, M.G.; Delgado, J.F.; Dorent, R.; Frigerio, M.; Macdonald, P.; MacGowan, G.A.; Nanni Costa, A.; et al. Organ Allocation Around the World: Insights From the ISHLT International Registry for Heart and Lung Transplantation. J. Heart Lung Transplant. 2014, 33, 975–984. [Google Scholar] [CrossRef]
- Egan, T.M.; Murray, S.; Bustami, R.T.; Shearon, T.H.; McCullough, K.P.; Edwards, L.B.; Coke, M.A.; Garrity, E.R.; Sweet, S.C.; Heiney, D.A.; et al. Development of the New Lung Allocation System in the United States: The New Lung Allocation System. Am. J. Transplant. 2006, 6, 1212–1227. [Google Scholar] [CrossRef]
- Lyu, D.M.; Goff, R.R.; Chan, K.M. The Lung Allocation Score and Its Relevance. Semin. Respir. Crit. Care Med. 2021, 42, 346–356. [Google Scholar] [CrossRef] [PubMed]
- Chang, S.H.; Angel, L.; Smith, D.E.; Carillo, J.; Rudym, D.; Lesko, M.; Sureau, K.; Montgomery, R.A.; Moazami, N.; Kon, Z.N. A Simple Prioritization Change to Lung Transplant Allocation May Result in Improved Outcomes. Ann. Thorac. Surg. 2021, 111, 427–435. [Google Scholar] [CrossRef] [PubMed]
- Holm, A.M.; Immer, F.; Benden, C. Lung Allocation for Transplant: The European Perspective. Clin. Transplant. 2020, 34. [Google Scholar] [CrossRef] [PubMed]
- Valapour, M.; Skeans, M.A.; Heubner, B.M.; Smith, J.M.; Hertz, M.I.; Edwards, L.B.; Cherikh, W.S.; Callahan, E.R.; Snyder, J.J.; Israni, A.K.; et al. OPTN/SRTR 2013 Annual Data Report: Lung. Am. J. Transplant. 2015, 15, 1–28. [Google Scholar] [CrossRef] [PubMed]
- Roussel, A.; Sage, E.; Massard, G.; Thomas, P.-A.; Castier, Y.; Fadel, E.; Le Pimpec-Barthes, F.; Maury, J.-M.; Jougon, J.; Lacoste, P.; et al. Impact of Donor, Recipient and Matching on Survival after High Emergency Lung Transplantation in France. Eur. Respir. J. 2019, 54, 1900096. [Google Scholar] [CrossRef] [PubMed]
- Auråen, H.; Schultz, H.H.L.; Hämmäinen, P.; Riise, G.C.; Larsson, H.; Hansson, L.; Dellgren, G.; Perch, M.; Geiran, O.; Fiane, A.E.; et al. Urgent Lung Allocation System in the Scandiatransplant Countries. J. Heart Lung Transplant. 2018, 37, 1403–1409. [Google Scholar] [CrossRef] [PubMed]
- Centro Nazionale Trapianti Donazioni, Trapianti, Liste Di Attesa in Italia al 31 Dicembre 2020. Available online: https://trapianti.sanita.it/statistiche/attivita/2020_D_ATTIVITA_ORGANI_DX-TX.pdf (accessed on 20 June 2021).
- Palleschi, A.; Benazzi, E.; Rossi, C.F.; Torelli, R.; Passamonti, S.M.; Pellegrini, C.; Lucianetti, A.; Tarsia, P.; Meloni, F.; Parigi, P.; et al. Lung Allocation Score System: First Italian Experience. Transplant. Proc. 2019, 51, 190–193. [Google Scholar] [CrossRef] [PubMed]
- Rosso, L.; Palleschi, A.; Tosi, D.; Mendogni, P.; Righi, I.; Carrinola, R.; Montoli, M.; Damarco, F.; Rossetti, V.; Morlacchi, L.C.; et al. Lung Allocation Score: A Single-Center Simulation. Transplant. Proc. 2016, 48, 391–394. [Google Scholar] [CrossRef]
- Boffini, M.; Venuta, F.; Rea, F.; Colledan, M.; Santambrogio, L.; D’Armini, A.M.; Bertani, A.; Voltolini, L.; Parisi, F.; Marinelli, G.; et al. Urgent Lung Transplant Programme in Italy: Analysis of the First 14 Months. Interact. Cardiovasc. Thorac. Surg. 2014, 19, 795–800. [Google Scholar] [CrossRef] [PubMed][Green Version]
- Schiavon, M.; Faggi, G.; Rosso, L.; Luzzi, L.; Comacchio, G.M.; Gregori, D.; Nosotti, M.; Damarco, F.; Dell’Amore, A.; Bennet, D.; et al. Outcomes and Risk Factors Identification in Urgent Lung Transplantation: A Multicentric Study. J. Thorac. Dis. 2019, 11, 4746–4754. [Google Scholar] [CrossRef] [PubMed]
- Centro Nazionale Trapianti Protocollo Nazionale per La Gestione Delle Eccedenze Di Tutti i Programmi Di Trapianto. Available online: https://www.policlinico.mi.it/AMM/nitp/area_operatore/linee_guida/04/ProtocolloNazionaleGestioneEccedenzeCNTO140804.pdf (accessed on 5 February 2021).
- Peritore, D.; Rizzato, L.; Trapani, S.; Morabito, V.; Fiaschetti, P.; Cacciotti, A.; Montemurro, A.; del Sordo, E.; Ricci, A.; Nanni Costa, A. Optimizing the Use of Available Lungs. Transplant. Proc. 2017, 49, 692–694. [Google Scholar] [CrossRef]
- Zaigraev, A.; Kaniovski, S. A Note on the Probability of at Least k Successes in n Correlated Binary Trials. Oper. Res. Lett. 2013, 41, 116–120. [Google Scholar] [CrossRef]
- Stock, P.G. Balancing Multiple and Conflicting Allocation Goals: A Logical Path Forward. Am. J. Transplant. 2009, 9, 1519–1522. [Google Scholar] [CrossRef]
- Riou, J.; Boëlle, P.-Y.; Christie, J.D.; Thabut, G. High Emergency Organ Allocation Rule in Lung Transplantation: A Simulation Study. ERJ Open Res. 2017, 3. [Google Scholar] [CrossRef]
- Bruni, M.E.; Conforti, D.; Sicilia, N.; Trotta, S. A New Organ Transplantation Location–Allocation Policy: A Case Study of Italy. Health Care Manag. Sci. 2006, 9, 125–142. [Google Scholar] [CrossRef]
- Centro Nazionale Trapianti Donazioni & Trapianto Di Organi, Tessuti e Cellule Staminali Emopoietiche. Available online: http://www.trapianti.salute.gov.it/imgs/C_17_cntPubblicazioni_266_allegato.pdf (accessed on 20 June 2021).
- SIT-Sistema Informativo Trapianti Attività Di Donazione. 2016. Available online: http://www.salute.gov.it/imgs/C_17_pubblicazioni_2591_allegato.pdf (accessed on 20 June 2021).
- Centro Nazionale Trapianti Valutazione di Qualità dell’attività del Trapianto di Polmone 2002–2015. Available online: https://trapianti.sanita.it/statistiche/attivita/2017_D_QUALITA_ORGANI_POLMONE_02-15.pdf (accessed on 20 June 2021).
- Gottlieb, J.; Greer, M.; Sommerwerck, U.; Deuse, T.; Witt, C.; Schramm, R.; Hagl, C.; Strueber, M.; Smits, J.M. Introduction of the Lung Allocation Score in Germany. Am. J. Transplant. 2014, 14, 1318–1327. [Google Scholar] [CrossRef] [PubMed]
- Centro Interregionale di Riferimento Nord Italia Transplant (NITp)—Riunione Tecnico-Scientifica. Available online: https://www.policlinico.mi.it/AMM/nitp/area_operatore/gruppi_lavoro/relazioni/relazione_2013.pdf (accessed on 20 June 2021).
- Schiavon, M.; Faggi, G.; Gregorio, G.D.; Calabrese, F.; Lunardi, F.; Marulli, G.; Feltracco, P.; Loy, M.; Damin, M.; Cozzi, E.; et al. Single-Center Experience in Urgent Lung Transplantation Program in a Country with a Shortage of Donors: Does the End Justify the Means? Clin. Transplant. 2017, 31, e13129. [Google Scholar] [CrossRef] [PubMed]


| Macroarea North | |||
| Piemonte | Emilia Romagna | Toscana | NITp |
| Macroarea south | |||
| Lazio | Sicilia | ||
| NITp: North Italian Transplant program | |||
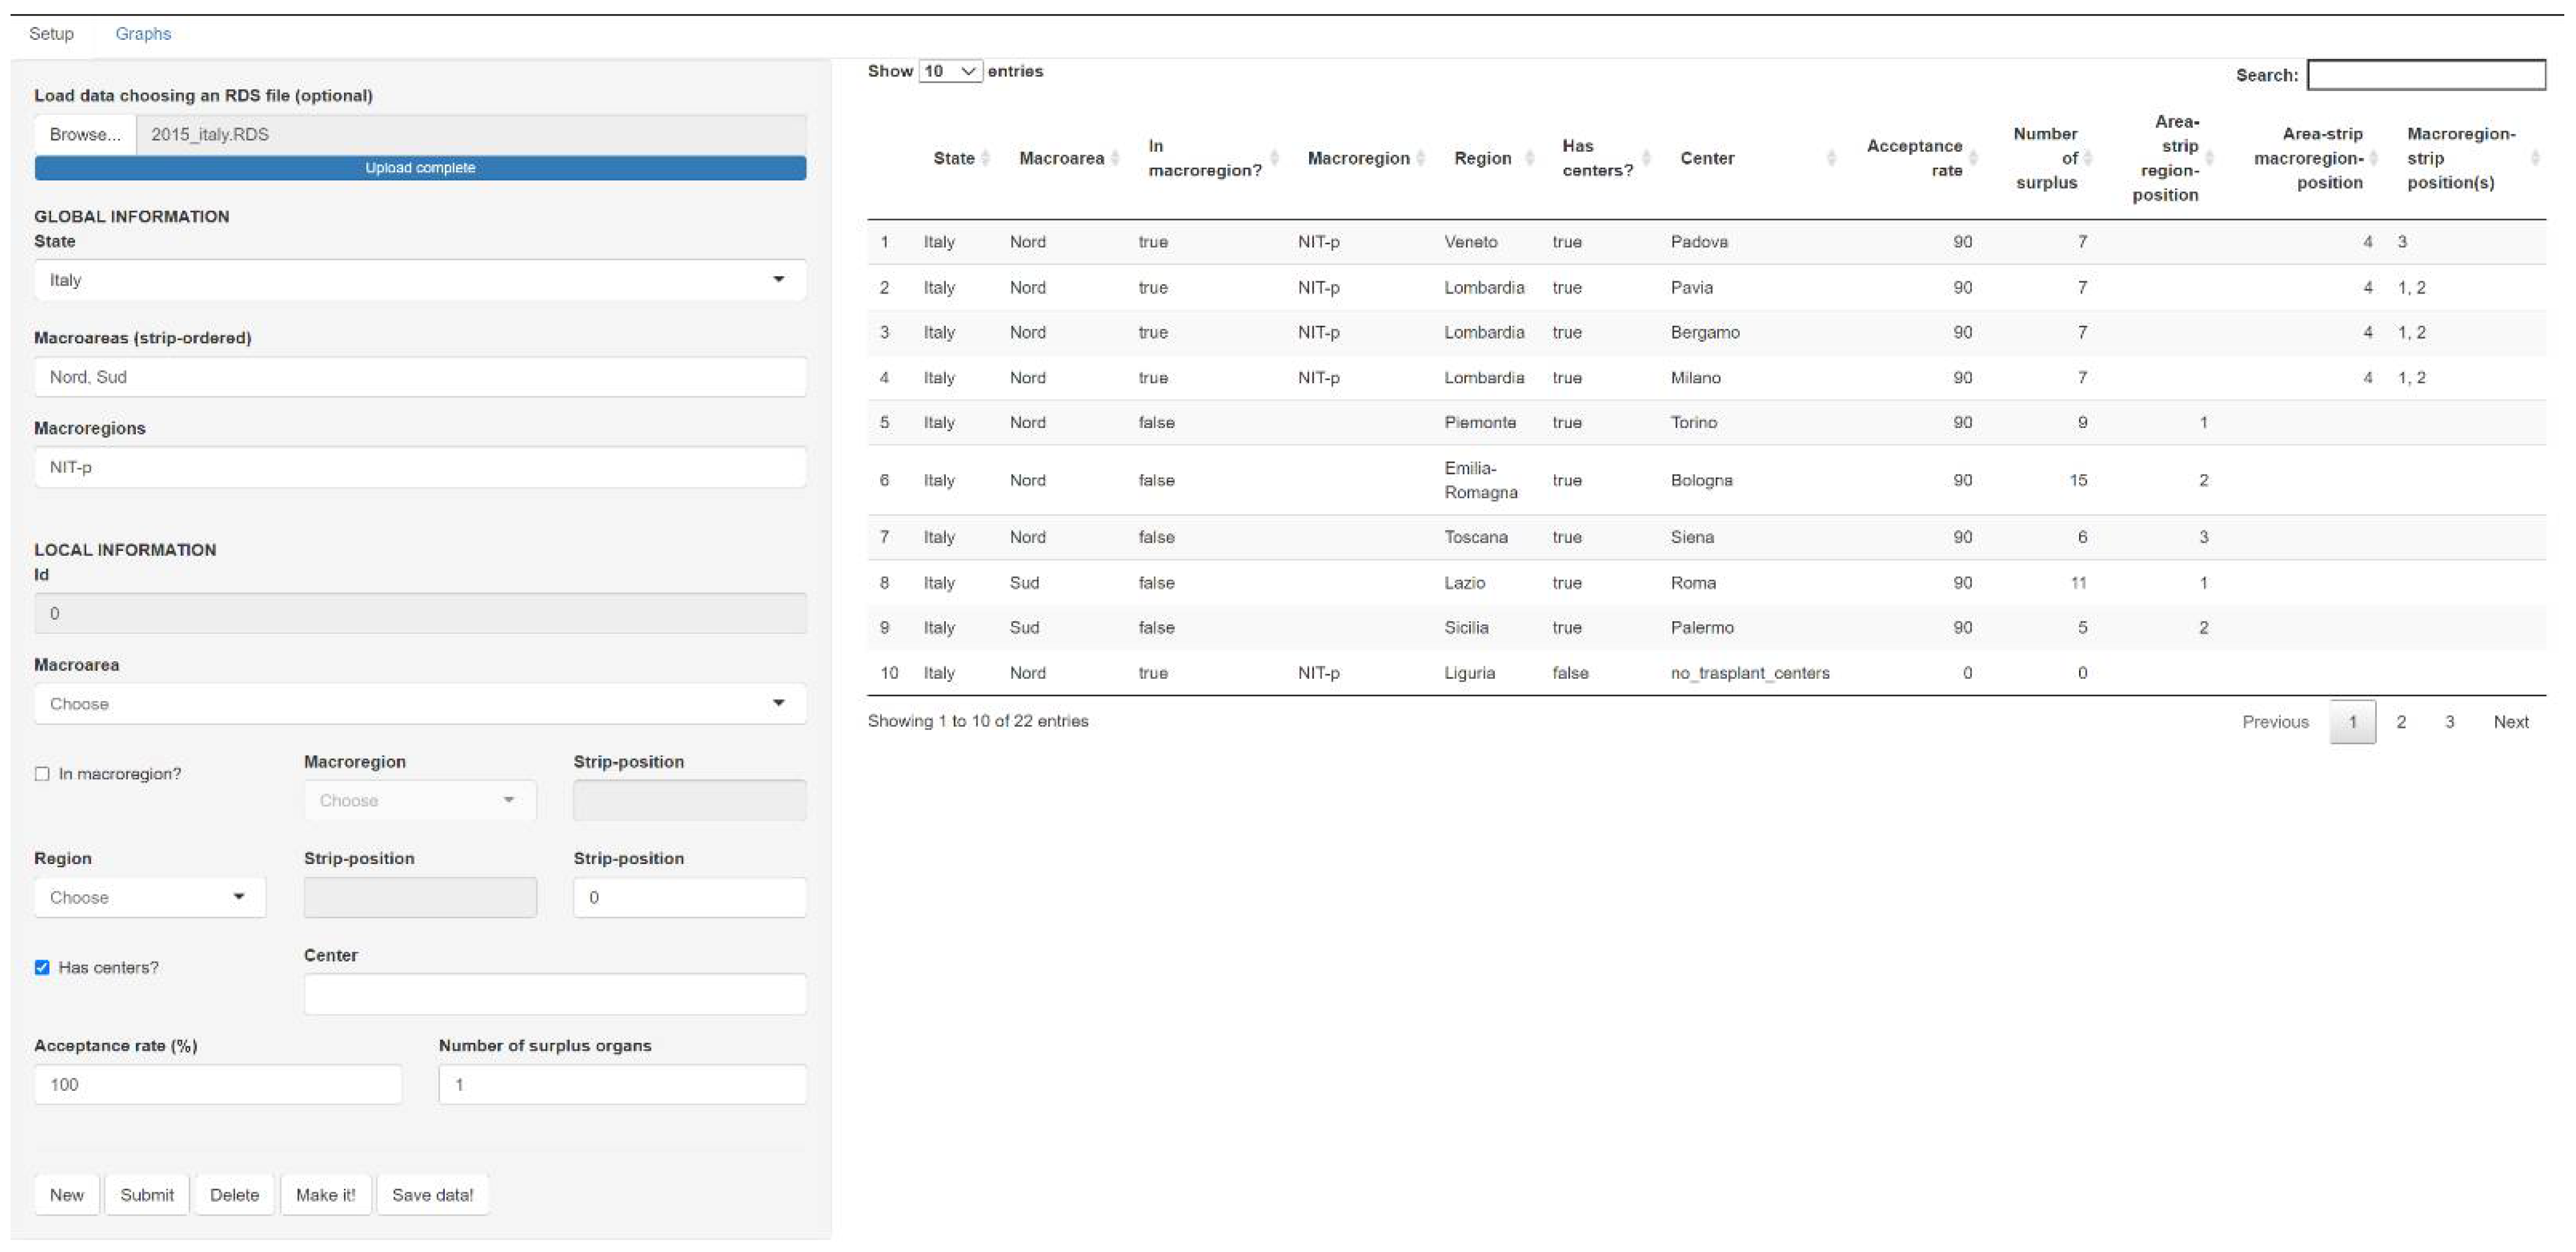
| Parameter | Description | Type | Example |
|---|---|---|---|
| Macroarea | MA of organ origin | categorical | North |
| South | |||
| Macroregion | Indication of macroregion when present | categorical | NITp |
| Region | Italian region with and without a CRT | categorical | Toscana |
| Veneto | |||
| Lombardia | |||
| Center | Indication of cities with a CRT | text | Siena |
| Padova | |||
| Bergamo | |||
| Milano | |||
| Acceptance rate | Percentages of acceptation | number | 26% |
| Number of surplus organs | number | 3 | |
| NITp: North Italian Transplant program | |||
Publisher’s Note: MDPI stays neutral with regard to jurisdictional claims in published maps and institutional affiliations. |
© 2021 by the authors. Licensee MDPI, Basel, Switzerland. This article is an open access article distributed under the terms and conditions of the Creative Commons Attribution (CC BY) license (https://creativecommons.org/licenses/by/4.0/).
Share and Cite
Lanera, C.; Ocagli, H.; Schiavon, M.; Dell’Amore, A.; Bottigliengo, D.; Bartolotta, P.; Acar, A.S.; Lorenzoni, G.; Berchialla, P.; Baldi, I.; et al. The Surplus Transplant Lung Allocation System in Italy: An Evaluation of the Allocation Process via Stochastic Modeling. Int. J. Environ. Res. Public Health 2021, 18, 7132. https://doi.org/10.3390/ijerph18137132
Lanera C, Ocagli H, Schiavon M, Dell’Amore A, Bottigliengo D, Bartolotta P, Acar AS, Lorenzoni G, Berchialla P, Baldi I, et al. The Surplus Transplant Lung Allocation System in Italy: An Evaluation of the Allocation Process via Stochastic Modeling. International Journal of Environmental Research and Public Health. 2021; 18(13):7132. https://doi.org/10.3390/ijerph18137132
Chicago/Turabian StyleLanera, Corrado, Honoria Ocagli, Marco Schiavon, Andrea Dell’Amore, Daniele Bottigliengo, Patrizia Bartolotta, Aslihan Senturk Acar, Giulia Lorenzoni, Paola Berchialla, Ileana Baldi, and et al. 2021. "The Surplus Transplant Lung Allocation System in Italy: An Evaluation of the Allocation Process via Stochastic Modeling" International Journal of Environmental Research and Public Health 18, no. 13: 7132. https://doi.org/10.3390/ijerph18137132
APA StyleLanera, C., Ocagli, H., Schiavon, M., Dell’Amore, A., Bottigliengo, D., Bartolotta, P., Acar, A. S., Lorenzoni, G., Berchialla, P., Baldi, I., Rea, F., & Gregori, D. (2021). The Surplus Transplant Lung Allocation System in Italy: An Evaluation of the Allocation Process via Stochastic Modeling. International Journal of Environmental Research and Public Health, 18(13), 7132. https://doi.org/10.3390/ijerph18137132