
How to Use Questionnaire Results in Psychosocial Risk Assessment: Calculating Risks for Health Impairment in Psychosocial Work Risk Assessment


Abstract
:1. Introduction
1.1. Psychosocial Work Risk Assessment
1.2. Prioritization and the Role of Questionnaire Results
1.3. Uniform Cutoff Values
1.4. Reference Value-Based Assessment of Questionnaire Results
1.5. Risk-Based Interpretation of Questionnaire Results
1.6. Ranking of Psychosocial Work Risks
1.7. Prioritization of Workplace Groups: Absolute Thresholds of Questionnaire Values for Increased Risk of Health Impairment
1.8. Study Aim
2. Methods and Materials
2.1. Procedure and Sample
2.2. Measures
2.2.1. Psychological Job Demands and Job Resources
2.2.2. Psychological Health Impairment
2.3. Analysis
3. Results
4. Discussion
4.1. General Discussion
4.2. Practical Implications
4.3. Limitations and Further Research Requirements
Author Contributions
Funding
Institutional Review Board Statement
Informed Consent Statement
Data Availability Statement
Conflicts of Interest
References
- GDA Portal—Leitlinie Beratung und Überwachung bei Psychischer Belastung am Arbeitsplatz 2018. Available online: https://www.gda-portal.de/DE/Aufsichtshandeln/Psychische-Belastung/Psychische-Belastung_node.html (accessed on 20 April 2021).
- Pejtersen, J.H.; Kristensen, T.S.; Borg, V.; Bjorner, J.B. The second version of the Copenhagen Psychosocial Questionnaire. Scand. J. Public Health 2010, 38, 8–24. [Google Scholar] [CrossRef]
- Janetzke, H.; Ertel, M. Psychosocial Risk Management in a European Comparison, 1st ed.; Bundesanstalt für Arbeitsschutz und Arbeitsmedizin: Berlin, Germany, 2017. [Google Scholar] [CrossRef]
- Nixon, A.E.; Mazzola, J.J.; Bauer, J.; Krueger, J.R.; Spector, P.E. Can work make you sick? A meta-analysis of the relationships between job stressors and physical symptoms. Work Stress 2011, 25, 1–22. [Google Scholar] [CrossRef]
- Krause, A.; Deufel, A. Vorteile von Mitarbeiterbefragungen und Gründe, die gegen ihren Einsatz sprechen. [Advantages of employee surveys and reasons against their use]. In Bundesanstalt für Arbeitsschutz und Arbeitsmedizin, Gefährungsbeurteilung psychischer Belastung, Erfahrungen und Empfehlungen [Risk Assessment of Mental Stress. Experiences and Recommendations]; Erich Schmidt Verlag: Berlin, Germany, 2014; pp. 70–71. [Google Scholar]
- Mustapha, V.; Rau, R. Criterion-Related Cutt-Off Values for Decision Latitude and Work Intensity: Determination and Evaluation [Kriteriumsbezogene Cut-Off-Werte für Tätigkeitsspielraum und Arbeitsintensität]. Diagnostica 2019, 65, 179–190. [Google Scholar] [CrossRef]
- Tabanelli, M.C.; Depolo, M.; Cooke, R.M.; Sarchielli, G.; Bonfiglioli, R.; Mattioli, S.; Violante, F.S. Available instruments for measurement of psychosocial factors in the work environment. Int. Arch. Occup. Environ. Health 2008, 82, 1–12. [Google Scholar] [CrossRef]
- Edwards, J.; Webster, S.; Van Laar, D.; Easton, S. Psychometric Analysis Of The UK Health And Safety Executive’s Management Standards Work-Related Stress Indicator Tool. Work Stress 2008, 22, 96–107. [Google Scholar] [CrossRef]
- Wolfgang, A.P. Job stress in the health professions: A study of physicians, nurses, and pharmacists. Behav. Med. 1988, 14, 43–47. [Google Scholar] [CrossRef]
- Sutherland, V.J.; Cooper, C.L. Understanding Stress; Chapman and Hall: London, UK, 1990. [Google Scholar]
- Aronsson, G.; Theorell, T.; Grape, T.; Hammarström, A.; Hogstedt, C.; Marteinsdottir, I.; Skoog, I.; Träskman-Bendz, L.; Hall, C. A systematic review including meta-analysis of work environment and burnout symptoms. BMC Public Health 2017, 17, 264. [Google Scholar] [CrossRef] [PubMed]
- Fila, M.; Purl, J.; Griffeth, R. Job Demands, Control And Support: Meta-Analyzing Moderator Effects Of Gender, Nationality, And Occupation. Hum. Resour. Manag. Rev. 2017, 27, 39–60. [Google Scholar] [CrossRef]
- Rau, R.; Buyken, D. Der aktuelle Kenntnisstand über Erkrankungsrisiken durch psychische Arbeitsbelastungen: Ein systematisches Review über Metaanalysen und Reviews [Current status of knowledge about health risk from mental workload: Evidence based on a systematic review of reviews]. Z. Arb. Organ. 2015, 59, 113–129. [Google Scholar] [CrossRef]
- Lesener, T.; Gusy, B.; Wolter, C. The job demands-resources model: A meta-analytic review of longitudinal studies. Work Stress 2019, 33, 76–103. [Google Scholar] [CrossRef]
- Lazarus, R.S.; Folkman, S. Stress, Appraisal, and Coping; Springer: New York, NY, USA, 1984. [Google Scholar]
- Bhagat, R.S.; Allie, S.M. Organizational stress, personal life stress, and symptoms of life strains: An examination of the moderating role of sense of competence. J. Vocat. Behav. 1989, 35, 231–253. [Google Scholar] [CrossRef]
- Parkes, K.R. Personality and coping as moderators of work stress processes: Models, methods and measures. Work Stress 1994, 8, 110–129. [Google Scholar] [CrossRef]
- Biron, C.; Ivers, H.; Brun, J.P.; Cooper, C.L. Risk assessment of occupational stress: Extensions of the Clarke and Cooper approach. Health Risk Soc. 2006, 8, 417–429. [Google Scholar] [CrossRef]
- Dettmers, J.; Krause, A. Der Fragebogen Zur Gefährdungsbeurteilung Psychischer Belastungen (FGBU) [The Questionnaire for Psychological Risk Assessment at Work]. Z. Arb. Organ. A&O 2020, 64, 99–119. [Google Scholar] [CrossRef]
- Schneider, I.; Mädler, M.; Lang, J. Comparability of Self-Ratings and Observer Ratings in Occupational Psychosocial Risk Assessments: Is There Agreement? BioMed Res. Int. 2019, 1–10. [Google Scholar] [CrossRef]
- Clarke, S.G.; Cooper, C.L. The risk management of occupational stress. Health Risk Soc. 2000, 2, 173–187. [Google Scholar] [CrossRef]
- Warner, F. Risk Analysis, Perception and Management|Royal Society. 1992. Available online: https://royalsociety.org/topics-policy/publications/1992/risk/ (accessed on 20 April 2021).
- McFarlane, L.J. An Audit of Stress, Job Satisfaction and General Psychological Health in a Leading National Retail Organisation. MSc Dissertation, School of Management, UMIST, Manchester, UK, 1997. [Google Scholar]
- Goldberg, D. Manual of the General Health Questionnaire; NFER: Windsor, UK, 1978. [Google Scholar]
- Zeike, S.; Ansmann, L.; Lindert, L.; Samel, C.; Kowalski, C.; Pfaff, H. Identifying cut-off scores for job demands and job control in nursing professionals: A cross-sectional survey in Germany. BMJ Open 2018, 8, e021366. [Google Scholar] [CrossRef]
- Karasek, R.A.; Theorell, T. Healthy Work: Stress, Productivity and the Reconstruction of Working Life; Basic Books: New York, NY, USA, 1990. [Google Scholar]
- Karasek, R.; Brisson, C.; Kawakami, N.; Houtman, I.; Bongers, P.; Amick, B. The Job Content Questionnaire (JCQ): An instrument for internationally comparative assessments of psychosocial job characteristics. J. Occup. Health Psychol. 1998, 3, 322–355. [Google Scholar] [CrossRef]
- Topp, C.W.; Østergaard, S.D.; Søndergaard, S.; Bech, P. The WHO-5 Well-Being Index: A systematic review of the literature. Psychother Psychosom 2015, 84, 167–176. [Google Scholar] [CrossRef]
- Löwe, B.; Spitzer, R.L.; Gräfe, K.; Kroenke, K.; Quenter, A.; Zipfel, S.; Buchholz, C.; Witte, S.; Herzog, W. Comparative validity of three screening questionnaires for DSM-IV depressive disorders and physicians’ diagnoses. J. Affect. Disord. 2004, 78, 131–140. [Google Scholar] [CrossRef]
- Bakker, A.B.; Demerouti, E. Job demands-resources theory: Taking stock and looking forward. J. Occup. Health Psychol. 2017, 22, 273–285. [Google Scholar] [CrossRef]
- Schermuly, C.C.; Meyer, B. Good relationships at work: The effects of leader–member exchange and team–member exchange on psychological empowerment, emotional exhaustion, and depression. J. Organ. Behav. 2016, 37, 673–691. [Google Scholar] [CrossRef]
- Enzmann, D.; Kleiber, D. Helfer-Leiden: Stress und Burnout in Psychosozialen Berufen; Asanger: Kröning, Germany, 1989. [Google Scholar]
- Maslach, C.; Jackson, S.E. Maslach Burnout Inventory, Manual, 2nd ed.; Consulting Psychologists Press: Palo Alto, CA, USA, 1986. [Google Scholar]
- Kalimo, R.; Pahkin, K.; Mutanen, P.; Topipinen-Tanner, S. Staying well or burning out at work: Work characteristics and personal resources as long-term predictors. Work Stress 2003, 17, 109–122. [Google Scholar] [CrossRef]
- Leiter, M.P.; Maslach, C. Latent burnout profiles: A new approach to understanding the burnout experience. Burn. Res. 2016, 3, 89–100. [Google Scholar] [CrossRef]
- Maslach, C.; Jackson, S.E.; Leiter, M.P. The Maslach Burnout Inventory Manual. In Evaluating Stress: A Book of Resources; Zalaquett, C., Wood, R.J., Eds.; Scarecrow Education: Lanham, MD, USA, 1997. [Google Scholar]
- Vegchel, N.; Jonge, J.; Söderfeldt, M.; Dormann, C.; Schaufeli, W. Quantitative Versus Emotional Demands Among Swedish Human Service Employees: Moderating Effects Of Job Control And Social Support. Int. J. Stress Manag. 2004, 11, 21–40. [Google Scholar] [CrossRef]
- Nagelkerke, N.J. A note on a general definition of the coefficient of determination. Biometrika 1991, 78, 691–692. [Google Scholar] [CrossRef]
- Cox, D.R.; Snell, E.J. The Analysis of Binary Data, 2nd ed.; Chapman and Hall: London, UK, 1989. [Google Scholar] [CrossRef]
- Grice, J.; Medellin, E.; Jones, I.; Horvath, S.; McDaniel, H.; O’lansen, C.; Baker, M. Persons As Effect Sizes. Adv. Methods Pract. Psychol. Sci. 2020, 3, 443–455. [Google Scholar] [CrossRef]
- de Jonge, J.; Dormann, C. The DISC model: Demand-induced strain compensation mechanisms in job stress. In Occupational Stress in the Service Professions; Dollard, M.F., Winefield, A.H., Winefield, H.R., Eds.; Taylor & Francis: London, UK, 2003; pp. 43–74. [Google Scholar]
- Arlinghaus, A.; Nachreiner, F. When work calls-associations between being contacted outside of regular working hours for work-related matters and health. Chronobiol. Int. 2013, 30, 1197–1202. [Google Scholar] [CrossRef]
- Emmer, C.; Bosnjak, M.; Mata, J. The Association Between Weight Stigma And Mental Health: A Meta-Analysis. Obes. Rev. 2019, 21. [Google Scholar] [CrossRef]
- Hughes, M.; Yang, E.; Ramanathan, D.; Benjamins, M. Community-Based Diabetes Community Health Worker Intervention In An Underserved Chicago Population. J. Community Health 2016, 41, 1249–1256. [Google Scholar] [CrossRef]

| Scale | Sample Item | α | M (SD) |
|---|---|---|---|
| Work task content | |||
| Completeness of work task (CWT) | At work, I am involved in work processes from start to finish. | 0.71 | 3.11 (0.71) |
| Autonomy (AUT) | I have a lot of freedom in the way I do my job. | 0.84 | 3.02 (0.74) |
| Variability (VAR) | My work tasks change frequently. | 0.77 | 2.90 (0.66) |
| Lack of information (INFO_L) | The lack of necessary information hampers decision-making. | 0.83 | 2.61 (0.76) |
| Information overload (INFO_O) | The daily amount of information is too much (e.g., mails, corporate communications). | 0.85 | 2.30 (0.80) |
| Responsibility and skills | |||
| Role ambiguity (ROLE_A) | The priorities between different work goals are not clearly defined. | 0.77 | 2.08 (0.76) |
| Qualification problems (QP) | I often feel overwhelmed by the type of tasks I am given. | 0.81 | 2.06 (0.79) |
| Underutilization of skills (UU) | My work is not challenging. | 0.83 | 1.97 (0.79) |
| Emotional load | |||
| Social and emotional stress (SO_EM) | My work sometimes causes states that are very emotionally draining (e.g., grief, rage). | 0.83 | 2.15 (0.84) |
| Emotional dissonance (E_DISS) | At work, I often have to hide my real feelings. | 0.90 | 2.29 (0.88) |
| Work organization | |||
| Work time design (WTD) | I have highly variable working hours. | 0.82 | 1.83 (0.85) |
| Overtime (OT) | I often work overtime. | 0.81 | 2.21 (0.86) |
| Work intensity (INT) | The high volume of work often causes intense time pressure. | 0.89 | 2.40 (0.91) |
| Work interruptions (WI) | During my work I am often interrupted by other people. | 0.88 | 2.94 (0.81) |
| Lack of communication (LOC) | My workplace lacks opportunities for personal interaction. | 0.84 | 1.67 (0.76) |
| Social relations | |||
| Social support from colleagues (SUPP_C) | I can talk openly about everything with my colleagues. | 0.88 | 3.05 (0.73) |
| Social stressors from colleagues (STRESS_C) | There are often tensions between colleagues. | 0.84 | 1.80 (0.72) |
| Social support from supervisors (SUPP_S) | My supervisor is ready to listen to my problems. | 0.90 | 2.95 (0.81) |
| Feedback and recognition (F and R) | I am recognized for my work. | 0.87 | 2.71 (0.82) |
| Work environment | |||
| Physical stressors (PHY) | Poor ergonomic design. | 0.89 | 1.80 (0.66) |
| Variables | 1 | 2 | 3 | 4 | 5 | 6 | 7 | 8 | 9 | 10 | 11 | 12 | 13 | 14 | 15 | 16 | 17 | 18 | 19 | 20 |
|---|---|---|---|---|---|---|---|---|---|---|---|---|---|---|---|---|---|---|---|---|
| 1 EE | 1.0 ** | |||||||||||||||||||
| 2 CWT | −0.07 ** | |||||||||||||||||||
| 3 AUT | −0.20 ** | 0.35 ** | ||||||||||||||||||
| 4 VAR | −0.07 ** | 0.37 ** | 0.30 ** | |||||||||||||||||
| 5 INFO_L | 0.33 ** | 0.09 ** | 0.02 | 0.24 ** | ||||||||||||||||
| 6 INFO_O | 0.33 ** | 0.05 ** | −0.04 ** | 0.20 ** | 0.57 ** | |||||||||||||||
| 7 ROLE_A | 0.39 ** | −0.09 ** | −0.12 ** | 0.03 | 0.48 ** | 0.44 ** | ||||||||||||||
| 8 QP | 0.42 ** | −0.04 ** | −0.08 ** | 0.07 ** | 0.45 ** | 0.44 ** | 0.58 ** | |||||||||||||
| 9 UU | 0.12 ** | −0.23 ** | −0.09 ** | −0.29 ** | 0.07 ** | 0.03 | 0.31 ** | 0.15 ** | ||||||||||||
| 10 SO_EM | 0.43 ** | −0.01 | −0.19 ** | 0.07 ** | 0.29 ** | 0.28 ** | 0.38 ** | 0.37 ** | 0.11 ** | |||||||||||
| 11 E_DISS | 0.42 ** | −0.04 ** | −0.19 ** | 0.03 | 0.27 ** | 0.26 ** | 0.36 ** | 0.36 ** | 0.16 ** | 0.65 ** | ||||||||||
| 12 WTD | 0.20 ** | −0.00 | −0.20 ** | 0.10 ** | 0.16 ** | 0.21 ** | 0.24 ** | 0.22 ** | 0.08 ** | 0.42 ** | 0.33 ** | |||||||||
| 13 OT | 0.35 ** | 0.13 ** | −0.07 ** | 0.24 ** | 0.34 ** | 0.40 ** | 0.30 ** | 0.36 ** | −0.07 ** | 0.39 ** | 0.35 ** | 0.53 ** | ||||||||
| 14 INT | 0.48 ** | 0.12 ** | −0.11 ** | 0.18 ** | 0.40 ** | 0.48 ** | 0.34 ** | 0.41 ** | −0.11 ** | 0.40 ** | 0.35 ** | 0.35 ** | 0.71 ** | |||||||
| 15 WI | 0.37 ** | 0.10 ** | −0.03 * | 0.21 ** | 0.41 ** | 0.39 ** | 0.30 ** | 0.34 ** | −0.04 ** | 0.32 ** | 0.31 ** | 0.16 ** | 0.42 ** | 0.54 ** | ||||||
| 16 LOC | 0.22 ** | −0.09 ** | −0.08 ** | −0.05 ** | 0.16 ** | 0.21 ** | 0.30 ** | 0.28 ** | 0.23 ** | 0.24 ** | 0.24 ** | 0.30 ** | 0.23 ** | 0.21 ** | 0.05 ** | |||||
| 17 SUPP_C | −0.29 ** | 0.16 ** | 0.19 ** | 0.19 ** | −0.13 ** | −0.13 ** | −0.25 ** | −0.21 ** | −0.17 ** | −0.16 ** | −0.21 ** | −0.10 ** | −0.12 ** | −0.16 ** | −0.05 ** | −0.28 ** | ||||
| 18 STRESS_C | 0.40 ** | −0.10 ** | −0.15 ** | −0.07 ** | 0.25 ** | 0.25 ** | 0.44 ** | 0.38 ** | 0.27 ** | 0.44 ** | 0.38 ** | 0.29 ** | 0.29 ** | 0.30 ** | 0.20 ** | 0.35 ** | −0.45 ** | |||
| 19 SUPP_S | −0.35 ** | 0.16 ** | 0.18 ** | 0.17 ** | −0.17 ** | −0.14 ** | −0.34 ** | −0.27 ** | −0.18 ** | −0.23 ** | −0.21 ** | −0.10 ** | −0.15 ** | −0.20 ** | −0.11 ** | −0.18 ** | 0.50 ** | −0.35 ** | ||
| 20 F and R | −0.33 ** | 0.18 ** | 0.19 ** | 0.19 ** | −0.15 ** | −0.10 ** | −0.30 ** | −0.23 ** | −0.21 ** | −0.19 ** | −0.20 ** | −0.06 ** | −0.07 ** | −0.14 ** | −0.13 ** | −0.12 ** | 0.43 ** | −0.28 ** | 0.68 ** | |
| 21 PHY | 0.37 ** | −0.06 ** | −0.28 ** | −0.04 ** | 0.20 ** | 0.23 ** | 0.32 ** | 0.29 ** | 0.23 ** | 0.41 ** | 0.34 ** | 0.48 ** | 0.34 ** | 0.31 ** | 0.19 ** | 0.30 ** | −0.19 ** | 0.41 ** | −0.22 ** | −0.20 ** |
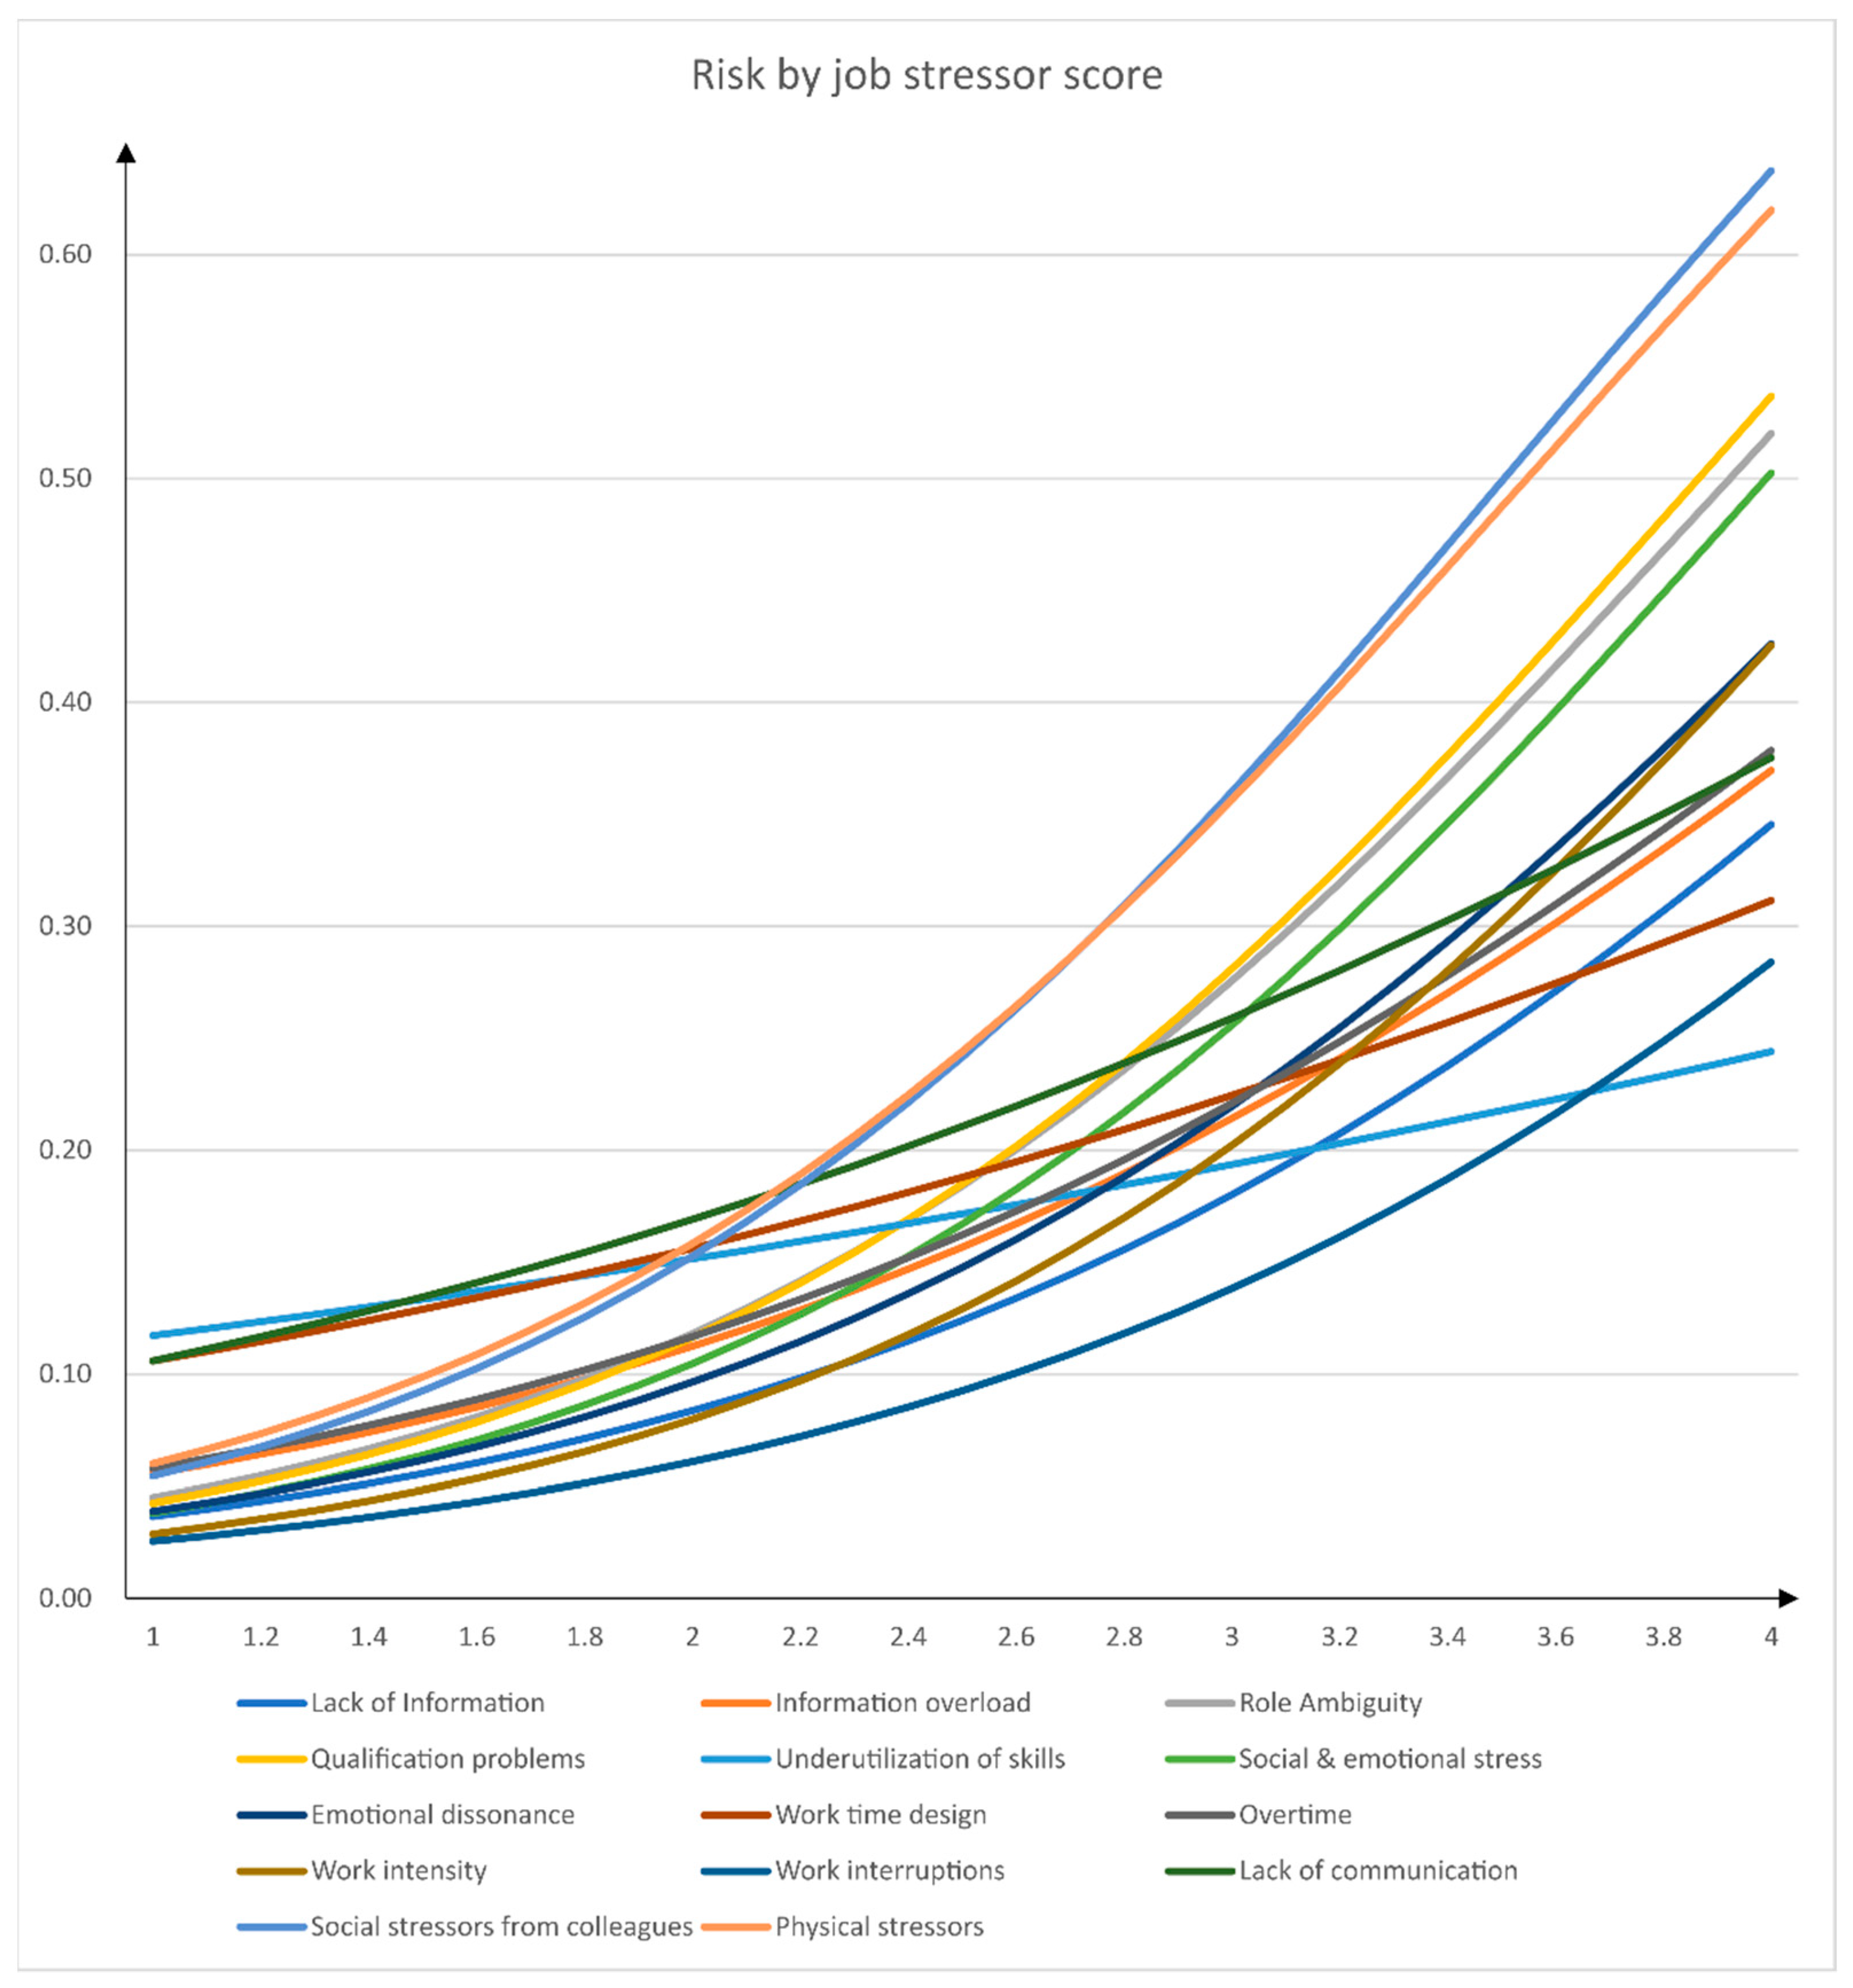
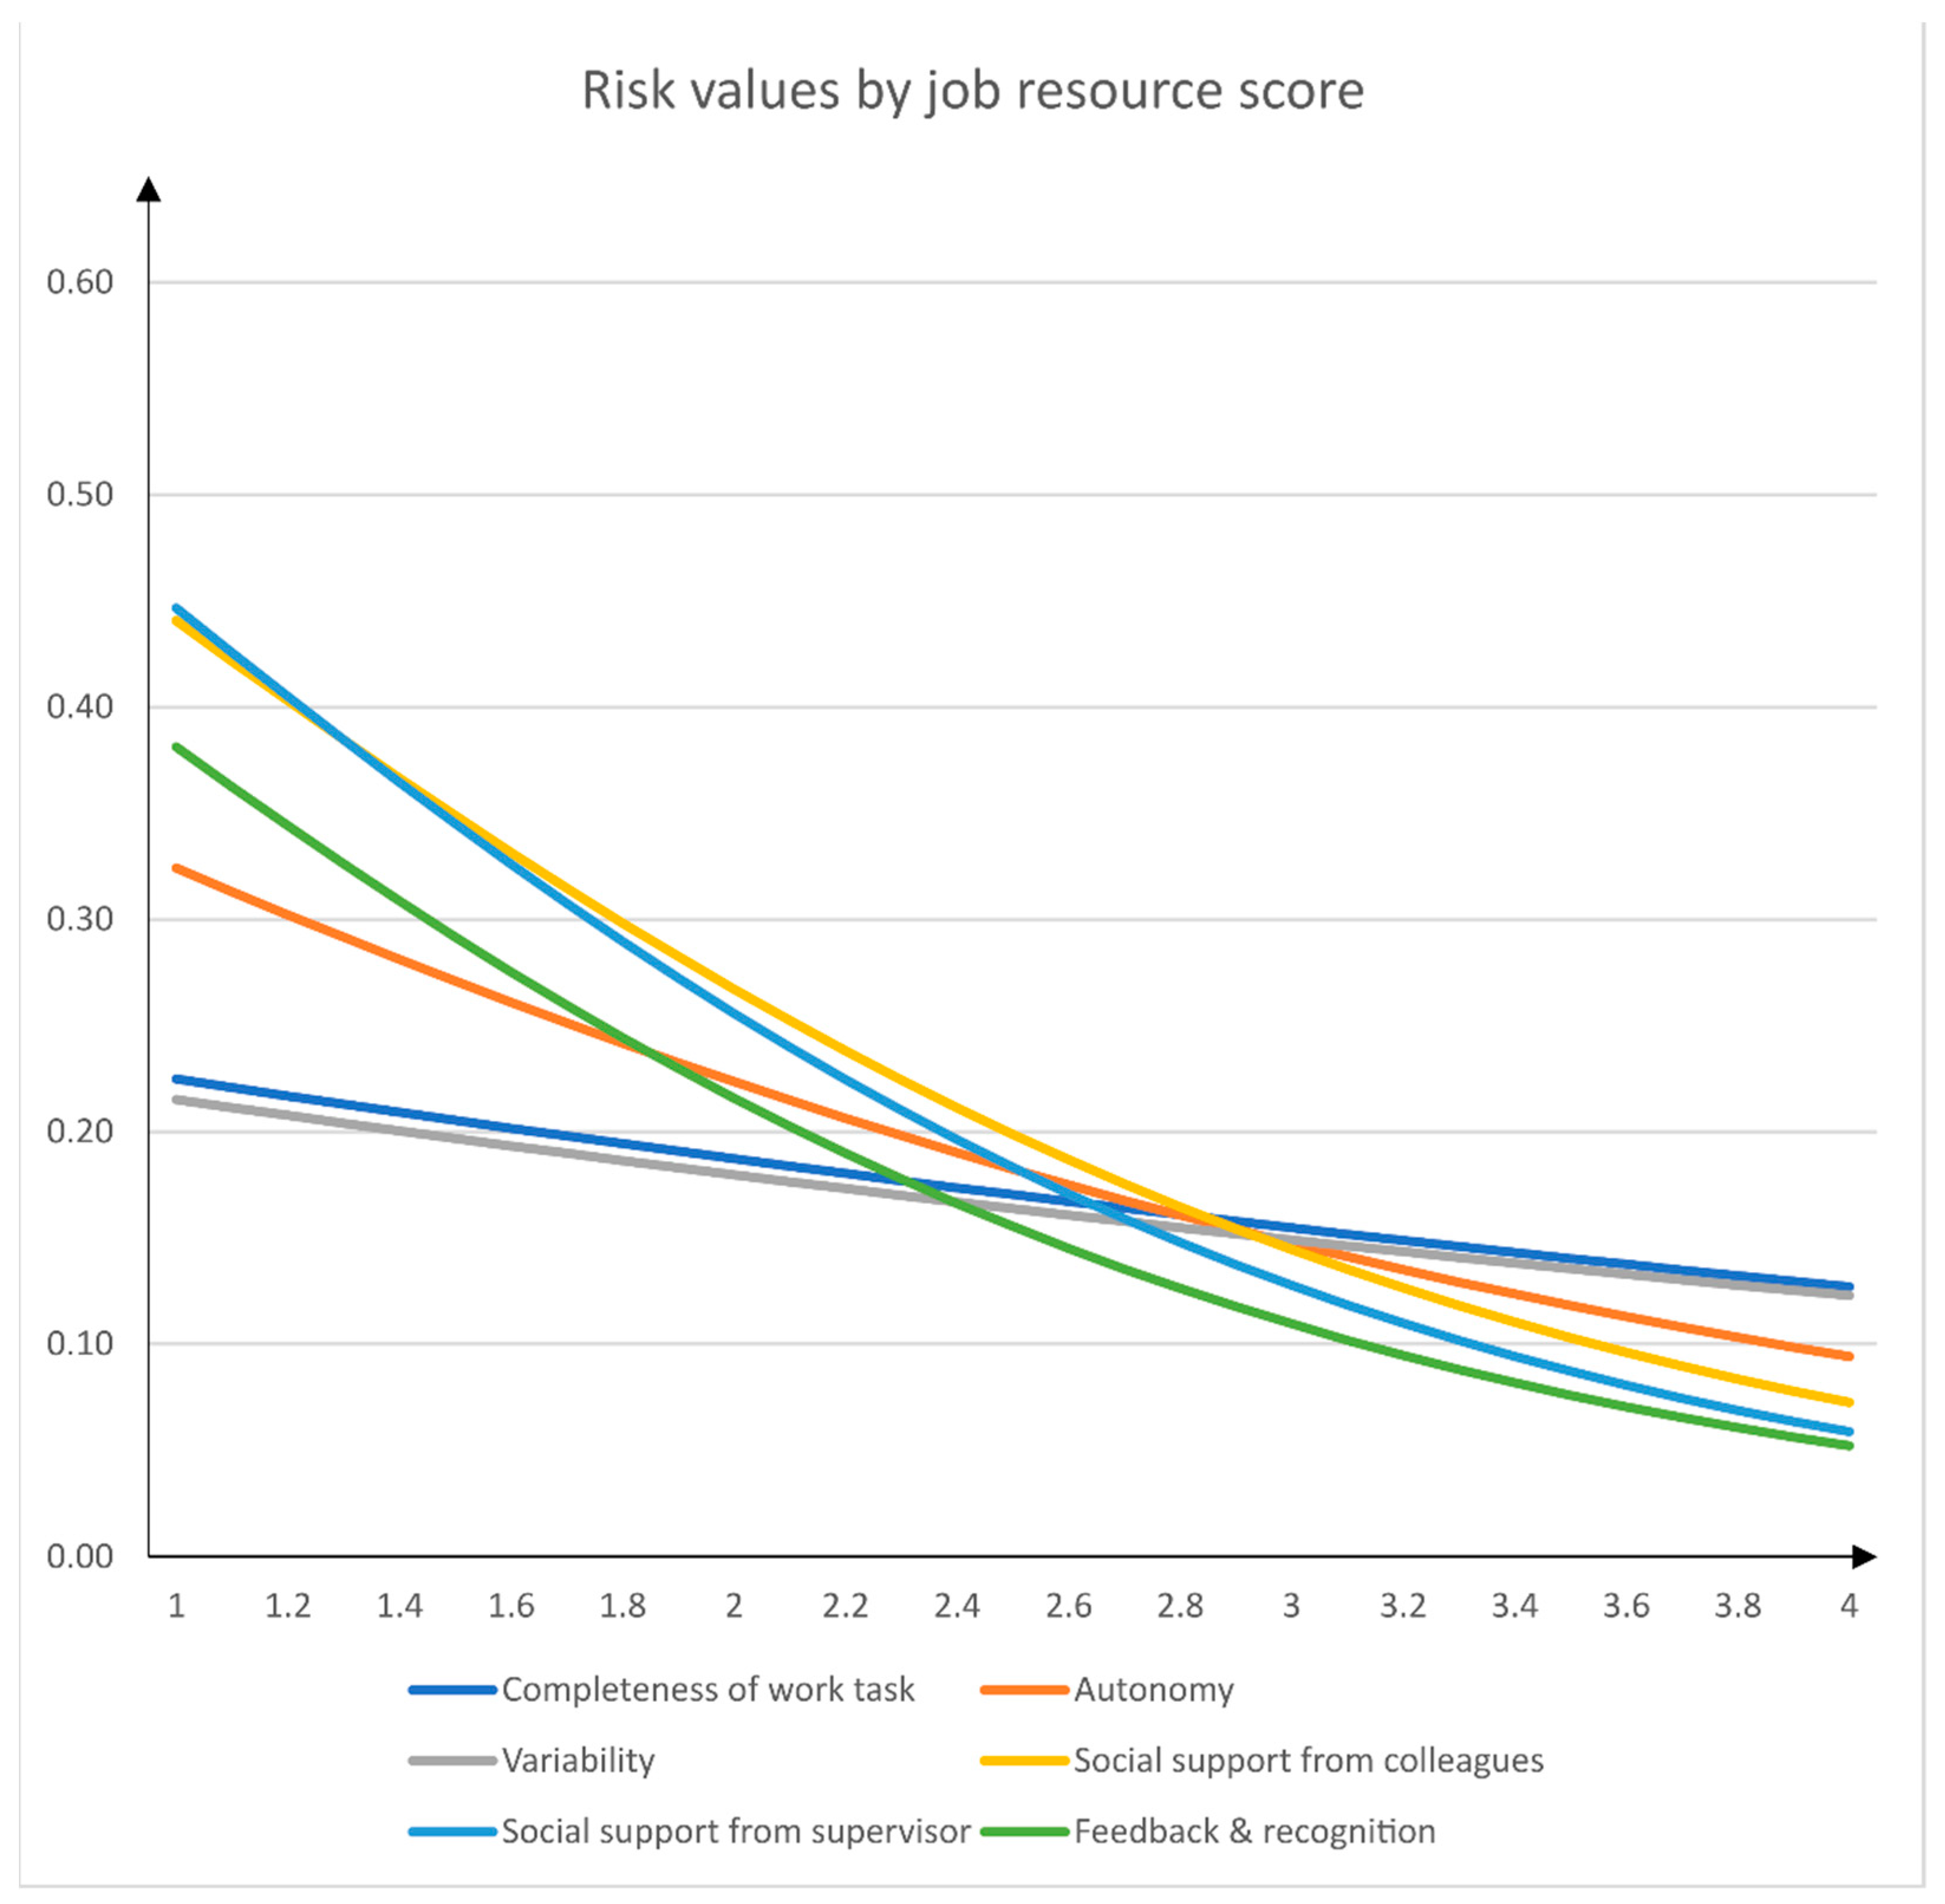
| Predictors | Intercept | B | Probability for Psychological Health Impairment for Questionnaire Score | |||
|---|---|---|---|---|---|---|
| 1 | 2 | 3 | 4 | |||
| Job Stressors | ||||||
| Lack of information (INFO_L) | −4.15 | 0.88 | 0.04 | 0.08 | 0.18 | 0.35 |
| Information overload (INFO_O) | −3.60 | 0.77 | 0.06 | 0.11 | 0.21 | 0.37 |
| Role ambiguity (ROLE_A) | −4.10 | 1.05 | 0.04 | 0.12 | 0.28 | 0.52 |
| Qualification problems (QP) | −4.20 | 1.09 | 0.04 | 0.12 | 0.28 | 0.54 |
| Underutilization of skills (UU) | −2.32 | 0.30 | 0.12 | 0.15 | 0.19 | 0.24 |
| Social and emotional stress (SO_EM) | −4.30 | 1.08 | 0.04 | 0.10 | 0.26 | 0.50 |
| Emotional dissonance (E_DISS) | −4.18 | 0.97 | 0.04 | 0.10 | 0.22 | 0.43 |
| Work time design (WTD) | −2.58 | 0.45 | 0.11 | 0.16 | 0.22 | 0.31 |
| Overtime (OT) | −3.55 | 0.76 | 0.06 | 0.12 | 0.22 | 0.38 |
| Work intensity (INT) | −4.59 | 1.07 | 0.03 | 0.08 | 0.20 | 0.43 |
| Work interruptions (WI) | −4.55 | 0.91 | 0.03 | 0.06 | 0.14 | 0.28 |
| Lack of communication (LOC) | −2.67 | 0.54 | 0.11 | 0.17 | 0.26 | 0.38 |
| Social stressors from colleagues (STRESS_C) | −3.99 | 1.14 | 0.05 | 0.15 | 0.36 | 0.64 |
| Physical stressors (PHY) | −3.83 | 1.08 | 0.06 | 0.16 | 0.36 | 0.62 |
| Job Resources | ||||||
| Completeness of work task (CWT) | −1.01 | −0.23 | 0.22 | 0.19 | 0.15 | 0.13 |
| Autonomy (AUT) | −0.23 | −0.51 | 0.32 | 0.22 | 0.15 | 0.09 |
| Variability (VAR) | −1.07 | −0.22 | 0.22 | 0.18 | 0.15 | 0.12 |
| Social support from colleagues (SUPP_C) | 0.53 | −0.77 | 0.44 | 0.27 | 0.14 | 0.07 |
| Social support from supervisor (SUPP_S) | 0.64 | −0.85 | 0.45 | 0.26 | 0.13 | 0.06 |
| Feedback and recognition (F and R) | 0.32 | −0.81 | 0.38 | 0.22 | 0.11 | 0.05 |
| Job Stressors | Scale Score | Autonomy | |||
|---|---|---|---|---|---|
| 1 | 2 | 3 | 4 | ||
| Work intensity | 1 | 0.07 | 0.04 | 0.03 | 0.02 |
| 2 | 0.16 | 0.12 | 0.08 | 0.05 | |
| 3 | 0.37 | 0.28 | 0.19 | 0.13 | |
| 4 | 0.63 | 0.52 | 0.41 | 0.31 | |
| Social support from supervisor | |||||
| Scale score | 1 | 2 | 3 | 4 | |
| Social and emotional stress | 1 | 0.13 | 0.07 | 0.04 | 0.02 |
| 2 | 0.24 | 0.17 | 0.09 | 0.05 | |
| 3 | 0.53 | 0.36 | 0.21 | 0.12 | |
| 4 | 0.76 | 0.60 | 0.43 | 0.27 | |
| Scale | Score | Psychological Health Impairment | PCC | |
|---|---|---|---|---|
| 0 | 1 | |||
| Lack of information ≥ 3.8 | 0 | 3373 | 526 | 82.92% |
| 1 | 193 | 117 | ||
| Information overload ≥ 3.6 | 0 | 3359 | 525 | 82.59% |
| 1 | 208 | 118 | ||
| Role ambiguity ≥ 3.1 | 0 | 3351 | 479 | 83.49% |
| 1 | 216 | 164 | ||
| Qualification problems ≥ 3.1 | 0 | 3322 | 477 | 82.85% |
| 1 | 245 | 166 | ||
| Social and emotional stress ≥ 3.2 | 0 | 3232 | 429 | 81.85% |
| 1 | 335 | 214 | ||
| Emotional dissonance ≥ 3.5 | 0 | 3314 | 471 | 82.80% |
| 1 | 253 | 172 | ||
| Work time design ≥ 3.9 | 0 | 3478 | 602 | 83.59% |
| 1 | 89 | 41 | ||
| Overtime ≥ 3.6 | 0 | 3349 | 502 | 82.90% |
| 1 | 218 | 141 | ||
| Work intensity ≥ 3.5 | 0 | 3253 | 411 | 82.80% |
| 1 | 313 | 232 | ||
| Lack of communication ≥ 3.4 | 0 | 3508 | 595 | 84.47% |
| 1 | 59 | 48 | ||
| Social stressors from colleagues ≥ 2.8 | 0 | 3330 | 434 | 84.08% |
| 1 | 236 | 209 | ||
| Physical stressors ≥ 2.8 | 0 | 2638 | 382 | 82.79% |
| 1 | 193 | 129 | ||
| Autonomy ≤ 1.2 | 0 | 3505 | 612 | 83.99% |
| 1 | 62 | 31 | ||
| Social support from colleagues ≤ 1.8 | 0 | 3418 | 554 | 83.32% |
| 1 | 148 | 89 | ||
| Social support from supervisor ≤ 1.7 | 0 | 3328 | 482 | 83.03% |
| 1 | 231 | 160 | ||
| Feedback and recognition ≤ 1.4 | 0 | 3323 | 500 | 82.39% |
| 1 | 241 | 143 | ||
Publisher’s Note: MDPI stays neutral with regard to jurisdictional claims in published maps and institutional affiliations. |
© 2021 by the authors. Licensee MDPI, Basel, Switzerland. This article is an open access article distributed under the terms and conditions of the Creative Commons Attribution (CC BY) license (https://creativecommons.org/licenses/by/4.0/).
Share and Cite
Dettmers, J.; Stempel, C.R. How to Use Questionnaire Results in Psychosocial Risk Assessment: Calculating Risks for Health Impairment in Psychosocial Work Risk Assessment. Int. J. Environ. Res. Public Health 2021, 18, 7107. https://doi.org/10.3390/ijerph18137107
Dettmers J, Stempel CR. How to Use Questionnaire Results in Psychosocial Risk Assessment: Calculating Risks for Health Impairment in Psychosocial Work Risk Assessment. International Journal of Environmental Research and Public Health. 2021; 18(13):7107. https://doi.org/10.3390/ijerph18137107
Chicago/Turabian StyleDettmers, Jan, and Christiane R. Stempel. 2021. "How to Use Questionnaire Results in Psychosocial Risk Assessment: Calculating Risks for Health Impairment in Psychosocial Work Risk Assessment" International Journal of Environmental Research and Public Health 18, no. 13: 7107. https://doi.org/10.3390/ijerph18137107
APA StyleDettmers, J., & Stempel, C. R. (2021). How to Use Questionnaire Results in Psychosocial Risk Assessment: Calculating Risks for Health Impairment in Psychosocial Work Risk Assessment. International Journal of Environmental Research and Public Health, 18(13), 7107. https://doi.org/10.3390/ijerph18137107