
A Machine Learning Approach for Investigating Delirium as a Multifactorial Syndrome

 ,
,  , , ,
, , , 
Abstract
:1. Introduction
2. Materials and Methods
2.1. Study Design and Inclusion Criteria
2.2. Variables Collected
2.3. Instrument
2.4. Statistical Analysis
2.5. Machine Learning Approach
3. Results
4. Discussion
Limitations
5. Conclusions
Author Contributions
Funding
Institutional Review Board Statement
Informed Consent Statement
Data Availability Statement
Conflicts of Interest
References
- American Psychiatric Association. Diagnostic and Statistical Manual of Mental Disorders, 5th ed.; American Psychiatric Association: Washington, DC, USA, 2013; ISBN 978-0-89042-555-8. [Google Scholar]
- Bellelli, G.; Brathwaite, J.S.; Mazzola, P. Delirium: A Marker of Vulnerability in Older People. Front. Aging Neurosci. 2021, 13, 626127. [Google Scholar] [CrossRef] [PubMed]
- Inouye, S.K. Predisposing and Precipitating Factors for Delirium in Hospitalized Older Patients. Dement. Geriatr. Cogn. Disord. 1999, 10, 393–400. [Google Scholar] [CrossRef] [PubMed]
- Bull, M.J.; Boaz, L.; Jermé, M. Educating Family Caregivers for Older Adults about Delirium: A Systematic Review. Worldviews Evid. Based Nurs. 2016, 13, 232–240. [Google Scholar] [CrossRef] [PubMed] [Green Version]
- Bellelli, G.; Morandi, A.; Di Santo, S.G.; Mazzone, A.; Cherubini, A.; Mossello, E.; Bo, M.; Bianchetti, A.; Rozzini, R.; Zanetti, E.; et al. “Delirium Day”: A Nationwide Point Prevalence Study of Delirium in Older Hospitalized Patients Using an Easy Standardized Diagnostic Tool. BMC Med. 2016, 14, 106. [Google Scholar] [CrossRef] [Green Version]
- Marquetand, J.; Bode, L.; Fuchs, S.; Hildenbrand, F.; Ernst, J.; von Kaenel, R.; Boettger, S. Risk Factors for Delirium Are Different in the Very Old: A Comparative One-Year Prospective Cohort Study of 5831 Patients. Front. Psychiatry 2021, 12, 655087. [Google Scholar] [CrossRef]
- Wu, J.; Yin, Y.; Jin, M.; Li, B. The Risk Factors for Postoperative Delirium in Adult Patients after Hip Fracture Surgery: A Systematic Review and Meta-Analysis. Int. J. Geriatr. Psychiatry 2021, 36, 3–14. [Google Scholar] [CrossRef]
- Visser, L.; Prent, A.; Banning, L.B.D.; van Leeuwen, B.L.; Zeebregts, C.J.; Pol, R.A. Risk Factors for Delirium after Vascular Surgery: A Systematic Review and Meta-Analysis. Ann. Vasc. Surg. 2021. [Google Scholar] [CrossRef]
- Rong, X.; Ding, Z.-C.; Yu, H.; Yao, S.-Y.; Zhou, Z.-K. Risk Factors of Postoperative Delirium in the Knee and Hip Replacement Patients: A Systematic Review and Meta-Analysis. J. Orthop. Surg. 2021, 16, 76. [Google Scholar] [CrossRef]
- Tomlinson, E.J.; Phillips, N.M.; Mohebbi, M.; Hutchinson, A.M. Risk Factors for Incident Delirium in an Acute General Medical Setting: A Retrospective Case–Control Study. J. Clin. Nurs. 2017, 26, 658–667. [Google Scholar] [CrossRef]
- Zhou, S.; Deng, F.; Zhang, J.; Chen, G. Incidence and Risk Factors for Postoperative Delirium after Liver Transplantation: A Systematic Review and Meta-Analysis. Eur. Rev. Med. Pharmacol. Sci. 2021, 25, 3246–3253. [Google Scholar] [CrossRef]
- Watt, J.; Tricco, A.C.; Talbot-Hamon, C.; Pham, B.; Rios, P.; Grudniewicz, A.; Wong, C.; Sinclair, D.; Straus, S.E. Identifying Older Adults at Risk of Delirium Following Elective Surgery: A Systematic Review and Meta-Analysis. J. Gen. Intern. Med. 2018, 33, 500–509. [Google Scholar] [CrossRef] [Green Version]
- Maldonado, J.R. Delirium in the Acute Care Setting: Characteristics, Diagnosis and Treatment. Crit. Care Clin. 2008, 24, 657–722. [Google Scholar] [CrossRef]
- Leslie, D.L.; Marcantonio, E.R.; Zhang, Y.; Leo-Summers, L.; Inouye, S.K. One-Year Health Care Costs Associated with Delirium in the Elderly Population. Arch. Intern. Med. 2008, 168, 27–32. [Google Scholar] [CrossRef] [Green Version]
- Fortini, A.; Morettini, A.; Tavernese, G.; Facchini, S.; Tofani, L.; Pazzi, M. Delirium in Elderly Patients Hospitalized in Internal Medicine Wards. Intern. Emerg. Med. 2014, 9, 435–441. [Google Scholar] [CrossRef]
- Morandi, A.; Di Santo, S.G.; Cherubini, A.; Mossello, E.; Meagher, D.; Mazzone, A.; Bianchetti, A.; Ferrara, N.; Ferrari, A.; Musicco, M.; et al. Clinical Features Associated with Delirium Motor Subtypes in Older Inpatients: Results of a Multicenter Study. Am. J. Geriatr. Psychiatry 2017, 25, 1064–1071. [Google Scholar] [CrossRef]
- Mossello, E.; Tesi, F.; Santo, S.G.D.; Mazzone, A.; Torrini, M.; Cherubini, A.; Bo, M.; Musicco, M.; Bianchetti, A.; Ferrari, A.; et al. Recognition of Delirium Features in Clinical Practice: Data from the “Delirium Day 2015” National Survey. J. Am. Geriatr. Soc. 2018, 66, 302–308. [Google Scholar] [CrossRef]
- Zuliani, G.; Bonetti, F.; Magon, S.; Prandini, S.; Sioulis, F.; D’Amato, M.; Zampi, E.; Gasperini, B.; Cherubini, A. Subsyndromal Delirium and Its Determinants in Elderly Patients Hospitalized for Acute Medical Illness. J. Gerontol. 2013, 68, 1296–1302. [Google Scholar] [CrossRef] [Green Version]
- Hargrave, A.; Bastiaens, J.; Bourgeois, J.A.; Neuhaus, J.; Josephson, S.A.; Chinn, J.; Lee, M.; Leung, J.; Douglas, V. Validation of a Nurse-Based Delirium-Screening Tool for Hospitalized Patients. Psychosomatics 2017, 58, 594–603. [Google Scholar] [CrossRef] [Green Version]
- Kean, J.; Ryan, K. Delirium Detection in Clinical Practice and Research: Critique of Current Tools and Suggestions for Future Development. J. Psychosom. Res. 2008, 65, 255–259. [Google Scholar] [CrossRef]
- Hshieh, T.T.; Yue, J.; Oh, E.; Puelle, M.; Dowal, S.; Travison, T.; Inouye, S.K. Effectiveness of Multi-Component Non-Pharmacologic Delirium Interventions: A Meta-Analysis. JAMA Intern. Med. 2015, 175, 512–520. [Google Scholar] [CrossRef]
- Wong, C.L.; Holroyd-Leduc, J.; Simel, D.L.; Straus, S.E. Does This Patient Have Delirium? Value of Bedside Instruments. JAMA 2010, 304, 779–786. [Google Scholar] [CrossRef] [PubMed]
- Van Velthuijsen, E.L.; Zwakhalen, S.M.G.; Warnier, R.M.J.; Mulder, W.J.; Verhey, F.R.J.; Kempen, G.I.J.M. Psychometric Properties and Feasibility of Instruments for the Detection of Delirium in Older Hospitalized Patients: A Systematic Review. Int. J. Geriatr. Psychiatry 2016, 31, 974–989. [Google Scholar] [CrossRef] [PubMed]
- Inouye, S.K.; Westendorp, R.G.J.; Saczynski, J.S. Delirium in Elderly People. Lancet 2014, 383, 911–922. [Google Scholar] [CrossRef] [Green Version]
- Bellelli, G.; Morandi, A.; Davis, D.H.J.; Mazzola, P.; Turco, R.; Gentile, S.; Ryan, T.; Cash, H.; Guerini, F.; Torpilliesi, T.; et al. Validation of the 4AT, a New Instrument for Rapid Delirium Screening: A Study in 234 Hospitalised Older People. Age Ageing 2014, 43, 496–502. [Google Scholar] [CrossRef] [Green Version]
- Racine, A.M.; Tommet, D.; D’Aquila, M.L.; Fong, T.G.; Gou, Y.; Tabloski, P.A.; Metzger, E.D.; Hshieh, T.T.; Schmitt, E.M.; Vasunilashorn, S.M.; et al. Machine Learning to Develop and Internally Validate a Predictive Model for Post-Operative Delirium in a Prospective, Observational Clinical Cohort Study of Older Surgical Patients. J. Gen. Intern. Med. 2021, 36, 265–273. [Google Scholar] [CrossRef]
- Corradi, J.P.; Thompson, S.; Mather, J.F.; Waszynski, C.M.; Dicks, R.S. Prediction of Incident Delirium Using a Random Forest Classifier. J. Med. Syst. 2018, 42, 261. [Google Scholar] [CrossRef]
- Netzer, M.; Hackl, W.O.; Schaller, M.; Alber, L.; Marksteiner, J.; Ammenwerth, E. Evaluating Performance and Interpretability of Machine Learning Methods for Predicting Delirium in Gerontopsychiatric Patients. Stud. Health Technol. Inform. 2020, 271, 121–128. [Google Scholar] [CrossRef]
- Ford, E.; Sheppard, J.; Oliver, S.; Rooney, P.; Banerjee, S.; Cassell, J.A. Automated Detection of Patients with Dementia Whose Symptoms Have Been Identified in Primary Care but Have No Formal Diagnosis: A Retrospective Case–Control Study Using Electronic Primary Care Records. BMJ Open 2021, 11, e039248. [Google Scholar] [CrossRef]
- Jauk, S.; Kramer, D.; Großauer, B.; Rienmüller, S.; Avian, A.; Berghold, A.; Leodolter, W.; Schulz, S. Risk Prediction of Delirium in Hospitalized Patients Using Machine Learning: An Implementation and Prospective Evaluation Study. J. Am. Med. Inform. Assoc. 2020, 27, 1383–1392. [Google Scholar] [CrossRef]
- Hendry, K.; Quinn, T.J.; Evans, J.; Scortichini, V.; Miller, H.; Burns, J.; Cunnington, A.; Stott, D.J. Evaluation of Delirium Screening Tools in Geriatric Medical Inpatients: A Diagnostic Test Accuracy Study. Age Ageing 2016, 45, 832–837. [Google Scholar] [CrossRef] [Green Version]
- O’Sullivan, D.; Brady, N.; Manning, E.; O’Shea, E.; O’Grady, S.; O’Regan, N.; Timmons, S. Validation of the 6-Item Cognitive Impairment Test and the 4AT Test for Combined Delirium and Dementia Screening in Older Emergency Department Attendees. Age Ageing 2018, 47, 61–68. [Google Scholar] [CrossRef] [Green Version]
- Gagné, A.-J.; Voyer, P.; Boucher, V.; Nadeau, A.; Carmichael, P.-H.; Pelletier, M.; Gouin, E.; Berthelot, S.; Daoust, R.; Wilchesky, M.; et al. Performance of the French Version of the 4AT for Screening the Elderly for Delirium in the Emergency Department. Can. J. Emerg. Med. 2018, 20, 903–910. [Google Scholar] [CrossRef]
- Kuladee, S.; Prachason, T. Development and Validation of the Thai Version of the 4 ‘A’s Test for Delirium Screening in Hospitalized Elderly Patients with Acute Medical Illnesses. Neuropsychiatr. Dis. Treat. 2016, 12, 437–443. [Google Scholar] [CrossRef] [Green Version]
- Baird, L.; Spiller, J.A. A Quality Improvement Approach to Cognitive Assessment on Hospice Admission: Could We Use the 4AT or Short CAM? BMJ Open Qual. 2017, 6, e000153. [Google Scholar] [CrossRef] [Green Version]
- Infante, M.T.; Pardini, M.; Balestrino, M.; Finocchi, C.; Malfatto, L.; Bellelli, G.; Mancardi, G.L.; Gandolfo, C.; Serrati, C. Delirium in the Acute Phase after Stroke: Comparison between Methods of Detection. Neurol. Sci. 2017, 38, 1101–1104. [Google Scholar] [CrossRef]
- Lees, R.; Corbet, S.; Johnston, C.; Moffitt, E.; Shaw, G.; Quinn, T.J. Test Accuracy of Short Screening Tests for Diagnosis of Delirium or Cognitive Impairment in an Acute Stroke Unit Setting. Stroke 2013, 44, 3078–3083. [Google Scholar] [CrossRef] [Green Version]
- De, J.; Wand, A.P.F.; Smerdely, P.I.; Hunt, G.E. Validating the 4A’s Test in Screening for Delirium in a Culturally Diverse Geriatric Inpatient Population. Int. J. Geriatr. Psychiatry 2017, 32, 1322–1329. [Google Scholar] [CrossRef]
- Benjamini, Y.; Hochberg, Y. Controlling the False Discovery Rate: A Practical and Powerful Approach to Multiple Testing. J. R. Stat. Soc. Ser. B Methodol. 1995, 57, 289–300. [Google Scholar] [CrossRef]
- Kish, L. Survey Sampling. Am. Polit. Sci. Rev. 1965, 59, 1025. [Google Scholar] [CrossRef]
- Long, J.S.; Ervin, L.H. Using Heteroscedasticity Consistent Standard Errors in the Linear Regression Model. Am. Stat. 2000, 54, 217–224. [Google Scholar]
- Friedman, J.; Hastie, T.; Tibshirani, R. The Elements of Statistical Learning; Springer Series in Statistics; Springer: New York, NY, USA, 2001; Volume 1. [Google Scholar]
- Breiman, L. Random Forests. Mach. Learn. 2001, 45, 5–32. [Google Scholar] [CrossRef] [Green Version]
- Karpievitch, Y.V.; Hill, E.G.; Leclerc, A.P.; Dabney, A.R.; Almeida, J.S. An Introspective Comparison of Random Forest-Based Classifiers for the Analysis of Cluster-Correlated Data by Way of RF++. PLoS ONE 2009, 4, e7087. [Google Scholar] [CrossRef] [Green Version]
- Ishwaran, H. Variable Importance in Binary Regression Trees and Forests. Electron. J. Stat. 2007, 1, 519–537. [Google Scholar] [CrossRef]
- Friedman, J.H. Greedy Function Approximation: A Gradient Boosting Machine. Ann. Stat. 2001, 29, 1189–1232. [Google Scholar] [CrossRef]
- R Core Team. R: A Language and Environment for Statistical Computing; R Foundation for Statistical Computing: Vienna, Austria, 2015. [Google Scholar]
- Ishwaran, H.; Kogalur, U.B.; Kogalur, M.U.B. Package ‘RandomForestSRC’, R package version 2; 2019. Available online: http://cran.stat.upd.edu.ph/web/packages/randomForestSRC/randomForestSRC.pdf (accessed on 19 July 2019).
- Siddiqi, N.; Holt, R.; Britton, A.M.; Holmes, J. Interventions for Preventing Delirium in Hospitalised Patients. Cochrane Database Syst. Rev. 2007. [Google Scholar] [CrossRef]
- Landreville, P.; Voyer, P.; Carmichael, P.-H. Relationship between Delirium and Behavioral Symptoms of Dementia. Int. Psychogeriatr. 2013, 25, 635–643. [Google Scholar] [CrossRef]
- Smith, T.O.; Cooper, A.; Peryer, G.; Griffiths, R.; Fox, C.; Cross, J. Factors Predicting Incidence of Post-Operative Delirium in Older People Following Hip Fracture Surgery: A Systematic Review and Meta-Analysis: Predictors of Delirium Post-Hip Fracture Surgery. Int. J. Geriatr. Psychiatry 2017, 32, 386–396. [Google Scholar] [CrossRef] [Green Version]
- Gehrke, S.; Bode, L.; Seiler, A.; Ernst, J.; von Känel, R.; Boettger, S. The Prevalence Rates and Sequelae of Delirium at Age Older than 90 Years. Palliat. Support. Care 2020, 1–6. [Google Scholar] [CrossRef]
- Peralta-Cuervo, A.F.; Garcia-Cifuentes, E.; Castellanos-Perilla, N.; Chavarro-Carvajal, D.A.; Venegas-Sanabria, L.C.; Cano-Gutiérrez, C.A. Delirium Prevalence in a Colombian Hospital, Association with Geriatric Syndromes and Complications during Hospitalization. Rev. Espanola Geriatr. Gerontol. 2021, 56, 69–74. [Google Scholar] [CrossRef]
- van Meenen, L.C.C.; van Meenen, D.M.P.; de Rooij, S.E.; ter Riet, G. Risk Prediction Models for Postoperative Delirium: A Systematic Review and Meta-Analysis. J. Am. Geriatr. Soc. 2014, 62, 2383–2390. [Google Scholar] [CrossRef]
- Kim, M.; Park, U.; Kim, H.; Cho, W. DELirium Prediction Based on Hospital Information (Delphi) in General Surgery Patients. Medicine 2016, 95, e3072. [Google Scholar] [CrossRef] [PubMed]
- Davoudi, A.; Ebadi, A.; Rashidi, P.; Ozrazgat-Baslanti, T.; Bihorac, A.; Bursian, A.C. Delirium Prediction Using Machine Learning Models on Preoperative Electronic Health Records Data. In Proceedings of the 2017 IEEE 17th International Conference on Bioinformatics and Bioengineering (BIBE), Washington, DC, USA, 23–25 October 2017; pp. 568–573. [Google Scholar] [CrossRef]
- Wong, A.; Young, A.T.; Liang, A.S.; Gonzales, R.; Douglas, V.C.; Hadley, D. Development and Validation of an Electronic Health Record-Based Machine Learning Model to Estimate Delirium Risk in Newly Hospitalized Patients without Known Cognitive Impairment. JAMA Netw. Open 2018, 1, e181018. [Google Scholar] [CrossRef] [PubMed] [Green Version]
- Veeranki, S.; Hayn, D.; Eggerth, A.; Jauk, S.; Kramer, D.; Leodolter, W.; Schreier, G. On the Representation of Machine Learning Results for Delirium Prediction in a Hospital Information System in Routine Care. Stud. Health Technol. Inform. 2018, 251, 97–100. [Google Scholar] [PubMed]
- Veeranki, S.P.K.; Hayn, D.; Kramer, D.; Jauk, S.; Schreier, G. Effect of Nursing Assessment on Predictive Delirium Models in Hospitalised Patients. Stud. Health Technol. Inform. 2018, 248, 124–131. [Google Scholar]
- Fan, H.; Ji, M.; Huang, J.; Yue, P.; Yang, X.; Wang, C.; Ying, W. Development and Validation of a Dynamic Delirium Prediction Rule in Patients Admitted to the Intensive Care Units (DYNAMIC-ICU): A Prospective Cohort Study. Int. J. Nurs. Stud. 2019, 93, 64–73. [Google Scholar] [CrossRef]
- Ocagli, H.; Azzolina, D.; Soltanmohammadi, R.; Aliyari, R.; Bottigliengo, D.; Acar, A.S.; Stivanello, L.; Degan, M.; Baldi, I.; Lorenzoni, G.; et al. Profiling Delirium Progression in Elderly Patients via Continuous-Time Markov Multi-State Transition Models. J. Pers. Med. 2021, 11, 445. [Google Scholar] [CrossRef]
- Oh, J.; Cho, D.; Park, J.; Na, S.H.; Kim, J.; Heo, J.; Shin, C.S.; Kim, J.-J.; Park, J.Y.; Lee, B. Prediction and Early Detection of Delirium in the Intensive Care Unit by Using Heart Rate Variability and Machine Learning. Physiol. Meas. 2018, 39, 035004. [Google Scholar] [CrossRef]


| Variable | Variable Level | n | Delirium or Severe Cognitive Impairment Unlikely | Possible Cognitive Impairment | Possible Delirium +/− Cognitive Impairment | Overall | p-Value | Unadjusted Pairwise p-Value | Adjusted Pairwise p-Value | ||||
|---|---|---|---|---|---|---|---|---|---|---|---|---|---|
| PCI vs. D/CI | PCI vs. PD | D/CI vs. PD | PCI vs. D/CI | PCI vs. PD | D/CI vs. PD | ||||||||
| (n = 31) | (n = 28) | (n = 18) | (n = 77) * | ||||||||||
| Ward | Medicine | 78 | 16 (52%) | 5 (18%) | 3 (17%) | 24 (31%) | <0.001 | 0.235 | <0.001 | 0.004 | 0.235 | 0.003 | 0.006 |
| Geriatric | 1 (3%) | 16 (57%) | 7 (39%) | 24 (31%) | |||||||||
| Orthopedic | 14 (45%) | 7 (25%) | 8 (44%) | 29 (38%) | |||||||||
| Gender | Male | 78 | 12 (39%) | 8 (29%) | 6 (33%) | 26 (34%) | 0.71 | 0.746 | 0.161 | 0.305 | 0.746 | 0.4575 | 0.4575 |
| ICD diagnosis | Circulatory system | 35 | 0 (0%) | 1 (10%) | 0 (0%) | 1 (3%) | 0.17 | 0.259 | 0.135 | 0.32 | 0.32 | 0.32 | 0.32 |
| Musculoskeletal system | 14 (93%) | 7 (70%) | 8 (89%) | 29 (85%) | |||||||||
| Digestive system | 0 (0%) | 0 (0%) | 1 (11%) | 1 (3%) | |||||||||
| Respiratory | 1 (7%) | 0 (0%) | 0 (0%) | 1 (3%) | |||||||||
| Undefined | 0 (0%) | 2 (20%) | 0 (0%) | 2 (6%) | |||||||||
| Educational level | Bachelor’s degree | 78 | 2 (6%) | 0 (0%) | 1 (6%) | 3 (4%) | 0.24 | 0.533 | 0.044 | 0.262 | 0.533 | 0.132 | 0.393 |
| None | 0 (0%) | 5 (18%) | 2 (11%) | 7 (9%) | |||||||||
| Missing | 1 (3%) | 0 (0%) | 0 (0%) | 48 (63%) | |||||||||
| Primary school | 23 (74%) | 14 (50%) | 11(61%) | 13 (17%) | |||||||||
| Secondary school | 4 (13%) | 7 (24%) | 2 (11%) | 5 (7%) | |||||||||
| High school | 1 (3%) | 2 (7%) | 2 (11%) | 18 (23%) | |||||||||
| Dementia | 78 | 2 (6%) | 8 (29%) | 8 (44%) | 1 (1%) | 0.007 | 0.181 | 0.028 | 0.001 | 0.181 | 0.042 | 0.003 | |
| Alcohol use | 78 | 1 (3%) | 0 (0%) | 0 (0%) | 5 (6%) | 0.47 | 0.329 | 0.454 | 0.454 | 0.454 | |||
| Depression | 78 | 2 (6%) | 3 (11%) | 0 (0%) | 16 (21%) | 0.35 | 0.17 | 0.586 | 0.285 | 0.4275 | 0.586 | 0.4275 | |
| Diabetes | 78 | 7 (23%) | 4 (14%) | 5 (28%) | 29 (38%) | 0.52 | 0.197 | 0.379 | 0.601 | 0.5685 | 0.5685 | 0.601 | |
| Cancer | 78 | 10 (32%) | 11 (39%) | 8 (44%) | 71 (92%) | 0.68 | 0.544 | 0.645 | 0.311 | 0.645 | 0.645 | 0.645 | |
| Previous hospital admission | 78 | 27 (87%) | 27 (96%) | 17 (94%) | 29 (38%) | 0.38 | 0.696 | 0.185 | 0.446 | 0.696 | 0.555 | 0.669 | |
| Visual impairment | 78 | 13 (42%) | 7 (25%) | 9 (50%) | 29 (38%) | 0.19 | 0.048 | 0.144 | 0.464 | 0.144 | 0.216 | 0.464 | |
| Hearing impairment | 78 | 8 (26%) | 10 (36%) | 11 (61%) | 14 (18%) | 0.047 | 0.17 | 0.313 | 0.024 | 0.255 | 0.313 | 0.072 | |
| Antibiotics | >1 | 78 | 6 (19%) | 8 (28%) | 0 (0%) | 5 (6%) | 0.071 | 0.02 | 0.45 | 0.05 | 0.05 | 0.45 | 0.08 |
| age (classes) | <70 | 78 | 4 (13%) | 1 (4%) | 0 (0%) | 3 (4%) | 0.035 | 0.108 | 0.127 | 0.039 | 0.127 | 0.127 | 0.117 |
| >95 | 1 (3%) | 0 (0%) | 2 (11%) | 5 (6%) | |||||||||
| 71–75 | 3 (10%) | 0 (0%) | 2 (11%) | 11 (14%) | |||||||||
| 76–80 | 6 (19%) | 4 (14%) | 1 (6%) | 19 (25%) | |||||||||
| 81–85 | 8 (26%) | 8 (29%) | 3 (17%) | 21 (27%) | |||||||||
| 86–90 | 8 (26%) | 10 (36%) | 3 (17%) | 13 (17%) | |||||||||
| 91–95 | 1 (3%) | 5 (18%) | 7 (39%) | ||||||||||
| Variable | 4AT Score | |
|---|---|---|
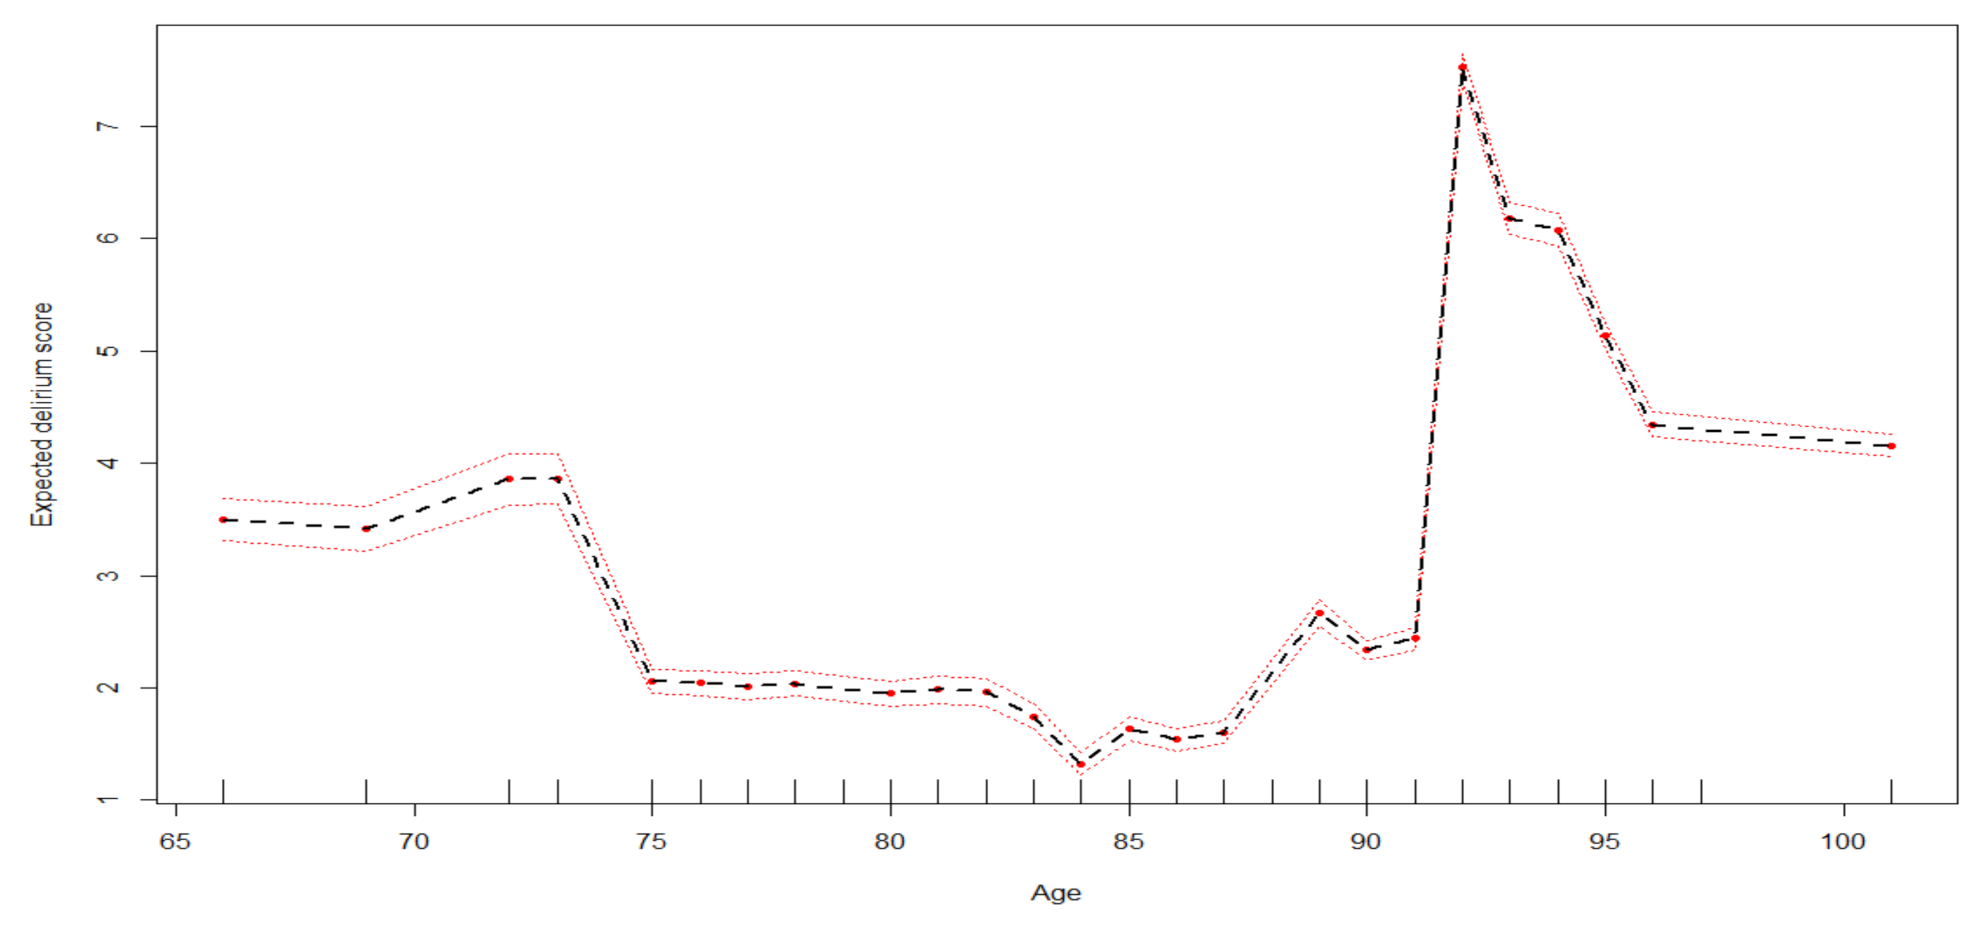
| Age | 78 | 2.09 [1.97–2.2] |
| 84 | 1.35 [1.25–1.44] | |
| 87 | 1.58 [1.49–1.68] | |
| 91 | 2.59 [2.5–2.68] | |
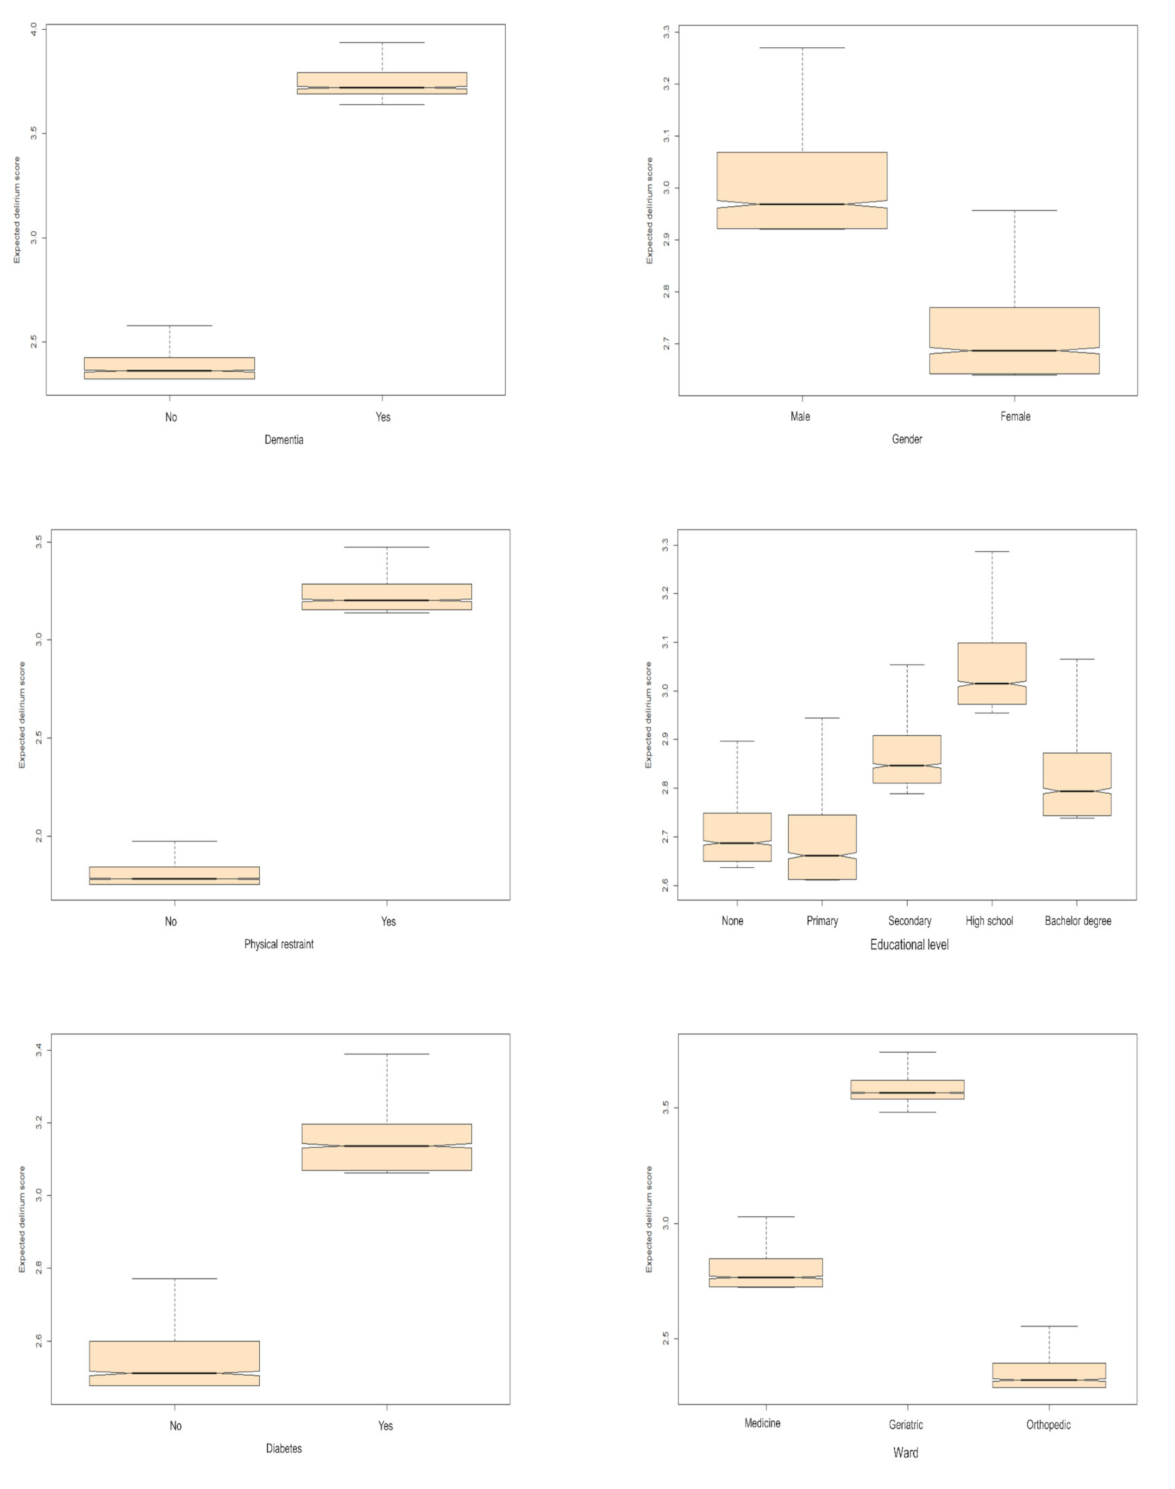
| Dementia | No | 2.36 [2.32–2.42] |
| Yes | 3.72 [3.69–3.79] | |
| Gender | Female | 2.69 [2.64–2.77] |
| Male | 2.97 [2.92–3.07] | |
| Physical restraint | No | 1.78 [1.75–1.84] |
| Yes | 3.2 [3.15–3.28] | |
| Educational level | Bachelor’s degree | 2.79 [2.74–2.87] |
| None | 2.69 [2.65–2.75] | |
| Primary school | 2.66 [2.61–2.74] | |
| Secondary school | 2.85 [2.81–2.91] | |
| High school | 3.01 [2.97–3.1] | |
| Diabetes | No | 2.51 [2.48–2.6] |
| Yes | 3.14 [3.07–3.2] | |
| Ward | Medicine | 2.77 [2.73–2.85] |
| Geriatric | 3.57 [3.54–3.62] | |
| Orthopedic | 2.32 [2.29–2.4] | |
| Cancer | No | 2.78 [2.73–2.86] |
| Yes | 2.78 [2.73–2.86] | |
| Antibiotics | <1 | 2.53 [2.49–2.61] |
| ≥1 | 2.87 [2.82–2.95] | |
| Previous hospital admission | No | 2.73 [2.69–2.82] |
| Yes | 2.71 [2.67–2.8] | |
| Alcohol, drugs and psychiatric disease | <1 | 2.72 [2.68–2.82] |
| ≥1 | 2.8 [2.76–2.89] | |
Publisher’s Note: MDPI stays neutral with regard to jurisdictional claims in published maps and institutional affiliations. |
© 2021 by the authors. Licensee MDPI, Basel, Switzerland. This article is an open access article distributed under the terms and conditions of the Creative Commons Attribution (CC BY) license (https://creativecommons.org/licenses/by/4.0/).
Share and Cite
Ocagli, H.; Bottigliengo, D.; Lorenzoni, G.; Azzolina, D.; Acar, A.S.; Sorgato, S.; Stivanello, L.; Degan, M.; Gregori, D. A Machine Learning Approach for Investigating Delirium as a Multifactorial Syndrome. Int. J. Environ. Res. Public Health 2021, 18, 7105. https://doi.org/10.3390/ijerph18137105
Ocagli H, Bottigliengo D, Lorenzoni G, Azzolina D, Acar AS, Sorgato S, Stivanello L, Degan M, Gregori D. A Machine Learning Approach for Investigating Delirium as a Multifactorial Syndrome. International Journal of Environmental Research and Public Health. 2021; 18(13):7105. https://doi.org/10.3390/ijerph18137105
Chicago/Turabian StyleOcagli, Honoria, Daniele Bottigliengo, Giulia Lorenzoni, Danila Azzolina, Aslihan S. Acar, Silvia Sorgato, Lucia Stivanello, Mario Degan, and Dario Gregori. 2021. "A Machine Learning Approach for Investigating Delirium as a Multifactorial Syndrome" International Journal of Environmental Research and Public Health 18, no. 13: 7105. https://doi.org/10.3390/ijerph18137105
APA StyleOcagli, H., Bottigliengo, D., Lorenzoni, G., Azzolina, D., Acar, A. S., Sorgato, S., Stivanello, L., Degan, M., & Gregori, D. (2021). A Machine Learning Approach for Investigating Delirium as a Multifactorial Syndrome. International Journal of Environmental Research and Public Health, 18(13), 7105. https://doi.org/10.3390/ijerph18137105