Assessment of the Frequency of Sweetened Beverages Consumption among Adults in Poland
Abstract
1. Introduction
2. Materials and Methods
3. Results
3.1. Characteristics of the Respondents
3.2. Consumption Results
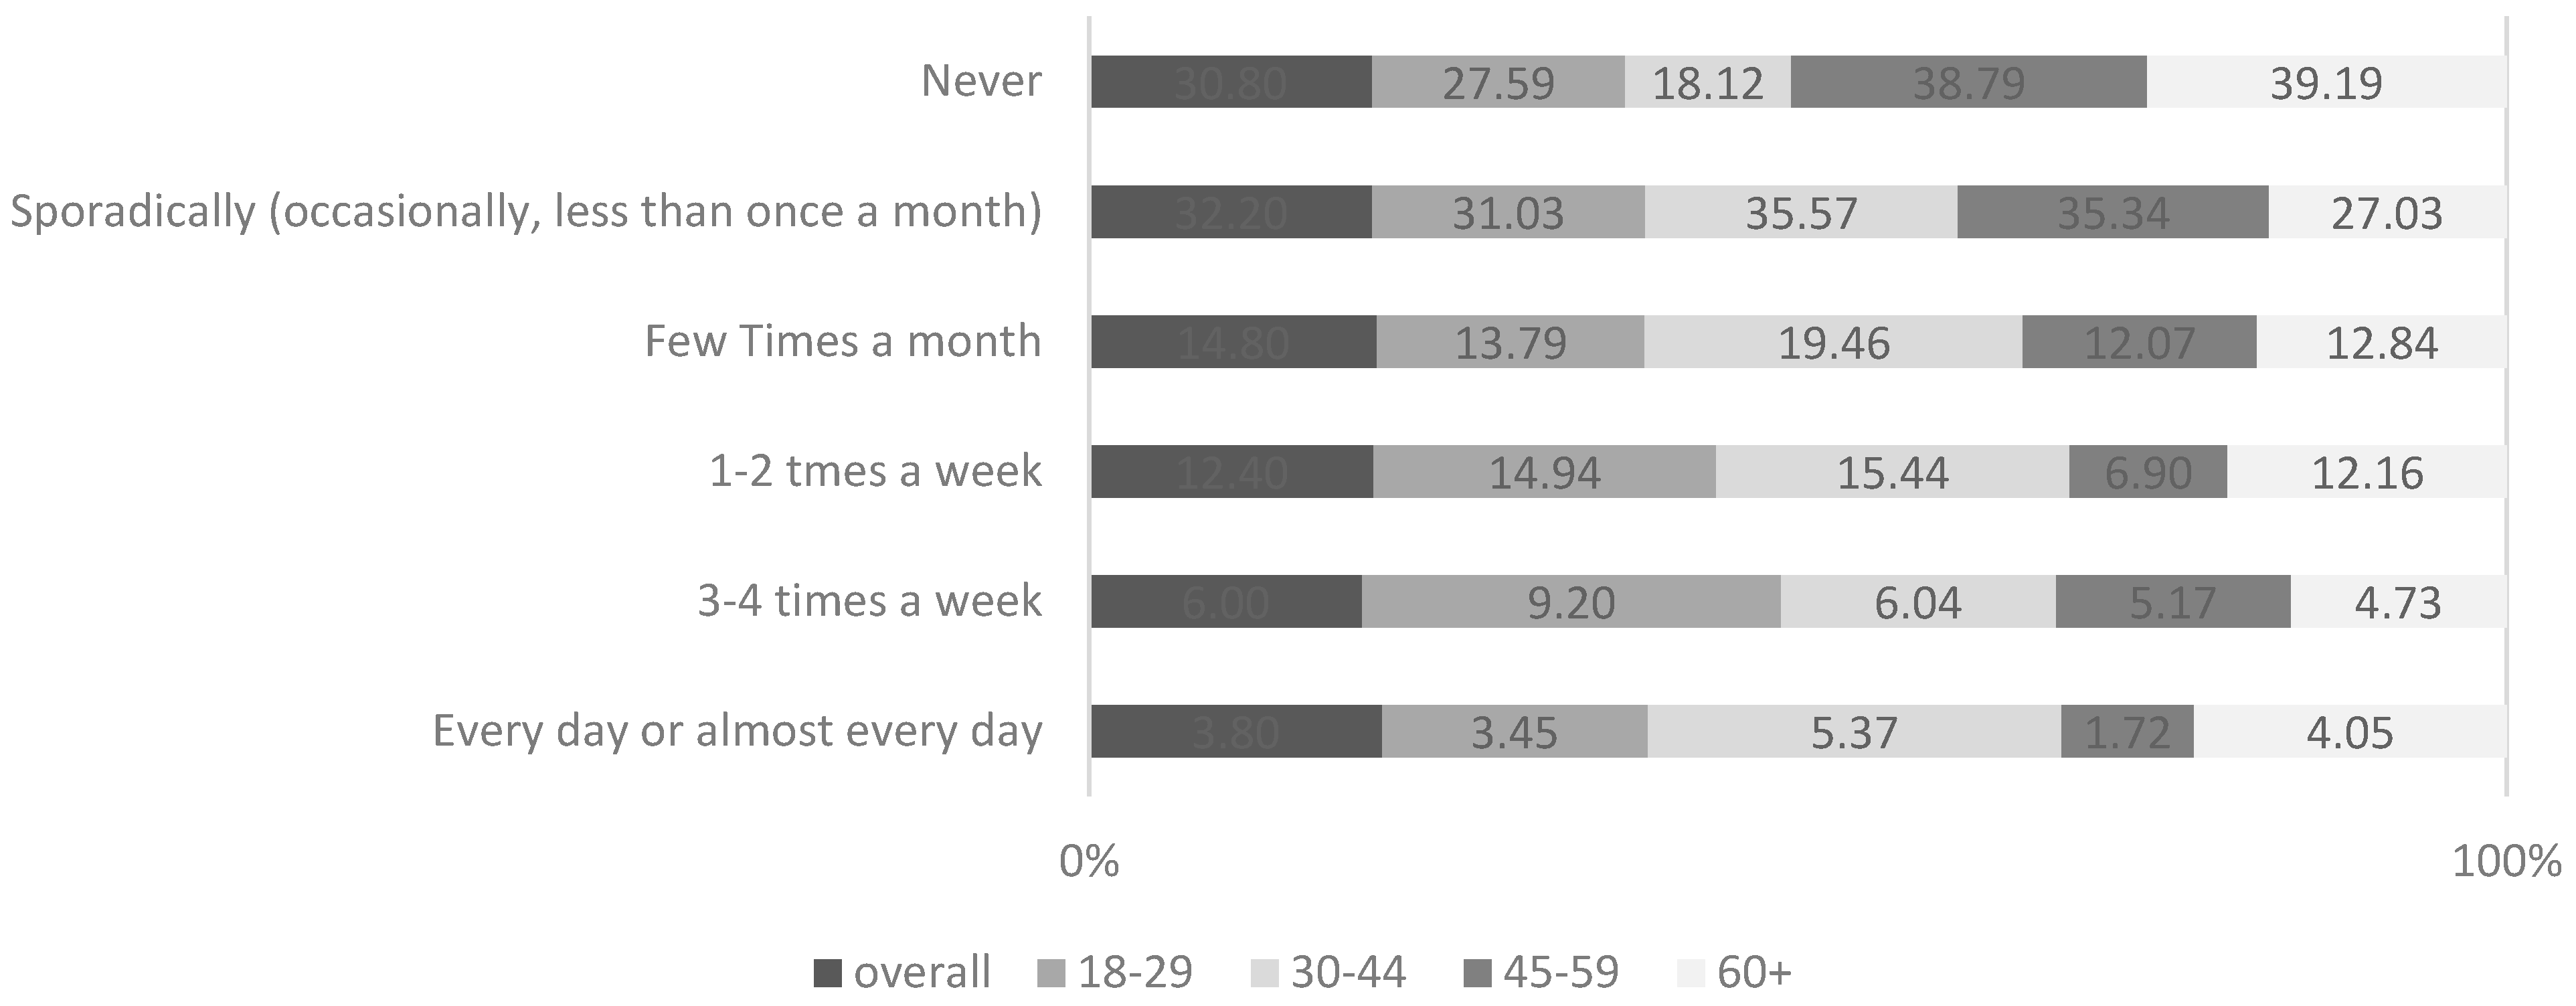
- in the 45–59 age range as well as in the oldest age group, isotonic drinks are consumed relatively rarely 48.3% and 39.9% of the respondents, respectively, declared that they never drink such beverages;
- the highest percentage of people who regularly consume such beverages (minimum once a week) can be observed in the 30–44 (23.4%) and 18–29 (16.0%) age groups.
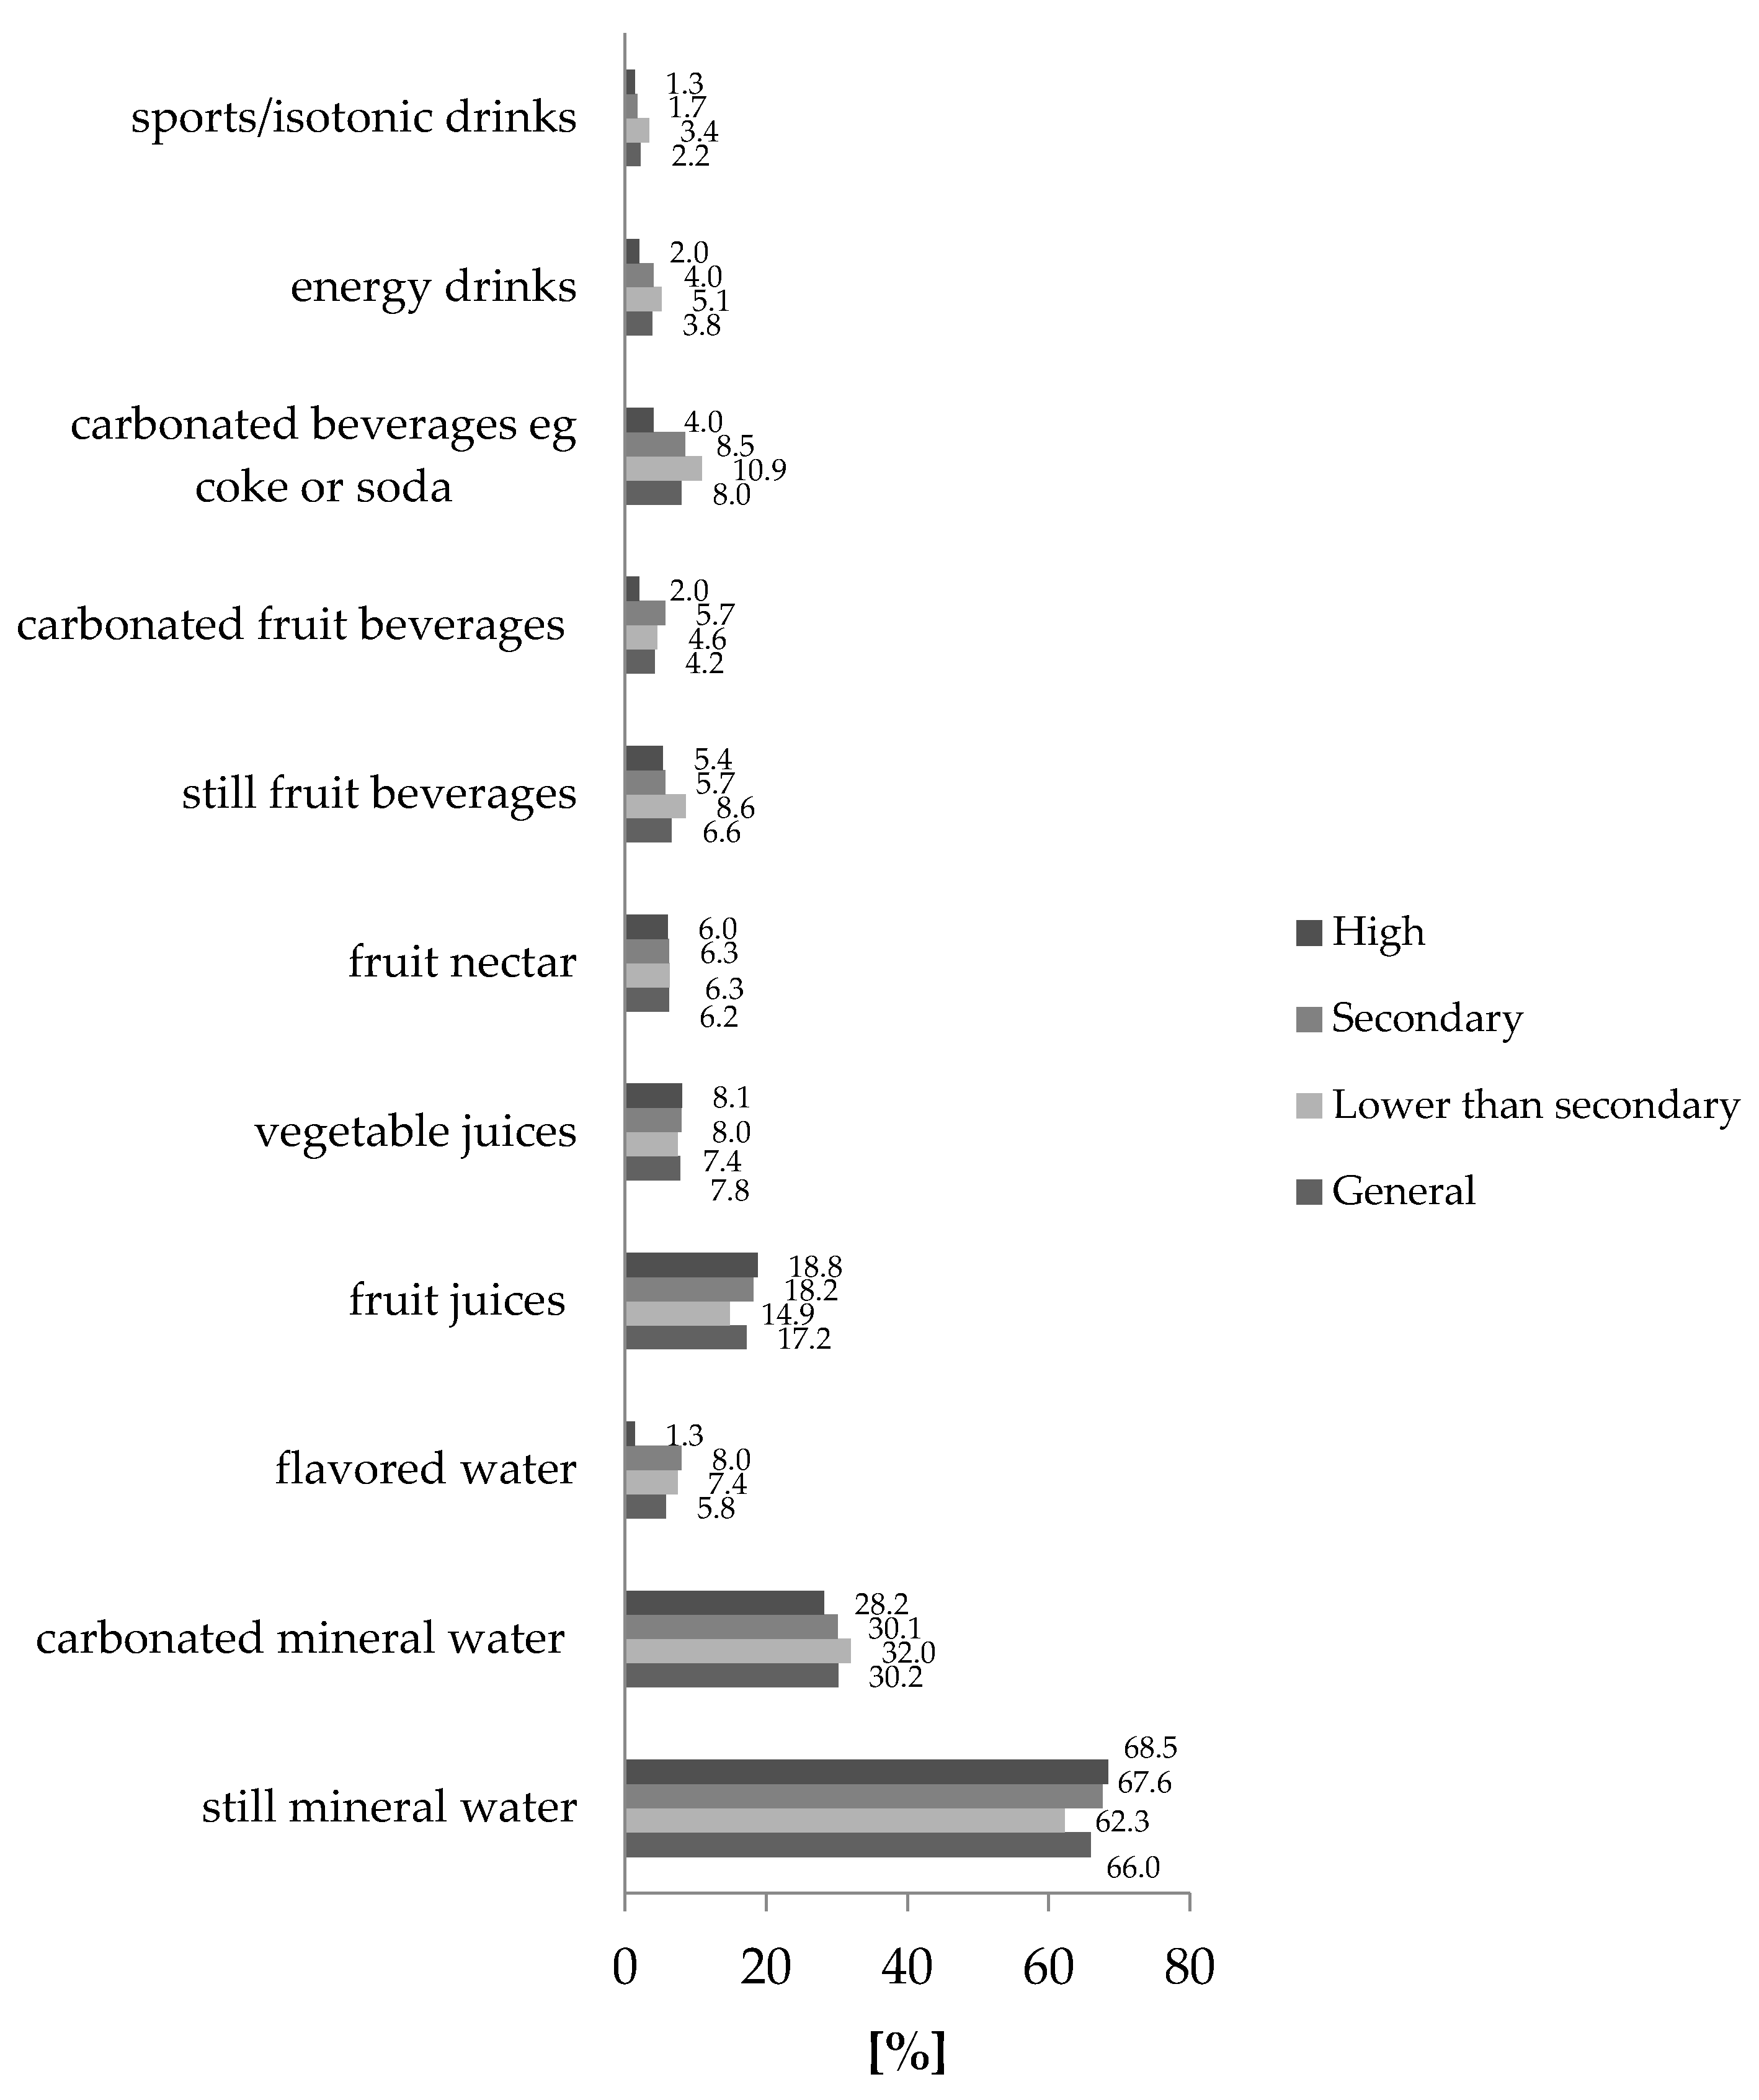
- still, fruit drinks– beverages of such type were consumed more frequently by respondents with lower secondary or secondary education (8.8%);
- carbonated, fruit drinks–most consumed by respondents with secondary (5.7%) and lower secondary education (4.6%). Consumers with higher education drink such beverages less frequently (2.0%);
- flavored waters, energy, and isotonic drinks, the statistical significance was confirmed by means of analyzing the education structure of the respondents using the chi-square independence test (Table 2). However, Figure 2 as well as Table 2 shows small differences resulting from differences in the level of education. Consumers with higher education drink flavored water significantly less frequently—in the case of comparing their everyday consumption, only 1.3% of the consumers with higher education declared that they drink them every day. For comparison, in the case of consumers who completed secondary education, the percentage was 8.0%, and with lower than education it amounted to 7.2%. Energy drinks are consumed more frequently by people with lower than secondary education (5.1% of the respondents) and decidedly less often by people with higher education (2.1% of the respondents). Analogically, the dependence was observed in the case of isotonic drinks. People with higher education drink such beverages less frequently (1.3%) than people with lower than secondary education (3.4%).
4. Discussion
5. Conclusions
Supplementary Materials
Author Contributions
Funding
Institutional Review Board Statement
Informed Consent Statement
Data Availability Statement
Acknowledgments
Conflicts of Interest
References
- International Sugar Organization. The Sugar Market Production. 2018. Available online: https://www.isosugar.org/sugarsector/sugar (accessed on 8 January 2021).
- OECD; Food Agriculture Organization of the United Nations. Chapter 5. Sugar. In OECD-FAO Agricultural Outlook 2019–2028; OECD Publishing: Rome, Italy, 2019; pp. 154–165. [Google Scholar]
- The Sugar Association. Sugar Uses. 2020. Available online: https://www.sugar.org/sugar/uses/ (accessed on 9 January 2020).
- Goldfein, K.R.; Slavin, J.L. Why Sugar Is Added to Food: Food Science 101. Compr. Rev. Food Sci. Food Saf. 2015, 14, 644–656. [Google Scholar] [CrossRef]
- U.S. Department of Health and Human Services; U.S. Department of Agriculture. 2015–2020 Dietary Guidelines for Americans, 8th ed.; Washington, DC, USA, 2015. Available online: http://health.gov/dietaryguidelines/2015/guidelines/ (accessed on 9 January 2020).
- Caballero, B. Focus on sugar-sweetened beverages. Public Health Nutr. 2015, 18, 1143–1144. [Google Scholar] [CrossRef]
- Kobylewski, S.; Jacobson, M.F. Toxicology of food dyes. Int. J. Occup. Environ. Health 2012, 18, 220–246. [Google Scholar] [CrossRef] [PubMed]
- Reilly, J.J.; Methven, E.; McDowell, Z.C.; Hacking, B.; Alexander, D.; Stewart, L.; Kelnar, C.J.H. Health consequences of obesity. Arch. Dis. Child. 2003, 88, 748–752. [Google Scholar] [CrossRef] [PubMed]
- Reilly, J.J. Descriptive epidemiology and health consequences of childhood obesity. Best Pract. Res. Clin. Endocrinol. Metab. 2005, 19, 327–341. [Google Scholar] [CrossRef] [PubMed]
- Winston, G.J.; Caesar-Phillips, E.; Peterson, J.C.; Wells, M.T.; Martinez, J.; Chen, X.; Boutin-Foster, C.; Charlson, M. Knowledge of the health consequences of obesity among overweight/obese Black and Hispanic adults. Patient Educ. Couns. 2014, 94, 123–127. [Google Scholar] [CrossRef] [PubMed][Green Version]
- Amarya, S.; Singh, K.; Sabharwal, M. Health consequences of obesity in the elderly. J. Clin. Gerontol. Geriatr. 2014, 5, 63–67. [Google Scholar] [CrossRef]
- Poznańska, A.; Rabczenko, D.; Wojtyniak, B. Selected Lifestyle-Related Health Risk Factors. In Health Status of Polish Population and Its Determinants 2020; Wojtyniak, B., Goryński, P., Eds.; National Institute of Public Health-National Institute of Hygiene: Warsaw, Poland, 2020; pp. 482–506. [Google Scholar]
- Juruć, A.; Bogdański, P. Obesity—What’s next? Psychological consequences of excesive body weight. Metab. Disord. Forum 2010, 1, 210–219. [Google Scholar]
- Budzyński, A.; Major, P.; Głuszek, S.; Kaseja, K.; Koszutski, T.; Leśniak, S.; Lewandowski, T.; Lipka, M.; Lisik, W.; Makarewicz, W.; et al. Polish recommendations in the field of bariatric and metabolic surgery. Pract. Med. Surg. 2016, 6, 13–25. [Google Scholar]
- Springer, M.; Zaporowska-Stachowiak, I.; Hoffmann, K.; Markuszewski, L.; Bryl, W. Obesity—An expensive disease. Hygeia Public Health 2019, 54, 88–91. [Google Scholar]
- Caby, D. Obesite: Quelles Consequences Pour L’economie et Comment les Limiter? Tech. Rep. Tresor. 2016, 179. Available online: http://www.cres-paca.org/arkotheque/client/crespaca/thematiques/detail_document.php?ref=2638&titre=obesite-quelles-consequences-pour-l-economie-et-comment-les-limiter-&from=themes (accessed on 9 January 2020).
- Tierney, M.; Gallagher, A.M.; Giotis, E.S.; Pentieva, K. An online survey on consumer knowledge and understanding of added sugars. Nutrients 2017, 9, 37. [Google Scholar] [CrossRef] [PubMed]
- Vinke, P.C.; Blijleven, K.A.; Luitjens, M.H.H.S.; Corpeleijn, E. Young Children’s Sugar-Sweetened Beverage Consumption and 5-Year Change in BMI: Lessons Learned from the Timing of Consumption. Nutrients 2020, 12, 2486. [Google Scholar] [CrossRef] [PubMed]
- Van De Gaar, V.M.; Van Grieken, A.; Jansen, W.; Raat, H. Children’ s sugar-sweetened beverages consumption: Associations with family and home-related factors, differences within ethnic groups explored. BMC Public Health 2017, 17, 195. [Google Scholar] [CrossRef]
- Hamilton, L.K.; Wills, W.J. Patterns of sugar-sweetened beverage consumption amongst young people aged 13–15 years during the school day in Scotland. Appetite 2017, 116, 196–204. [Google Scholar] [CrossRef]
- Keller, A.; Della Torre, S.B. Sugar-Sweetened Beverages and Obesity among Children and Adolescents: A Review of Systematic Literature Reviews. Child. Obes. 2015, 11, 338–346. [Google Scholar] [CrossRef]
- Dereń, K.; Weghuber, D.; Caroli, M.; Koletzko, B.; Thivel, D.; Frelut, M.-L.; Socha, P.; Grossman, Z.; Hadjipanayis, A.; Wyszyńska, J.; et al. Consumption of Sugar-Sweetened Beverages in Paediatric Age: A Position Paper of the European Academy of Paediatrics and the European Childhood Obesity Group. Ann. Nutr. Metab. 2019, 74, 296–302. [Google Scholar] [CrossRef]
- Beck, A.L.; Tschann, J.; Butte, N.F.; Penilla, C.; Greenspan, L.C. Association of beverage consumption with obesity in Mexican American children. Public Health Nutr. 2014, 17, 338–344. [Google Scholar] [CrossRef]
- Hu, F.B. Pro v Con Debate: Role of sugar sweetened beverages in obesity Resolved: There is sufficient scientific evidence that decreasing sugar-sweetened beverage consumption will reduce the prevalence of obesity and obesity-related diseases. Obes. Rev. 2013, 14, 606–619. [Google Scholar] [CrossRef]
- Hu, F.B.; Malik, V.S. Sugar-sweetened beverages and risk of obesity and type 2 diabetes: Epidemiologic evidence. Physiol. Behav. 2010, 100, 47–54. [Google Scholar] [CrossRef]
- Visioli, F.; Poli, A. Heart Health and Diet. J. Am. Diet. Assoc. 2008, 108, 34. [Google Scholar] [CrossRef] [PubMed]
- Austys, D.; Stukas, R.; Dobrovolskij, V.; Arlauskas, R. Differences in consumption of sugar and sweeteners in two neighbor countries: Lithuania and Poland. Eur. J. Public Health 2020, 30 (Suppl. 5), 558–559. [Google Scholar] [CrossRef]
- Park, S.; Lundeen, E.A.; Pan, L.; Blanck, H.M. Impact of Knowledge of Health Conditions on Sugar-Sweetened Beverage Intake Varies Among US Adults. Am. J. Health. Promot. 2017, 32, 1402–1408. [Google Scholar] [CrossRef]
- Bonnet, C.; Réquillart, V. The Effects of Taxation on the Individual Consumption of Sugar-Sweetened Beverages. TSE Work. Pap.. 2018, Volume 638, pp. 1–42. Available online: https://www.tse-fr.eu/sites/default/files/TSE/documents/doc/wp/2016/wp_tse_638.pdf (accessed on 30 June 2021).
- Agostoni, C.; Bresson, J.-L.; Fairweather-Tait, S.; Flynn, A.; Golly, I.; Korhonen, H.; Lagiou, P.; Løvik, M.; Marchelli, R.; Martin, A.; et al. Scientific Opinion on Dietary Reference Values for water. EFSA J. 2010, 8, 1–48. [Google Scholar] [CrossRef]
- Kuczmarski, M.F.; Mason, M.A.; Schwenk, E.A.; Evans, M.K.; Zonderman, A.B. Beverage Consumption Patterns of a Low-Income Population. Top. Clin. Nutr. 2010, 25, 191–201. [Google Scholar] [CrossRef]
- Denova-Gutiérrez, E.; Talavera, J.O.; Huitrón-Bravo, G.; Méndez-Hernández, P.; Salmerón, J. Sweetened beverage consumption and increased risk of metabolic syndrome in Mexican adults. Public Health Nutr. 2010, 13, 835–842. [Google Scholar] [CrossRef] [PubMed]
- Kim, K.B.; Shin, Y.-A. Males with Obesity and Overweight. J. Obes. Metab. Syndr. 2020, 29, 18–25. [Google Scholar] [CrossRef] [PubMed]
- Cárdeas, J.K.; Olivares, J.M.; Adoamnei, E.; Arense-Gonzalo, J.J.; Cantero, A.M.T. Sugar-sweetened beverage intake in relation to reproductive parameters in young men. Eur. J. Public Health 2020, 30 (Suppl. 5). [Google Scholar] [CrossRef]
- Özen, A.E.; Bibiloni, M.D.M.; Bouzas, C.; Pons, A.; Tur, J.A. Beverage Consumption among Adults in the Balearic Islands: Association with Total Water and Energy Intake. Nutrients 2018, 10, 1149. [Google Scholar] [CrossRef] [PubMed]
- Block, J.P.; Scribner, R.A.; DeSalvo, K.B. Fast Food, Race/Ethnicity, and Income. A Geographic Analysis. Am. J. Prev. Med. 2004, 27, 211–217. [Google Scholar] [CrossRef]
- Zagorsky, J.L.; Smith, P.K. Economics and Human Biology Who drinks soda pop? Economic status and adult consumption of sugar-sweetened beverages. Econ. Hum. Biol. 2020, 38, 100888. [Google Scholar] [CrossRef] [PubMed]
- Altman, E.; Madsen, K.; Schmidt, L. Missed Opportunities: The Need to Promote Public Knowledge and Awareness of Sugar-Sweetened Beverage Taxes. Int. J. Environ. Res. Public Health 2021, 18, 4607. [Google Scholar] [CrossRef]
- Backholer, K.; Martin, J. Sugar-sweetened beverage tax: The inconvenient truths. Public Health Nutr. 2017, 20, 3225–3227. [Google Scholar] [CrossRef]
- Bakogianni, I. The EU Health Promotion and Disease Prevention Knowledge Gateway. Eur. J. Public Health 2019, 29 (Suppl. 4), 220–221. [Google Scholar] [CrossRef]
- Nelson, M.R.; Jihea, R.; Gail, A.; Anderson, A.; Nelson, M.R.; Sandage, C.H. Consumer exposure to food and beverage advertising out of home: An exploratory case study in Jamaica. Int. J. Consum. Stud. 2020, 44, 272–284. [Google Scholar] [CrossRef]
- Bartels, M.; Tillack, K.; Lin, C.-T.J. Communicating nutrition information at the point of purchase: An eye-tracking study of shoppers at two grocery stores in the United States. Int. J. Clin. Pract. 2018, 42, 557–565. [Google Scholar] [CrossRef]
- Zagorsky, J.L.; Smith, P.K. The association between socioeconomic status and adult fast-food consumption in the U.S. Econ. Hum. Biol. 2017, 27, 12–25. [Google Scholar] [CrossRef] [PubMed]
- Hsiao, A.; Wang, Y.C. Reducing Sugar-Sweetened Beverage Consumption: Evidence, Policies, and Economics. Curr. Obes. Rep. 2013, 2, 191–199. [Google Scholar] [CrossRef][Green Version]
- Henning, S.M.; Yang, J.; Shao, P.; Lee, R.-P.; Huang, J.; Ly, A.; Hsu, M.; Lu, Q.-Y.; Thames, G.; Heber, D.; et al. Health benefit of vegetable/fruit juice-based diet: Role of microbiome. Sci. Rep. 2017, 7, 1–9. [Google Scholar] [CrossRef]


| N | (%) | ||
|---|---|---|---|
| Gender | women | 240 | 48.0 |
| men | 260 | 52.0 | |
| Age | 18 to 29 | 87 | 17.4 |
| 30 to 44 | 149 | 29.8 | |
| 45 to 59 | 116 | 23.2 | |
| over 60 | 148 | 29.6 | |
| Education | lower than secondary | 175 | 35.0 |
| secondary | 176 | 35.2 | |
| high | 149 | 29.8 | |
| Material status | lives very well, can afford some luxury | 12 | 2.4 |
| lives well, is able to afford a lot without saving | 155 | 31.0 | |
| lives on an average level, can afford the day to day life but has to save to make bigger purchases | 293 | 58.6 | |
| lives moderately, has to save on an everyday basis | 32 | 6.4 | |
| lives very poorly, lacks funds to sustain the basic needs | 5 | 1.0 | |
| hard to say | 3 | 0.6 |
| Flavoured Water (p-Value 0.002) [%] | Energy Drinks (p-Value 0.045) [%] | Isotonic Drinks (p-Value 0.003) [%] | |||||||
|---|---|---|---|---|---|---|---|---|---|
| Education | Lower than Secondary | Secondary | High | Lower than Secondary | Secondary | High | Lower than Secondary | Secondary | High |
| Every day or almost every day | 7.4 | 8.0 | 1.3 | 5.1 | 4.0 | 2.0 | 3.4 | 1.7 | 1.3 |
| 3–4 times a week | 17.7 | 11.9 | 12.1 | 10.3 | 2.8 | 4.7 | 4.0 | 6.8 | 2.7 |
| 1–2 a week | 13.7 | 21.6 | 24.8 | 14.3 | 11.9 | 10.7 | 11.4 | 6.8 | 10.1 |
| Few times a month | 23.4 | 13.1 | 20.1 | 13.7 | 14.8 | 16.1 | 14.3 | 11.4 | 13.4 |
| Sporadically (occasionally. less than once a month) | 22.3 | 34.1 | 30.9 | 28.0 | 30.1 | 39.6 | 40.0 | 26.7 | 43.0 |
| Never | 15.4 | 11.4 | 10.7 | 28.6 | 36.4 | 26.8 | 26.9 | 46.6 | 29.5 |
| 1 | 2 | 3 | 4 | 5 | 6 | 7 | 8 | 9 | 10 | 11 | |
|---|---|---|---|---|---|---|---|---|---|---|---|
| 1 a | 0.1128 | 0.2903 | 0.2399 | 0.2103 | 0.1349 | 0.1004 | 0.0877 | 0.1180 | |||
| 2 | 0.3052 | 0.2045 | 0.2449 | 0.2344 | 0.2037 | 0.3475 | 0.3444 | 0.1993 | 0.2090 | ||
| 3 | 0.4577 | 0.3772 | 0.4650 | 0.5615 | 0.5306 | 0.4484 | 0.3785 | 0.3368 | |||
| 4 | 0.4923 | 0.5472 | 0.5163 | 0.3960 | 0.3817 | 0.2951 | 0.2562 | ||||
| 5 | 0.4676 | 0.3287 | 0.3268 | 0.2365 | 0.3322 | 0.3958 | |||||
| 6 | 0.5920 | 0.4725 | 0.4178 | 0.3937 | 0.3613 | ||||||
| 7 | 0.5775 | 0.48148 | 0.4013 | 0.3436 | |||||||
| 8 | 0.7528 | 0.5113 | 0.4089 | ||||||||
| 9 | 0.5288 | 0.4365 | |||||||||
| 10 | 0.7085 | ||||||||||
| 11 |
Publisher’s Note: MDPI stays neutral with regard to jurisdictional claims in published maps and institutional affiliations. |
© 2021 by the authors. Licensee MDPI, Basel, Switzerland. This article is an open access article distributed under the terms and conditions of the Creative Commons Attribution (CC BY) license (https://creativecommons.org/licenses/by/4.0/).
Share and Cite
Piekara, A.; Krzywonos, M. Assessment of the Frequency of Sweetened Beverages Consumption among Adults in Poland. Int. J. Environ. Res. Public Health 2021, 18, 7029. https://doi.org/10.3390/ijerph18137029
Piekara A, Krzywonos M. Assessment of the Frequency of Sweetened Beverages Consumption among Adults in Poland. International Journal of Environmental Research and Public Health. 2021; 18(13):7029. https://doi.org/10.3390/ijerph18137029
Chicago/Turabian StylePiekara, Agnieszka, and Małgorzata Krzywonos. 2021. "Assessment of the Frequency of Sweetened Beverages Consumption among Adults in Poland" International Journal of Environmental Research and Public Health 18, no. 13: 7029. https://doi.org/10.3390/ijerph18137029
APA StylePiekara, A., & Krzywonos, M. (2021). Assessment of the Frequency of Sweetened Beverages Consumption among Adults in Poland. International Journal of Environmental Research and Public Health, 18(13), 7029. https://doi.org/10.3390/ijerph18137029


