
Mixed POT-BM Approach for Modeling Unhealthy Air Pollution Events

Abstract
:1. Introduction
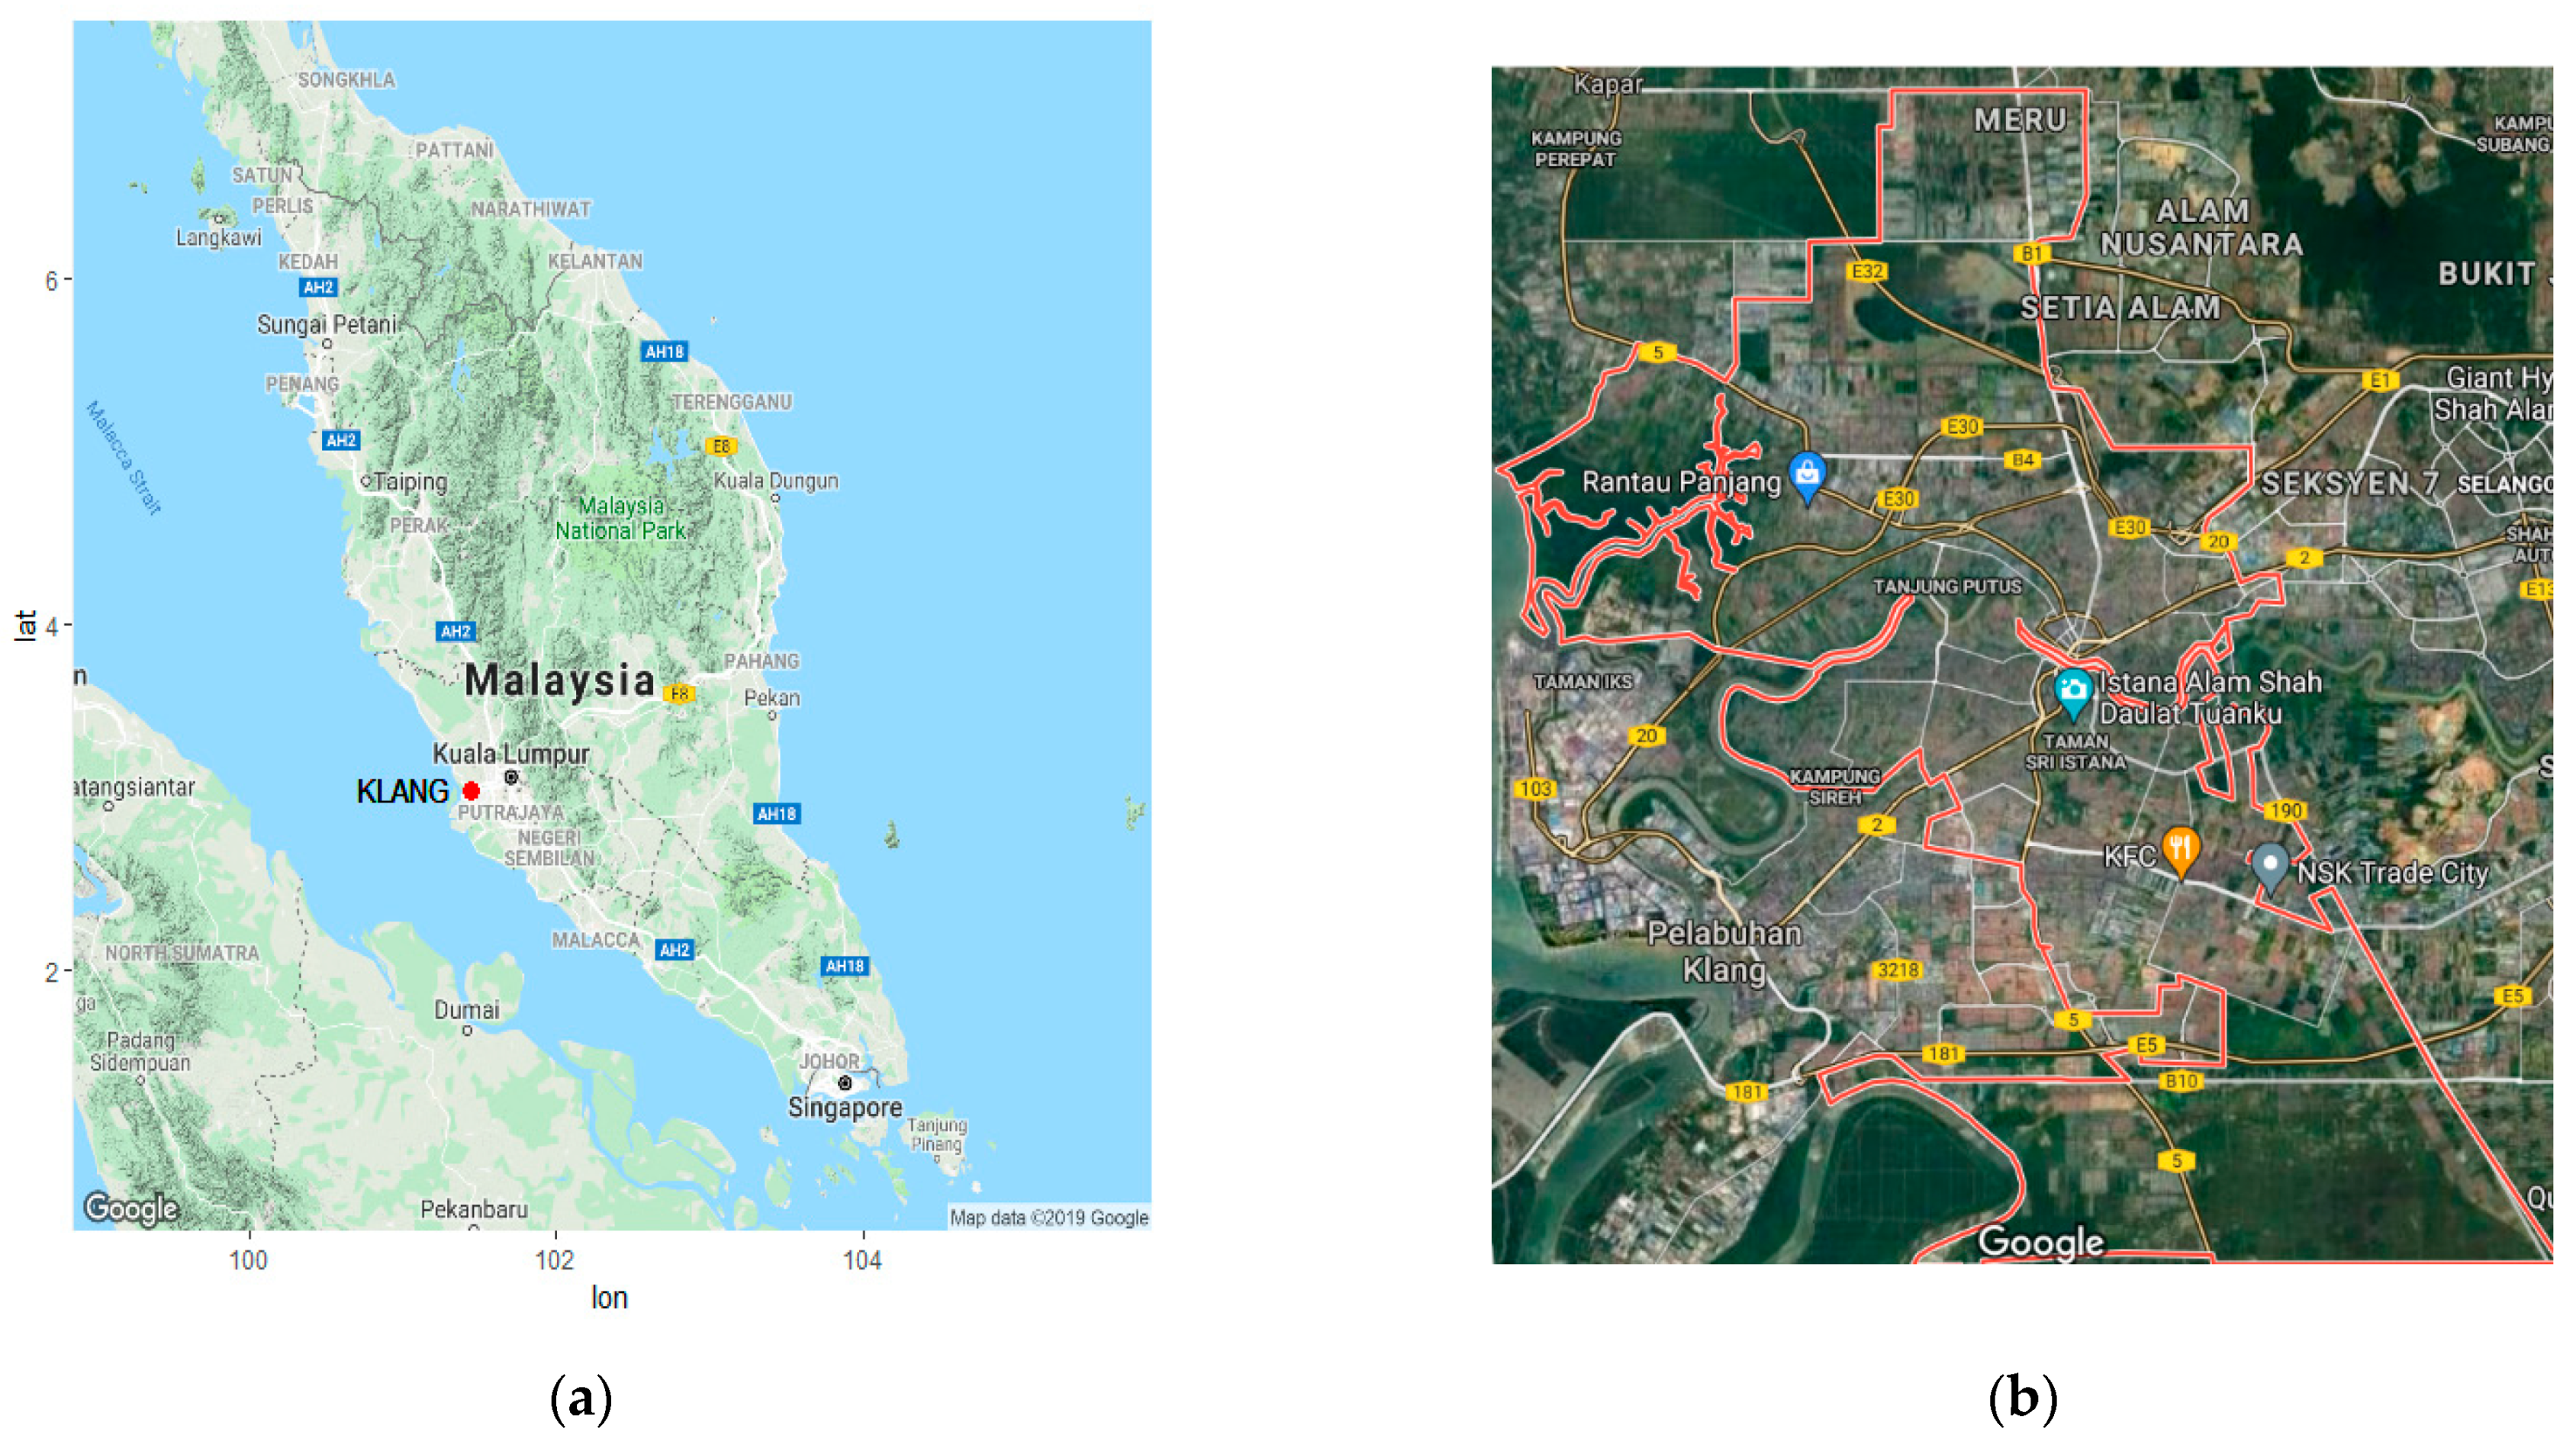
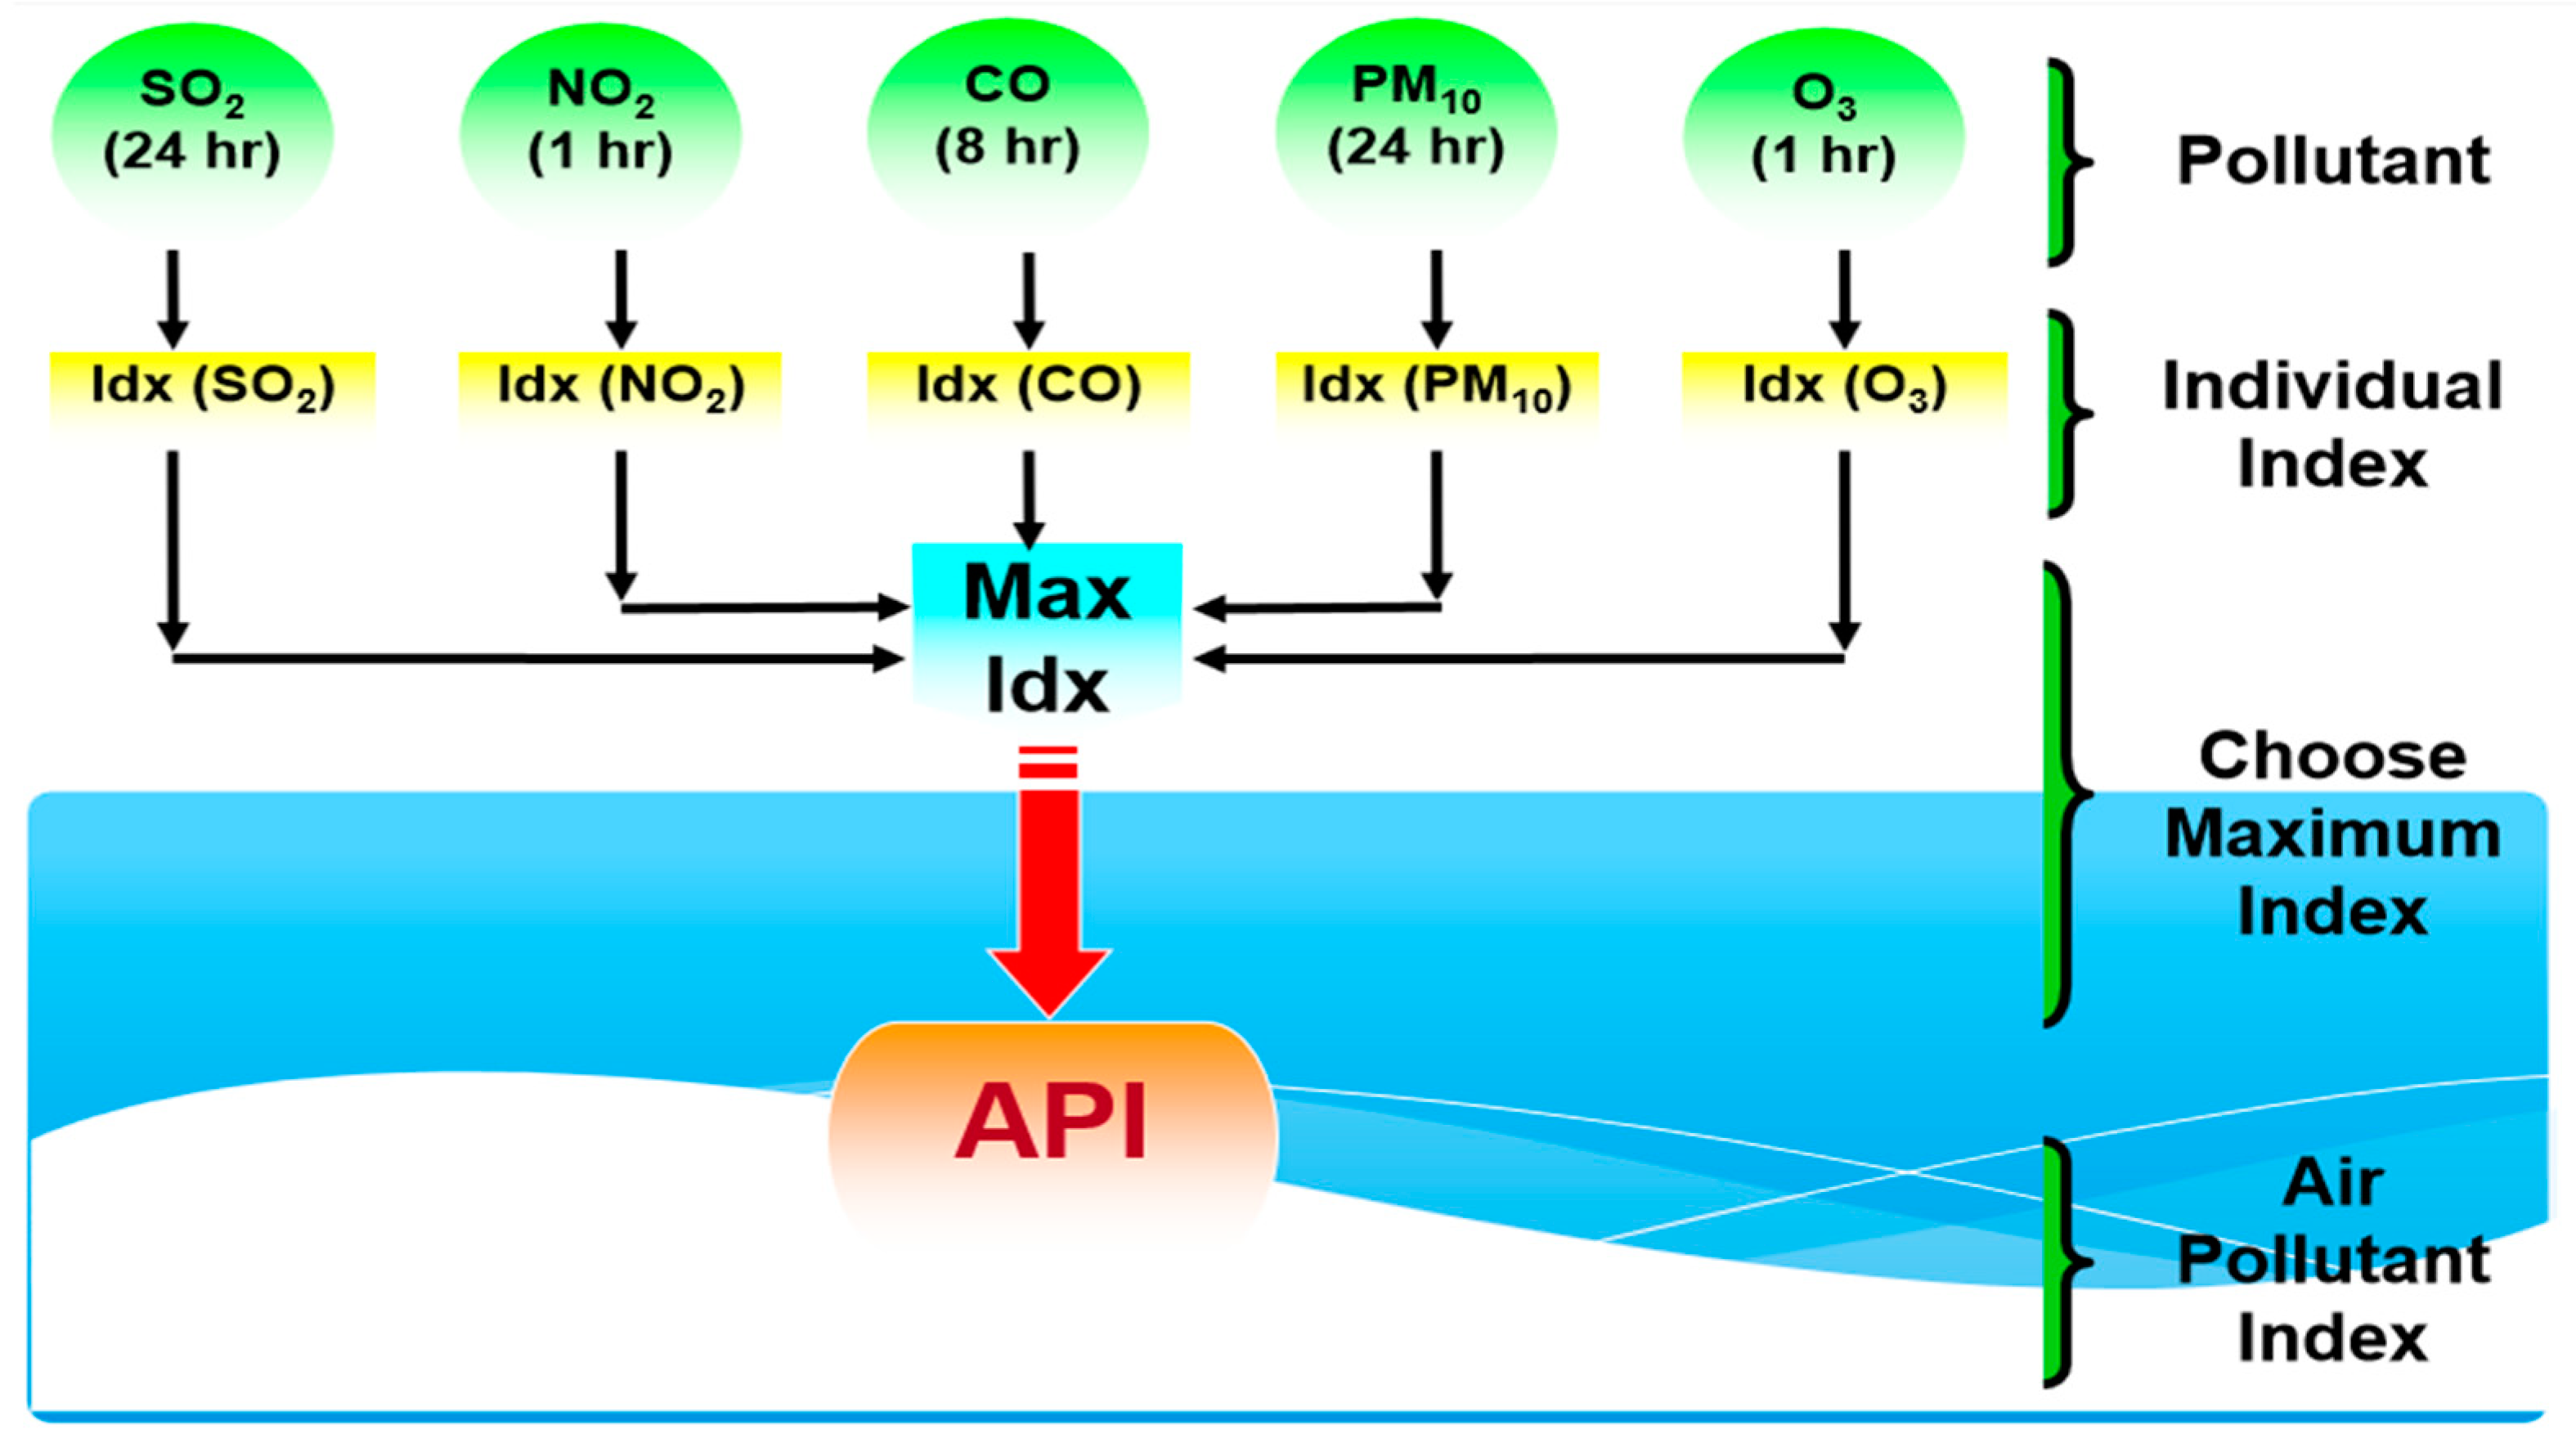
2. Study Area and API Data
3. Extreme-Value Modeling
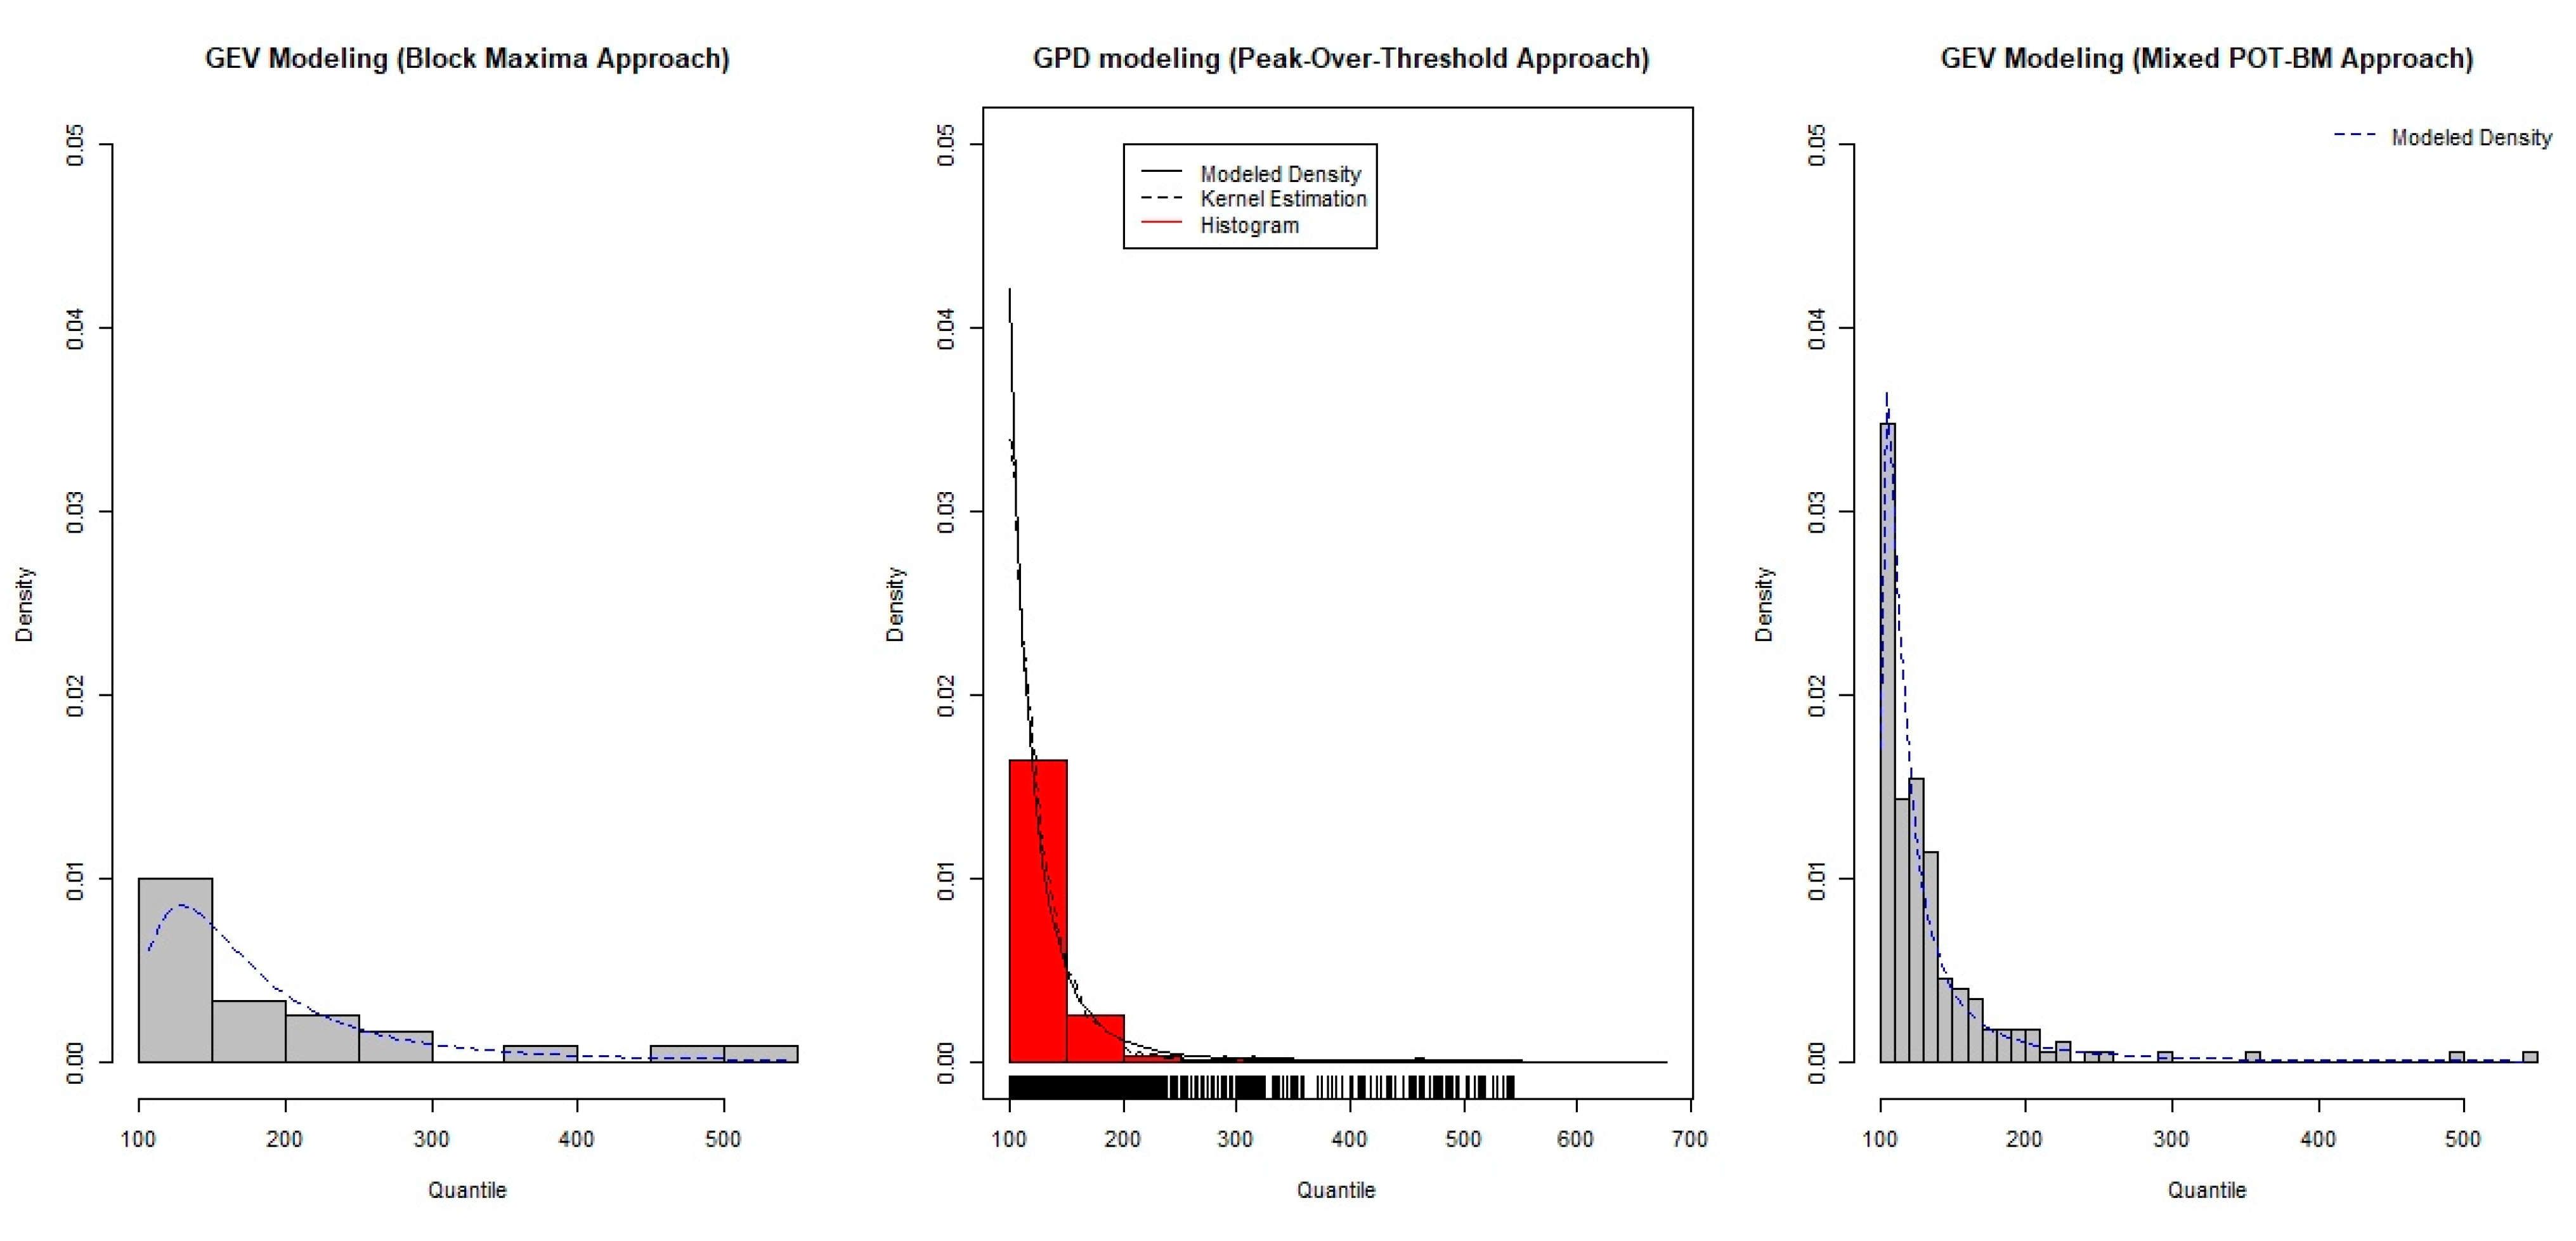
3.1. BM Approach
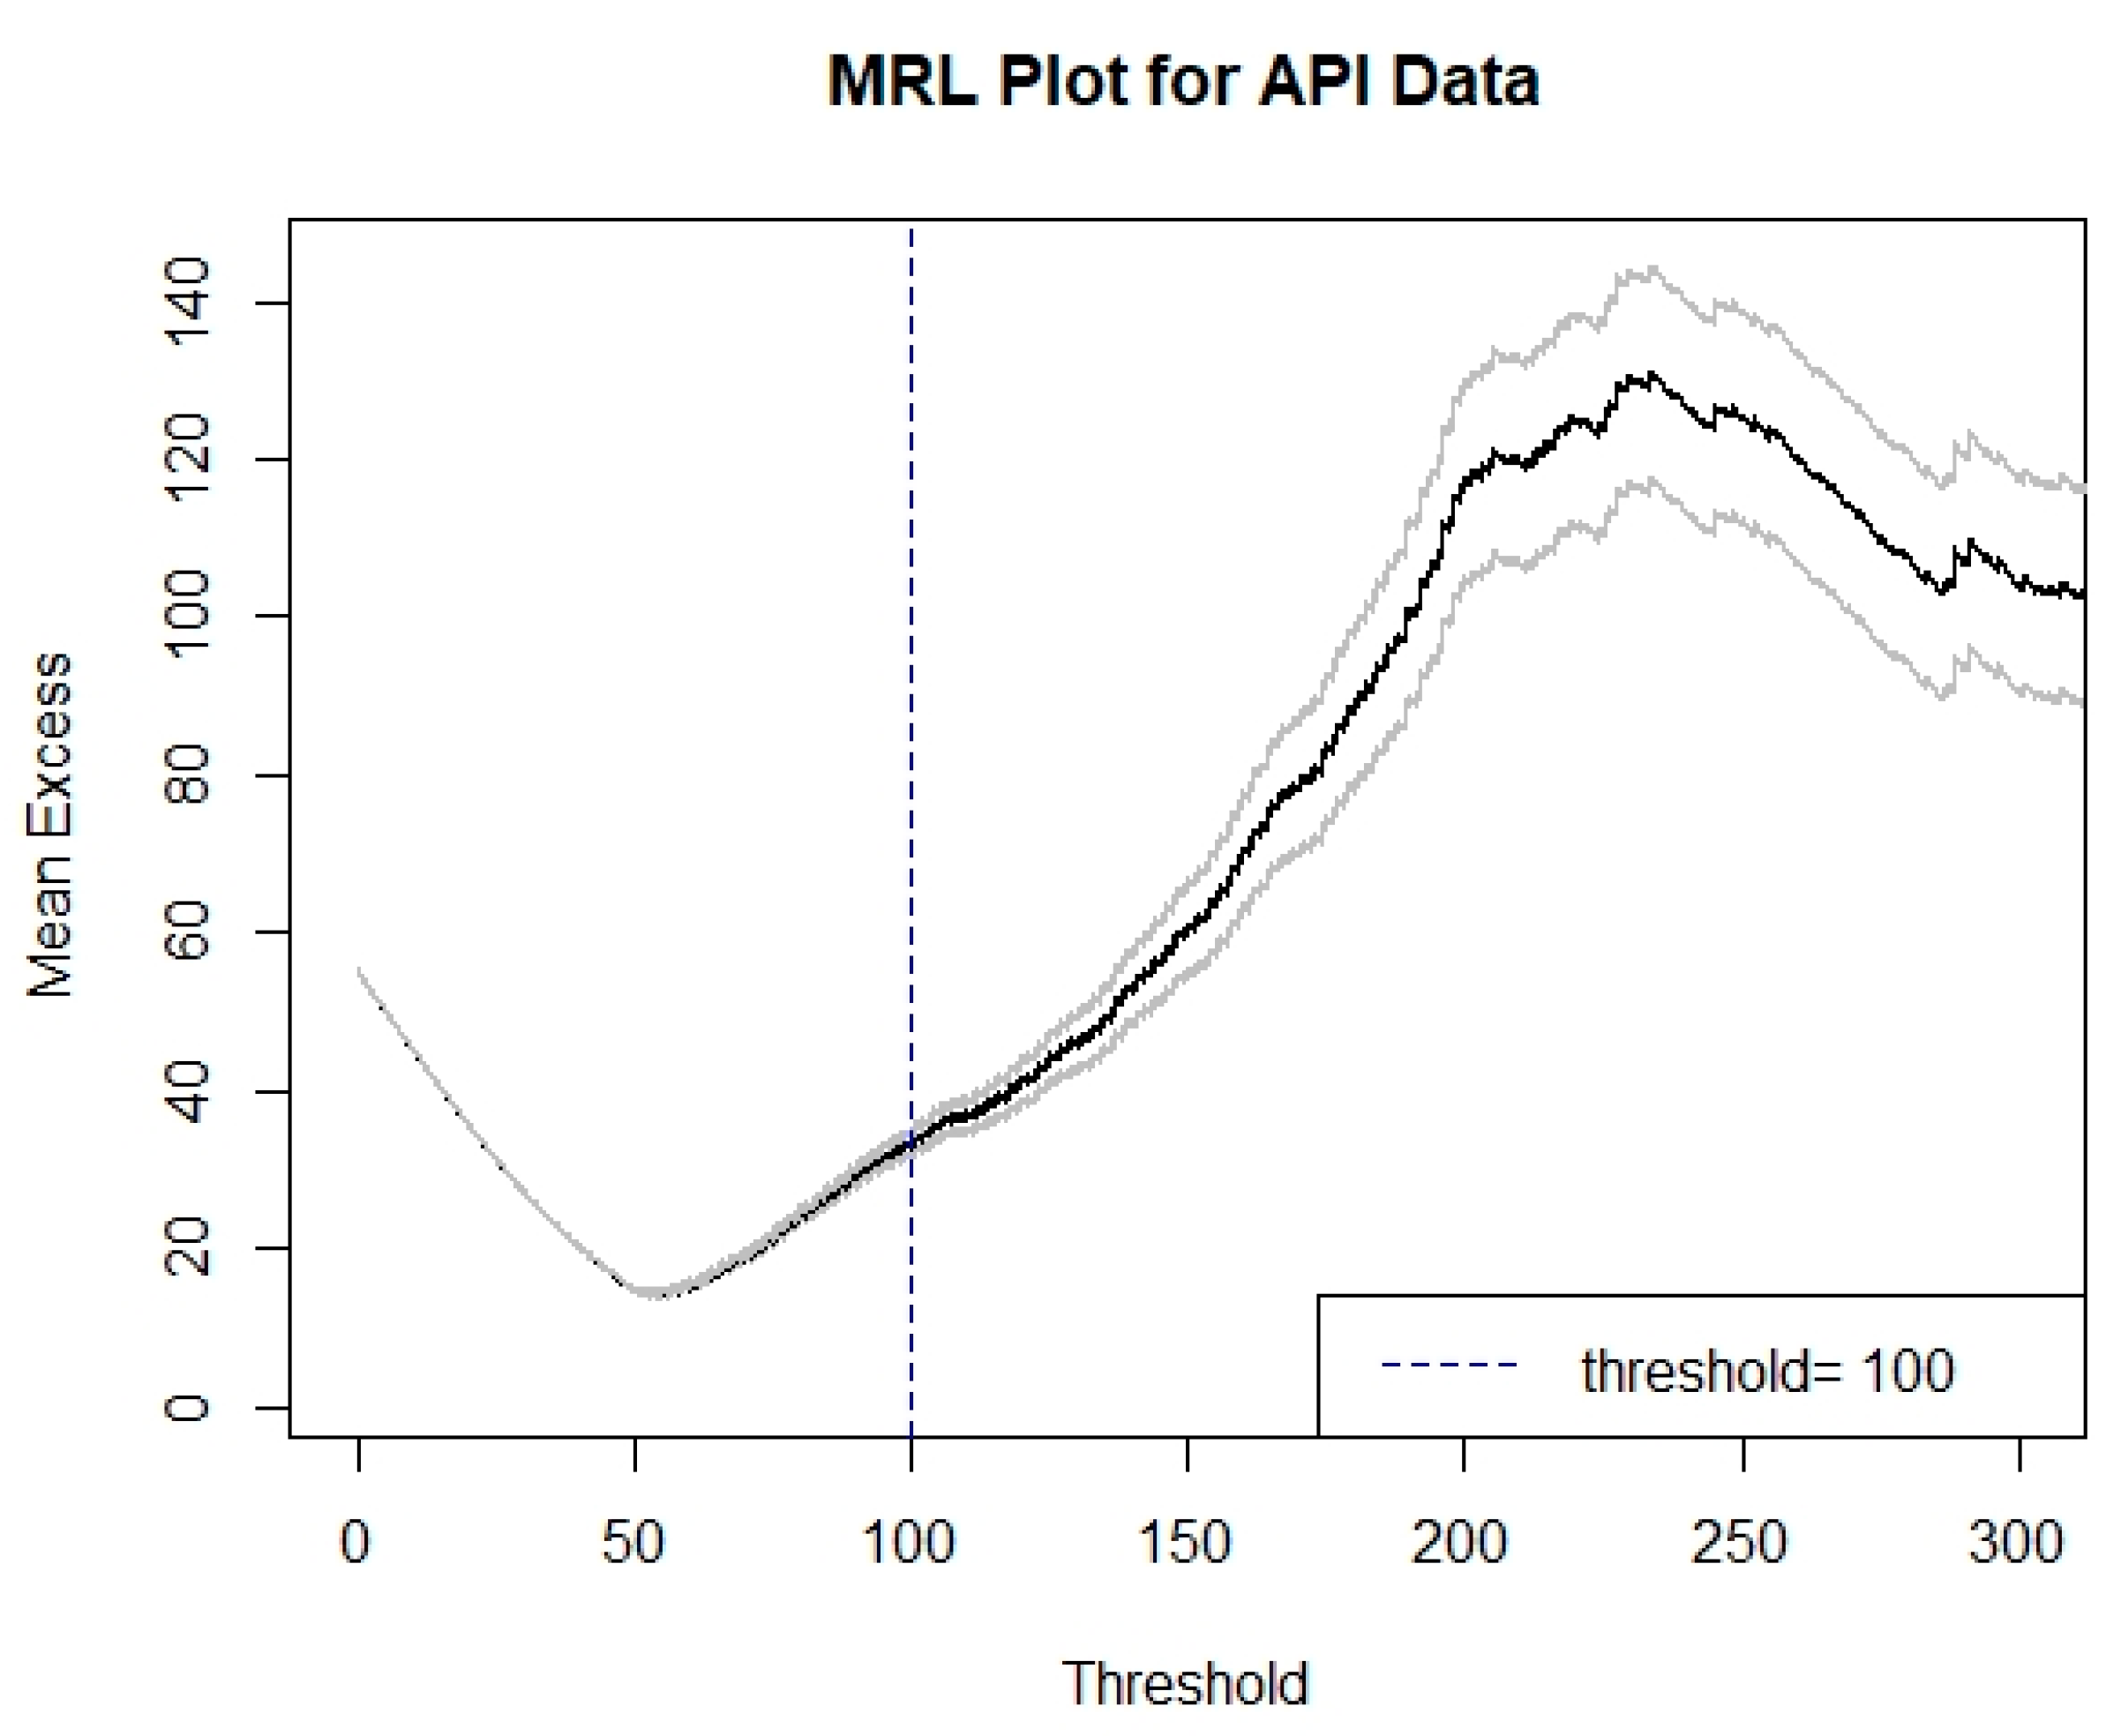
3.2. POT Approach
3.3. Mixed POT-BM Approach
4. Results and Discussion
5. Conclusions
Author Contributions
Funding
Institutional Review Board Statement
Informed Consent Statement
Data Availability Statement
Acknowledgments
Conflicts of Interest
References
- Tabari, H. Extreme value analysis dilemma for climate change impact assessment on global flood and extreme precipitation. J. Hydrol. 2021, 593, 125932. [Google Scholar] [CrossRef]
- Xu, H.; Lin, N.; Huang, M.; Lou, W. Design tropical cyclone wind speed when considering climate change. J. Struct. Eng. 2020, 146, 04020063. [Google Scholar] [CrossRef] [Green Version]
- Sarailidis, G.; Vasiliades, L.; Loukas, A. Analysis of streamflow droughts using fixed and variable thresholds. Hydrol. Process. 2019, 33, 414–431. [Google Scholar] [CrossRef]
- O’Sullivan, J.; Sweeney, C.; Parnell, A.C. Bayesian spatial extreme value analysis of maximum temperatures in County Dublin, Ireland. Environmetrics 2020, 31, e2621. [Google Scholar] [CrossRef] [Green Version]
- Beirlant, J.; Kijko, A.; Reynkens, T.; Einmahl, J.H.J. Estimating the maximum possible earthquake magnitude using extreme value methodology: The Groningen case. Nat. Hazards 2019, 98, 1091–1113. [Google Scholar] [CrossRef] [Green Version]
- Masseran, N. Modeling fluctuation of PM10 data with existence of volatility effect. Environ. Eng. Sci. 2017, 34, 816–827. [Google Scholar] [CrossRef]
- AL-Dhurafi, N.A.; Masseran, N.; Zamzuri, Z.H. Hierarchical-Generalized Pareto model for estimation of unhealthy air pollution index. Environ. Model. Assess. 2020, 25, 555–564. [Google Scholar] [CrossRef]
- Resnick, S.I. Heavy-Tail Phenomena: Probability and Statistical Modeling; Springer: New York, NY, USA, 2007. [Google Scholar]
- Bradley, B.O.; Taqqu, M.S. Financial Risk and Heavy Tails. In Handbook of Heavy Tailed Distributions in Finance; Rachev, S.T., Ed.; Elsevier: Amsterdam, The Netherlands, 2003; Volume 1, pp. 35–103. [Google Scholar]
- Fisher, R.A.; Tippett, L.H.C. Limiting forms of the frequency distribution of the largest or smallest member of sample. Math. Proc. Camb. Philos. Soc. 1928, 24, 180–190. [Google Scholar] [CrossRef]
- Pickands, J. Statistical inference using extreme order statistics. Ann. Stat. 1975, 3, 119–131. [Google Scholar]
- Al-Dhurafi, N.A.; Masseran, N.; Zamzuri, Z.H.; Razali, A.M. Modeling unhealthy air pollution index using a peaks-over-threshold method. Environ. Eng. Sci. 2018, 35, 101–110. [Google Scholar] [CrossRef]
- Martins, L.D.; Wikuats, C.F.H.; Capucim, M.N.; de Almeida, D.S.; da Costa, S.C.; Albuquerque, T.; Carvalho, V.S.B.; de Freitas, E.D.; de Fátima Andrade, M.; Martins, J.A. Extreme value analysis of air pollution data and their comparison between two large urban regions of South America. Weather Clim. Extrem. 2017, 18, 44–54. [Google Scholar] [CrossRef]
- Eastoe, E.M.; Tawn, J.A. Modelling non-stationary extremes with application to surface level ozone. J. R. Stat. Soc. Ser. C Appl. Stat. 2009, 58, 25–45. [Google Scholar] [CrossRef]
- Gyarmati-Szabó, J.; Bogachev, L.V.; Chen, H. Nonstationary POT modelling of air pollution concentrations: Statistical analysis of the traffic and meteorological impact. Environmetrics 2017, 28, e2449. [Google Scholar] [CrossRef] [Green Version]
- Hazarika, S.; Borah, P.; Prakash, A. The assessment of return probability of maximum ozone concentrations in an urban environment of Delhi: A Generalized Extreme Value analysis approach. Atmos. Environ. 2019, 202, 53–63. [Google Scholar] [CrossRef]
- Kütchenhoff, H.; Thamerus, M. Extreme value analysis of Munich air pollution data. Environ. Ecol. Stat. 1996, 3, 127–141. [Google Scholar] [CrossRef] [Green Version]
- Masseran, N.; Razali, A.M.; Ibrahim, K.; Latif, M.T. Modeling air quality in main cities of Peninsular Malaysia by using a generalized Pareto model. Environ. Monit. Assess. 2016, 188, 65. [Google Scholar] [CrossRef] [PubMed]
- Reyes, H.J.; Vaquera, H.; Villaseñor, J.A. Estimation of trends in high urban ozone levels using the quantiles of (GEV). Environmetrics 2010, 21, 470–481. [Google Scholar] [CrossRef]
- Su, F.-C.; Jia, C.; Batterman, B. Extreme value analyses of VOC exposures and risks: A comparison of RIOPA and NHANES datasets. Atmos. Environ. 2012, 62, 97–106. [Google Scholar] [CrossRef] [PubMed] [Green Version]
- Battista, G.; Pagliaroli, T.; Mauri, M.; Basilicata, C.; Vollaro, R.D.L. Assessment of the Air Pollution Level in the City of Rome (Italy). Sustainability 2016, 8, 838. [Google Scholar] [CrossRef] [Green Version]
- Gumbel, E.J. Statistics of Extremes; Colombia University Press: New York, NY, USA, 1958. [Google Scholar]
- Huang, W.; Xu, S.; Nnaji, S. Evaluation of GEV model for frequency analysis of annual maximum water levels in the coast of United States. Ocean Eng. 2008, 35, 1132–1147. [Google Scholar] [CrossRef]
- Nguyen, T.-H.; Outayek, S.E.; Lim, S.H.; Nguyen, V.-T.-V. A systematic approach to selecting the best probability models for annual maximum rainfalls—A case study using data in Ontario (Canada). J. Hydrol. 2017, 553, 49–58. [Google Scholar] [CrossRef]
- Li, Z.; Li, C.; Xu, Z.; Zhou, X. Frequency analysis of precipitation extremes in Heihe River basin based on generalized Pareto distribution. Stoch. Environ. Res. Risk Assess. 2014, 28, 1709–1721. [Google Scholar] [CrossRef]
- Xia, J.; Du, H.; Zeng, S.; She, D.; Zhang, Y.; Yan, Z.; Ye, Y. Temporal and spatial variations and statistical models of extreme runoff in Huaihe River Basin during 1956–2010. J. Geogr. Sci. 2012, 22, 1045–1060. [Google Scholar] [CrossRef]
- Vrban, S.; Wang, Y.; McBean, E.A.; Binns, A.; Gharabaghi, B. Evaluation of stormwater infrastructure design storms de-veloped using partial duration and annual maximum series models. J. Hydrol. Eng. 2018, 23, 04018051. [Google Scholar] [CrossRef]
- Madsen, H.; Rasmussen, P.F.; Rosbjerg, D. Comparison of annual maximum series and partial duration series methods for modeling extreme hydrologic events: 1. At-site modeling. Water Resour. Res. 1997, 33, 747–757. [Google Scholar] [CrossRef]
- Davison, A.C. Modelling Excesses over High Thresholds, with an Application. In Statistical Extremes and Applications; de Oliveira, J.T., Ed.; Springer: Dordrecht, The Netherlands, 1984; Volume 131, pp. 461–482. [Google Scholar]
- Leadbetter, M.R. On a basis for ‘Peaks over Threshold’ modeling. Stat. Probab. Lett. 1991, 12, 357–362. [Google Scholar] [CrossRef]
- Lang, M.; Ouarda, T.B.M.J.; Bobee, B. Towards operational guidelines for over-threshold modeling. J. Hydrol. 1999, 225, 103–117. [Google Scholar] [CrossRef]
- Brabson, B.B.; Palutikof, J.P. Tests of the generalized Pareto distribution for predicting extreme wind speeds. J. Appl. Meteorol. Climatol. 2000, 39, 1627–1640. [Google Scholar] [CrossRef] [Green Version]
- Cebrián, A.C.; Denuit, M.; Lambert, P. Generalized Pareto fit to the society of actuaries’ large claims database. N. Am. Actuar. J. 2003, 7, 18–36. [Google Scholar] [CrossRef]
- Khaliq, M.N.; Ouarda, T.B.M.J.; Ondo, J.-C.; Gachon, P.; Bobee, B. Frequency analysis of sequence of dependent and/or non-stationary hydro-meteorological observations: A review. J. Hydrol. 2006, 329, 534–552. [Google Scholar] [CrossRef]
- Palutikof, J.P.; Brabson, B.B.; Lister, D.H.; Adcock, S.T. A review of methods to calculate extreme wind speeds. Meteorol. Appl. 1999, 6, 119–132. [Google Scholar] [CrossRef]
- Masseran, N.; Safari, M.A.M. Risk assessment of extreme air pollution based on partial duration series: IDF approach. Stoch. Environ. Res. Risk Assess. 2020, 34, 545–559. [Google Scholar] [CrossRef]
- Port Klang ICM Webpage. Available online: https://luas.gov.my/icm/knowledge_center/bckground_demogrphy.htm (accessed on 5 June 2021).
- Masseran, N. Power-law behaviors of the duration size of unhealthy air pollution events. Stoch. Environ. Res. Risk Assess. 2021, in press. [Google Scholar] [CrossRef]
- Masseran, N.; Safari, M.A.M. Modeling the transition behaviors of PM10 pollution index. Environ. Monit. Assess. 2020, 192, 441. [Google Scholar] [CrossRef]
- Google. 2019. Available online: https://maps.googleapis.com/maps/api/geocode/json?address=Klang%2CSelangor&key=xxx (accessed on 25 March 2019).
- Afroz, R.; Hassan, M.N.; Ibrahim, N.A. Review of air pollution and health impacts in Malaysia. Environ. Res. 2003, 92, 71–77. [Google Scholar] [CrossRef]
- Awang, M.B.; Jaafar, A.B.; Abdullah, A.M.; Ismail, M.B.; Hassan, M.N.; Abdullah, R.; Johan, S.; Noor, H. Air quality in Malaysia: Impacts, management issues and future challenges. Respirology 2000, 5, 183–196. [Google Scholar] [CrossRef] [PubMed]
- Azid, A.; Juahir, H.; Toriman, M.E.; Endut, A.; Kamarudin, M.K.A.; Abdul Rahman, M.N.; Che Hasnam, C.N.; Mohd Saudi, A.S.; Yunus, K. Source Apportionment of Air Pollution: A Case Study In Malaysia. J. Teknol. 2015, 72, 83–88. [Google Scholar] [CrossRef] [Green Version]
- Dominick, D.; Juahir, H.; Latif, M.T.; Zain, S.M.; Aris, A.Z. Spatial assessment of air quality patterns in Malaysia using multivariate analysis. Atmos. Environ. 2012, 60, 172–181. [Google Scholar] [CrossRef]
- Latif, M.T.; Othman, M.; Idris, N.; Juneng, L.; Abdullah, A.M.; Hamzah, W.P.; Khan, M.F.; Sulaiman, N.M.N.; Jewaratnam, J.; Aghamohammadi, N.; et al. Impact of regional haze towards air quality in Malaysia: A review. Atmos. Environ. 2018, 177, 28–44. [Google Scholar] [CrossRef]
- Jamhari, A.A.; Sahani, M.; Latif, M.T.; Chan, K.M.; Tan, H.S.; Khan, M.F.; Tahir, N.M. Concentration and source identification of polycyclic aromatic hydrocarbons (PAHs) in PM10 of urban, industrial and semi-urban areas in Malaysia. Atmos. Environ. 2014, 86, 16–27. [Google Scholar] [CrossRef]
- Department of Environment. A Guide to Air Pollutant Index in Malaysia (API); Ministry of Science, Technology and the Environment: Kuala Lumpur, Malaysia, 1997; Available online: https://aqicn.org/images/aqi-scales/malaysia-api-guide.pdf (accessed on 4 June 2020).
- Al-Dhurafi, N.A.; Masseran, N.; Zamzuri, Z.H.; Safari, M.A.M. Modeling the Air Pollution Index based on its structure and descriptive status. Air Qual. Atmos. Health 2018, 11, 171–179. [Google Scholar] [CrossRef]
- AL-Dhurafi, N.A.; Masseran, N.; Zamzuri, Z.H. Compositional time series analysis for air pollution index data. Stoch. Environ. Res. Risk Assess. 2018, 32, 2903–2911. [Google Scholar] [CrossRef]
- Department of Environment Malaysia. Available online: https://www.doe.gov.my/portalv1/en/ (accessed on 23 August 2020).
- Reiss, R.-D.; Thomas, M. Statistical Analysis of Extreme Values: With Application to Insurance, Finance, Hydrology and Other Fields; Die Deutsche Bibliothek: Berlin, Germany, 2007. [Google Scholar]
- Masseran, N.; Mohd Safari, M.A. Intensity–duration–frequency approach for risk assessment of air pollution events. J. Environ. Manag. 2020, 264, 110429. [Google Scholar] [CrossRef]
- Coles, S. An Introduction to Statistical Modeling of Extreme Values; Springer: London, UK, 2001. [Google Scholar]
- Hosking, J.R.M.; Wallis, J.R.; Wood, E.F. Estimation of the generalized extreme-value distribution by the method of probability weighted moments. Technometrics 1985, 27, 251–261. [Google Scholar] [CrossRef]
- Hosking, J.R.M. L-moments: Analysis and estimation of distributions using linear combinations of order statistics. J. R. Stat. Soc. Ser. B Methodol. 1990, 52, 105–124. [Google Scholar] [CrossRef]
- Wang, Q.J. Direct sample estimators of L moments. Water Resour. Res. 1996, 32, 3617–3619. [Google Scholar] [CrossRef]
- Martins, E.S.; Stedinger, J.R. Generalized maximum-likelihood generalized extreme-value quantile estimators for hydrologic data. Water Resour. Res. 2000, 36, 737–744. [Google Scholar] [CrossRef]
- Katz, R.W.; Parlange, M.B.; Naveau, P. Statistics of extremes in hydrology. Adv. Water Resour. 2002, 25, 1287–1304. [Google Scholar] [CrossRef] [Green Version]
- Ribatet, M. POT: Modelling peak over a threshold. R News 2007, 7, 33–36. [Google Scholar]
- Southworth, H.; Heffernan, J.E. texmex: Statistical Modelling of Extreme Values; R Package, Version 2.1; Microsoft R Application Network: Redmond, WA, USA, 2014. [Google Scholar]
- Masseran, N.; Hussain, S.I. Copula modelling on the dynamic dependence structure of multiple air pollutant variables. Mathematics 2020, 8, 1910. [Google Scholar] [CrossRef]
- Zhou, S.-M.; Deng, Q.-H.; Lui, W.-W. Extreme air pollution events: Modeling and prediction. J. Cent. South Univ. 2012, 19, 1668–1672. [Google Scholar] [CrossRef]
- Ding, Y.; Cheng, B.; Jiang, Z. A newly-discovered GPD-GEV relationship together with comparing their models of extreme precipitation in summer. Adv. Atmos. Sci. 2008, 25, 507. [Google Scholar] [CrossRef]
- Karim, F.; Hasan, M.; Marvanek, S. Evaluating annual maximum and partial duration series for estimating frequency of small magnitude floods. Water 2017, 9, 481. [Google Scholar] [CrossRef] [Green Version]
- Hosking, J.R.M. Algorithm as 215: Maximum-likelihood estimation of the parameters of the generalized extreme-value distribution. J. R. Stat. Soc. Ser. C Appl. Stat. 1985, 34, 301–310. [Google Scholar] [CrossRef]
- Gilleland, E.; Katz, R.W. extRemes 2.0: An Extreme Value Analysis Package in R. J. Stat. Softw. 2016, 72, 1–39. [Google Scholar] [CrossRef] [Green Version]
- Othman, J.; Sahani, M.; Mahmud, M.; Ahmad, M.K.S. Transboundary smoke haze pollution in Malaysia: Inpatient health impacts and economic valuation. Environ. Pollut. 2014, 189, 194–201. [Google Scholar] [CrossRef] [PubMed]
- Department of Environment (DOE). Chronology of Haze Episodes in Malaysia. Available online: https://www.doe.gov.my/portalv1/wp-content/uploads/2015/09/Chronology-of-Haze-Episodes-in-Malaysia.pdf (accessed on 4 June 2021).


| Pollution Index | Status | Health Effect |
|---|---|---|
| 0–50 | Good | Low pollution with no ill effects on health |
| 51–100 | Moderate | Moderate pollution that poses no ill effects on health |
| 101–200 | Unhealthy | Worsens the health conditions of high-risk individuals with heart and lung complications |
| 201–300 | Very unhealthy | Worsens the health conditions and reduces the tolerance to physical exercise of individuals with heart and lung complications; affects public health |
| >300 | Hazardous | Hazardous to high-risk individuals and public health in general |
| Location | Mean | Standard Deviation | Min. Value | Max. Value | Skewness | Kurtosis |
|---|---|---|---|---|---|---|
| Klang | 55.222 | 20.970 | 0 | 543 | 4.537 | 65.133 |
| Model | Parameter Estimated | Standard Error |
|---|---|---|
| GEV based on BM | Location = 143.805 | 13.293 |
| Scale = 46.404 | 17.071 | |
| Shape = 0.415 | 0.127 | |
| GPD based on POT | Shape = 0.2933 | 0.017 |
| Scale = 23.7401 | 0.511 | |
| GEV approximation based on POT-BM | Location = 110.863 | 1.234 |
| Scale = 12.911 | 1.376 | |
| Shape = 0.788 | 0.118 |
Publisher’s Note: MDPI stays neutral with regard to jurisdictional claims in published maps and institutional affiliations. |
© 2021 by the authors. Licensee MDPI, Basel, Switzerland. This article is an open access article distributed under the terms and conditions of the Creative Commons Attribution (CC BY) license (https://creativecommons.org/licenses/by/4.0/).
Share and Cite
Masseran, N.; Safari, M.A.M. Mixed POT-BM Approach for Modeling Unhealthy Air Pollution Events. Int. J. Environ. Res. Public Health 2021, 18, 6754. https://doi.org/10.3390/ijerph18136754
Masseran N, Safari MAM. Mixed POT-BM Approach for Modeling Unhealthy Air Pollution Events. International Journal of Environmental Research and Public Health. 2021; 18(13):6754. https://doi.org/10.3390/ijerph18136754
Chicago/Turabian StyleMasseran, Nurulkamal, and Muhammad Aslam Mohd Safari. 2021. "Mixed POT-BM Approach for Modeling Unhealthy Air Pollution Events" International Journal of Environmental Research and Public Health 18, no. 13: 6754. https://doi.org/10.3390/ijerph18136754
APA StyleMasseran, N., & Safari, M. A. M. (2021). Mixed POT-BM Approach for Modeling Unhealthy Air Pollution Events. International Journal of Environmental Research and Public Health, 18(13), 6754. https://doi.org/10.3390/ijerph18136754