
The Effects of Residential Built Environment on Supporting Physical Activity Diversity in High-Density Cities: A Case Study in Shenzhen, China


Abstract
:1. Introduction
2. Methods
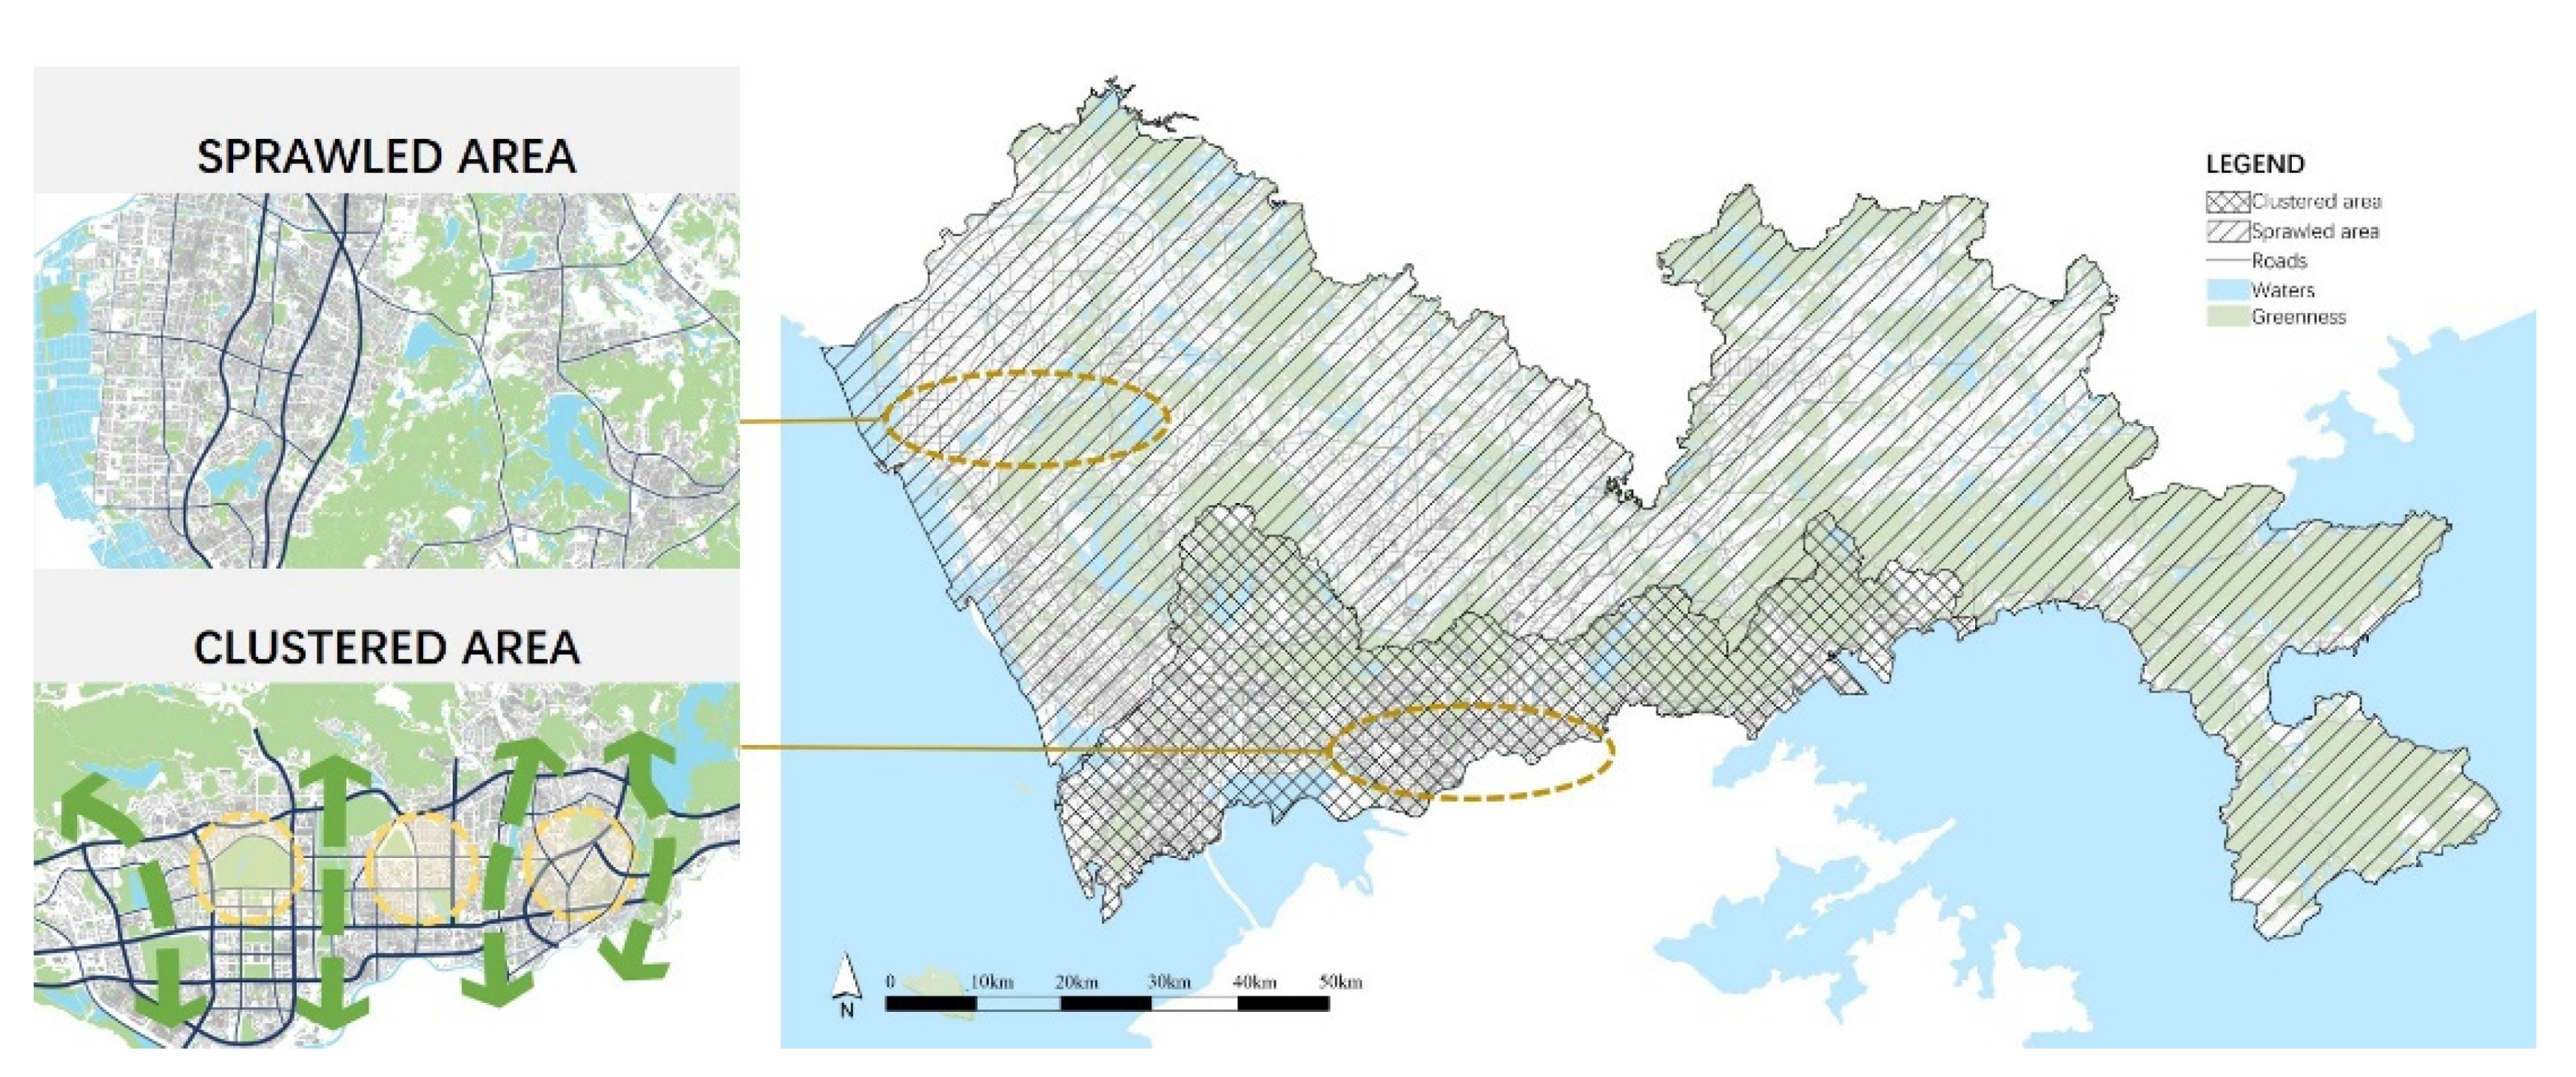
2.1. Research Area
2.2. Research Design
2.3. Data Resources
2.3.1. PA Data
2.3.2. The Residential Built Environment Data
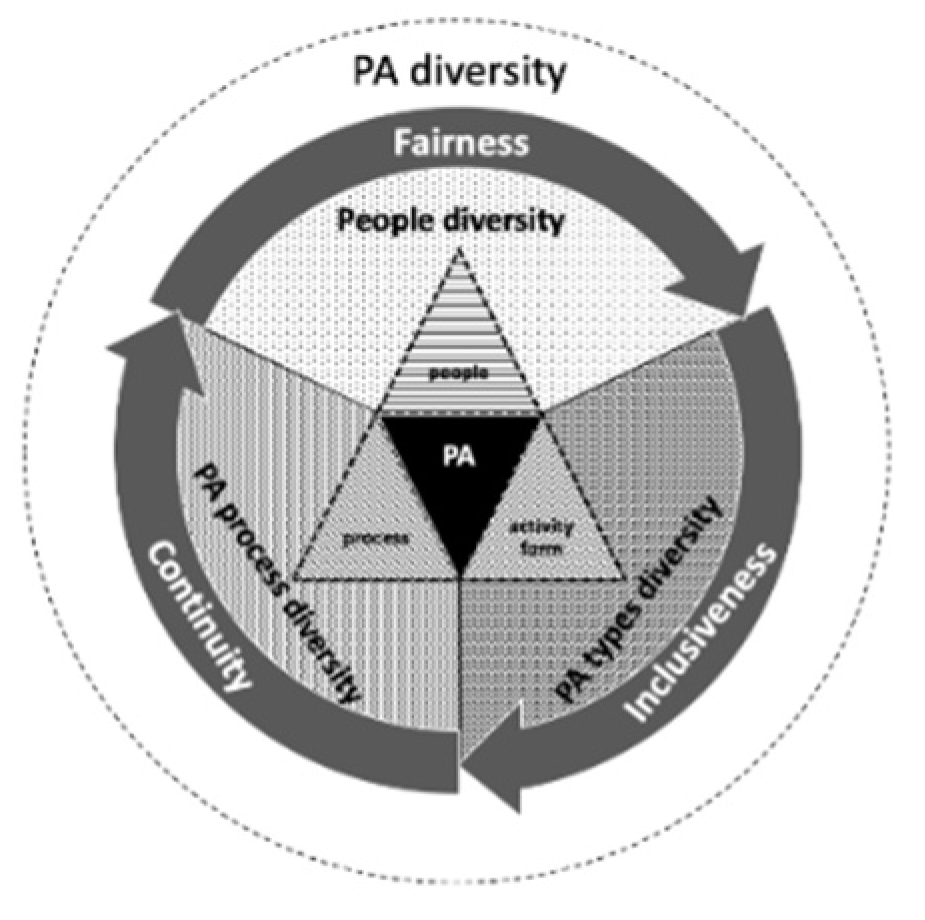
2.4. Measurements
2.4.1. Measurements Unit
2.4.2. Dependent Variable
2.4.3. Independent Variables
2.4.4. Covariates
2.5. Data Merging and Statistical Analysis
3. Results
3.1. Descriptive Characteristics
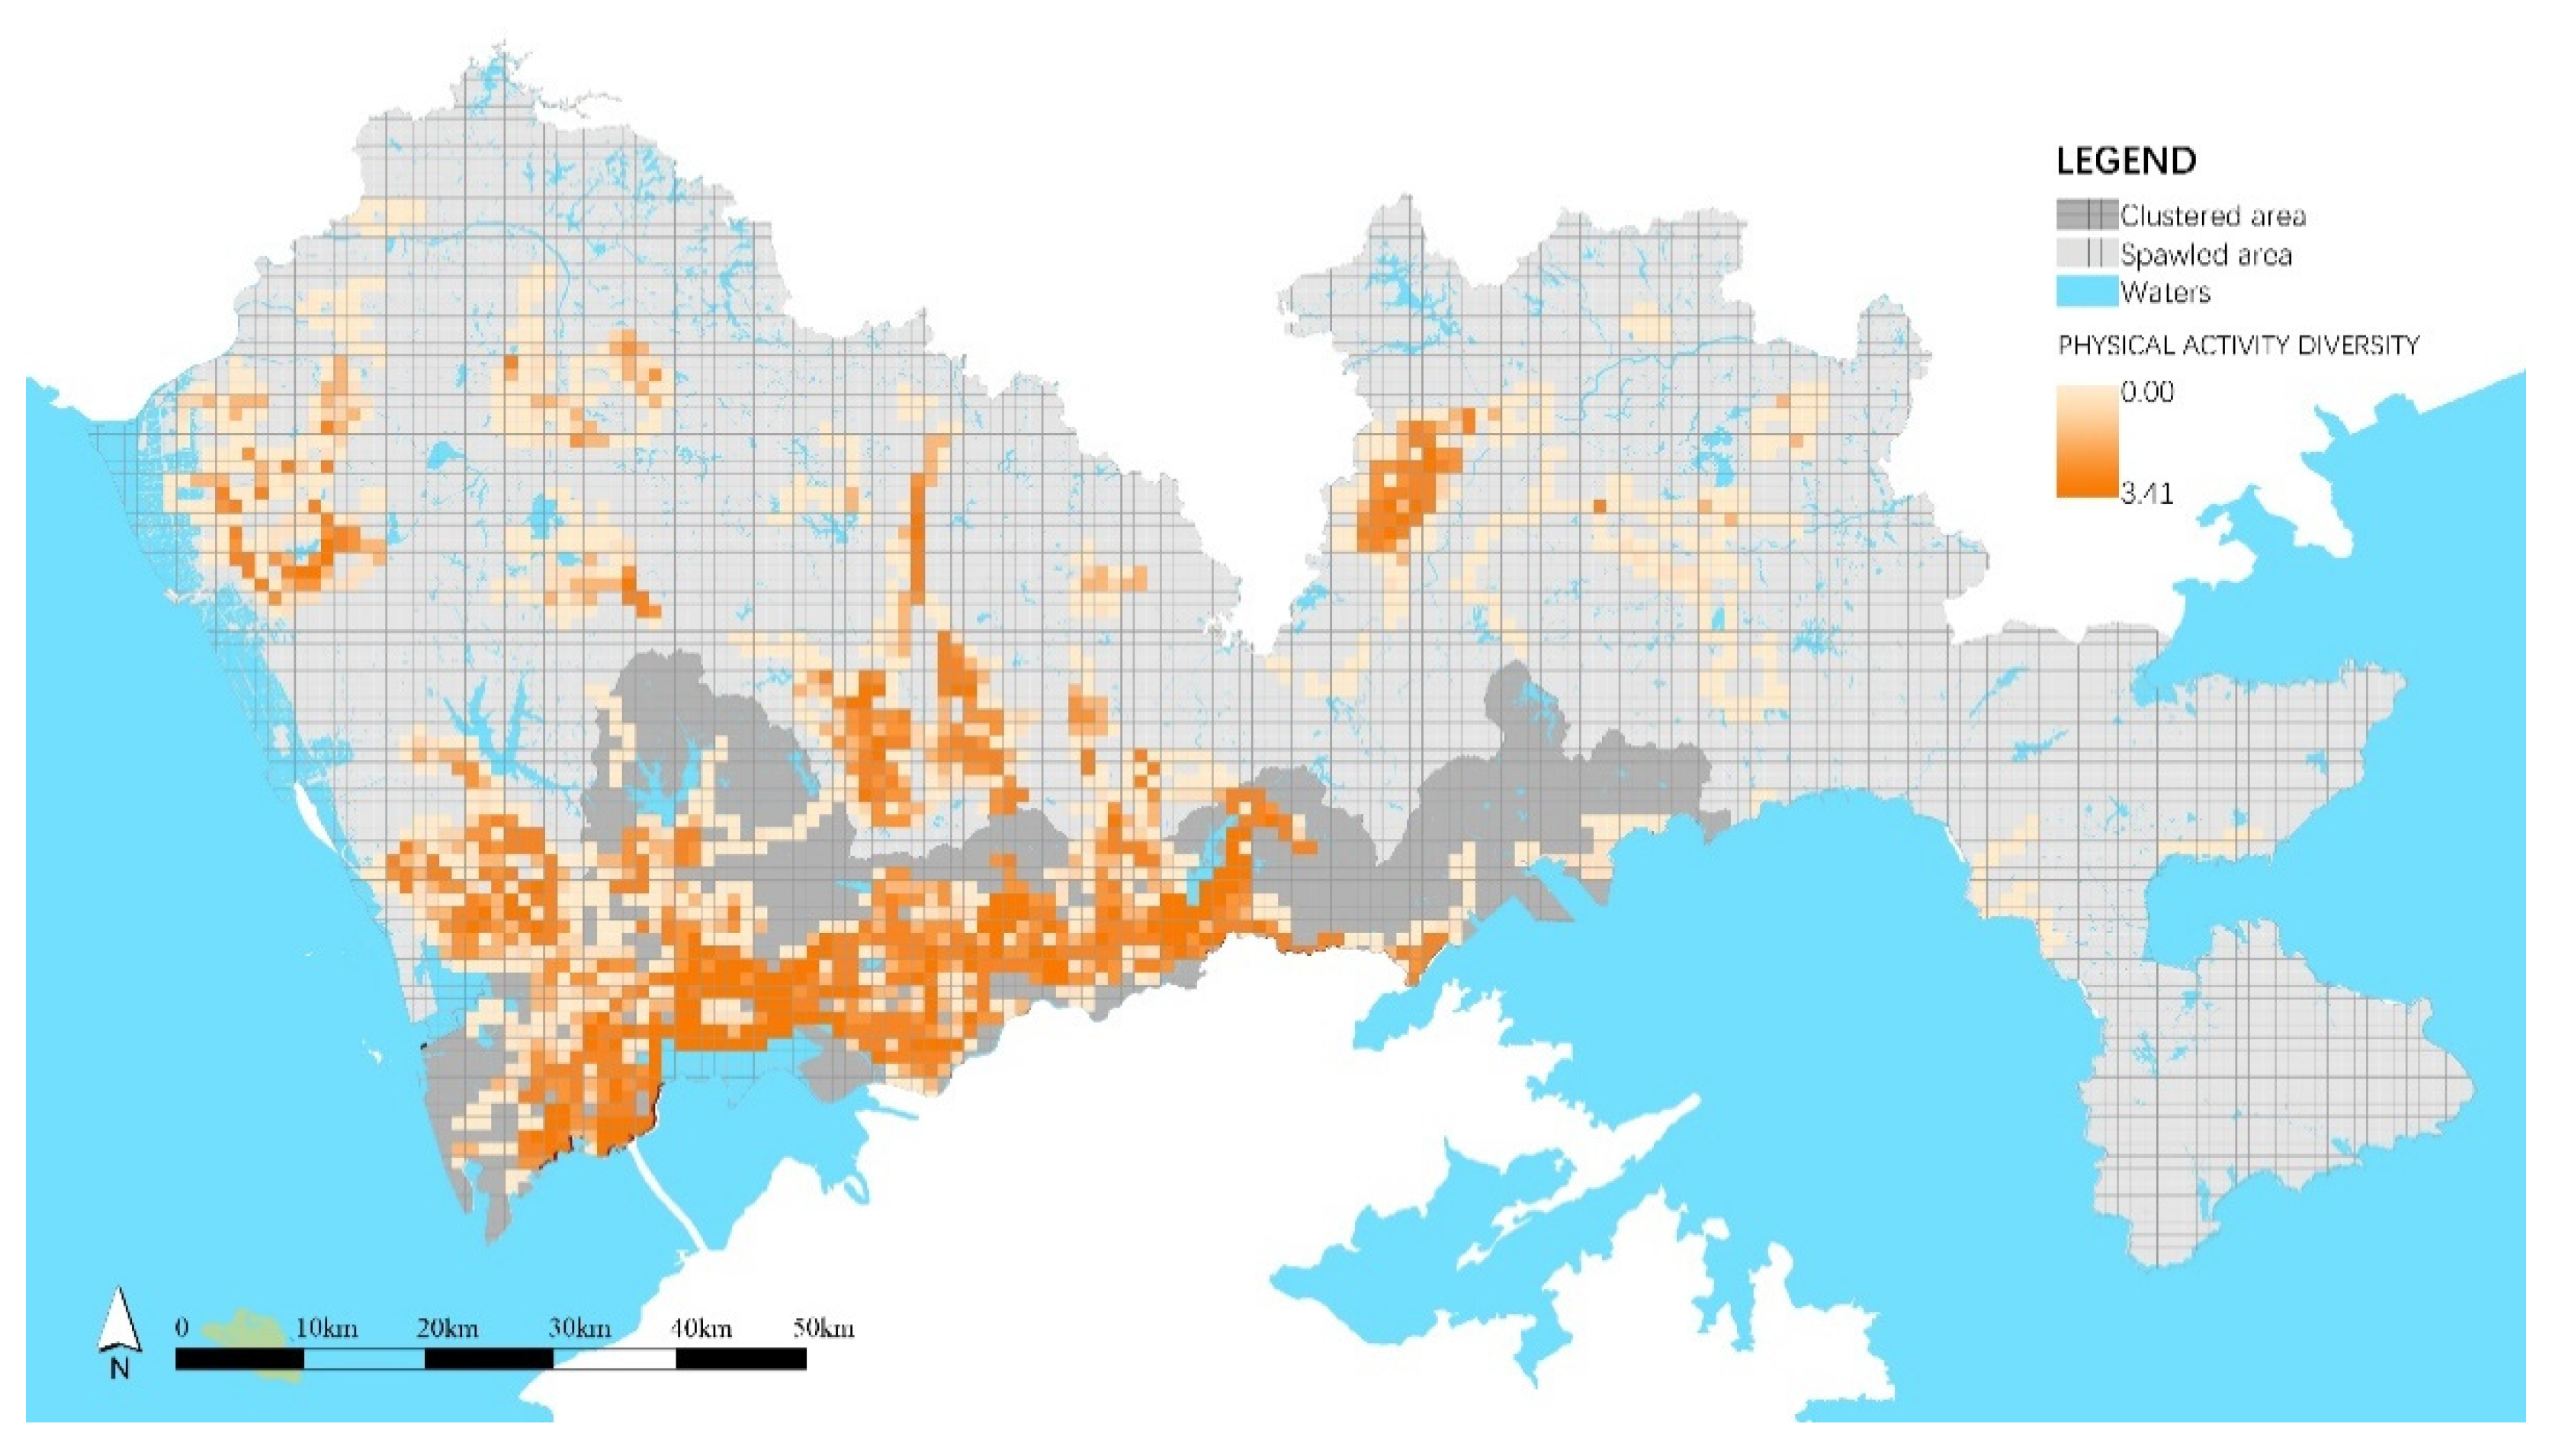
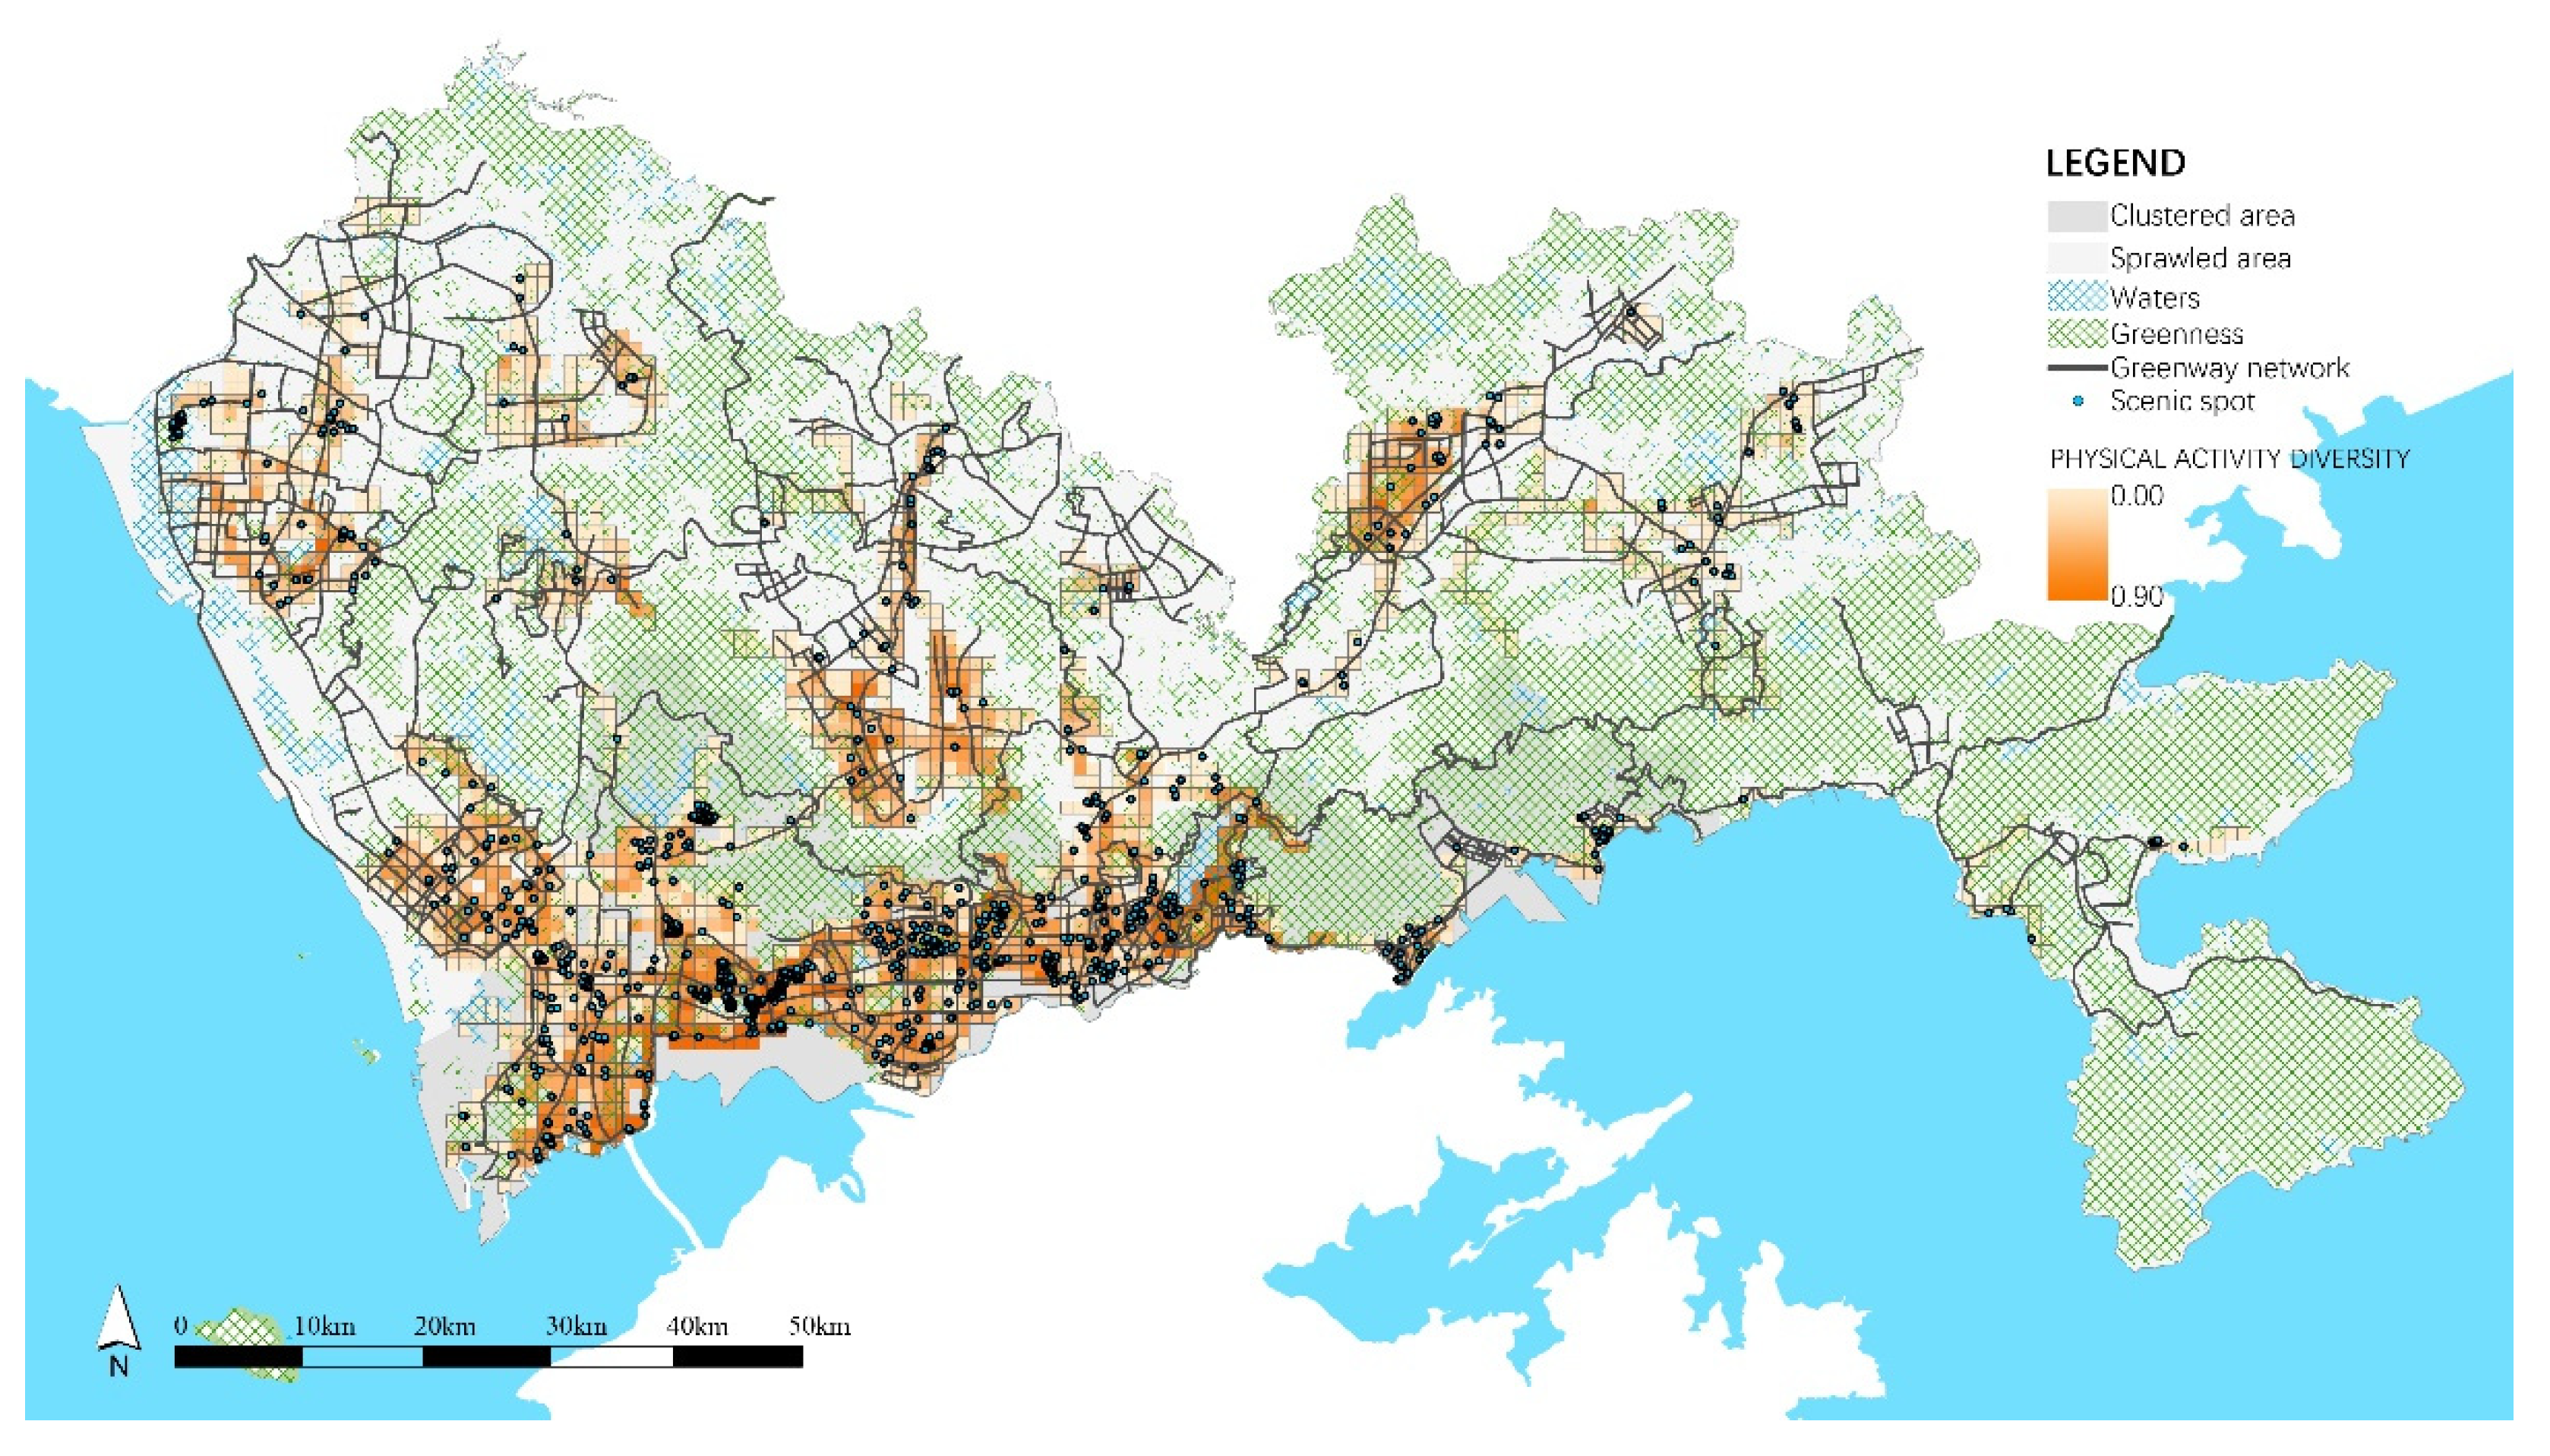
3.1.1. PA Diversity and Spatial Distribution
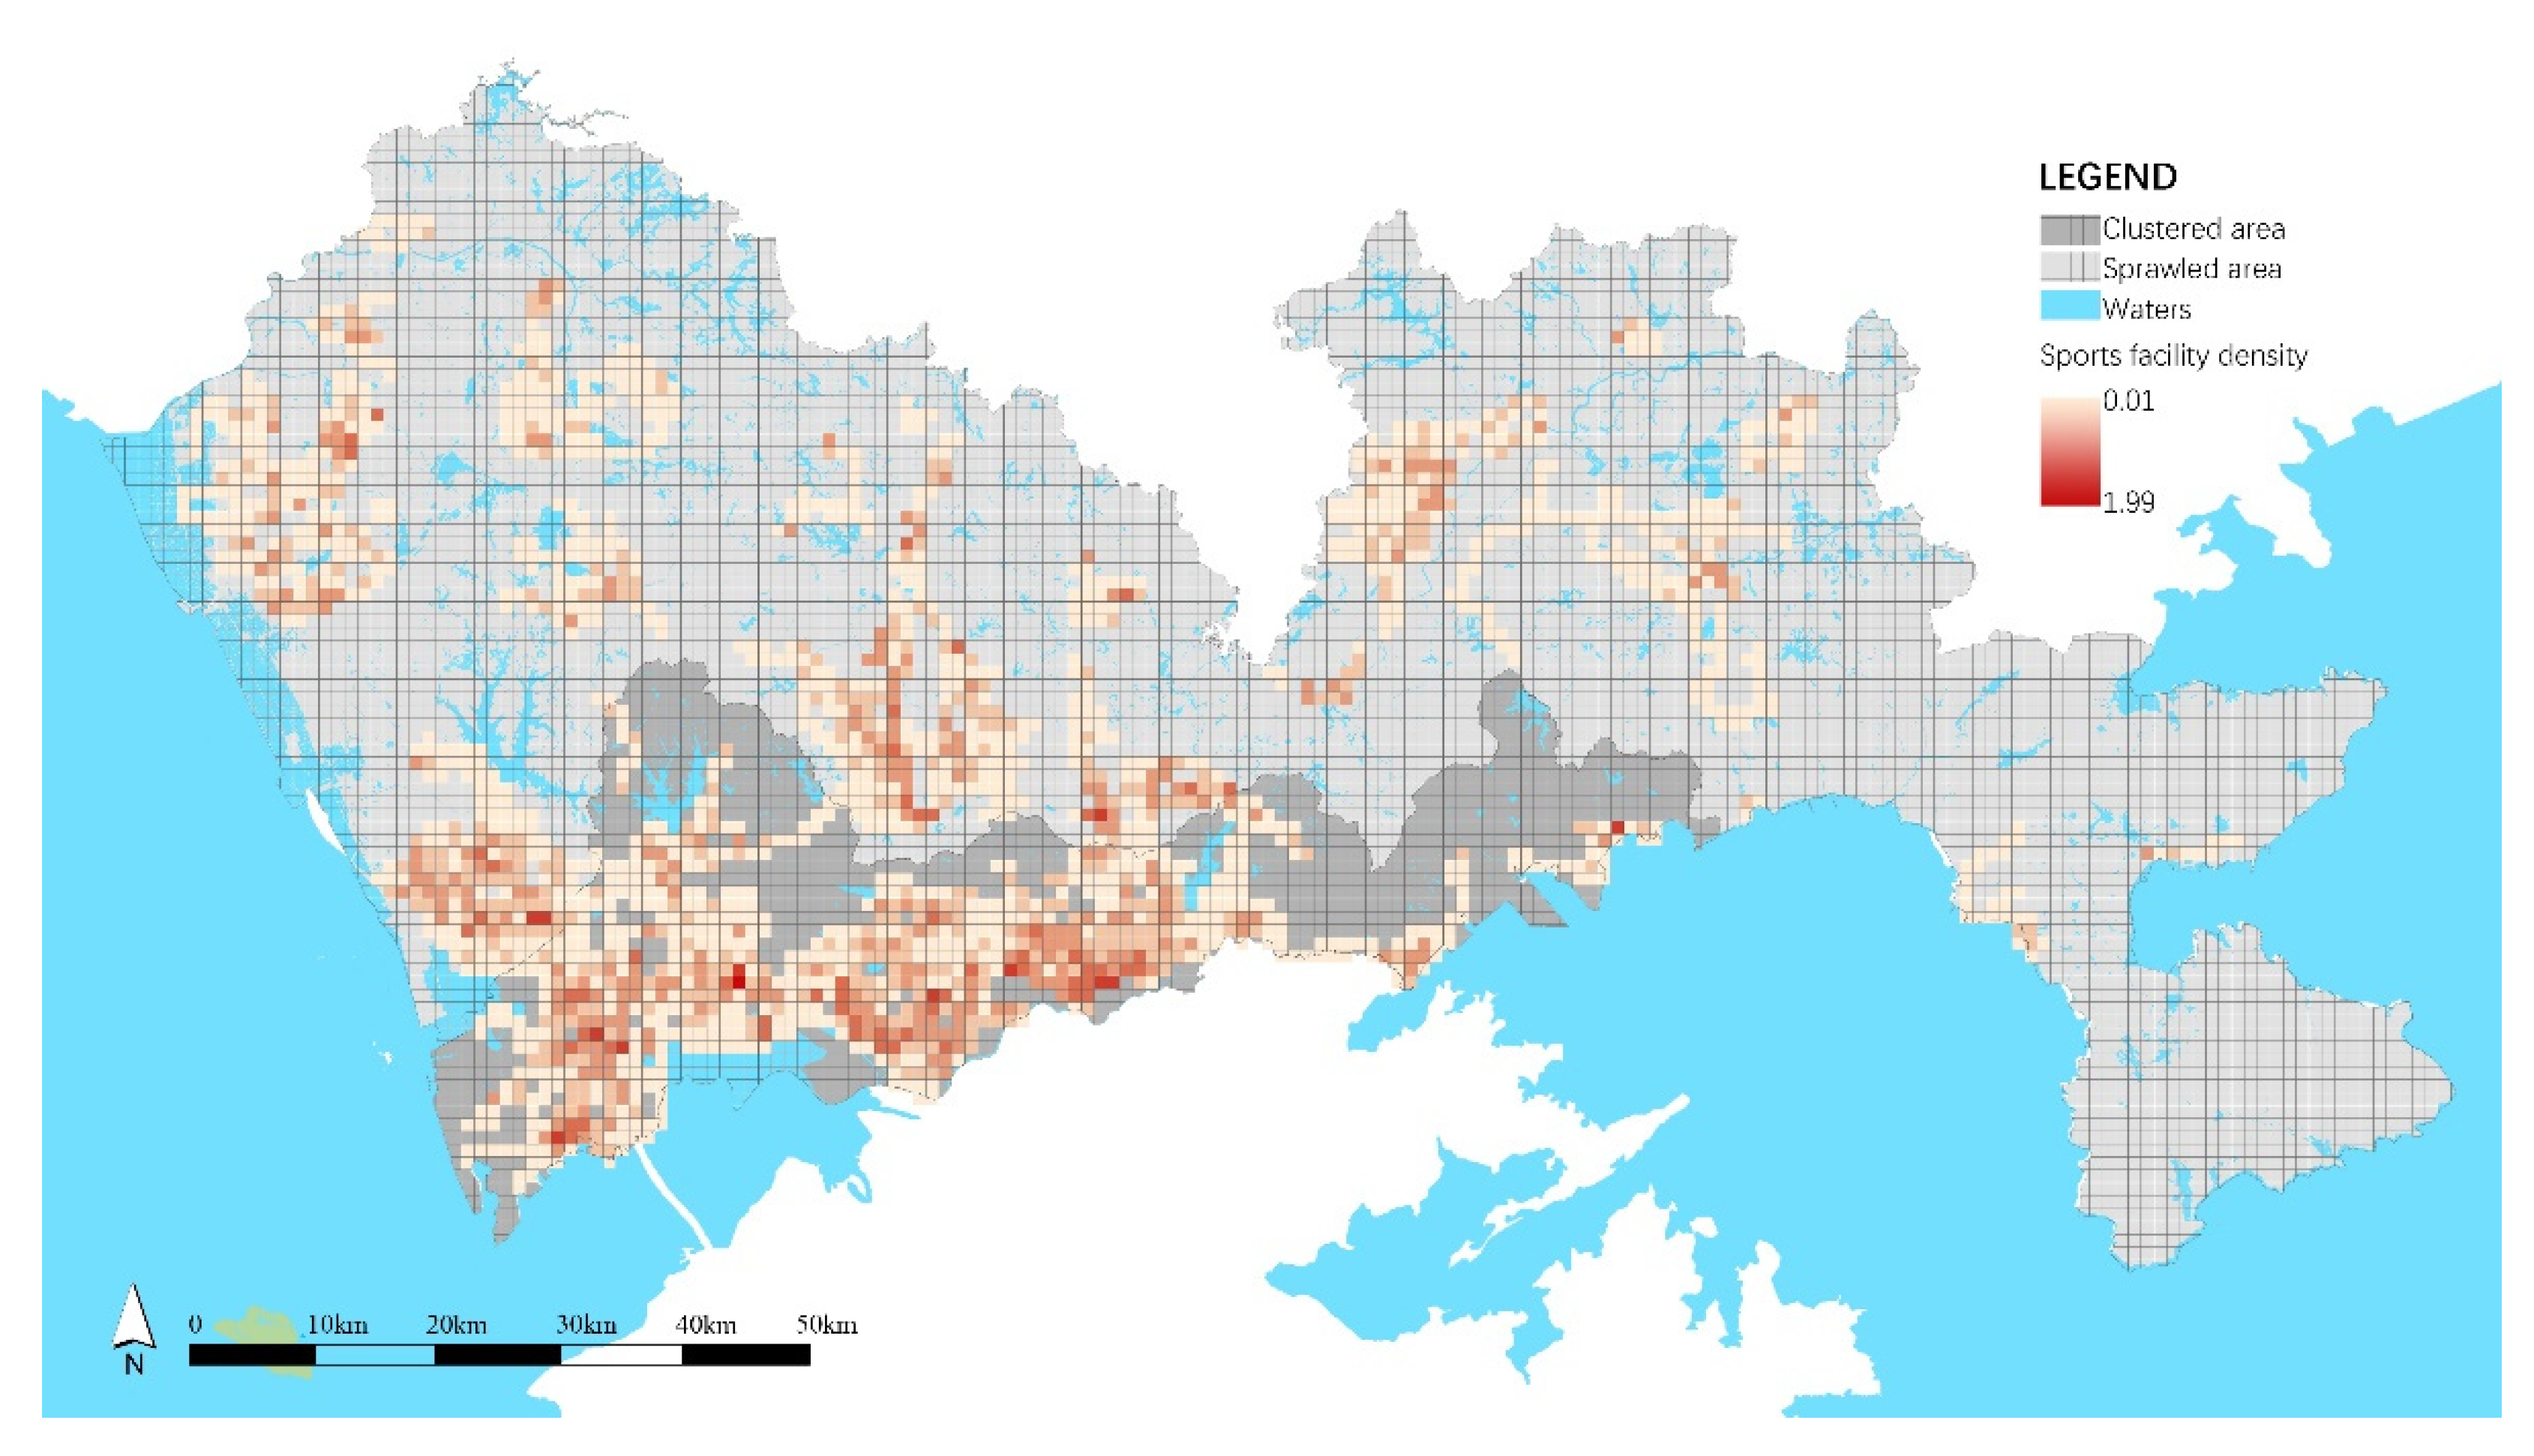
3.1.2. The Characteristics of the Residential Built Environment
3.2. Statistical Modelling Results
4. Discussion
4.1. The Important Role of Accessibility
4.2. The Negative Effects of Utility on PA Diversity
4.3. The Co-Occurrence Effects of Inclusiveness on PAs
4.4. The Aggregation Effects of Landscape Attractiveness on PA Diversity
4.5. The Joint Effects of the Built Environment on PA Diversity
4.6. Advantages of Clustered Areas for Promoting Healthy and Vital Urban Life in High-Density Cities
4.7. Limitations
5. Conclusions
Author Contributions
Funding
Institutional Review Board Statement
Informed Consent Statement
Data Availability Statement
Acknowledgments
Conflicts of Interest
References
- Dishman, R.K.; Heath, G.W.; Lee, I.-M. Physical Activity Epidemiology; Human Kinetics: Champaign, IL, USA, 2012. [Google Scholar]
- Nelson, M.E.; Rejeski, W.J.; Blair, S.N.; Duncan, P.W.; Judge, J.O.; King, A.C.; Macera, C.A.; Castaneda-Sceppa, C. Physical activity and public health in older adults: Recommendation from the American College of Sports Medicine and the American Heart Association. Circulation 2007, 116, 1094–1105. [Google Scholar] [CrossRef] [Green Version]
- Ng, Q.X.; Ho, C.Y.X.; Chan, H.W.; Yong, B.Z.J.; Yeo, W.-S. Managing childhood and adolescent attention-deficit/hyperactivity disorder (ADHD) with exercise: A systematic review. Complement. Ther. Med. 2017, 34, 123–128. [Google Scholar] [CrossRef] [PubMed]
- Liu, H.; Li, F.; Li, J.; Zhang, Y. The relationships between urban parks, residents’ physical activity, and mental health benefits: A case study from Beijing, China. J. Environ. Manag. 2017, 190, 223–230. [Google Scholar] [CrossRef]
- Yin, C.; Zhang, J.; Shao, C. Relationships of the multi-scale built environment with active commuting, body mass index, and life satisfaction in China: A GSEM-based analysis. Travel Behav. Soc. 2020, 21, 69–78. [Google Scholar] [CrossRef]
- Wang, X.; Shao, C.; Yin, C.; Guan, L. Disentangling the comparative roles of multilevel built environment on body mass index: Evidence from China. Cities 2021, 110, 103048. [Google Scholar] [CrossRef]
- Lawrence, F.; Kavage, S.; Devlin, A. Health and the Built Environment: A Review; The Canadian Medical Association, Urban Design 4 Health, Ltd.: Vancouver, BC, Canada, 2012. [Google Scholar]
- Alfonzo, M.; Boarnet, M.G.; Day, K.; Mcmillan, T.; Anderson, C.L. The relationship of neighbourhood built environment features and adult parents’ walking. J. Urban Des. 2008, 13, 29–51. [Google Scholar] [CrossRef]
- Frank, L.; Engelke, P.; Schmid, T. Health and Community Design: The Impact of the Built Environment on Physical Activity; Island Press: Washington, DC, USA, 2003. [Google Scholar]
- Frank, L.D.; Schmid, T.L.; Sallis, J.F.; Chapman, J.; Saelens, B.E. Linking objectively measured physical activity with objectively measured urban form: Findings from SMARTRAQ. Am. J. Prev. Med. 2005, 28, 117–125. [Google Scholar] [CrossRef]
- Cao, X.; Handy, S.L.; Mokhtarian, P.L. The influences of the built environment and residential self-selection on pedestrian behavior: Evidence from Austin, TX. Transportation 2006, 33, 1–20. [Google Scholar] [CrossRef] [Green Version]
- Chatman, D.G. Residential choice, the built environment, and nonwork travel: Evidence using new data and methods. Environ. Plan. A 2009, 41, 1072–1089. [Google Scholar] [CrossRef]
- Frank, L.D.; Pivo, G. Impacts of mixed use and density on utilization of three modes of travel: Single-occupant vehicle, transit, and walking. Transp. Res. Rec. 1994, 1466, 44–52. [Google Scholar]
- Li, F. Physical activity and health in the presence of China’s economic growth: Meeting the public health challenges of the aging population. J. Sport Health Sci. 2016, 5, 258–269. [Google Scholar] [CrossRef] [PubMed] [Green Version]
- Forsyth, A.; Oakes, J.M.; Schmitz, K.H.; Hearst, M. Does residential density increase walking and other physical activity? Urban Stud. 2007, 44, 679–697. [Google Scholar] [CrossRef]
- Chaudhury, H.; Mahmood, A.; Michael, Y.L.; Campo, M.; Hay, K. The influence of neighborhood residential density, physical and social environments on older adults’ physical activity: An exploratory study in two metropolitan areas. J. Aging Stud. 2012, 26, 35–43. [Google Scholar] [CrossRef]
- Saxton-Ross, A. Physical Activity and the Urban Form: How the Built Environment, Residential Density, Residential Segregation, Income Inequality, Race, Gender and Education, Influence Physical Activity in Atlanta. Ph.D. Thesis, Howard University, Ann Arbor, MI, USA, 2009; p. 188. [Google Scholar]
- Chen, T.-L.; Chiu, H.-W.; Lin, Y.-F. How do East and Southeast Asian Cities Differ from Western Cities? A Systematic Review of the Urban Form Characteristics. Sustainability 2020, 12, 2423. [Google Scholar] [CrossRef] [Green Version]
- He, H.; Li, T.; Yu, Y.; Lin, X. Associations between Built Environment Characteristics and Walking in Older Adults in a High-Density City: A Study from a Chinese Megacity. Front. Public Health 2020, 8, 577140. [Google Scholar] [CrossRef]
- Howley, P.; Scott, M.; Redmond, D. Sustainability versus liveability: An investigation of neighbourhood satisfaction. J. Environ. Plan. Manag. 2009, 52, 847–864. [Google Scholar] [CrossRef]
- Banister, D.; Hickman, R. How to design a more sustainable and fairer built environment: Transport and communications. In IEE Proceedings-Intelligent Transport Systems; IET: London, UK, 2006; pp. 276–291. [Google Scholar]
- Talen, E. Design for Diversity; Routledge: London, UK, 2012. [Google Scholar]
- Wang, M.; Qiu, M.; Chen, M.; Zhang, Y.; Zhang, S.; Wang, L. How does urban green space feature influence physical activity diversity in high-density built environment? An on-site observational study. Urban For. Urban Green. 2021, 62, 127129. [Google Scholar] [CrossRef]
- Thompson, C.W. Urban open space in the 21st century. Landsc. Urban Plan. 2020, 60, 59–72. [Google Scholar] [CrossRef]
- Lee, R.E.; Cubbin, C.; Winkleby, M. Contribution of neighbourhood socioeconomic status and physical activity resources to physical activity among women. J. Epidemiol. Community Health 2007, 61, 882–890. [Google Scholar] [CrossRef] [Green Version]
- WHO. WHO Guidelines on Physical Activity and Sedentary Behaviour, Guideline. 2020. Available online: https://www.who.int/publications/i/item/9789240015128 (accessed on 25 November 2020).
- Wang, F. Urban Planning in Shenzhen: Impact and Reply in Rapid Growth. Urban Plan. Forum 2008, 02, 17–23. [Google Scholar]
- Liu, K.; Li, G.; Yin, X.; Xu, L. Towards Multi-dimensional Flexibility: The Evolution of Planning. Urban Plan. Forum 2012, 01, 63–70. [Google Scholar]
- Tang, W.; Mokhtarian, P.L.; Handy, S.L. The impact of the residential built environment on work at home adoption and frequency: An example from Northern California. J. Transp. Land Use 2011, 4, 3–22. [Google Scholar]
- Humpel, N.; Owen, N.; Leslie, E. Environmental factors associated with adults’ participation in physical activity: A review. Am. J. Prev. Med. 2002, 22, 188–199. [Google Scholar] [CrossRef]
- Lee, S.A.; Ju, Y.J.; Lee, J.E.; Hyun, I.S.; Nam, J.Y.; Han, K.-T.; Park, E.-C. The relationship between sports facility accessibility and physical activity among Korean adults. BMC Public Health 2016, 16, 893. [Google Scholar] [CrossRef] [PubMed] [Green Version]
- Wang, Z.; Lee, C. Site and neighborhood environments for walking among older adults. Health Place 2010, 16, 1268–1279. [Google Scholar] [CrossRef] [PubMed]
- An, R.; Zheng, J. Proximity to an exercise facility and physical activity in China. Southeast Asian J. Trop. Med. Public Health 2014, 45, 1483. [Google Scholar]
- Su, M.; Tan, Y.-Y.; Liu, Q.-M.; Ren, Y.-J.; Kawachi, I.; Li, L.-M.; Lv, J. Association between perceived urban built environment attributes and leisure-time physical activity among adults in Hangzhou, China. Prev. Med. 2014, 66, 60–64. [Google Scholar] [CrossRef] [PubMed] [Green Version]
- Wells, N.M.; Yang, Y. Neighborhood design and walking: A quasi-experimental longitudinal study. Am. J. Prev. Med. 2008, 34, 313–319. [Google Scholar] [CrossRef] [PubMed]
- Montgomery, J. Making a city: Urbanity, vitality and urban design. J. Urban Des. 1998, 3, 93–116. [Google Scholar] [CrossRef]
- Cuthbert, A.R. Designing Cities: Critical Readings in Urban Design; Blackwell Publishing: Malden, MA, USA, 2003. [Google Scholar]
- Widiastuti, R.; Harsritanto, B.I. Implementing mixed land use rooting jane jacobs’concept of diversity in urban sustainability. Modul 2017, 17, 27–35. [Google Scholar]
- Greenwald, M.J.; Boarnet, M.G. Built environment as determinant of walking behavior: Analyzing nonwork pedestrian travel in Portland, Oregon. Transp. Res. Rec. 2001, 1780, 33–41. [Google Scholar] [CrossRef] [Green Version]
- Boarnet, M.G.; Greenwald, M.; McMillan, T.E. Walking, urban design, and health: Toward a cost-benefit analysis framework. J. Plan. Educ. Res. 2008, 27, 341–358. [Google Scholar] [CrossRef]
- Coogan, P.F.; White, L.F.; Adler, T.J.; Hathaway, K.M.; Palmer, J.R.; Rosenberg, L. Prospective study of urban form and physical activity in the Black Women’s Health Study. Am. J. Epidemiol. 2009, 170, 1105–1117. [Google Scholar] [CrossRef] [PubMed] [Green Version]
- Boone-Heinonen, J.; Guilkey, D.K.; Evenson, K.R.; Gordon-Larsen, P. Residential self-selection bias in the estimation of built environment effects on physical activity between adolescence and young adulthood. Int. J. Behav. Nutr. Phys. Act. 2010, 7, 70. [Google Scholar] [CrossRef] [PubMed] [Green Version]
- Handy, S.; Cao, X.; Mokhtarian, P.L. Self-selection in the relationship between the built environment and walking: Empirical evidence from Northern California. J. Am. Plan. Assoc. 2006, 72, 55–74. [Google Scholar] [CrossRef]
- Handy, S.L.; Cao, X.; Mokhtarian, P.L. The causal influence of neighborhood design on physical activity within the neighborhood: Evidence from Northern California. Am. J. Health Promot. 2008, 22, 350–358. [Google Scholar] [CrossRef] [Green Version]
- Cao, X.J.; Mokhtarian, P.L.; Handy, S.L. The relationship between the built environment and nonwork travel: A case study of Northern California. Transp. Res. Part A Policy Pract. 2009, 43, 548–559. [Google Scholar] [CrossRef]
- Gao, Y.; Liu, K. Planning for diverse slow activities of Shenzhen Greenway. Planners 2019, 35, 39–45. [Google Scholar]
- Meurs, H.; Haaijer, R. Spatial structure and mobility. Transp. Res. Part D Transp. Environ. 2001, 6, 429–446. [Google Scholar] [CrossRef]
- Hou, N.; Popkin, B.M.; Jacobs, D.R., Jr.; Song, Y.; Guilkey, D.; Lewis, C.E.; Gordon-Larsen, P. Longitudinal associations between neighborhood-level street network with walking, bicycling, and jogging: The CARDIA study. Health Place 2010, 16, 1206–1215. [Google Scholar] [CrossRef] [PubMed] [Green Version]
- Chengdu Codoon Technology Co., Ltd., Chengdu, China. Analysis of the Development of China’s Sports Social Platform “Codoon” in 2017. 2017. Available online: https://www.chyxx.com/industry/201709/560616.html (accessed on 8 September 2017).
- Shenzhen Bureau of Statistics, Shenzhen, China. Shenzhen Social Gender Statistics Report. 2017. Available online: http://www.sz.gov.cn/attachment/0/62/62974/1333646.pdf (accessed on 28 April 2017).
- Liu, K.; Siu, K.W.M.; Gong, X.Y.; Gao, Y.; Lu, D. Where do networks really work? The effects of the Shenzhen greenway network on supporting physical activities. Landsc. Urban Plan. 2016, 152, 49–58. [Google Scholar] [CrossRef] [Green Version]
- Langford, M. The areal interpolation problem: Estimating population using remote sensing in a GIS framework. In Handling Geographical Information: Methodology and Potential Applications; Longman Pub Group: London, UK, 1991; pp. 55–77. [Google Scholar]
- Mennis, J. Generating surface models of population using dasymetric mapping. Prof. Geogr. 2003, 55, 31–42. [Google Scholar]
- Josey, M.J.; Moore, S. The influence of social networks and the built environment on physical inactivity: A longitudinal study of urban-dwelling adults. Health Place 2018, 54, 62–68. [Google Scholar] [CrossRef] [PubMed]
- Puhakka, S.; Pyky, R.; Lankila, T.; Kangas, M.; Rusanen, J.; Ikäheimo, T.M.; Koivumaa-Honkanen, H.; Korpelainen, R. Physical activity, residential environment, and nature relatedness in young men—A population-based MOPO study. Int. J. Environ. Res. Public Health 2018, 15, 2322. [Google Scholar] [CrossRef] [PubMed] [Green Version]
- Breda, J. Transforming public spaces to promote physical activity—A key contributor to achieving the Sustainable Development Goals in Europe. Eur. J. Public Health 2018, 28 (Suppl. 4), cky213–cky599. [Google Scholar] [CrossRef]
- Yue, T.X.; Wang, Y.A.; Liu, J.Y.; Chen, S.P.; Qiu, D.S.; Deng, X.Z.; Liu, M.L.; Tian, Y.Z.; Su, B.P. Surface modelling of human population distribution in China. Ecol. Model. 2005, 181, 461–478. [Google Scholar] [CrossRef]
- Steinnocher, K.; Köstl, M.; Weichselbaum, J. Grid-based population and land take trend indicators–new approaches introduced by the geoland2 core Information Service for Spatial Planning. In NTTS Conference, Brussels; NTTS Conference: Brussels, Belgium, 2011. [Google Scholar]
- Zhang, C.; Wan, Q.; Zhang, J.; Okada, N.; Li, H. The method of flood disaster risk evaluation based upon data of grid square. Geo-Inf. Sci. 2003, 4, 69–73. [Google Scholar]
- Ellis, G.; Hunter, R.; Tully, M.A.; Donnelly, M.; Kelleher, L.; Kee, F. Connectivity and physical activity: Using footpath networks to measure the walkability of built environments. Environ. Plan. B Plan. Des. 2016, 43, 130–151. [Google Scholar] [CrossRef] [Green Version]
- Song, Y.; Rodríguez, D.A. The Measurement of the Level of Mixed Land Uses: A Synthetic Approach; Carolina Transportation Program White Paper Series; University of North Carolina: Chapel Hill, NC, USA, 2005. [Google Scholar]
- Saelens, B.E.; Handy, S.L. Built environment correlates of walking: A review. Med. Sci. Sports Exerc. 2008, 40 (Suppl. 7), S550. [Google Scholar] [CrossRef] [Green Version]
- Li, P.; Zhang, Y. The size of the Chinese middle class, identity and social attitudes. Society 2008, 28, 1–19. [Google Scholar]
- Shanghai Federation of social Science Associations, Shanghai, China. Ranking List of Housing Price to Income Ratio in 35 Large and Medium Cities in China. Available online: http://finance.sina.com.cn/china/gncj/2016-04-14/doc-ifxriqqv5658227.shtml (accessed on 14 April 2017).
- Shenzhen Housing and Construction Bureau, Shenzhen, China. Waiting for Application Conditions for Public Rental Housing. Available online: http://zjj.sz.gov.cn/hdjl/ywzs/content/post_3683244.html (accessed on 8 December 2016).
- Hao, P.; Sliuzas, R.; Geertman, S. The development and redevelopment of urban villages in Shenzhen. Habitat Int. 2011, 35, 214–224. [Google Scholar] [CrossRef]
- Gang, W. Research on Housing Affordability: 2000—2008 Evidence from 10 Chinese Cities. Urban Stud. 2009, 9, 20–25. [Google Scholar]
- National Bureau of Statistics, Shenzhen Bureau of Investigation, Shenzhen, China. Shenzhen 2016 National Economic and Social Development Statistical Bulletin. Available online: http://www.sz.gov.cn/cn/xxgk/zfxxgj/tjsj/tjgb/content/post_1333706.html (accessed on 28 April 2017).
- Wu, Z.-J.; Song, Y.; Wang, H.-L.; Zhang, F.; Li, F.-H.; Wang, Z.-Y. Influence of the built environment of Nanjing’s Urban Community on the leisure physical activity of the elderly: An empirical study. BMC Public Health 2019, 19, 1459. [Google Scholar] [CrossRef] [PubMed]
- Hanibuchi, T.; Kawachi, I.; Nakaya, T.; Hirai, H.; Kondo, K. Neighborhood built environment and physical activity of Japanese older adults: Results from the Aichi Gerontological Evaluation Study (AGES). BMC Public Health 2011, 11, 657. [Google Scholar] [CrossRef] [PubMed] [Green Version]
- Yang, M.; Rosenberg, M.W.; Li, J. Spatial variability of health inequalities of older people in China and related health factors. Int. J. Environ. Res. Public Health 2020, 17, 1739. [Google Scholar] [CrossRef] [PubMed] [Green Version]
- Ying, L.; Yin, Z. Quantitative evaluation on street vibrancy and its impact factors: A case study of Chengdu. New Archit. 2016, 1, 52–57. [Google Scholar]
- Feng, J.; Yang, Z. Factors influencing travel behavior of urban elderly people in Nanjing. Prog. Geogr. 2015, 34, 1598–1608. [Google Scholar]
- Feidong, L.; Shaohua, T. Built environment’s influence on physical activity: Review and thought. Urban Plan. Int. 2015, 30, 62–70. [Google Scholar]
- Meteorological Bureau of Shenzhen Municipality, Shenzhen, China. 2015 Shenzhen Climate Bulletin. Available online: http://weather.sz.gov.cn/qixiangfuwu/qihoufuwu/qihouguanceyupinggu/nianduqihougongbao/content/post_3578341.html. (accessed on 28 February 2016).


| The Dimension of Diversity | Measure |
|---|---|
| PAPD | (1) where k1 = number of social class types, according to income (k = 4: lower-income class, low-income class, middle-income class, high-income class); p1 = the proportion of the PA distance of each social class to the PA distance of all people in each 500 m grid. |
| PATD | (2) where k2 = number of physical activity types (k = 3: cycling, walking, jogging); p2 = the proportion of each type of activity distance to all activity distances in each 500 m grid. |
| PAOD | (3) where k3 = number of physical activity times (k = 4: from 00:00 to 06:00, from 06:00 to 12:00, from 12:00 to 18:00, from 18:00 to 24:00); p3 = the proportion of the PA distance of each time period to the PA distance of all time periods in each 500 m2 grid. |
| Classification | HPIR | y | n |
|---|---|---|---|
| high-income level | 27.7 [64] | 80 m2 [67] | ≥18,773 USD [63,68] |
| middle-income level | 80 m2 [67] | 18,773–7509 USD [63,68] | |
| low-income level | 60 m2 [67] | 7509–3755 USD [63,68] | |
| lower-income level | 60 m2 [67] | ≤3755 USD [63,68] |
| Initial Eigenvalues | Extraction Sums of Squared Loadings | |||||
|---|---|---|---|---|---|---|
| Component | Total | %Variance | Cumulative% | Total | %Variance | Cumulative% |
| Factor 1 | 2.339 | 77.981 | 77.981 | 2.339 | 77.981 | 77.981 |
| Factor 2 | 0.389 | 12.956 | 90.937 | - | - | - |
| Factor 3 | 0.272 | 9.063 | 100.00 | - | - | - |
| Variable | Measure |
|---|---|
| Accessibility | |
| Street network density | The total length of streets per unit area |
| Bus station density | Number of bus stops per unit area |
| Service facility density | Number of service facilities per unit area |
| Utility | |
| Population density | The ratio of residential building area to total building area per unit area |
| Restaurant density | Number of service facilities per unit area |
| Land use mixture | Shannon’s Diversity Index was used to calculate the land-use mixture, which varied between 0 and 1 (0 for maximum specialization, 1 for maximum diversification) where k4 = number of land use types (k = 9: residential land, commercial land, government and institutional land, industrial land, warehouse land, street land, infrastructure land, parklands, and other lands); p4 = the proportion of each type of land within the 500 m grid. |
| Inclusiveness | |
| Greenway network density | The total length of the greenways per unit area |
| Sports facility density | Number of sports facilities per unit area |
| Landscape attractiveness | |
| Green space ratio | The proportion of green space per unit area |
| Scenic spot density | Number of scenic spots per unit area |
| Variable | Model 1 | Model 2 | Model 3 |
|---|---|---|---|
| Overall | Clustered Area | Sprawled Area | |
| Accessibility | |||
| Street network density | Positive | Positive | Positive |
| Bus station density | Positive | Positive | Positive |
| Service facility density | Positive | Positive | Positive |
| Utility | |||
| Population density | Positive | Positive | Positive |
| The proportion of commercial land | Positive | Positive | Positive |
| Land use mixture | Positive | Positive | Positive |
| Inclusiveness | |||
| Greenway network density | Positive | Positive | Positive |
| Sports facility density | Positive | Positive | Positive |
| Landscape attractiveness | |||
| Green space ratio | Positive | Positive | Positive |
| Scenic spot density | Positive | Positive | Positive |
| Temperature ≤ 28 °C | Positive | Positive | Positive |
| Weekend | Positive | Positive | Positive |
| Mean | Maximum | Minimum | Standard Deviation | |
|---|---|---|---|---|
| Clustered area | 1.5162 | 3.4100 | 0.0700 | 1.0351 |
| Sprawled area | 0.6767 | 3.2000 | 0.0000 | 0.8274 |
| Overall | 1.0000 | 3.4100 | 0.0000 | 1.0000 |
| Variables | Mean | ||
|---|---|---|---|
| Overall | Clustered Area | Sprawled Area | |
| Accessibility | |||
| Street network density (km/km2) | 8.484 | 12.220 | 6.141 |
| Bus station density (Pcs/km2) | 54.330 | 69.389 | 44.901 |
| Service facility density (Pcs/km2) | 32.015 | 39.849 | 27.110 |
| Utility | |||
| Population density (5900 person/km2) | 0.071 | 0.066 | 0.073 |
| Restaurants density (Pcs/km2) | 0.033 | 0.045 | 0.026 |
| Land use mixture | 0.454 | 0.468 | 0.446 |
| Inclusiveness | |||
| Greenway network density (km/km2) | 1.729 | 1.784 | 1.695 |
| Sports facility density (Pcs/km2) | 8.562 | 12.068 | 6.367 |
| Landscape attractiveness | |||
| Green space ratio | 0.208 | 0.206 | 0.209 |
| Scenic spot density | 2.308 | 4.313 | 1.053 |
| Variables | Mean | ||||||||||
|---|---|---|---|---|---|---|---|---|---|---|---|
| Overall | Clustered Area | Sprawled Area | |||||||||
| B | Beta | Sig. | B | Beta | Sig. | B | Beta | Sig. | |||
| Accessibility | |||||||||||
| Street network density | 0.025 | 0.183 | 0.000 | 0.005 | 0.038 | 0.242 | 0.025 | 0.178 | 0.000 | ||
| Bus station density | 0.001 | 0.067 | 0.003 | 0.001 | 0.051 | 0.156 | 0.001 | 0.060 | 0.050 | ||
| Service facility density | 0.003 | 0.117 | 0.000 | 0.001 | 0.038 | 0.409 | 0.004 | 0.206 | 0.000 | ||
| Utility | |||||||||||
| Population density | −0.575 | −0.044 | 0.075 | −0.562 | −0.041 | 0.291 | −0.814 | −0.077 | 0.031 | ||
| Restaurants density | −0.001 | −0.033 | 0.254 | 0.000 | 0.037 | 0.411 | −0.001 | −0.022 | 0.613 | ||
| Land use mixture | −0.235 | −0.043 | 0.050 | −0.604 | −0.105 | 0.003 | −0.023 | 0.005 | 0.868 | ||
| Inclusiveness | |||||||||||
| Greenway network density | 0.065 | 0.103 | 0.000 | 0.142 | 0.221 | 0.000 | 0.030 | 0.057 | 0.032 | ||
| Sports facility density | 0.005 | 0.073 | 0.003 | 0.006 | 0.103 | 0.008 | −0.001 | −0.010 | 0.774 | ||
| Landscape Attractiveness | |||||||||||
| Green space ratio | 0.260 | 0.067 | 0.003 | 0.297 | 0.076 | 0.043 | 0.057 | 0.017 | 0.578 | ||
| Scenic spot density | 0.008 | 0.084 | 0.000 | 0.005 | 0.076 | 0.010 | 0.006 | 0.024 | 0.331 | ||
| Weekend | 0.525 | 0.263 | 0.000 | 0.794 | 0.356 | 0.000 | 0.314 | 0.190 | 0.000 | ||
| Temperature ≤28 °C | 0.529 | 0.258 | 0.000 | 0.595 | 0.251 | 0.000 | 0.443 | 0.268 | 0.000 | ||
| Constant | −1.015 | 0.000 | −0.717 | - | 0.000 | −1.007 | - | 0.000 | |||
| Adjusted R square | 0.371 | 0.366 | 0.291 | ||||||||
Publisher’s Note: MDPI stays neutral with regard to jurisdictional claims in published maps and institutional affiliations. |
© 2021 by the authors. Licensee MDPI, Basel, Switzerland. This article is an open access article distributed under the terms and conditions of the Creative Commons Attribution (CC BY) license (https://creativecommons.org/licenses/by/4.0/).
Share and Cite
Gao, Y.; Liu, K.; Zhou, P.; Xie, H. The Effects of Residential Built Environment on Supporting Physical Activity Diversity in High-Density Cities: A Case Study in Shenzhen, China. Int. J. Environ. Res. Public Health 2021, 18, 6676. https://doi.org/10.3390/ijerph18136676
Gao Y, Liu K, Zhou P, Xie H. The Effects of Residential Built Environment on Supporting Physical Activity Diversity in High-Density Cities: A Case Study in Shenzhen, China. International Journal of Environmental Research and Public Health. 2021; 18(13):6676. https://doi.org/10.3390/ijerph18136676
Chicago/Turabian StyleGao, Yuan, Kun Liu, Peiling Zhou, and Hongkun Xie. 2021. "The Effects of Residential Built Environment on Supporting Physical Activity Diversity in High-Density Cities: A Case Study in Shenzhen, China" International Journal of Environmental Research and Public Health 18, no. 13: 6676. https://doi.org/10.3390/ijerph18136676
APA StyleGao, Y., Liu, K., Zhou, P., & Xie, H. (2021). The Effects of Residential Built Environment on Supporting Physical Activity Diversity in High-Density Cities: A Case Study in Shenzhen, China. International Journal of Environmental Research and Public Health, 18(13), 6676. https://doi.org/10.3390/ijerph18136676