Article

Spatiotemporal Distribution and Influencing Factors of Ecosystem Vulnerability on Qinghai-Tibet Plateau

1
Key Laboratory of Land Surface Pattern and Simulation, Institute of Geographic Sciences and Natural Resources Research, Chinese Academy of Sciences, Beijing 100101, China
2
College of Resources and Environment, University of Chinese Academy of Sciences, Beijing 100049, China
*
Author to whom correspondence should be addressed.
Int. J. Environ. Res. Public Health 2021, 18(12), 6508; https://doi.org/10.3390/ijerph18126508
Submission received: 30 April 2021 / Revised: 13 June 2021 / Accepted: 15 June 2021 / Published: 16 June 2021
(This article belongs to the Special Issue Land Use Changes and the Corresponding Ecological Risks)

Abstract

:
As the “Third Pole”, the Qinghai-Tibet Plateau is threatened by environmental changes. Ecosystem vulnerability refers to the sensitivity and resilience of ecosystems to external disturbances. However, there is a lack of relevant studies on the driving factors of ecosystem vulnerability. Therefore, based on spatial principal components analysis and geographic detectors methods, this paper evaluates the ecosystem vulnerability and its driving factors on the Qinghai-Tibet Plateau from the years 2005 to 2015. The results were as follows: (1) The ecosystem vulnerability index (EVI) of the Qinghai-Tibet Plateau is mainly heavy and extreme, showing a gradually increasing trend from southeast to northwest. (2) The spatial heterogeneity of the EVI is significant in the southeast and northwest, but not in the southwest and central parts. (3) Analysis of influencing factors shows that environmental factors have more significant effects on EVI than socioeconomic variables, facilitating the proposal of adequate policy implications. More efforts should be devoted to ecological protection and restoration to prevent grassland degradation and desertification in the high-EVI areas in northwest. The government is also urged to improve the ecological compensation mechanisms and balance ecological protection and residents’ development needs in the southeast.

1. Introduction

Ecosystem is the general term for all organisms and environments within a particular space. Ecosystems are complex open systems, mainly including social systems, natural systems and social-natural coupled systems [1]. According to Adger [2], vulnerability is the sensitivity of ecosystem under the stress of natural and social changes due to the lack of adaptability. In recent years, as a result of increased human activities and global climate changes, ecosystems have been under increasing pressure, aggravating their vulnerability towards a series of stressors [3]. Ecosystem vulnerability assessments are therefore critical in global environmental change research [4], providing a decision-making basis and technical support for ecological protection and environmental restoration and governance [5]. Ecosystem vulnerability has become a hot spot of global environmental change and sustainable development research [6,7,8,9]. Understanding the driving mechanisms of regional ecological vulnerability evolution can facilitate the establishment of guidelines for the use and protection of the regional ecological environment [10].
Several studies have considered the impacts of climate change and natural disasters on ecosystem vulnerability. For example, based on the prediction results of temperature and precipitation under low (B1), medium (A1B) and high (A2) emission scenarios, released in the fourth assessment report of the International Panel of Climate Change (IPCC), Gonzalez et al. [11] studied the changes in vegetation vulnerability patterns in global ecosystems in the 21st century. Based on their results, one-tenth to one-half of the global vegetation area may be highly (confidence level 0.80–0.95) to very highly (confidence ≥ 0.95) vulnerable to climatic changes. Similarly, Alexander et al. [12] assessed the vulnerability of tropical ecosystems in southern Ecuador and found differences in ecosystem vulnerability under different climate scenarios. Patrick et al. [13] investigated the vulnerability of 52 major vegetation types in the western United States exposed to changes in temperature and precipitation under RCP 4.5 scenarios (RCP4.5, Representative Concentration Pathway 4.5, a moderate emission scenario proposed by the Coupled Model Intercomparison Project Phase 5). Their results showed that by the middle of the 21st century, 33 vegetation types will be faced with high or very high vulnerability, of which more than 50% will have higher regional vulnerability levels.
In recent years, the vulnerability of different types of ecosystems has gradually been studied, with a higher number of studies on the vulnerability of certain ecosystem systems, such as mining areas, economically developed areas and oceans. For example, Sarah et al. [14] assessed the vulnerability of marine ecosystems in California and found that tidal flats, beaches, salt marshes and intertidal rocky ecosystems were most vulnerable to human activities. Similarly, Zhang et al. [15] investigated the effects of extreme rainfall on ecosystem vulnerability in the middle and lower reaches of the Yangtze River in China and showed that both human-dominated ecosystems (e.g., agro-ecosystems) and natural ecosystems are vulnerable to extreme climate events. The current vulnerability studies of typical ecosystems that are particularly sensitive to global climate change mainly focus on coastal zones [16,17,18] and wetland regions [19,20]. However, there are no studies on the vulnerability of high-elevation ecosystems, such as the Qinghai-Tibet Plateau, the largest and highest plateau in the world. Due to its unique environment, it is highly sensitive to climate change and human activities, with a fragile ecosystem [21].
China is one of the countries with the most vulnerable ecosystem types in the world, and the research on its ecosystem vulnerability began in the 1980s. For example, Niu [22] conducted a study from the perspective of the ecotone. Early studies mainly focused on the impacts of climate change, extreme weather and natural disasters on ecosystems, such as the analysis of the vulnerability of China’s forest ecosystems under global climate change [23]. In the 1990s, socio-economic factors started to become increasingly considered in the assessment of ecosystem vulnerability, such as the relationship between the fragile zone of the ecosystem and the population [24] or the relationship between ecosystem vulnerability and agricultural development [25]. Since the 21st century, natural and socio-economic factors have been regarded as important factors that play a crucial role assessing ecosystem vulnerability, and numerous related studies have been conducted in typical regions, such as the Three Rivers Source [26]. In addition, the vulnerability of different components of an ecosystem, such as grassland ecosystems [27], was further studied.
In recent years, as the government has started to increasingly consider the importance of environmental integrity, substantial investments have been made in the field of ecological protection. For example, in 2020, the Chinese government put forward the concept of building a “beautiful China” and promoted the construction of an ecological civilization. As a consequence, researchers are paying more attention to the evaluation of ecosystem vulnerability in typical regions with serious ecological and environmental problems. Even though in some areas of the Qinghai-Tibet Plateau, studies on ecosystem vulnerability have been performed, there is a lack of consideration of anthropogenic factors [28]. Due to the construction of infrastructure, such as the Qinghai-Tibet Railway, and the development of tourism, the intensity of human activities in the Qinghai-Tibet Plateau has increased sharply. Against the background of the implementation of China’s ecological protection policy, it is now necessary to gain insights into the overall ecosystem vulnerability and driving forces of the Qinghai-Tibet Plateau. Such studies can provide theoretical references for the sustainable development of the Qinghai-Tibet Plateau and put forward feasible suggestions for the protection of this area.
The objective of this study is to explore the temporal and spatial changes of ecosystem vulnerability and the impacts of natural and socio-economic factors on the Qinghai Tibet Plateau. Specifically, we tested two main hypotheses: (1) the spatial distribution of ecosystem vulnerability has significant spatial patterns; (2) the impacts of natural factors on ecosystem vulnerability are greater than those of socio-economic factors.

2. Literature Review

2.1. The Concept of Ecosystem Vulnerability

Since the concept of ecological vulnerability has evolved from vulnerability, we start with a brief review of the development of the vulnerability concept. There are numerous statements about the concept of vulnerability. In 1945, White et al. [29] put forward the “adaptation and adjustment view” for the first time when studying flood disasters, which marked the beginning of vulnerability research. After that, White [30] defined vulnerability as a system, subsystem or system component due to its exposure and sensitivity, making it susceptible to external disturbance and pressure. Timmerman [31] defined vulnerability as the degree to which a system is adversely affected or damaged. After that, Dow [32], Cutter [33] and the IPCC [34] defined ecosystem vulnerability from different perspectives. In the 21st century, the concept of vulnerability has been widely used in many fields, including sustainable development [35], climate change [3] and ecology [12].
Ecosystem vulnerability was initially introduced into ecology by Clements, with the concept of the “ecological transition zone” [36], and a unified definition of ecosystem vulnerability as not yet been provided (Table 1). At present, the IPCC’s definition of vulnerability has been widely accepted and adopted in the field of climate change research. Based on relevant literature, ecosystem vulnerability can be summarized as the sensitivity and resilience of ecosystems in response to external interference including human disturbance, climate change, etc.

2.2. Assessment of Ecosystem Vulnerability

Ecosystem vulnerability studies rely on building assessment models. At present, there is no unified model for ecosystem vulnerability assessment; the common evaluation models include the Pressure-State-Response model (PSR) [21] and the Exposure-Sensitive-Adaptive model (ESA) [40]. Based on the PSR model framework, some scholars have developed a series of models by adding factors, such as the Driving force-Pressure-State-Impact-Response (DPSIR) [41] and the Pressure-Support-State-Response (PSSR) [42]. Similar to the ESA models, there is the Vulnerability-scoping-Diagram (VSD) model [43]. Based on PSR and ESA models, some scholars have also proposed Pressure-Sensitivity-Elasticity (PSE) [44] and Sensitivity-Resilience-Pressure (SRP) models [45]. The ecosystem vulnerability assessment model is developing in the direction of integrating multiple systems and multiple factors.
On the basis of the indicator system, ecological vulnerability assessment needs to be carried out in conjunction with the assessment methodology, such as the hierarchical analysis method [46], the fuzzy evaluation method [47], the artificial neural network method [48], the entropy weight analysis method [49] and the expert scoring method [50]. With the development and application of RS (Remote Sensing), GIS (Geographic Information System), GPS (Global Positioning System) and other technologies, vulnerability assessment results have become more dynamic. For example, Yaw et al. [51] used GIS and RS to analyze the vulnerability of the Niger River Basin and its influencing factors. The spatial principal components analysis method (SPCA), based on principal components analysis and spatial feature extraction, has advantages in ecosystem vulnerability assessment [52]. For example, it not only adds spatial constraints to the traditional PCA but also considers the spatial dependence in data sets.
Since the purposes and regional characteristics of the studies, along with their emphasize, can largely differ, there is no unified index system. In recent years, ecosystem vulnerability assessment indicators for different regions have been selected (Table 2). In this study, the Sensitivity-Resilience-Pressure (SRP) model was used to construct the index system. This model is constructed based on the connotation of ecosystem stability and has been widely used in the Karst Mountains [53], the Yimeng Mountain area [45] and the Shiyang River region [54], among others. Here, sensitivity reveals the resistance of the ecosystem to various disturbances and is usually expressed by topographical and meteorological factors. In contrast, restoration refers to the ability of an ecosystem to be restored to the original state after damage by internal and external interference factors; it is mainly characterized by vegetation factors. Pressure refers to the variety of pressures from anthropogenic interference, often expressed by population pressure and intensity of economic activities. Since ecosystem vulnerability is generally the result of a combination of natural and human activities, the driving factors that affect changes in ecological vulnerability can be divided into two categories: natural and socio-economic factors [10,55].

3. Study Area and Data Sources

3.1. Study Area

The Qinghai-Tibet Plateau in southwest China is the highest plateau in the world, also known as the “Third Pole” (Figure 1). Its average elevation is more than 4000 m above sea level. The administrative regions include Tibet Autonomous Region, Qinghai Province and parts of Xinjiang Uygur Autonomous Region, Gansu, Sichuan and Yunnan Province. It is the birthplace of the Yangtze River, the Yellow River and the Lancang River, among others. The terrain is diverse, containing valleys and basins and the climate is highly complex and largely affected by the terrain. The spatial and temporal distribution patterns of air and heat on the Qinghai-Tibet Plateau are significant. The southeastern area is warm and humid, whereas the northwestern area is dry and cold. The annual average temperature of the entire region ranges between 5.6 and 17.6 °C. Annual precipitation is unevenly distributed, gradually decreasing from 2000 mm to less than 50 mm from southeast to northwest. Under the influence of temperature and precipitation, the surface cover type changes from southeast to northwest, gradually transitioning from forest and shrub areas to grassland, meadow and desert. As a result of overgrazing, the alpine grassland on the Qinghai-Tibet Plateau is subjected to serious desertification. The major ecological issues faced include freeze-thaw erosion, hydraulic erosion, desertification, salinization and water scarcity [58].

3.2. Data Sources

For this study, the data used include socio-economic, remote sensing, topographic, meteorological and land use (Table 3) from 2010, 2010 and 2015. They were mostly obtained from the Resource and Environmental Science Data Center of the Chinese Academy of Sciences (RESDC) and include socio-economic (population and GDP (gross domestic product)), topographic (DEM (digital elevation model)), meteorological (annual precipitation and average annual temperature) and land use data with a spatial resolution of 1 km. Remote sensing data were obtained from MODIS (Moderate resolution imaging spectroradiometer) and include NDVI (Normalized difference vegetation index), NP (Net Primary Productivity) and ET (Evapotranspiration). The spatial resolution of NDVI and NP is 1 km ant that of ET 500 m.
All data were preprocessing using the ARCGIS 10.2 software. First, all data were projected into the same coordinate system (WGS_1984_UTM_45N) and then cut into the same spatial boundary according to the study area. Finally, the spatial resolution of data was unified to 1 km by bilinear interpolation. The NDVI represents the monthly data with 12 periods per year, and the annual NDVI was generated by selecting the annual maximum.

4. Research Method

4.1. Technical Route

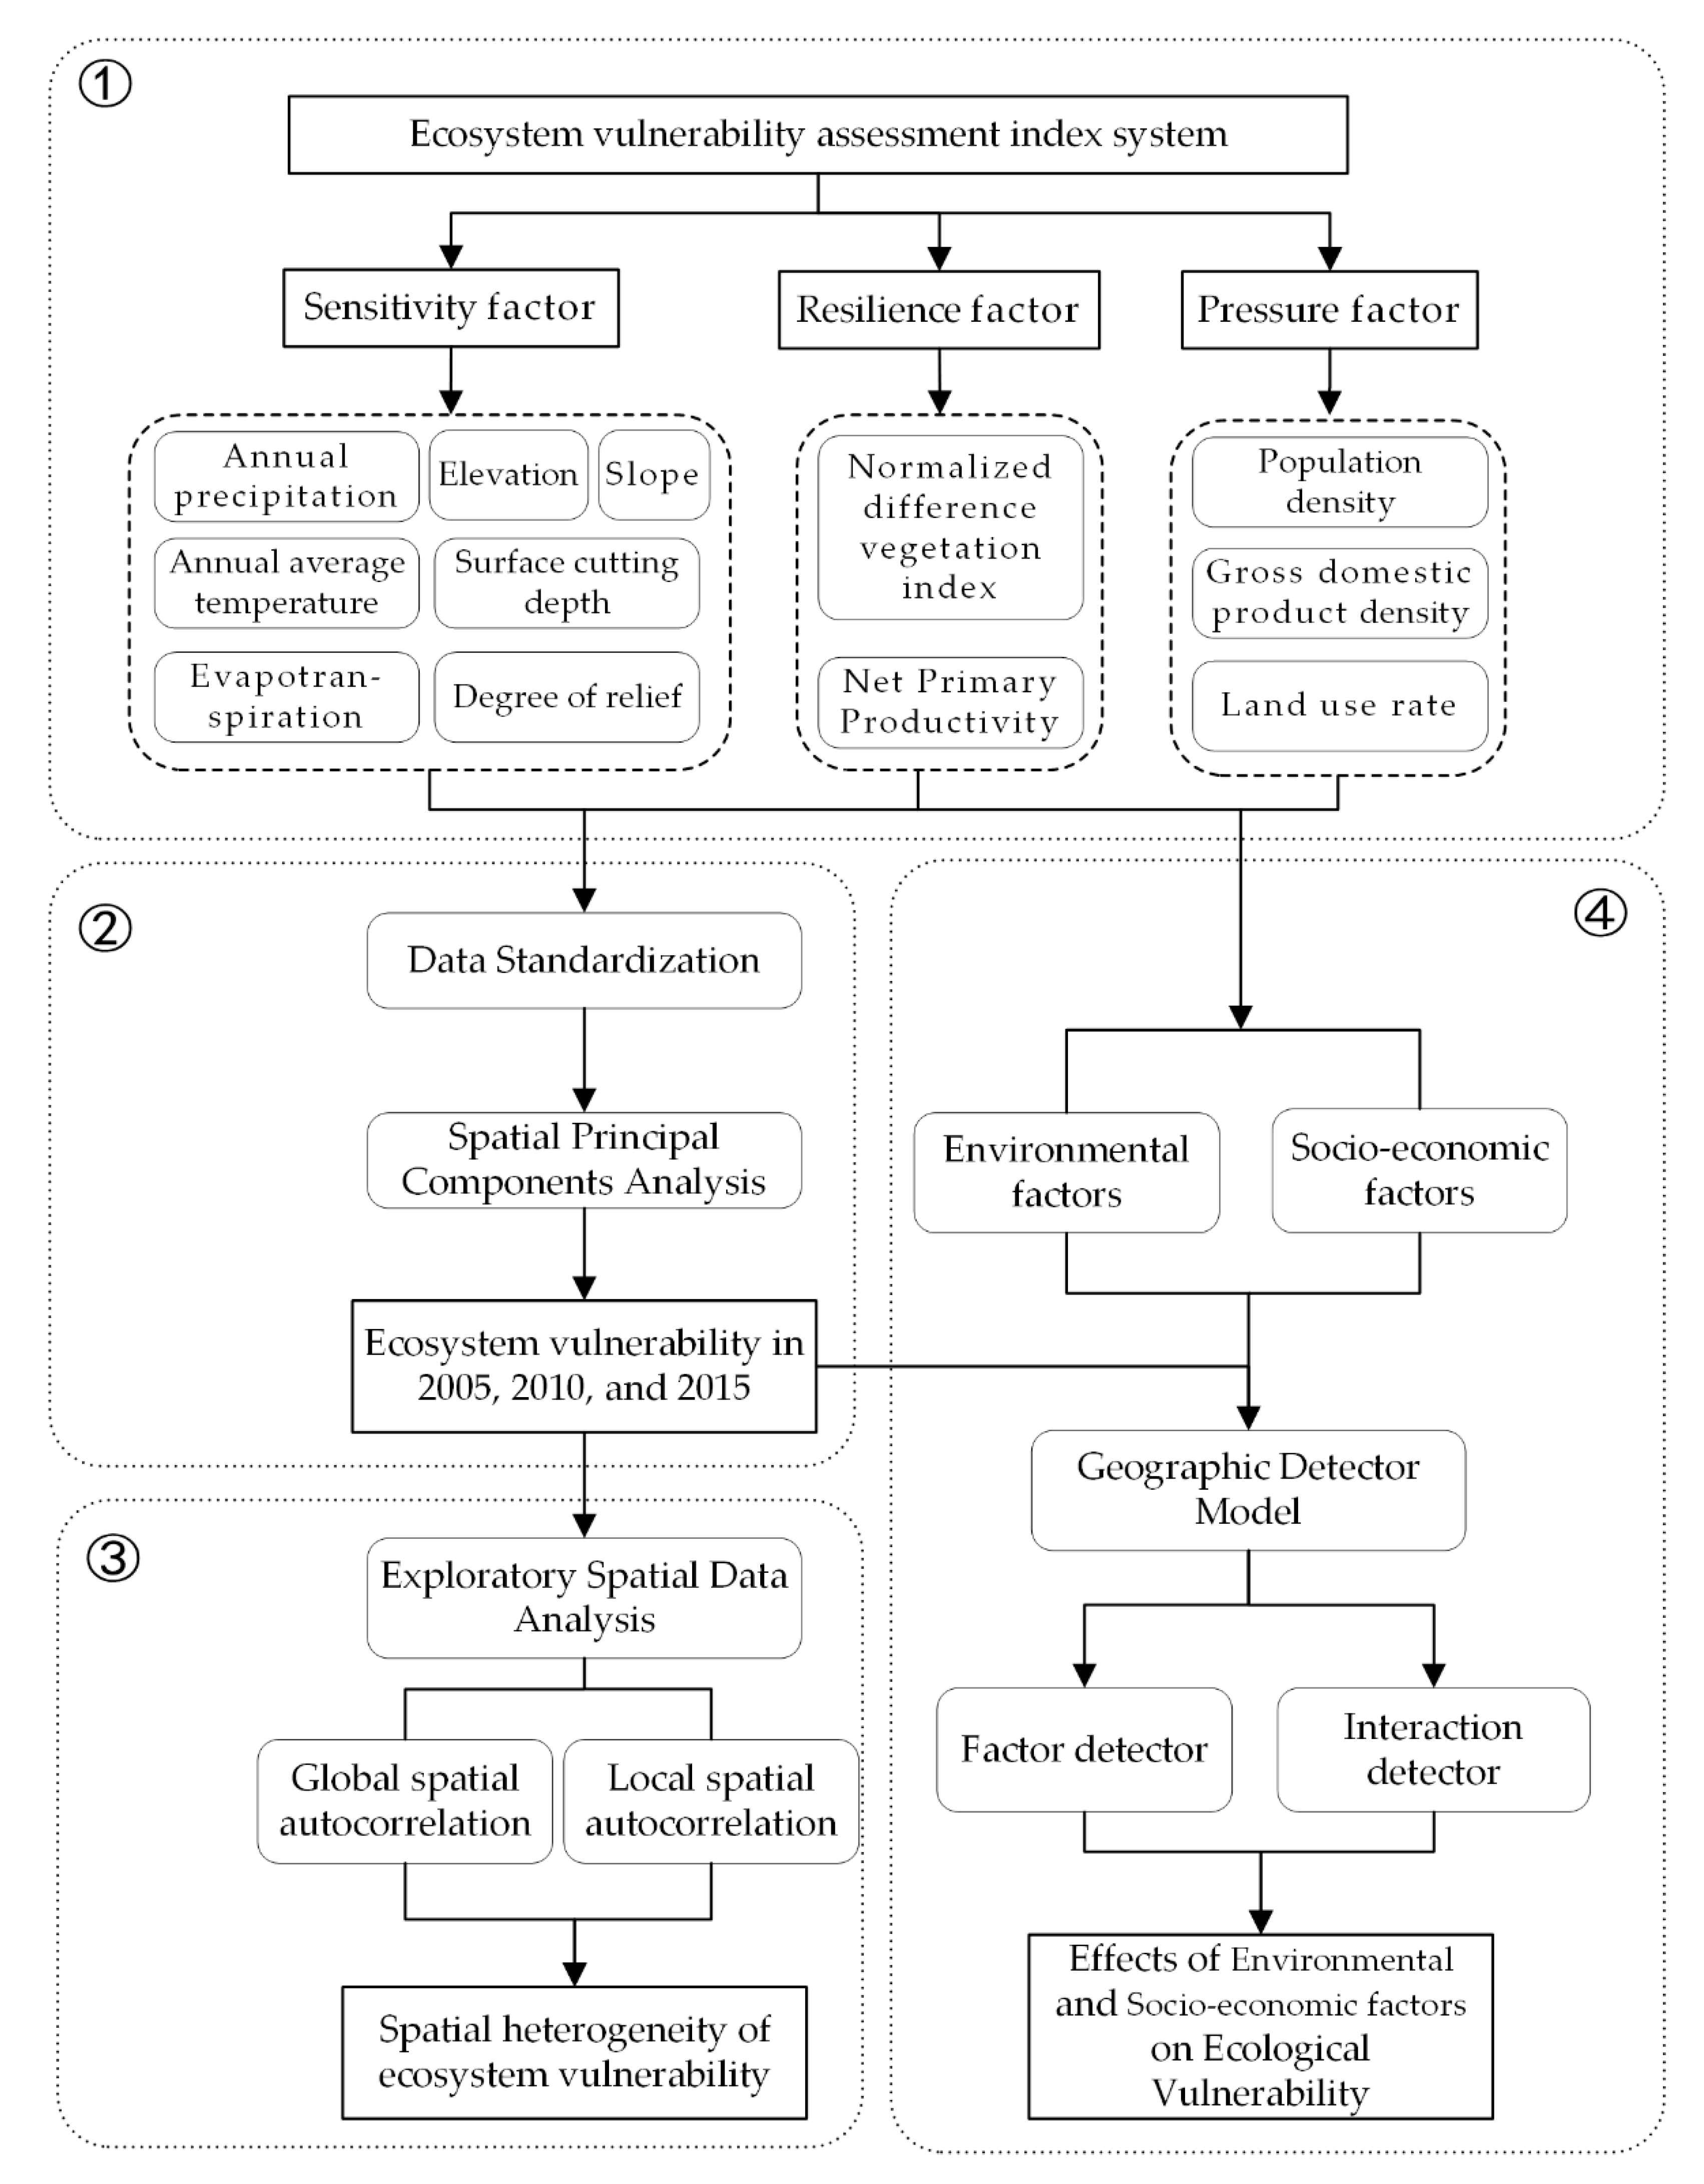
The study was divided into the following four steps (Figure 2):
Step 1: Establishing the ecosystem vulnerability assessment index system. According to the Sensitivity-Resilience-Pressure (SRP) model, the indicators were selected from three aspects: ecological sensitivity, resilience and pressure.
Step 2: Mapping the distribution of ecosystem vulnerability. First, the indicators were standardized and uniformly mapped to the same value range to solve the problem of inconsistent original data units. Subsequently, the spatial scale of ecological vulnerability was determined using the ARCGIS 10.2 software and the SPCA method.
Step 3: Spatial heterogeneity analysis. The spatial and temporal distribution characteristics of ecosystem vulnerability were analyzed via exploratory spatial data analysis.
Step 4: Driving force analysis. Using the factor and interaction detector in the geodetector model, the effects of natural and socio-economic factors on ecosystem vulnerability were analyzed.

4.2. Establishing an Ecosystem Vulnerability Assessment Indicator System

In this study, the Sensitivity-Resilience-Pressure (SRP) model was used to construct the index system. The selected 12 indicators were divided into three categories, namely sensitivity, resilience and pressure (Table 4). In previous studies of ecosystem vulnerability in Shiyang River Basin [54], Karst [53] and Yimeng [45] mountainous areas using SRP model, sensitivity is considered to be the product of the interaction between the topographic factors and the distribution of meteorological factors. In this study, annual average temperature, annual precipitation and ET were just selected to reflect the hydrothermal conditions of the ecosystem [10,28]. Here they are not affected as external hazards. Elevation, slope, surface cutting depth and degree of relief were used to characterize the regional topography [61]. Resilience is usually characterized by vegetation factors [62], and NDVI and NPP were selected to reflect vegetation growth. The NDVI can detect the vegetation growth status and accurately reflect the surface vegetation coverage [63]. The NPP not only reflects the productive capacity of vegetation communities, but also represents ecosystem quality [64]. Pressure factors include population density, gross domestic product density and land use rate. Population density and GDP density represent the degree of population and economic concentration, reflecting the interference intensity of human activities. When the disturbance intensity exceeds the carrying capacity of the ecosystem, the ecological environment will be degraded, resulting in increased ecosystem vulnerability [26]. The land use rate (proportion of cultivated land) was selected to reflect the influence of human activities on land use.

4.3. Mapping Ecosystem Vulnerability

4.3.1. Data Standardization

Standardization is generally carried out to solve the issue of inconsistent original data units [53]. There are two relationships between ecosystem vulnerability and evaluation factors [65]. The lower the index value, the lower the ecosystem vulnerability, representing a positive correlation. Conversely, there is a negative correlation, that is, the lower the index value, the stronger the ecosystem vulnerability. The maximum-difference normalization method was used to standardize the positive and negative indicators. For the positive indicators in the ecosystem vulnerability assessment index system, the standardized methods are as follows [10]:
M i = X i X m i n X m a x X m i n ,
The negative indicators are treated as follows:
M i = X m a x X i X m a x X m i n ,
where “Mi” is the standardized value of index i; “Xi” is the initial value of index i; “Xmin” is the minimum value of index i; “Xmax” is the maximum value of index i.

4.3.2. Spatial Principal Components Analysis

Spatial principal components analysis (SPCA) is a statistical analysis method that converts initial multiple indicators into irrelevant comprehensive indicators by dimension reduction [66,67]. At the same time, the correlation between the original evaluation indexes is reduced, and the information reflected by the original variables is kept to the maximum extent with less comprehensive indices to avoid the repetition of the indicators affecting the accuracy of the evaluation. In this study, we analyzed 12 standardized indices by principal components analysis to generate a new comprehensive index. By solving the correlation coefficient matrix of the index, the feature vector was obtained, and 12 principal component results are acquired. The principal component with a cumulative contribution rate of more than 85% was selected to replace the original index, and the principal factor was determined [67]. On this basis, the comprehensive index of the principal component was calculated as follows [66]:
P C i = a 1 i X 1 + a 2 i X 2 + a 3 i X 3 + a n i X n ,
where “PCi” is the i-th principal component; “ a 1 i , a 2 i a n i ” are the feature vectors corresponding to the respective index factors of the i-th principal component; “ X 1 , X 2 X n ” are the respective index factors.
The ecosystem vulnerability index (EVI) was calculated based on the principal components analysis, using the following equation [68]:
EVI = b 1 P C 1 + b 2 P C 2 + b 3 P C 3 + b n P C n ,
where “EVI” is the ecosystem vulnerability index; “bi” is the contribution rate corresponding to the i-th principal component; “PCi” is the i-th principal component; “n” is the first n principal component whose cumulative contribution rate exceeds 85%. The SPCA in this study was calculated by the ArcGIS 10.2 software. The SPCA results for the years 2005, 2010 and 2015 are shown in Table 5.
To compare the EVI results of several years, the EVI was standardized as follows:
K i = E V I i E V I m i n E V I m a x E V I m i n ,
where “Ki” is the standardized value of ecosystem vulnerability in the i-th year, with a value range of 0–1; “EVIi” is the actual value of the ecosystem vulnerability index in the i-th year; “EVImax” is the maximum value of the i-th ecosystem vulnerability index; “EVImin” is the minimum value of the i-th ecosystem vulnerability index.

4.3.3. EVI Classification

We used natural breakage classification (NBC) to classify the EVI to reflect different degrees of ecosystem vulnerability. This method is generally used to analyze the statistical distribution of attribute, maximizing the difference between classes [56]. In this study, according to the results of the NBC for 2005, the EVI was divided into five grades, namely, slight, light, medium, heavy and extreme vulnerability (Table 6). Subsequently, the ArcGIS 10.2 software was used to visualize the spatial distribution of EVI.

4.4. Spatial Heterogeneity Analysis

The exploratory spatial data analysis method (ESDA) can be used to reveal the spatial interaction mechanism by describing and visualizing the spatial distribution pattern [69]. According to the different scales of analysis, global and local spatial autocorrelation are often used to study the spatial feature of the observation [56]. Here, this was performed using the OpenGeoda 1.16.0.16 software at a spatial resolution of 1 km. Global spatial autocorrelation analysis is mainly used to reflect the cluster degree of similar attributes in a study area [70]. The degree of spatial autocorrelation is usually measured by the Global Moran’s I proposed by Moran [71]. Local spatial autocorrelation is mainly used to measure the spatial correlation and difference between the region of the research target and its surrounding areas [72].
The global Moran index is calculated as follows:
I i = N i = 1 N x i x ¯ 2 × i = 1 N j = 1 N x i x ¯ x j x ¯ i = 1 N j = 1 N w i j ,
where “I” is the Moran index, “N” is the number of research objects, “xi” and “xj” are the spatial attribute values of the research objects, and “wij” is the spatial weight matrix. The value range of “I” is [–1, 1]. If the index is greater than 0, the space is positively correlated; if it is smaller than 1, it is negatively correlated. At a value equal to 0, there is no correlation.
The specific equation to calculate local spatial autocorrelation is as follows:
I i = N i = 1 N x i x ¯ × x i x ¯ × j = 1 N w i j ( x i x ¯ ) ,
where when Ii > 0, the local space of the research target is positively correlated, and the surrounding area presents a similar attribute value cluster. When the attribute values of the research target area and the surrounding research area are both high, they are hotspot clusters, generally represented by high-high (HH); when the attribute values of the research target area and its surrounding research area are low, they are coldspot clusters, generally represented by low-low (LL). When Ii < 0, the research target’s local space is negatively correlated, and the surrounding area of the research target shows the opposite phenomenon of attribute value cluster. When the attribute value of the research target area itself is high, but that of the surrounding area is low, it is a high-low cluster, generally represented by high-low (HL). When the attribute value of the research target area itself is low, but that of the surrounding area is high, it is a low-high cluster, generally represented by low-high (LH).

4.5. Driving Force Analysis

The Geographic Detector Model (GDM) is a set of statistical methods to identify spatial differentiation among the geographical elements. This method can quantitatively analyze the driving mechanisms of geographical phenomena and is widely used to determine the explanatory power of driving factors and the interaction between factors without too many hypothetical conditions [73,74,75].
The GDM includes four detectors, namely risk detector, factor detector, ecological detector and interaction detector. In this study, factor detector and interaction detector were used to analyze the driving factors of ecosystem vulnerability on the Qinghai-Tibet Plateau, with the aim to explore the main driving mechanism of ecosystem vulnerability and to compare the spatial consistency between EVI and evaluation indices. If a factor dominates the cause of vulnerability, vulnerability will exhibit a spatial distribution similar to the evaluation index and the intra-layer variance is lower than the inter-layer variance. Using q-statistics to measure the decisive effect of each evaluation index on EVI, the calculation method is as follows [76]:
q = 1 h = 1 L N h δ h 2 N δ 2 ,
where “q” is the explanatory power of the influencing factors to the vulnerability of the ecosystem, “N” is the sample size, “L” is the classification number of the index factors and “Nh” and δ h 2 ” represent the variance of h-layer sample size and ecosystem vulnerability, respectively. The value of the q-statistic is in the range of [0, 1]; the larger the value, the stronger the explanatory power of the influence factor to the ecosystem vulnerability, and its spatial distribution is consistent with the EVI. When the q-statistic is equal to 0, there is no significant relationship between the given influence factor and the EVI distribution. When the value is 1, the impact factor can fully explain the spatial variation of the EVI.
The interaction detector was adopted to reveal the factor explanatory power to the results after multi-factor interaction, that is, whether the interaction of impact factors X1 and X2 will strengthen or weaken the impact on ecosystem vulnerability. The main types are shown in Table 7.

5. Results

5.1. Spatiotemporal Variations in Ecosystem Vulnerability

5.1.1. Temporal Variations in Ecosystem Vulnerability

The ecosystem vulnerability levels in most areas of the Qinghai-Tibet Plateau were dominated by heavy and extreme vulnerability (Figure 3). In 2005, 2010 and 2015, heavily and extremely vulnerable areas accounted for 51.37, 51.64 and 53.08% of the total area, respectively. Heavily vulnerable areas accounted for the largest proportions, namely 28.10, 28.62 and 29.07%, respectively. From 2005 to 2015, the proportions of slightly and medium vulnerable areas decreased by 0.72 and 0.99%, respectively. The proportion of slightly vulnerable areas did not change, whereas those of heavily and extremely vulnerable areas increased by 0.97 and 0.77%, respectively.
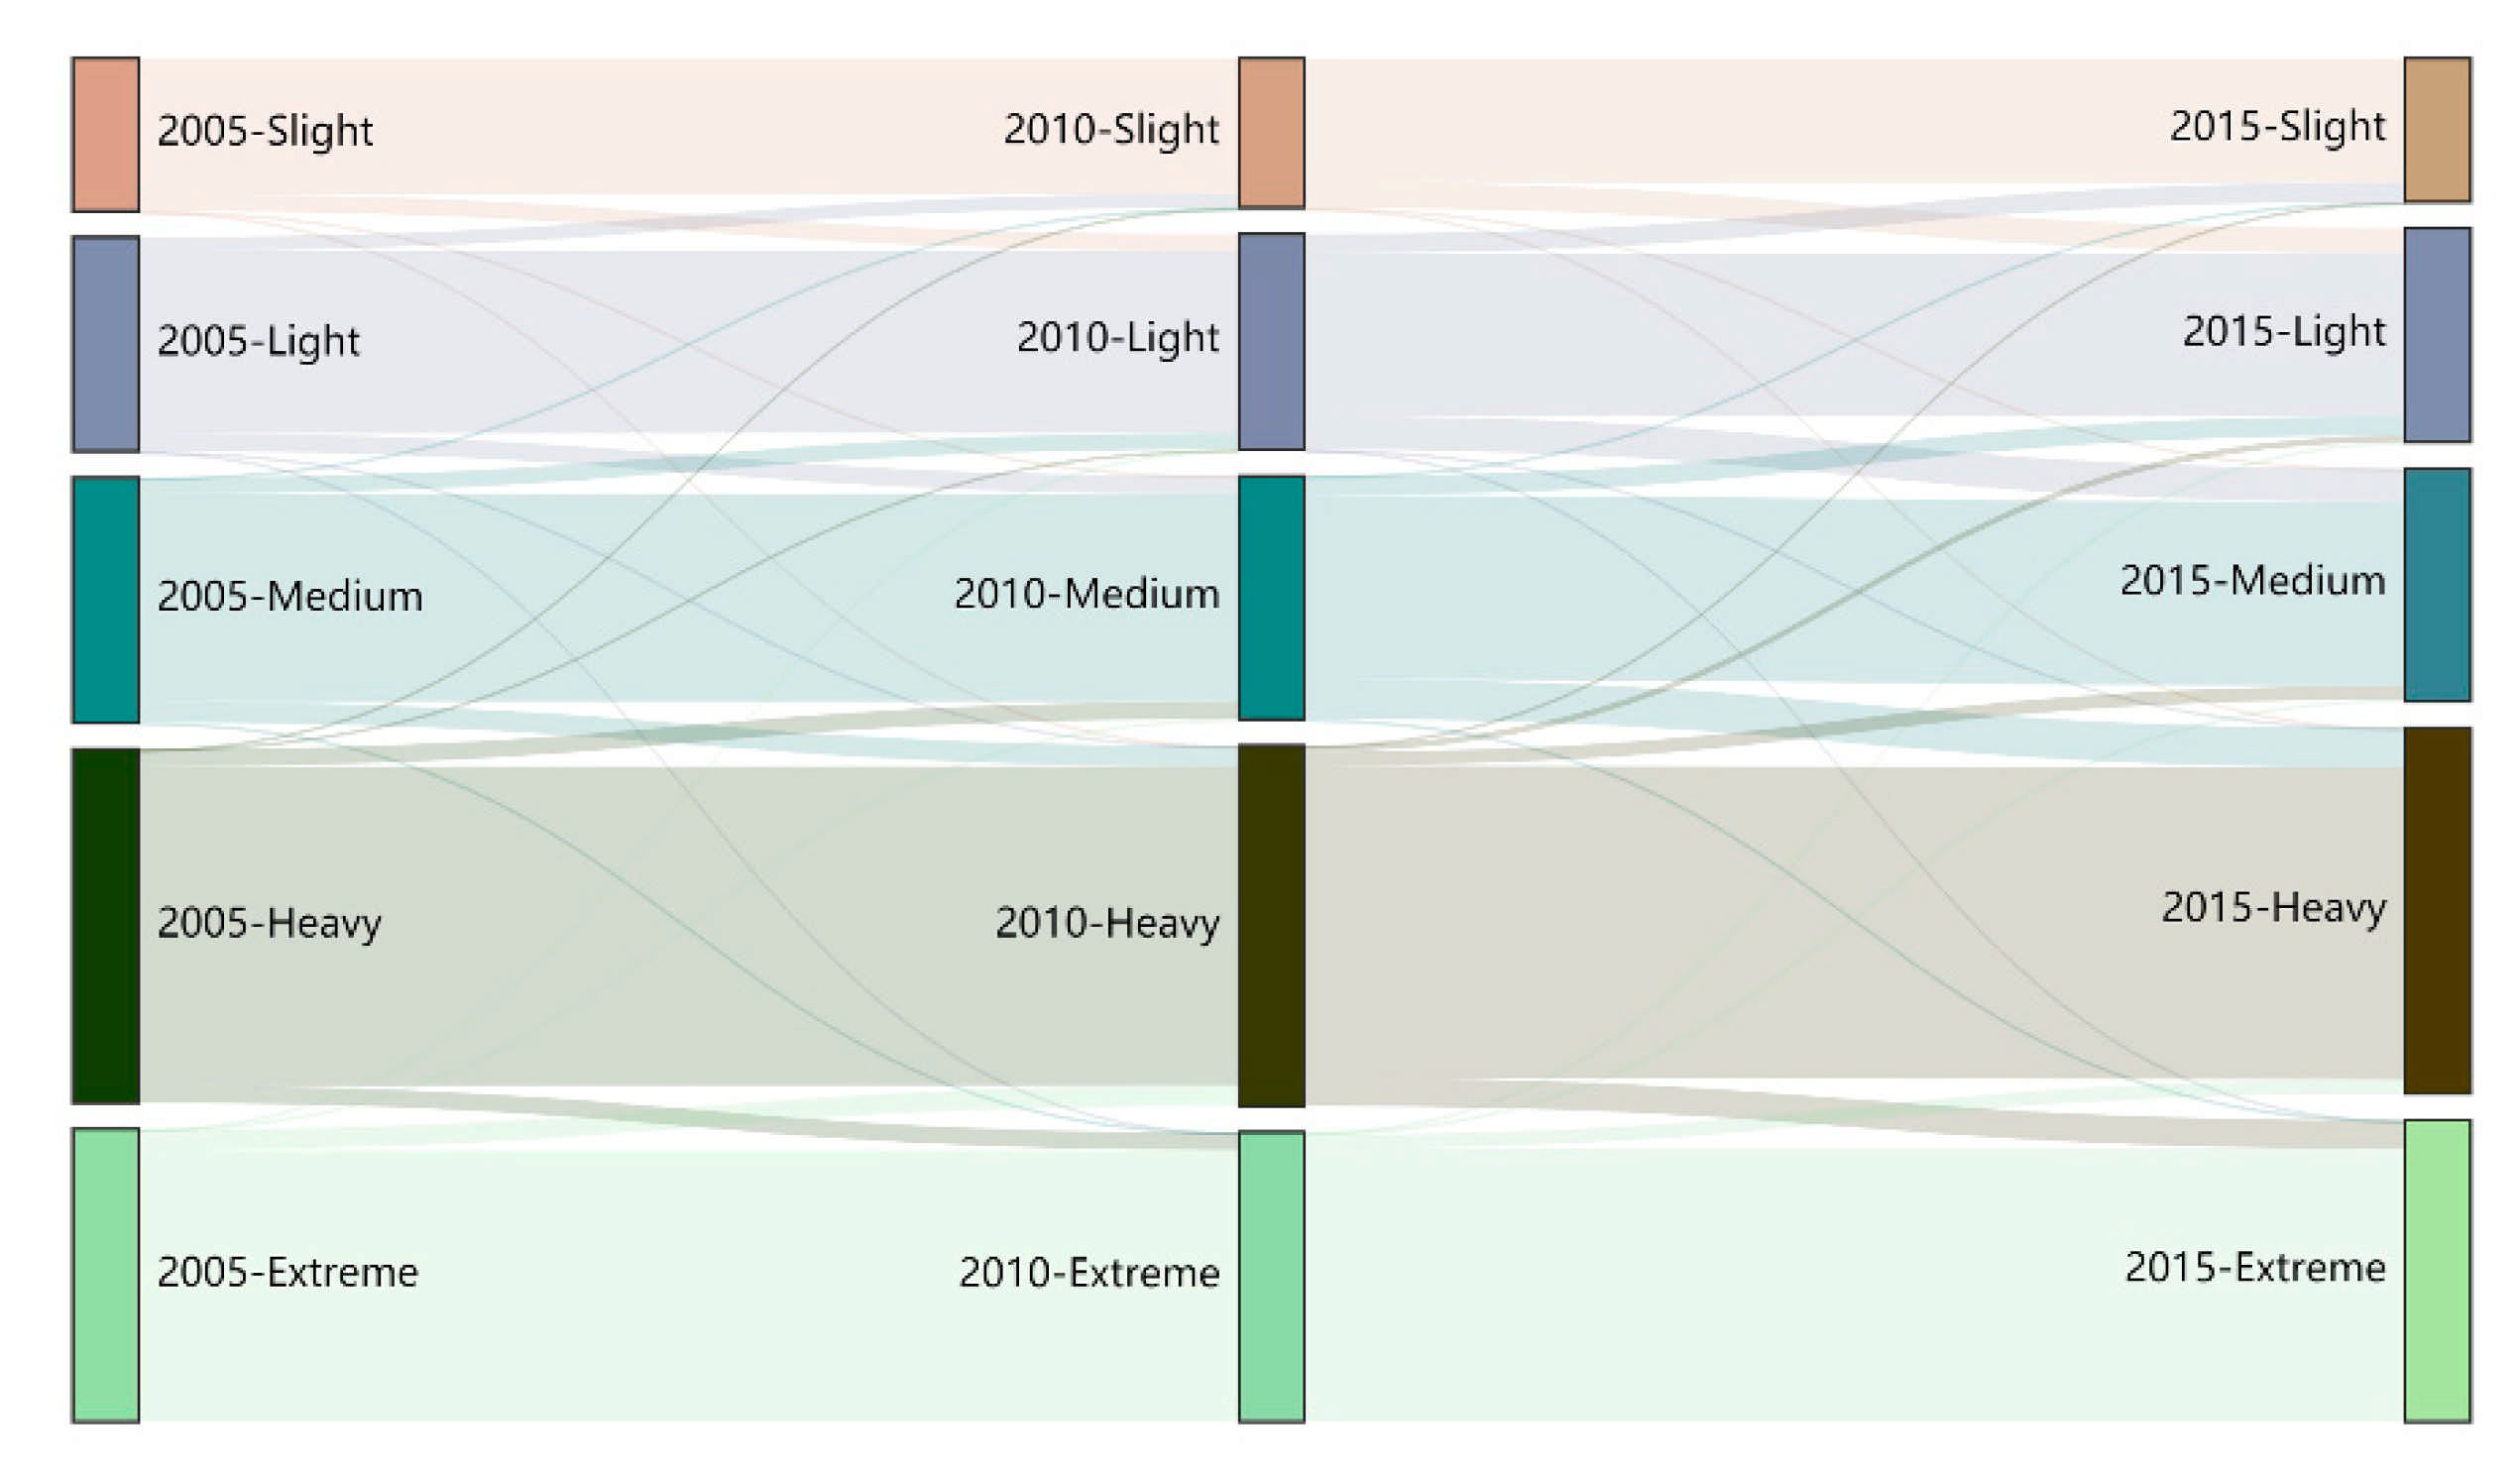
The transition areas of ecosystem vulnerability level were calculated for 2005, 2010 and 2015 (Figure 4). Area conversion mainly occurred between adjacent levels. For example, the increasing areas of heavily and extremely vulnerable areas were former medium and heavily vulnerable areas. From 2005 to 2015, highly vulnerable areas were mainly a result of the transformation of medium and extremely vulnerable areas, accounting for 76.32 and 23.64%, respectively. The extremely vulnerable areas are almost entirely transformed into heavily vulnerable ones. The main types of ecosystem vulnerability scale conversion include medium to high, light to medium, slight to light and high to extreme vulnerability.

5.1.2. Spatial Variations in Ecosystem Vulnerability

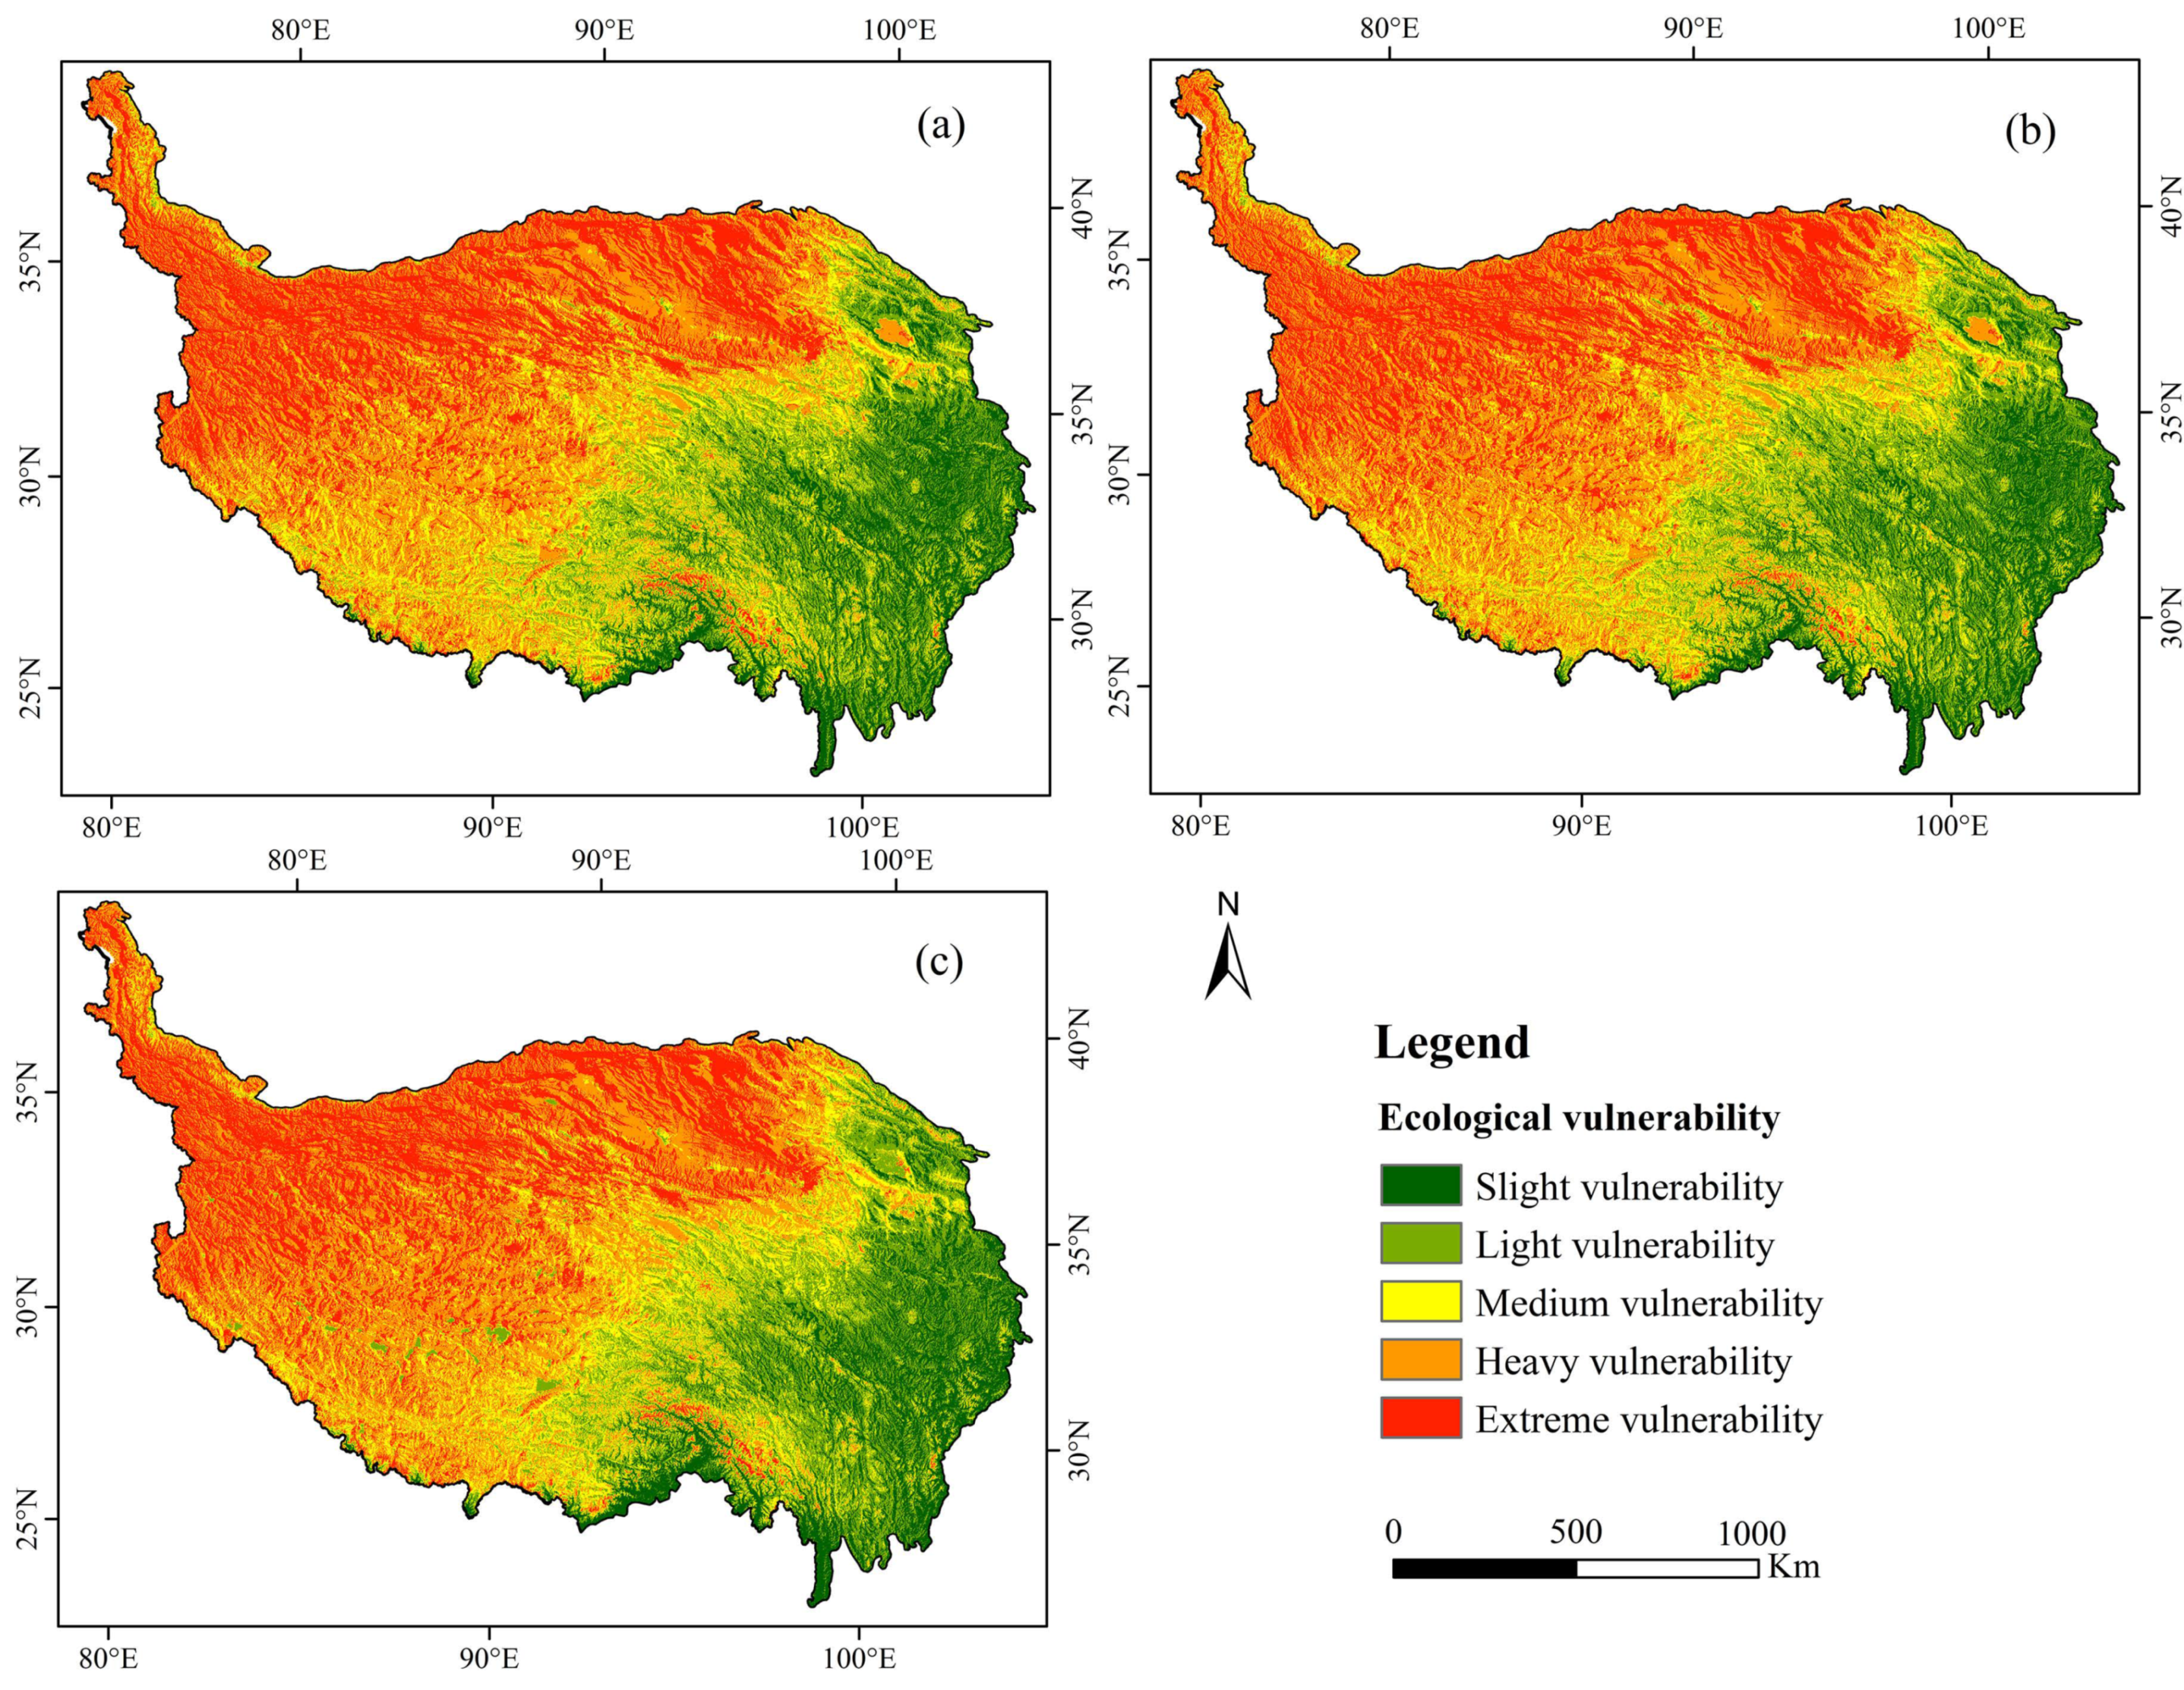
According to the spatial distribution pattern of EVI classification (Figure 5), the Qinghai-Tibet Plateau as a whole is mainly extremely vulnerable. The overall distribution of ecosystem vulnerability grades was higher in the northwest than in the southeast and gradually increased from southeast to northwest. The ecosystem vulnerability level in the northwest in 2005–2015 was mainly extreme; extremely vulnerable areas first decreased and then increased, whereas for lightly vulnerable areas, the opposite pattern was observed. Ecosystem vulnerability in the southeast was mainly slight and light, with a decrease in slightly vulnerable areas. From southeast to northwest, the vulnerability index increased, and the degree of vulnerability intensified. The middle area mainly showed a medium vulnerability, and the area with medium vulnerability decreased over time.
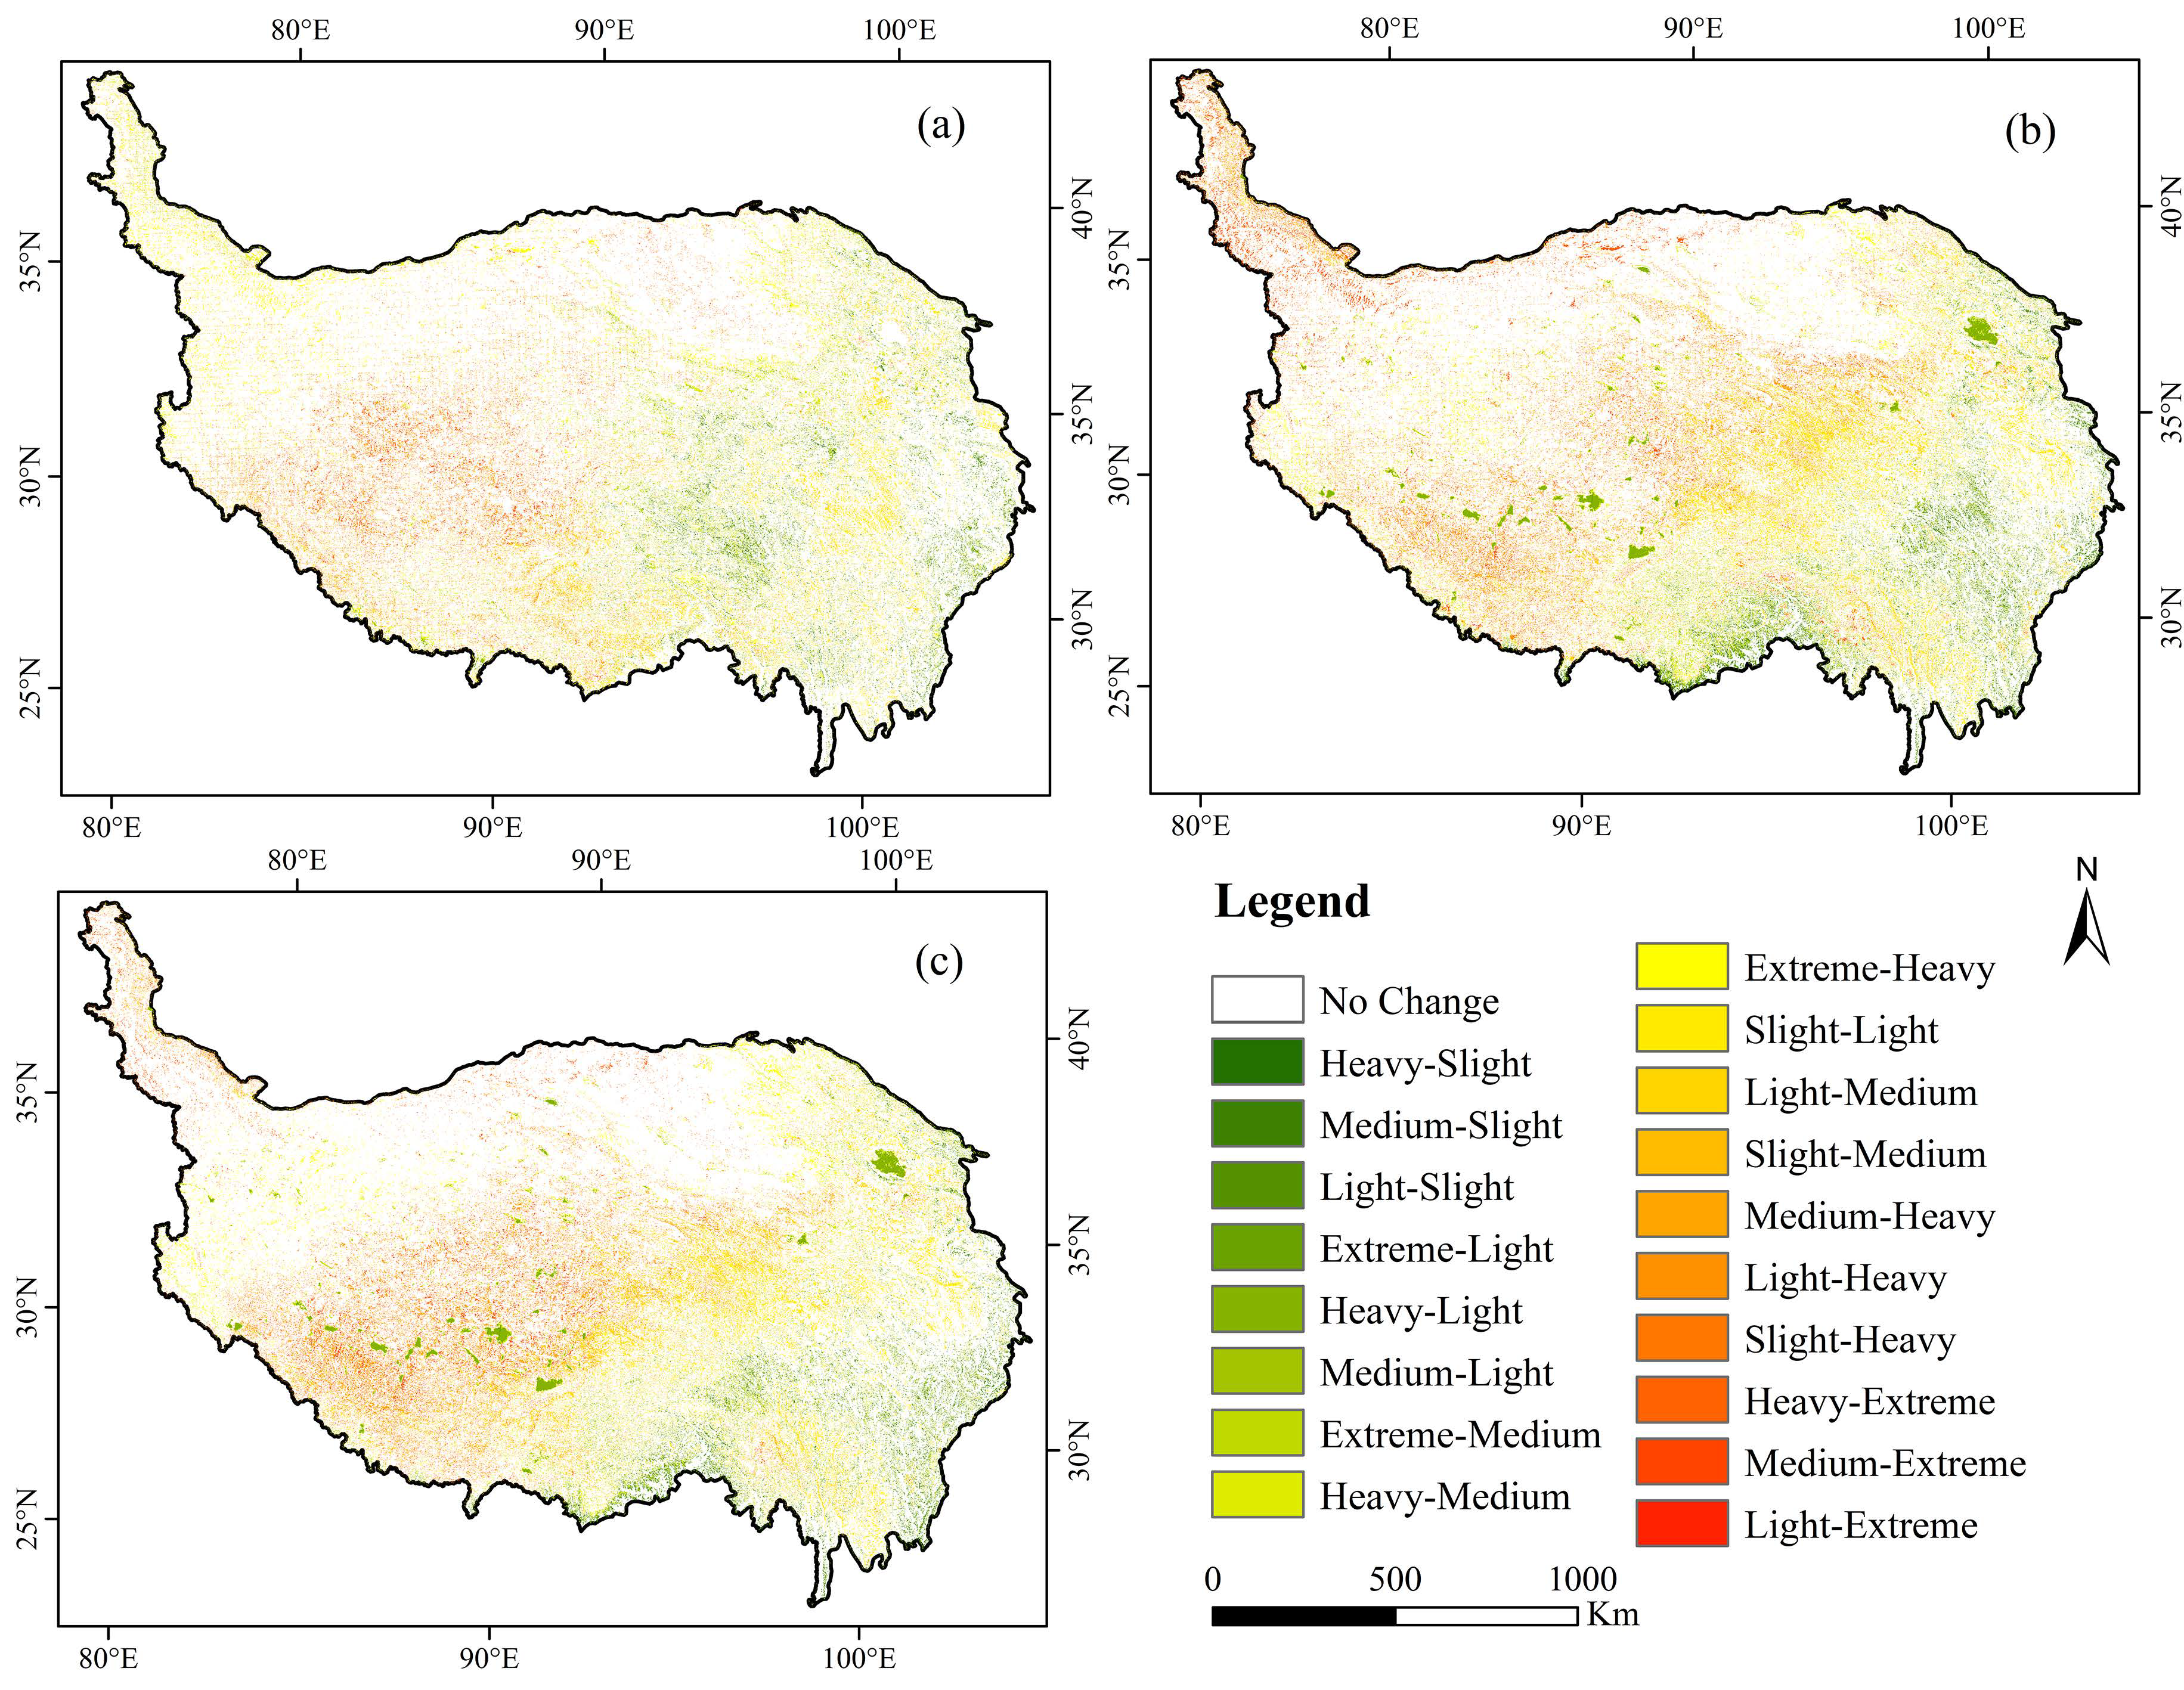
To analyze the transition between different levels of ecosystem vulnerability on each patch, we visualized the change in vulnerability grade from 2005 to 2015 (Figure 6). The main changes in ecosystem vulnerability levels consisted of the reduction of slightly and medium vulnerable areas and the increase in heavily and extremely vulnerable areas. From 2005 to 2015, changes in ecosystem vulnerability occurred in 14.80% of the study area, with 18 transformation types. The transition from medium vulnerability to heavy vulnerability accounted for 3.30% of the study area and mainly occurred in the northwest of the Qinghai-Tibet Plateau. The conversion of light vulnerability to medium vulnerability accounted for 2.52% of the study area, mainly in the central region.

5.2. Spatial Heterogeneity of Ecosystem Vulnerability

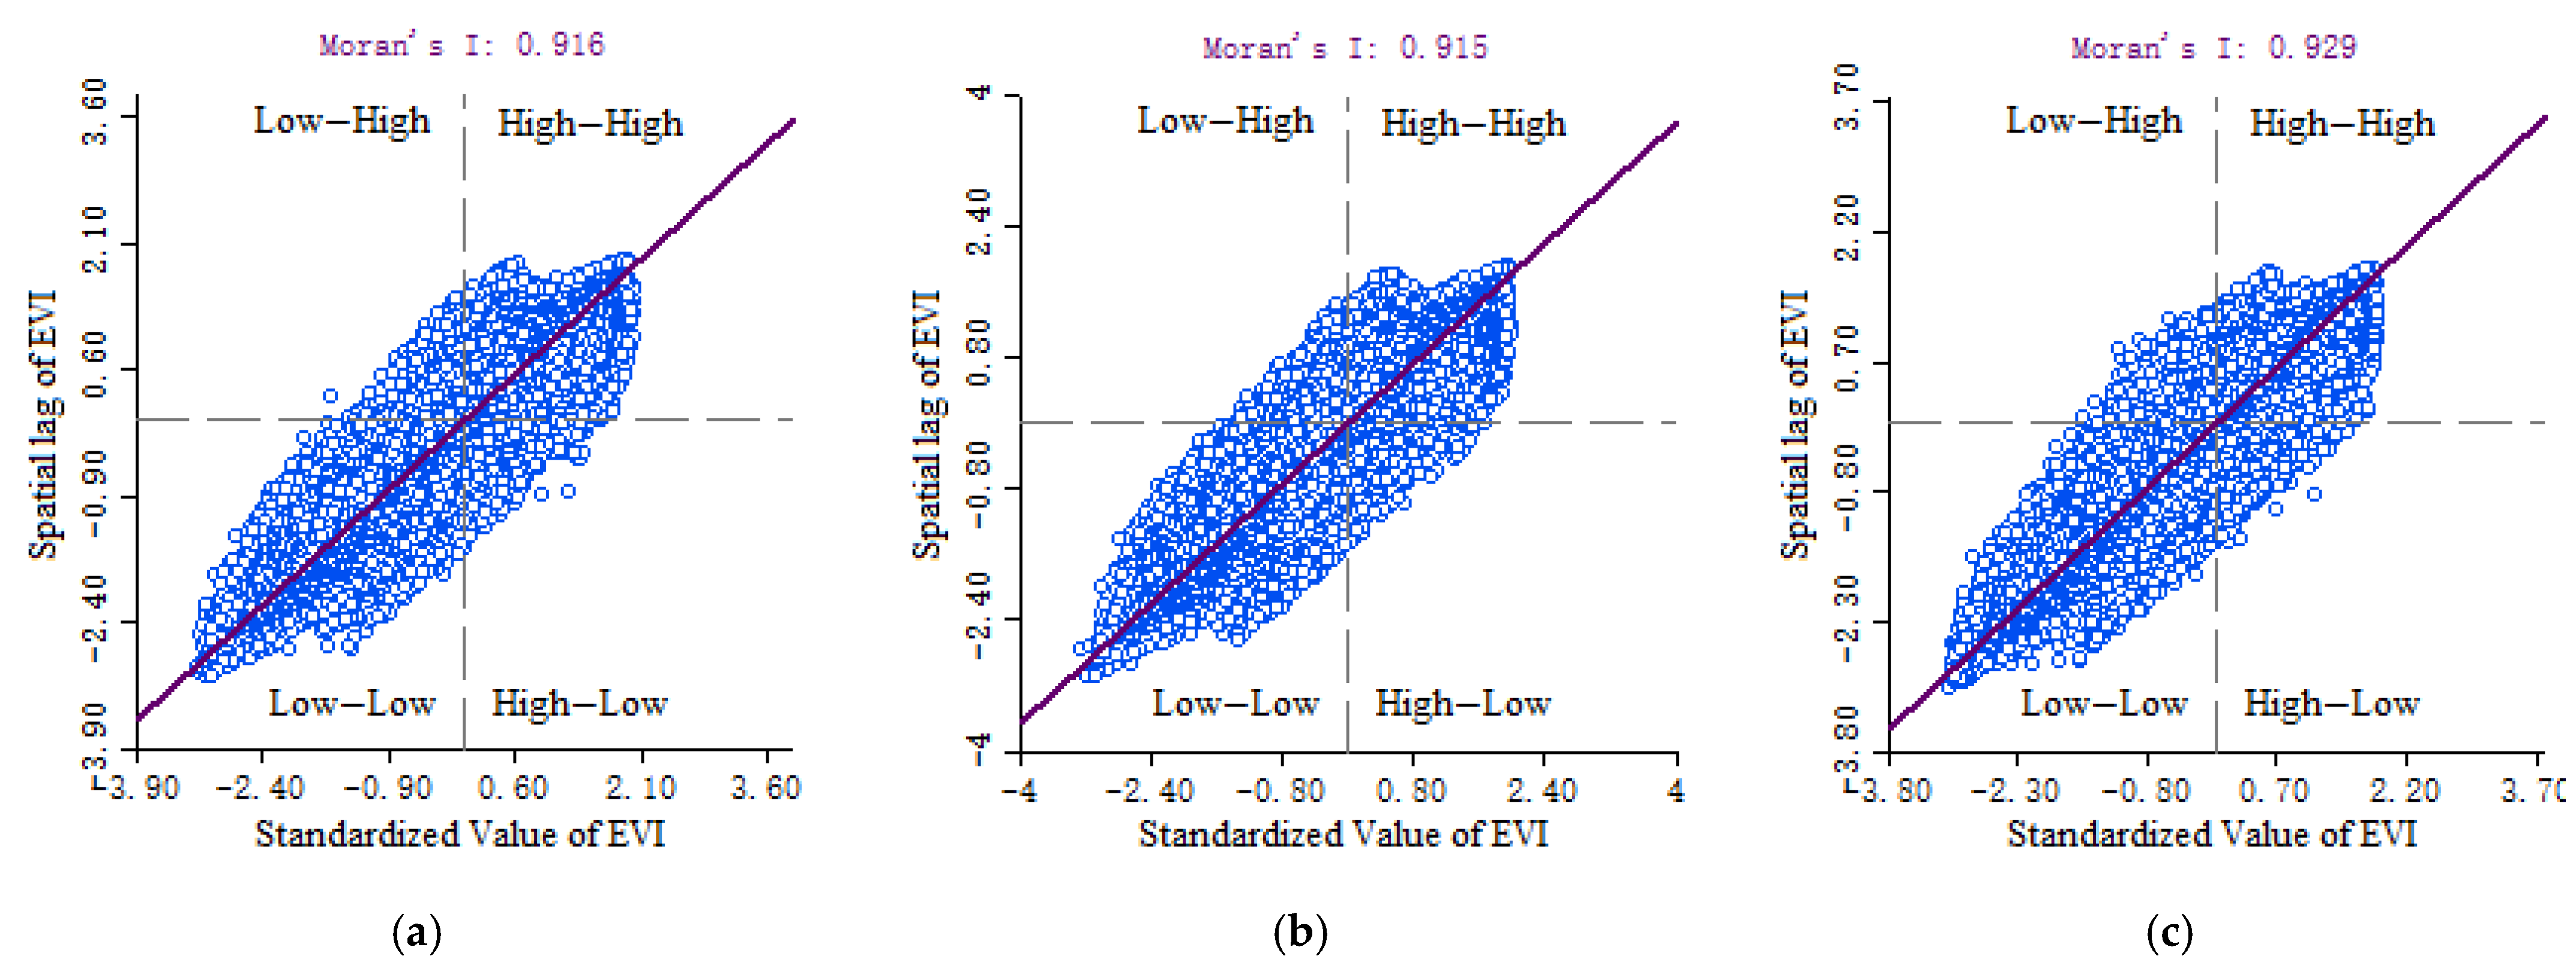
The EVI Global Moran Index for 2005, 2010 and 2015 passed the significance test, with values of 0.916, 0.915 and 0.929 (Figure 7). Ecosystem vulnerability showed positive spatial autocorrelation and high clustering. The overall cluster trend decreased first (from 2005–2010) and then slightly increased (from 2010–2015).
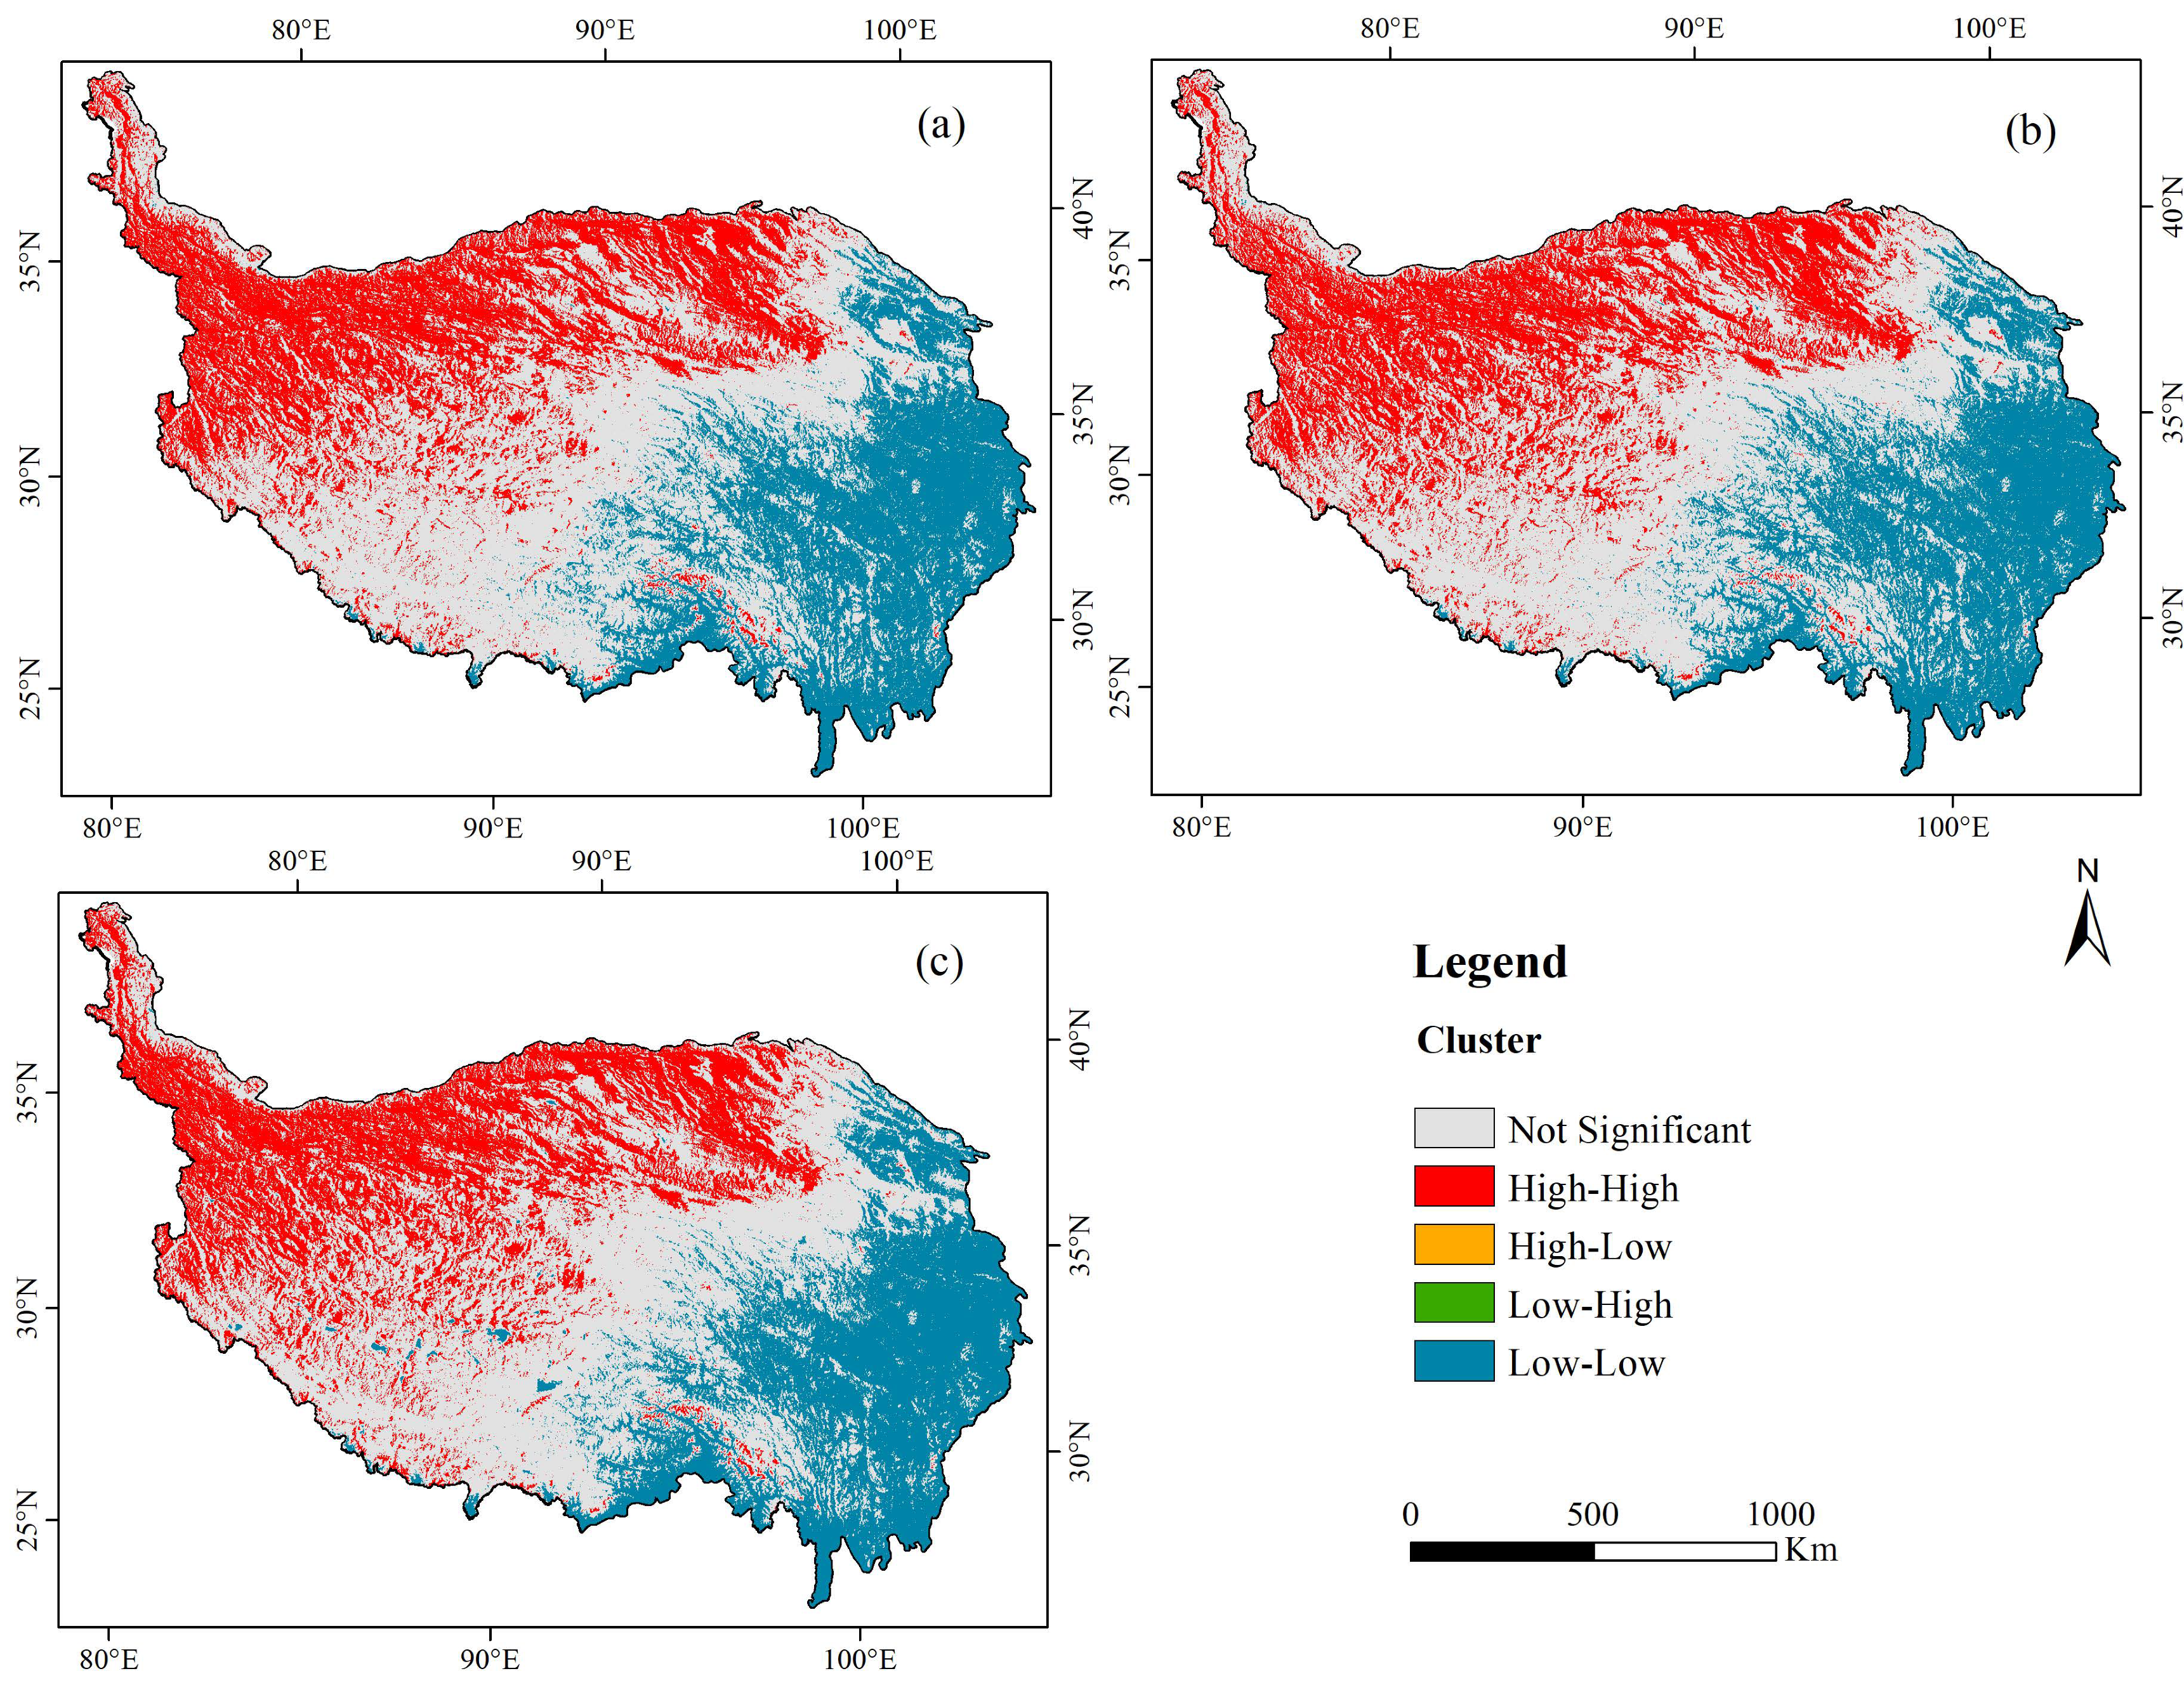
Using the local spatial autocorrelation index, the distribution of EVI spatial clustering characteristics and the spatial variation difference on the time scale can be seen intuitively from 2005 to 2015 (Figure 8). In 2005, 2010 and 2015, the distribution of spatial clustering characteristics was similar. The spatial clustering characteristics of EVI on the Qinghai-Tibet Plateau were mainly high-high and low-low. The high-high area was mainly distributed on in the Kunlun Alpine Plateau and in the Qaidam Basin in the northwest of the Qinghai-Tibet Plateau, with heavy and extreme vulnerability. The low-low are was mainly distributed in the southeast, with slight and light vulnerability. The southern part showed insignificant spatial clustering distribution, mainly with medium vulnerability. Compared with other cluster types, the distribution range of the low-high cluster type was lower. The distribution range of the high-low agglomeration was the smallest; such areas were scattered in the transition area from low-low to high-high clusters.

5.3. Determinants and Interactions of EVI

In this study, we used the geographic detector method to determine the importance and mutual influence of potential determinants of ecosystem vulnerability. The EVI mean values for the years 2005–2015 were selected as dependent variables, and the corresponding assessment indicators included socio-economic and natural factors. One of the most important findings of this analysis is that natural factors contribute more significantly to EVI than socio-economic factors.
By using factor detectors in geographical detectors, the q-statistics of the explanatory power of each influencing factor to ecosystem vulnerability could be obtained (Table 8). The q-statistics for natural factors ranged from 0.036 to 0.918, with an average value of 0.449. All factors were statistically significant. The determinants of these factors (in descending order) were the normalized difference vegetation index (NDVI), net primary productivity (NPP), evapotranspiration (ET), annual precipitation (PRE), annual mean temperature (TEM), elevation (ELE), Degree of Relief (DR), slope and surface cutting degree (SCD). These results indicate that vegetation types and climatic characteristics are important determinants of the spatial distribution of ecosystem vulnerability, whereas the effect of topography is relatively weak.
The q-statistical values of socio-economic factors ranged between 0.022 and 0.067, with an average value of 0.051 (Table 8). The determinants of the socio-economic factors obtained here can be ranked in descending order of land use ratio (LUR), population density (PD) and GDP density (GDPD). Overall, q-statistics show that LUR, PD and GDPD (in descending order) can significantly explain the spatial changes of EVI for the entire Qinghai-Tibet Plateau. The total value ranged between 2.21 and 6.71%.
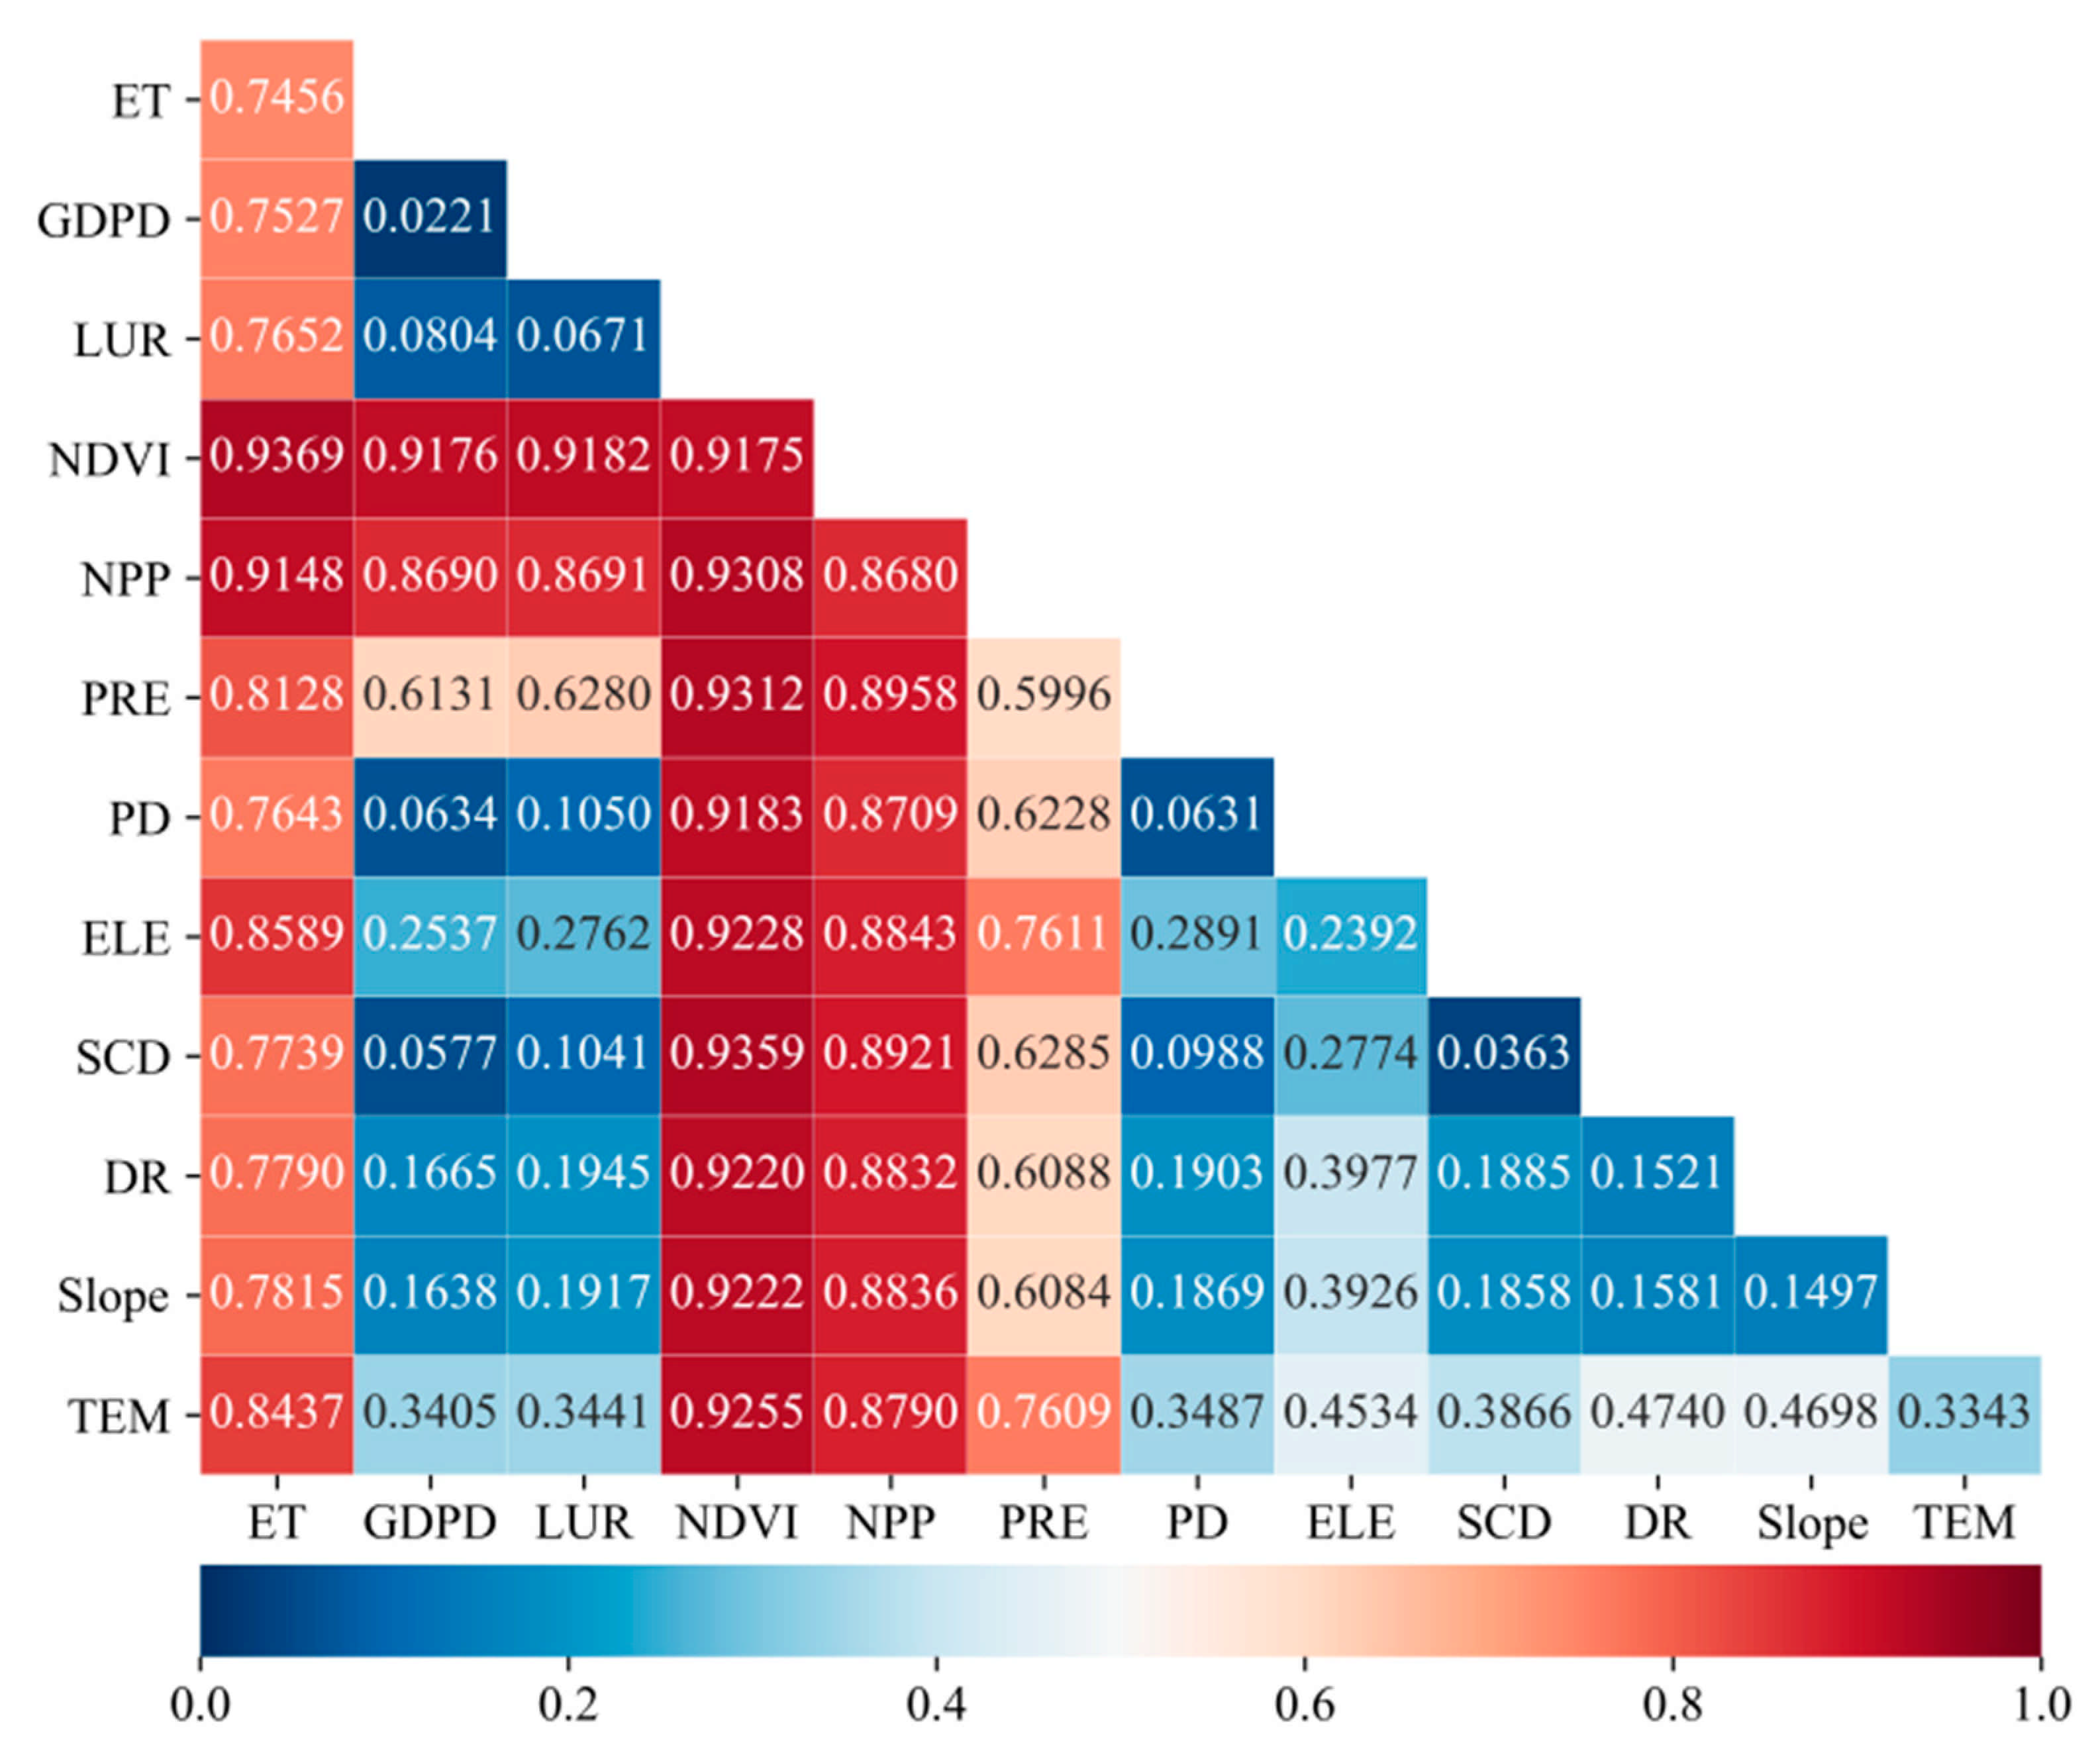
In addition to exploring the effects of single factors on ecosystem vulnerability, we also used the interactive detection module in geographical detectors to analyze the effects of two factors on ecosystem vulnerability. The results show that the interaction between the two factors exceeded that only of a single factor (Figure 9). The effects of NDVI and ET interaction on ecosystem vulnerability were the most significant, indicating that vegetation and surface evapotranspiration were the main factors affecting ecosystem vulnerability on the Qinghai-Tibet Plateau. The q-statistics between socio-economic factors were small, but the interaction between the socio-economic and natural factors also strongly affected EVI.
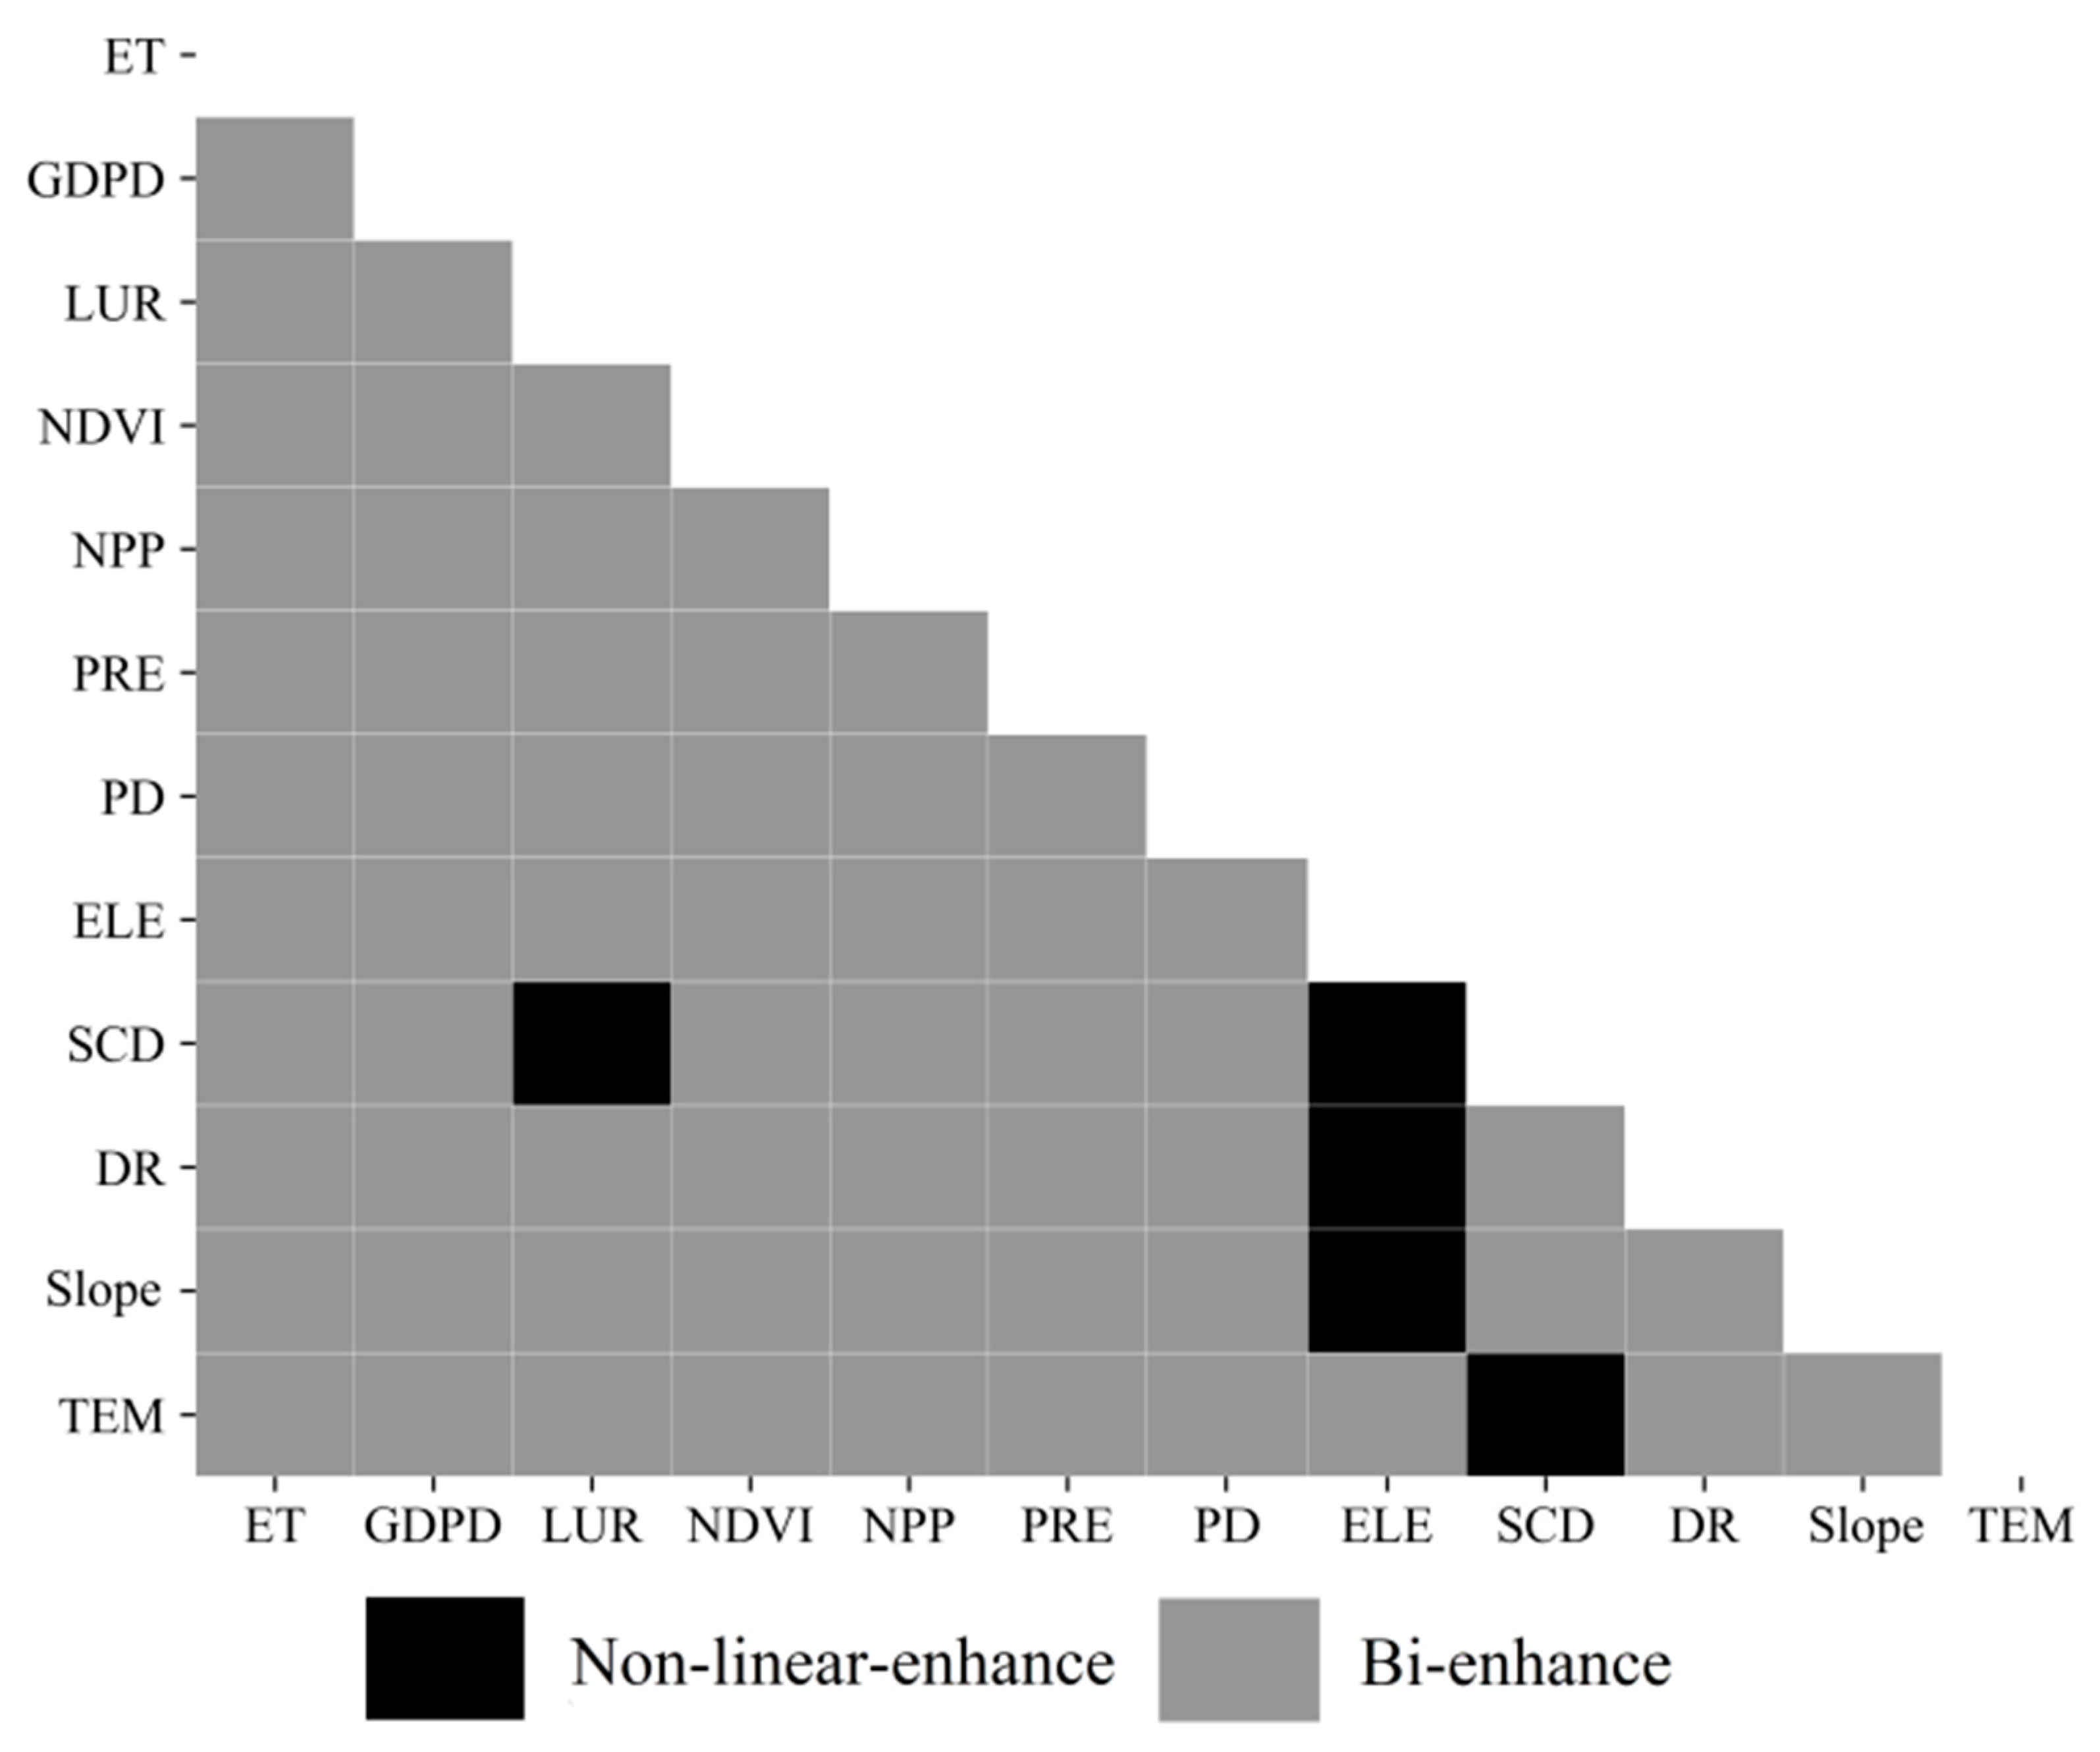
There were two types of interactive detection results, namely bi-enhanced and non-linear enhanced effects (Figure 10). Most of the interaction of the two factors showed bi-enhanced effects, and a few showed nonlinear enhanced effects. In fact, the bi-enhanced effects were most often observed for topographic factors (e.g., between elevation and slope and between elevation and slope), which means that the interaction effect was more significant than that produced by a single factor. The interaction effects exhibited nonlinear enhanced effects (such as NDVI, NPP, climate and other factors), indicating that they exceeded the effects of the sum of their individual factors.

6. Discussion

6.1. Spatial Distribution of Ecosystem Vulnerability

Based on remote sensing data, we used spatial principal components analysis to evaluate the ecosystem vulnerability of the Qinghai-Tibet Plateau for the years 2005, 2010 and 2015 at a spatial resolution of 1 km. The distribution of ecosystem vulnerability showed significant spatial differences, and the overall distribution trend gradually increased from southeast to northwest. The spatial distribution characteristics were similar to those of previous studies on Tibetan Plateau vulnerability [61]. The ecosystem vulnerability of the Qinghai-Tibet Plateau is mainly heavy and extreme, whereas previous studies found medium or heavy vulnerability; these differences might be related to the boundary of the study area and the criteria of vulnerability classification. Previous studies have focused on some areas of the Qinghai-Tibet Plateau, such as the Tibet Plateau [61], the Three-River-Source Area [26], of Delhi City [21]. Compared with previous studies, we expanded the research area to cover the entire Qinghai-Tibet Plateau. However, there is a large desert area in the northwest, resulting in mainly heavy and extreme overall vulnerability.

6.2. Effects of Natural and Socio-Economic Factors on Ecological Vulnerability

The q-statistical values for natural factors based on GDM ranged from 0.036 to 0.918, with an average of 0.449, whereas those of socio-economic factors were between 0.022 and 0.067, with an average value of 0.051. Therefore, the spatiotemporal variation of EVI mainly depended on natural factors and their changes than on socio-economic factors. Based on analyzing the effects of single factors on vulnerability, we discuss the influences of two factors on vulnerability. The results indicate that NDVI and ET interaction showed the greatest explanatory power to ecosystem vulnerability, instead of NDVI and NPP with the highest single-factor explanatory power. The NPP of the Qinghai-Tibet Plateau decreased gradually from southeast to northwest, showing significant spatial correlation with NDVI, giving it a certain consistency in explaining ecosystem vulnerability. The parameters NDVI and ET can more accurately reflect ecosystem conditions in terms of vegetation and climate than NDVI and NPP interactions. Interaction detection can supplement the analysis results of single-factor detection. A previous study has shown that ecosystem quality is highly positively correlated with NDVI and NPP [26]. Therefore, a decrease in vegetation coverage will inevitably lead to an increase in ecosystem vulnerability. Affected by global warming, rising temperatures with result in increased ET and, subsequently, a loss in soil moisture.

6.3. Policy Implications

The Qinghai-Tibet Plateau is an important ecological security barrier for China and even Asia, and the Chinese government attaches great importance to the construction of an ecological civilization on the plateau. Based on the mapping of the vulnerability of the Qinghai-Tibet Plateau ecosystem, the spatial distribution of high- and low-vulnerability areas can be seen. This provides clear evidence for the selection of pilot projects for ecological protection and restoration of the Qinghai-Tibet Plateau. The vegetation types were mainly grassland and desert in the high-vulnerability area in the northwest. Ecological protection and restoration should be therefore be emphasized in this area to prevent grassland degradation and desertification. The vegetation coverage in the low-vulnerability areas in the southeast was high and there were significant human activity impacts. The regional government should therefore improve the ecological compensation mechanism and balance the needs of ecological protection and residential development. In the analysis of factor detection, the q-statistics for evapotranspiration and precipitation reached 0.746 and 0.6, respectively, indicating significant effects on ecosystem vulnerability. Therefore, when carrying out ecosystem restoration, it is not only necessary to combine the characteristics of the ecosystem itself, but also to consider the impacts of climate change. For example, Jiang et al. [77] studied the changes in ecosystem services on the Loess Plateau and stated that ecosystem protection needs to consider climate change. In addition, human activities, such as excessive livestock production, which leads to overgrazing, will also have a great impact on the ecological environment. Chen et al. [78], studying the ecosystem of the Mongolian Plateau, showed that the impact of human activities exceeds that of natural environmental changes. Therefore, the future protection of ecosystems should not ignore human interference, and sustainable human activity is a factor to be considered in ecological restoration. For example, a moderate grazing intensity can improve grassland adaptability and reduce grassland vulnerability [27].

6.4. Limitations and Future Research Perspectives

In this study, we investigated the influences of natural and socioeconomic factors on the spatial distribution of ecosystem vulnerability. However, there were some limitations and areas of uncertainty. First, ecosystem fragility covers many factors such as nature, economy, society and policies. Due to limitations, such as the inaccessibility of data sources or the difficulty of spatial expression, some indicators compared to other ecosystem vulnerability studies are not included in the indicator system. There is no uniform standard for the selection of sensitivity, resilience and pressure indices. In this paper, climatic conditions are classified as sensitivity index, but some scholars classify them as exposure index (exposure usually refers to the interference degree of environmental and socioeconomic pressure on the ecosystem) [79]. Even if the same ecosystem vulnerability assessment model is selected, climate factors are also divided into different index categories. For example, based on same Exposure-Sensitive-Adaptive model, Jiang et al. [79] takes meteorological factors as exposure, whereas Zheng et al. [80] divides them into sensitivity indicator. Therefore, the scientific index selection method to assess ecosystem vulnerability remains to be explored in depth. Second, the ecosystem vulnerability of the Qinghai-Tibet Plateau was divided into five levels, with only relative differences. For example, the slight vulnerability in this article may be medium or heavy in other areas. Therefore, the classification standard of ecosystem vulnerability is not applicable to areas outside the study area.

7. Conclusions

We explored the spatial and temporal differentiation characteristics of the Qinghai-Tibet Plateau ecosystem vulnerability and its driving factors. The Qinghai-Tibet Plateau was mainly in a heavy and extreme vulnerability state from the years 2005 to 2015. The ecosystem vulnerability in the northwest was greater than that in the southeast. The vulnerability grade gradually increased from southeast to northwest. Overall, ecosystem vulnerability deteriorated slightly in 2005–2015. The spatial distribution of EVI showed significant clustering. The high-value area was mainly concentrated in the northwest and the low-values are in the southeast.
The EVI spatial distribution was mainly affected by natural factors. The intensity of these effects followed the order NDVI, NPP, ET, PRE, TEM, ELE, DR, Slope and SCD. Vegetation growth and hydrothermal conditions had significant effects on changes in ecosystem vulnerability. We could also show that socio-economic factors exerted a less significant effect on EVI, on average, than natural factors. The q-statistics for these variables followed the order LUR, PD and GDPD. The types of factor interactions were mainly bi-enhanced, with some showing nonlinear enhanced effects. The explanatory power of factor interaction for EVI was greater than that of single factors. The interaction of NDVI and ET had the greatest explanatory power on ecological vulnerability.
Our findings can serve as a scientific base for the establishment of policy implications. Larger efforts are needed to ensure ecological protection and restoration and to prevent grassland degradation and desertification in the high-EVI areas in the northwest. The government should also improve the ecological compensation mechanism and balance ecological protection and residents’ development needs in the southeast. In addition, in the process of ecosystem restoration, it is not only necessary to combine the characteristics of the ecosystem itself, but also to consider the impacts of a changing climate.

Author Contributions

Conceptualization, W.S.; methodology, H.L. and W.S.; formal analysis, H.L. and W.S.; investigation, W.S. and H.L.; resources, W.S.; writing—original draft preparation, H.L. and W.S.; writing—review and editing, W.S.; supervision, W.S. Both authors have read and agreed to the published version of the manuscript.

Funding

This research was supported by the Second Tibetan Plateau Scientific Expedition and Research (grant number 2019QZKK0603), the Strategic Priority Research of the Chinese Academy of Sciences (grant number XDA20040201) and the Projects of National Natural Science Foundation of China (grant number 42071233).

Institutional Review Board Statement

Not applicable.

Informed Consent Statement

Not applicable.

Data Availability Statement

All relevant data sets in this study are described in the manuscript.

Conflicts of Interest

The authors declare no conflict of interest.

References

  1. Gallopín, G.C. Linkages between vulnerability, resilience, and adaptive capacity. Glob. Environ. Chang. 2006, 16, 293–303. [Google Scholar] [CrossRef]
  2. Adger, W.N. Vulnerability. Glob. Environ. Chang. 2006, 16, 268–281. [Google Scholar] [CrossRef]
  3. Abutaleb, K.A.A.; Asmaa, M.; Hassan, E.; Ahmed, M. Climate change impacts, vulnerabilities and adaption measures for Egypt’s Nile Delta. Earth Syst. Environ. 2018, 2, 183–192. [Google Scholar] [CrossRef]
  4. Wang, X.; Zhong, X.; Gao, P. A GIS-based decision support system for regional eco-security assessment and its application on the Tibetan Plateau. J. Environ. Manag. 2010, 91, 1981–1990. [Google Scholar] [CrossRef]
  5. Turner, B.L.; Kasperson, R.E.; Matson, P.A.; McCarthy, J.J.; Corell, R.W.; Christensen, L.; Eckley, N.; Kasperson, J.X.; Luers, A.; Martello, M.L.; et al. A framework for vulnerability analysis in sustainability science. Proc. Natl. Acad. Sci. USA 2003, 100, 8074–8079. [Google Scholar] [CrossRef] [PubMed] [Green Version]
  6. Polsky, C.; Neff, R.; Yarnal, B. Building comparable global change vulnerability assessments: The vulnerability scoping diagram. Glob. Environ. Chang. 2007, 17, 472–485. [Google Scholar] [CrossRef]
  7. De Lange, H.J.; Sala, S.; Vighi, M.; Faber, J.H. Ecological vulnerability in risk assessment—A review and perspectives. Sci. Total Environ. 2010, 408, 3871–3879. [Google Scholar] [CrossRef] [PubMed]
  8. Wu, G.; Li, L.; Ahmad, S.; Chen, X.; Pan, X. A dynamic model for vulnerability assessment of regional water resources in arid areas: A case study of Bayingolin, China. Water Resour. Manag. 2013, 27, 3085–3101. [Google Scholar] [CrossRef]
  9. Ippolito, A.; Sala, S.; Faber, J.H.; Vighi, M. Ecological vulnerability analysis: A river basin case study. Sci. Total Environ. 2010, 408, 3880–3890. [Google Scholar] [CrossRef]
  10. Kang, H.; Tao, W.; Chang, Y.; Zhang, Y.; Xuxiang, L.; Chen, P. A feasible method for the division of ecological vulnerability and its driving forces in Southern Shaanxi. J. Clean. Prod. 2018, 205. [Google Scholar] [CrossRef]
  11. Gonzalez, P.; Neilson, R.; Lenihan, J.; Drapek, R. Global patterns in the vulnerability of ecosystems to vegetation shifts due to climate change. Glob. Ecol. Biogeogr. 2010, 19, 755–768. [Google Scholar] [CrossRef]
  12. Velepucha, P.A.E.; Chamba, J.A.M.; Mendoza, N.A.A.; Luna, T.L.O.; Rojas, N.S.S.; Furniss, M.J.; Howe, C.; Mendoza, Z.H.A. Tropical ecosystems vulnerability to climate change in southern Ecuador. Trop. Conserv. Sci. 2016, 9. [Google Scholar] [CrossRef] [Green Version]
  13. Comer, P.; Hak, J.; Reid, M.; Auer, S.; Schulz, K.; Hamilton, H.; Smyth, R.; Kling, M. Habitat climate change vulnerability index applied to major vegetation types of the western interior United States. Land 2019, 8, 108. [Google Scholar] [CrossRef] [Green Version]
  14. Teck, S.; Halpern, B.; Kappel, C.; Micheli, F.; Selkoe, K.; Crain, C.; Martone, R.; Shearer, C.; Arvai, J.; Fischhoff, B.; et al. Using expert judgment to estimate marine ecosystem vulnerability in the California Current. Ecol. Appl. 2010, 20, 1402–1416. [Google Scholar] [CrossRef]
  15. Zhang, Y.; Tao, B.; Li, Y. Assessment on the vulnerability of different ecosystems to extreme rainfalls in the middle and lower reaches of Yangtze River. Theor. Appl. Climatol. 2015, 121, 157–166. [Google Scholar] [CrossRef]
  16. Xin, M.; Martin, D.J.; Baiqing, S.; Xin, B. Nouveauté or Cliché? Assessment on island ecological vulnerability to Tourism: Application to Zhoushan, China. Ecol. Indic. 2019, 113. [Google Scholar] [CrossRef]
  17. Gao, S.; Sun, H.; Zhao, L.; Wang, R.; Xu, M.; Cao, G. Dynamic assessment of island ecological environment sustainability under urbanization based on rough set, synthetic index and catastrophe progression analysis theories. Ocean Coast. Manag. 2019, 178, 104790. [Google Scholar] [CrossRef]
  18. Sun, B.; Ma, X.; de Jong, M.; Bao, X. Assessment on Island Ecological Vulnerability to Urbanization: A Tale of Chongming Island, China. Sustainability 2019, 11, 2536. [Google Scholar] [CrossRef] [Green Version]
  19. Malekmohammadi, B.; Jahanishakib, F. Vulnerability assessment of wetland landscape ecosystem services using driver-pressure-state-impact-response (DPSIR) model. Ecol. Indic. 2017, 82, 293–303. [Google Scholar] [CrossRef]
  20. Zhang, X.; Fu, X.; Zhang, L. Ecological vulnerability assessment of estuarine wetland of the Yellow River Delta. J. Interdiscip. Math. 2016, 19. [Google Scholar] [CrossRef]
  21. Jin, X.; Jin, Y.; Mao, X. Ecological risk assessment of cities on the Tibetan Plateau based on land use/land cover changes—Case study of Delingha City. Ecol. Indic. 2019, 101, 185–191. [Google Scholar] [CrossRef]
  22. Niu, W. The discriminatory index with regard to the weakness, overlapness, and breadth of ecotone. Acta Ecol. Sin. 1989, 9, 97–105. [Google Scholar]
  23. Kerang, L.; Yufeng, C. Analysis on vulnerability of forest in China responsed to global climatie change. Acta Geogr. Sin. 1996, 51, 40–49. [Google Scholar]
  24. Qang, G.Z.; Yan, L.J.; da Fang, Z. The relations analysis between ecological environmental quality of Chinese land resources and population. J. Remote Sens. 1999, 1, 66–70. [Google Scholar] [CrossRef]
  25. Erda, L. Agricultural vulnerability and adaptation to global warming in China. Water Air Soil Pollut. 1996, 92, 63–73. [Google Scholar] [CrossRef]
  26. Guo, B.; Zhou, Y.; Zhu, J.; Liu, W.; Wang, F.; Wang, L.; Yan, F.; Wang, F.; Yang, G.; Luo, W.; et al. Spatial patterns of ecosystem vulnerability changes during 2001–2011 in the three-river source region of the Qinghai-Tibetan Plateau, China. J. Arid Land 2016, 8, 23–35. [Google Scholar] [CrossRef]
  27. Meng, L.; Zhang, X.; Yongtao, H.; Niu, B.; Wu, J. Assessment of the vulnerability of alpine grasslands on the Qinghai-Tibetan Plateau. PeerJ 2020, 8, e8513. [Google Scholar] [CrossRef]
  28. Bhatt, R.; Hossain, A. Concept and consequence of evapotranspiration for sustainable crop production in the era of climate change. Adv. Evapotranspiration Methods Appl. 2019, 1, 1–13. [Google Scholar] [CrossRef] [Green Version]
  29. Burton, I.; Kates, R.W.; White, G.F. The Environment as Hazard, 2nd ed.; Guilford Press: New York, NY, USA, 1993. [Google Scholar]
  30. Zobler, L.; White, G. Natural hazards: Local, national, global. Geogr. Rev. 1976, 66, 247. [Google Scholar] [CrossRef]
  31. Timmerman, P. Vulnerability. Resilience and the collapse of socieiy: A review of models and possible climatic applications. Ecol. Monogr. 1981, 1–46. [Google Scholar] [CrossRef]
  32. Dow, K. Exploring differences in our common future(s): The meaning of vulnerability to global environmental change. Geoforum 1992, 23, 417–436. [Google Scholar] [CrossRef]
  33. Cutter, S.L. Vulnerability to environmental hazards. Prog. Hum. Geogr. 1996, 20, 529–539. [Google Scholar] [CrossRef]
  34. Parry, M.; Parry, M.L.; Canziani, O.; Palutikof, J.; van der Linden, P.; Hanson, C. Climate Change 2007-Impacts, Adaptation and Vulnerability: Working Group II Contribution to the Fourth Assessment Report of the IPCC; Cambridge University Press: Cambridge, UK, 2007; Volume 4. [Google Scholar]
  35. Lee, Y.-J. Social vulnerability indicators as a sustainable planning tool. Environ. Impact Assess. Rev. 2014, 44, 31–42. [Google Scholar] [CrossRef]
  36. Kormondy, E.J. A brief introduction to the history of ecology. Am. Biol. Teach. 2012, 74, 441–443. [Google Scholar] [CrossRef]
  37. Williams, L.R.R.; Kapustka, L.A. Ecosystem vulnerability: A complex interface with technical components. Environ. Toxicol. Chem. 2000, 19, 1055–1058. [Google Scholar] [CrossRef]
  38. Birkmann, J. Risk and vulnerability indicators at different scales: Applicability, usefulness and policy implications. Environ. Hazards 2007, 7, 20–31. [Google Scholar] [CrossRef]
  39. McCarthy, J.J.; Canziani, O.F.; Leary, N.; Dokken, D.J.; White, K.S. Climate change 2001: Impacts, adaptation, and vulnerability. Contribution of working group II to the third assessment report of the Intergovernmental Panel on Climate Change (IPCC). Glob. Ecol. Biogeogr. 2001, 12, 87–88. [Google Scholar] [CrossRef]
  40. Dieleman, H. Urban agriculture in Mexico City; balancing between ecological, economic, social and symbolic value. J. Clean. Prod. 2017, 163, S156–S163. [Google Scholar] [CrossRef]
  41. Zhang, F.; Liu, X.; Zhang, J.; Wu, R.; Ma, Q.; Chen, Y. Ecological vulnerability assessment based on multi-sources data and SD model in Yinma River Basin, China. Ecol. Modell. 2017, 349. [Google Scholar] [CrossRef]
  42. Zhang, X.; Wang, L.; Fu, X.; Li, H.; Xu, C. Ecological vulnerability assessment based on PSSR in Yellow River Delta. J. Clean. Prod. 2017, 167. [Google Scholar] [CrossRef]
  43. Zhou, Y.; Yuyang, Z.; Guofu, Z.; Qifen, H.; Li, Y. Evaluation of ecological vulnerability of county areas in Karst mountain area based on VSD model—A case study of Duyun City. In IOP Conference Series: Earth and Environmental Science; IOP Publishing: Bristol, UK, 2020. [Google Scholar]
  44. Sun, P.J.; Xiu, C.L. Study on the vulnerability of economic development in mining cities based on the PSE Model. Geogr. Res. 2011, 30, 301–310. [Google Scholar] [CrossRef]
  45. Liu, Z.; Yu, X.; Li, L.; Huang, M. Vulnerability assessment of eco-environment in Yimeng mountainous area of Shandong Province based on SRP conceptual model. J. Appl. Ecol. 2011, 22, 2084–2090. [Google Scholar] [CrossRef]
  46. Thirumalaivasan, D.; Karmegam, M.; Venugopal, K. AHP-DRASTIC: Software for specific aquifer vulnerability assessment using DRASTIC model and GIS. Environ. Model. Softw. 2003, 18, 645–656. [Google Scholar] [CrossRef]
  47. Dixon, B. Groundwater vulnerability mapping: A GIS and fuzzy rule based integrated tool. Appl. Geogr. 2005, 25, 327–347. [Google Scholar] [CrossRef]
  48. Park, Y.S.; Chon, T.S.; Kwak, I.S.; Lek, S. Hierarchical community classification and assessment of aquatic ecosystems using artificial neural networks. Sci. Total Environ. 2004, 327, 105–122. [Google Scholar] [CrossRef]
  49. Gang, H.; Keyu, B.; Wenwen, W.; Yanna, Z.; Shuzhou, L.; Lan, J. Assessment of ecological vulnerability of resource-based cities based on entropy-set pair analysis. Environ. Technol. 2019, 42, 874–1884. [Google Scholar] [CrossRef]
  50. Wang, Y.; Ding, Q.; Zhuang, D. An eco-city evaluation method based on spatial analysis technology: A case study of Jiangsu Province, China. Ecol. Indic. 2015, 58, 37–46. [Google Scholar] [CrossRef]
  51. Twumasi, Y.A.; Merem, E.C. Using remote sensing and GIS in the analysis of ecosystem decline along the River Niger Basin: The case of Mali and Niger. Int. J. Environ. Res. Public Health 2007, 4, 173–184. [Google Scholar] [CrossRef] [Green Version]
  52. Xue, L.; Wang, J.; Zhang, L.; Wei, G.; Zhu, B. Spatiotemporal analysis of ecological vulnerability and management in the Tarim River Basin, China. Sci. Total Environ. 2018, 649. [Google Scholar] [CrossRef]
  53. Guo, B.; Zang, W.; Luo, W. Spatial-temporal shifts of ecological vulnerability of Karst Mountain ecosystem-impacts of global change and anthropogenic interference. Sci. Total Environ. 2020, 741, 140256. [Google Scholar] [CrossRef]
  54. Jia, J.J.; Zhao, J.; Wang, J.B.; Gao, C.; Chang, R.Y. Ecological vulnerability assessment of Shiyang River basin based on SRP model. J. Arid Land Resour. Environ. 2020, 34, 34–41. [Google Scholar]
  55. Chuvieco, E.; Martínez, S.; Román, M.V.; Hantson, S.; Pettinari, M.L. Integration of ecological and socio-economic factors to assess global vulnerability to wildfire. Glob. Ecol. Biogeogr. 2014, 23, 245–258. [Google Scholar] [CrossRef]
  56. Ding, Q.; Shi, X.; Zhuang, D.; Wang, Y. Temporal and spatial distributions of ecological vulnerability under the influence of natural and anthropogenic factors in an eco-province under construction in China. Sustainability 2018, 10, 87. [Google Scholar] [CrossRef] [Green Version]
  57. Li, R.; Han, R.; Yu, Q.; Qi, S.; Guo, L. Spatial heterogeneous of ecological vulnerability in arid and semi-arid area: A case of the Ningxia Hui autonomous region, China. Sustainability 2020, 12, 4401. [Google Scholar] [CrossRef]
  58. Parson, E.A.; Corell, R.W.; Barron, E.J.; Burkett, V.; Janetos, A.; Joyce, L.; Karl, T.R.; MacCracken, M.C.; Melillo, J.; Morgan, M.G.; et al. Understanding climatic impacts, vulnerabilities, and adaptation in the United States: Building a capacity for assessment. Clim. Chang. 2003, 57, 9–42. [Google Scholar] [CrossRef] [Green Version]
  59. National Aeronautics and Space Administration. Available online: https://search.earthdata.nasa.gov (accessed on 10 March 2021).
  60. Resource Environmental Science and Data Center, Chinese Academy of Sciences. Available online: http://www.resdc.cn/Default.aspx (accessed on 5 March 2021).
  61. Gao, J.; Hou, W.; Zhao, D.; Wu, S. Comprehensive assessment of natural ecosystem vulnerability in Tibetan Plateau based on satellite-derived datasets. Sci. Agric. Sin. 2016, 36, 580–587. [Google Scholar] [CrossRef]
  62. Zhao, M.; Running, S. Drought-induced reduction in global terrestrial net primary production from 2000 through 2009. Science 2010, 329, 940–943. [Google Scholar] [CrossRef] [Green Version]
  63. Luo, H.; Wang, L.; Fang, J.; Li, Y.; Li, H.; Dai, S. NDVI, Temperature and Precipitation Variables and Their Relationships in Hainan Island from 2001 to 2014 Based on MODIS NDVI; Springer: Berlin/Heidelberg, Germany, 2016. [Google Scholar]
  64. Imhoff, M.L.; Bounoua, L.; de Fries, R.; Lawrence, W.T.; Stutzer, D.; Tucker, C.J.; Ricketts, T. The consequences of urban land transformation on net primary productivity in the United States. Remote Sens. Environ. 2004, 89, 434–443. [Google Scholar] [CrossRef]
  65. Zhao, J.; Ji, G.; Tian, Y.; Chen, Y.; Wang, Z. Environmental vulnerability assessment for mainland China based on entropy method. Ecol. Indic. 2018, 91, 410–422. [Google Scholar] [CrossRef]
  66. Jolliffe, I.T.; Morgan, B.J. Principal component analysis and exploratory factor analysis. Stat. Methods Med. Res. 1992, 1, 69–95. [Google Scholar] [CrossRef]
  67. Zou, T.; Yoshino, K. Environmental vulnerability evaluation using a spatial principal components approach in the Daxing’anling region, China. Ecol. Indic. 2017, 78, 405–415. [Google Scholar] [CrossRef]
  68. Liu, Q.; Shi, T. Spatiotemporal differentiation and the factors of ecological vulnerability in the Toutun River Basin based on remote sensing data. Sustainability 2019, 11, 4160. [Google Scholar] [CrossRef] [Green Version]
  69. Haining, R. Spatial Data Analysis in the Social and Environmental Sciences; Cambridge University Press: Cambridge, UK, 1993. [Google Scholar]
  70. Anselin, L. Spatial Econometrics: Methods and Models; Springer Science & Business Media: Boston, MA, USA, 1988. [Google Scholar]
  71. Moran, P.A. The interpretation of statistical maps. J. R. Stat. Soc. 1948, 10, 243–251. [Google Scholar] [CrossRef]
  72. Anselin, L. Local Indicators of Spatial Association—LISA. Geogr. Anal. 1995, 27, 93–115. [Google Scholar] [CrossRef]
  73. Shi, T.; Hu, Z.; Shi, Z.; Guo, L.; Chen, Y.; Li, Q.; Wu, G. Geo-detection of factors controlling spatial patterns of heavy metals in urban topsoil using multi-source data. Sci. Total Environ. 2018, 643, 451–459. [Google Scholar] [CrossRef]
  74. Cao, W.; Yuan, X. Region-county characteristic of spatial-temporal evolution and influencing factor on land use-related CO2 emissions in Chongqing of China, 1997–2015. J. Clean. Prod. 2019, 231, 619–632. [Google Scholar] [CrossRef]
  75. Chen, S.; Liu, X.; Wu, Y.; Xu, G.; Zhang, X.; Mei, S.; Zhang, Z.; O’Meara, M.; O’Gara, M.C.; Tan, X.; et al. The application of meteorological data and search index data in improving the prediction of HFMD: A study of two cities in Guangdong Province, China. Sci. Total Environ. 2019, 652, 1013–1021. [Google Scholar] [CrossRef]
  76. Wang, J.; Xu, C. Geodetector: Principle and prospective. Acta Geogr. Sin. 2017, 72, 116–134. [Google Scholar] [CrossRef]
  77. Jiang, C.; Wang, F.; Zhang, H.; Dong, X. Quantifying changes in multiple ecosystem services during 2000–2012 on the Loess Plateau, China, as a result of climate variability and ecological restoration. Ecol. Eng. 2016, 97, 258–271. [Google Scholar] [CrossRef]
  78. Chen, J.; John, R.; Shao, C.; Fan, Y.; Zhang, Y.; Amarjargal, A.; Brown, D.G.; Qi, J.; Han, J.; Lafortezza, R. Policy shifts influence the functional changes of the CNH systems on the Mongolian plateau. Environ. Res. Lett. 2015, 10. [Google Scholar] [CrossRef]
  79. Jiang, L.; Huang, X.; Wang, F.; Liu, Y.; An, P. Method for evaluating ecological vulnerability under climate change based on remote sensing: A case study. Ecol. Indic. 2018, 85. [Google Scholar] [CrossRef]
  80. Zang, Z.; Zou, X.; Zuo, P.; Song, Q.; Wang, C.; Wang, J. Impact of landscape patterns on ecological vulnerability and ecosystem service values: An empirical analysis of Yancheng Nature Reserve in China. Ecol. Indic. 2017, 72. [Google Scholar] [CrossRef]
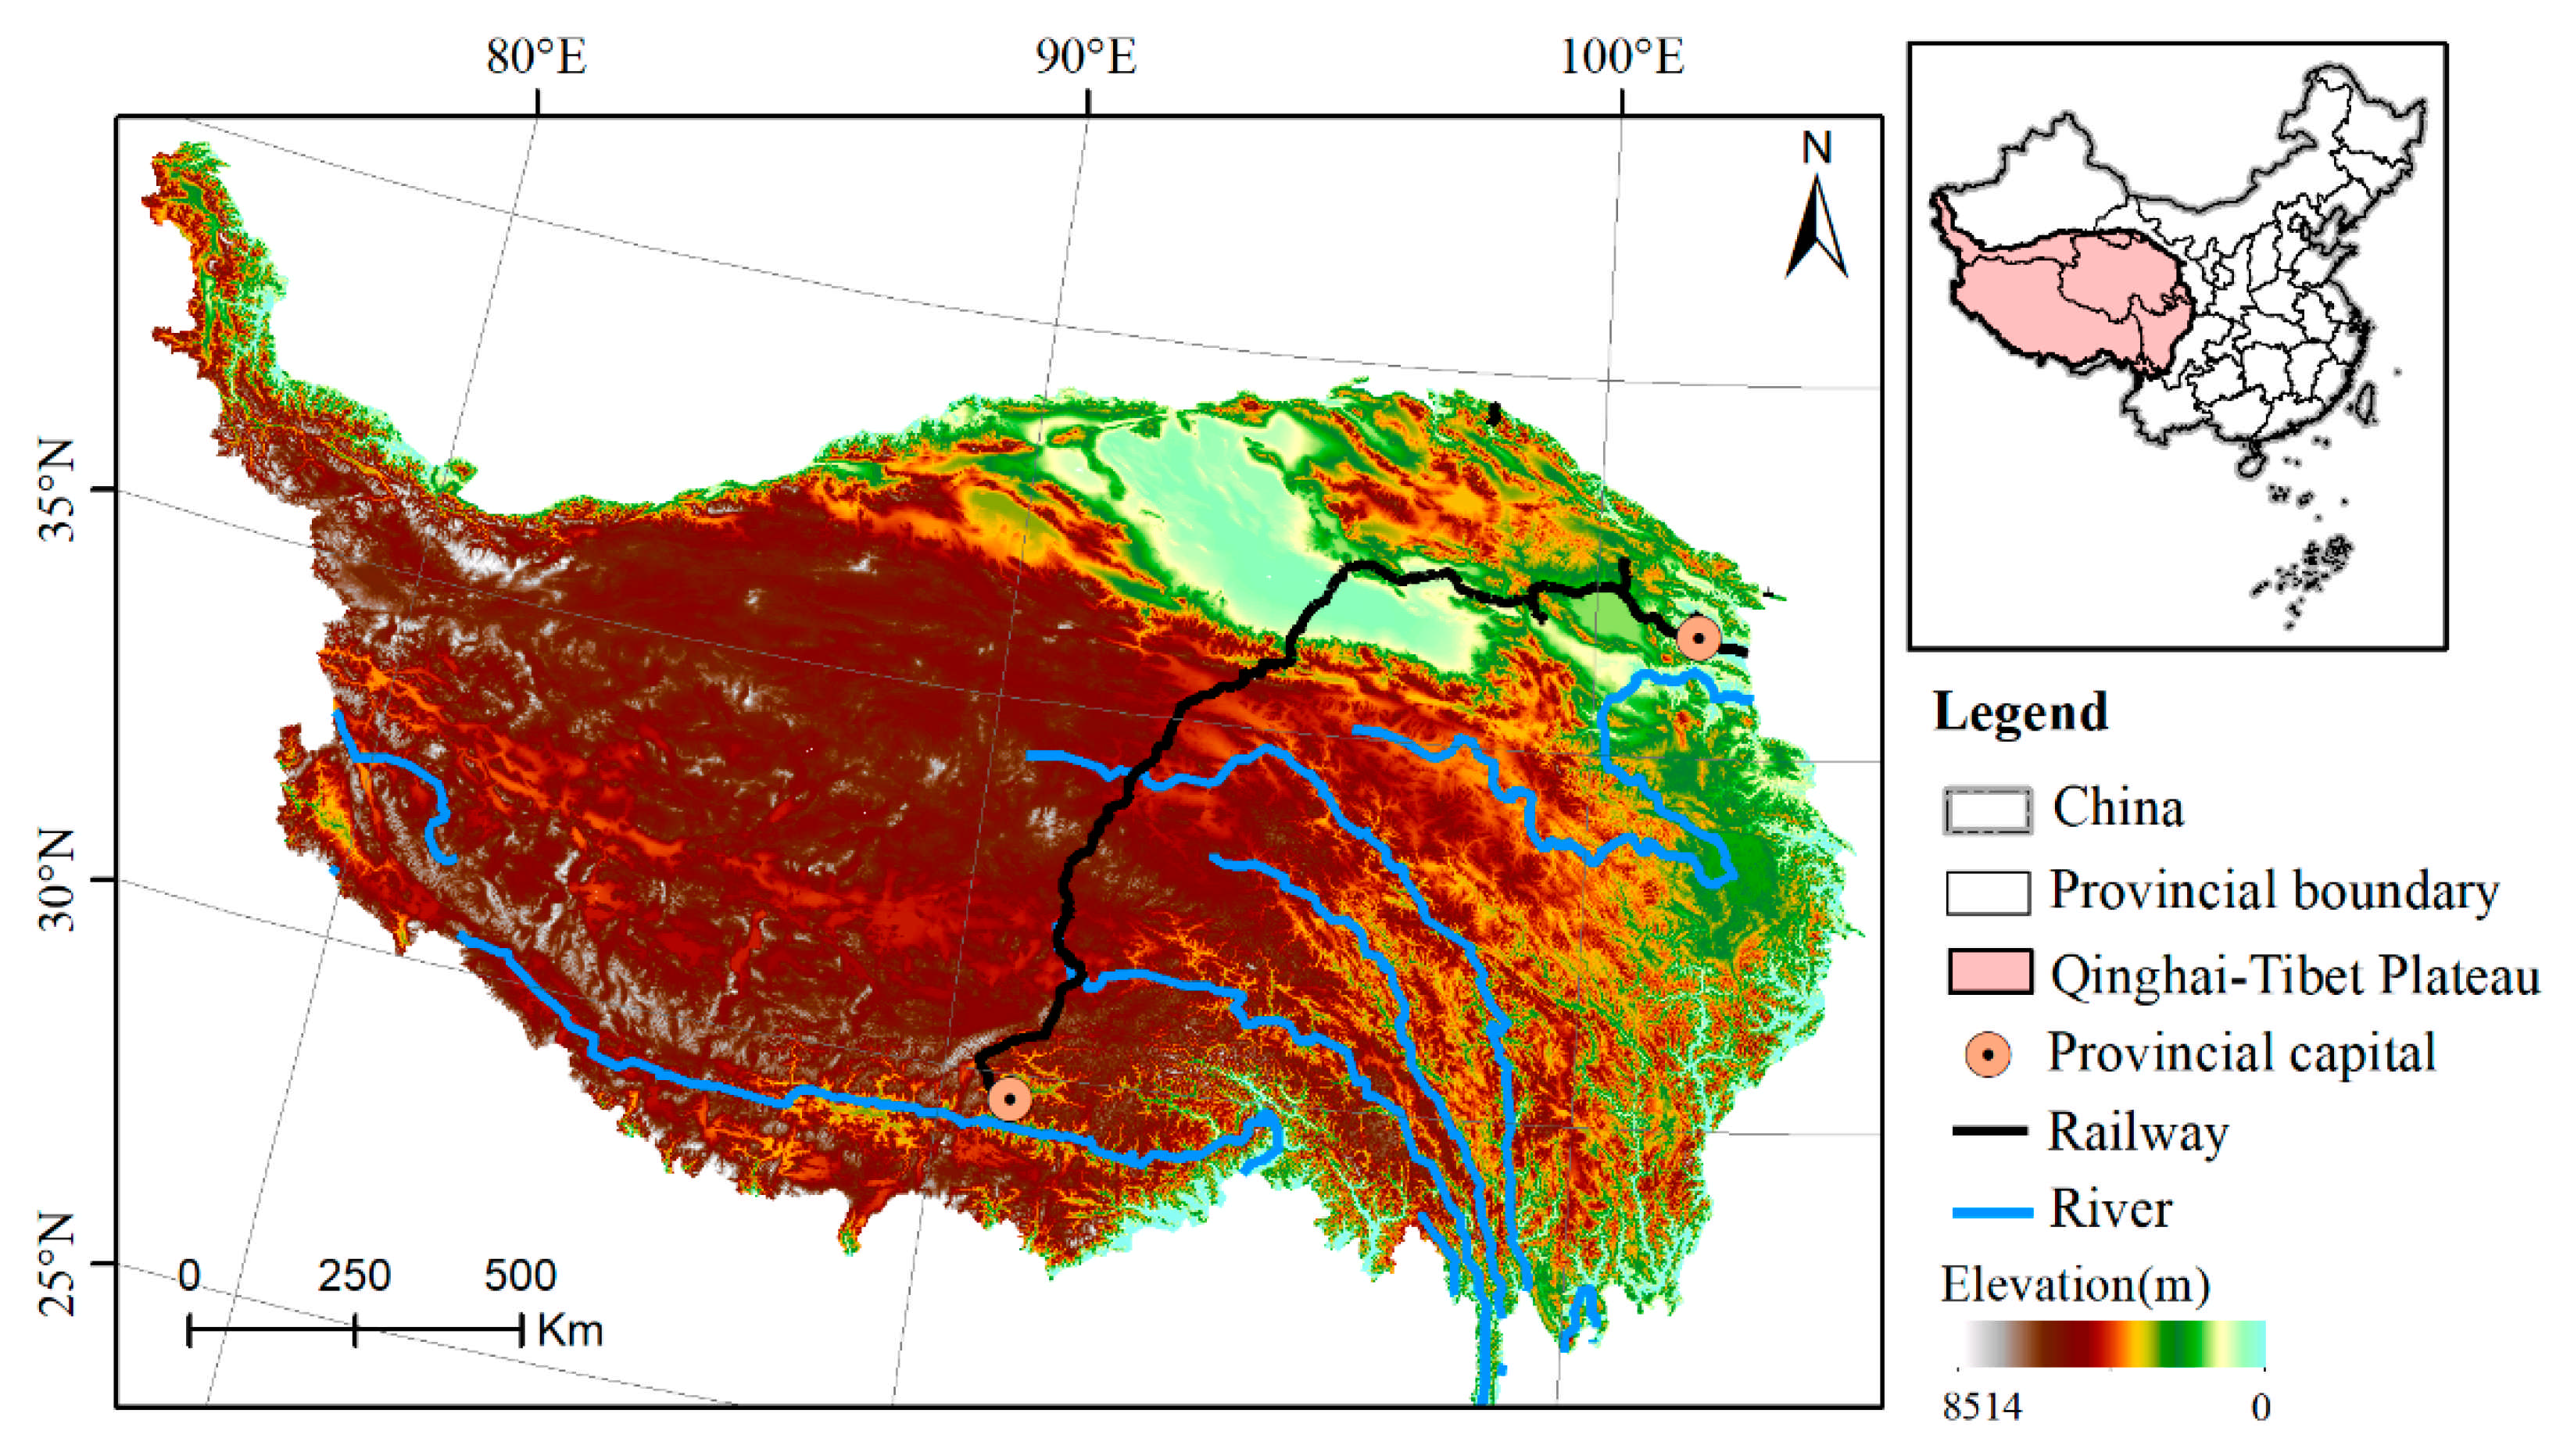
Figure 1. Geographical location of the Qinghai-Tibet Plateau.
Ijerph 18 06508 g001
Figure 2. Flowchart showing the process followed in this analysis for assessing ecosystem vulnerability of the Qinghai-Tibet Plateau.
Ijerph 18 06508 g002
Figure 3. Area proportions of different ecosystem vulnerability levels on the Qinghai-Tibet Plateau in 2005, 2010 and 2015.
Ijerph 18 06508 g003
Figure 4. Area conversion of ecosystem vulnerability grades on the Qinghai-Tibet Plateau in 2005, 2010 and 2015.
Ijerph 18 06508 g004
Figure 5. Spatial distribution of ecosystem vulnerability on the Qinghai-Tibet Plateau in (a) 2005, (b) 2010 and (c) 2015.
Ijerph 18 06508 g005
Figure 6. Temporal variations in ecosystem vulnerability on the Qinghai-Tibet Plateau in (a) 2005–2010, (b) 2010–2015, (c) 2005–2010.
Ijerph 18 06508 g006
Figure 7. Moran scatterplot of EVI on the Qinghai-Tibet Plateau in (a) 2005, (b) 2010, (c) 2015.
Ijerph 18 06508 g007
Figure 8. Local spatial autocorrelation diagram for the Qinghai-Tibet Plateau in (a) 2005, (b) 2010, (c) 2015.
Ijerph 18 06508 g008
Figure 9. Interactions between pairs of forces influencing EVI. (Notes: the q-statistic on the diagonal line in each case denotes the separate effects of each variable (Table 2), whereas the lower periodic matrix includes values for interactive effects between private sources.).
Ijerph 18 06508 g009
Figure 10. Interaction type between pairs of forces influencing EVI.
Ijerph 18 06508 g010
Table 1. Some definitions of ecosystem vulnerability.
Organization/AuthorDefinition of Ecosystem Vulnerability
Williams et al. [37]The potential of an ecosystem to modulate its response to stressors over time and space, where that potential is determined by the characteristics of an ecosystem with many levels of organization. It is an estimate of the inability of an ecosystem to tolerate stressors over time and space.
Birkmann [38]The sensitive response and self-restoring ability of an ecosystem when it is subjected to external interference. It usually occurs within a specific time and space and is an inherent attribute of the ecosystem.
IPCC [39]The degree of sensitivity and self-regulation of an ecosystem to disturbances caused by climate change, including extreme weather events.
Table 2. Different ecosystem vulnerability assessment indicators.
YearStudy AreaLevel IndicatorsSecondary Indicators
2017Yellow River Delta, China [20]Pressure, support, state, responseLand reclamation rate, population density, human disturbance index, normalized difference vegetation index (NDVI), afforestation area percentage, Shannon’s evenness index, ecological water percentage, pollution load, elastic degree of wetland evaluation; wetland area of change, gross domestic product
2018Southern Shaanxi, China [10]Environmental topography and socio-economic levelCultivation ratio, land use rate, natural growth rate, population density, gross domestic product (GDP) per capita, agricultural output, industrial output, NDVI, average precipitation, average annual temperature, hours of sunshine, average elevation
2018Jiangsu, China [56]Pressure, state, responseSoil erosion sensitivity, soil desertification sensitivity, landscape patch density, landscape evenness, land resource use degree
2020Ningxia Hui Autonomous Region, China [57]Natural and social factorsDigital elevation model, hours of sunshine, average annual precipitation, average annual temperature, NDVI soil erosion and degree of land use, GDP, agricultural output, industrial output, population density, grassland area
2020Karst Mountains, China [53]Sensitivity, resiliency, pressureClimate, soil, terrain, water, geology, vegetation, land use, social development, economic development
Table 3. Basic data and sources of ecological vulnerability assessment for the Qinghai-Tibet Plateau.
TypeSourceSpatial ResolutionTemporal Resolution
NDVIMODIS/MOD13A3 [59]1 kmMonthly
Land useRESDC [60]1 kmYearly
DEMRESDC1 kmYearly
Annual average temperatureRESDC1 kmYearly
Annual precipitationRESDC1 kmYearly
NPPMODIS/MOD17A31 kmYearly
ETMODIS/MOD16A3500 mYearly
PopulationRESDC1 kmYearly
GDPRESDC1 kmYearly
Notes: NDVI is Normalized difference vegetation index; DEM is digital elevation model; NPP is Net Primary Productivity; ET is Evapotranspiration; GDP is gross domestic product; RESDC is Resource and Environment Science and Data Center, Chinese Academy of Sciences.
Table 4. Ecosystem vulnerability assessment indicators for the Qinghai-Tibet Plateau.
Factor CategoryIndicatorType
SensitivityAnnual precipitation (PRE)
Annual average temperature (TEM)
Evapotranspiration (ET)
Elevation (ELE)+
Slope+
Surface cutting depth (SCD)+
Degree of relief (DR)+
ResilienceNormalized difference vegetation index (NDVI)
Net Primary Productivity (NPP)
PressurePopulation density (PD)+
Gross domestic product density (GDPD)+
Land use rate (LUR)+
Note: “+” means positive action; the greater the value, the lower the quality of the ecological environment, the greater the probability of a fragile ecological environment; ”−” means reverse action.
Table 5. Results of the SPCA (spatial principal components analysis) of ecosystem vulnerability on the Qinghai-Tibet Plateau.
PCEigenvaluesContribution Ratio of Eigenvalues/%Cumulative Contribution of Eigenvalues/%
200520102015200520102015200520102015
10.06690.07290.076348.732748.581451.933248.732748.581451.9332
20.03910.04290.039228.520228.564926.658777.252977.146378.5920
30.01010.01050.00927.37967.00876.278684.632584.155084.8706
40.00700.00790.00725.08805.25444.880389.720489.409489.7509
Table 6. Classification of the ecosystem vulnerability index (EVI).
EVISlightLightMediumHeavyExtreme
Grading standard<0.350.35–0.50.5–0.640.64–0.77>0.77
Table 7. Interaction Detector Model.
DescriptionInteraction Type
q (X1∩X2) < Min (q (X1), q (X2))Non-linear-weaken
Min(q (X1), q (X2)) < q (X1∩X2) < Max(q (X1)), q (X2))Uni-weaken
q (X1∩X2) > Max (q (X1), q (X2))Bi-enhance
q (X1∩X2) = q (X1) + q (X2)Independent
q (X1∩X2) > q (X1) + q (X2)Non-linear-enhance
Note: q (X1∩X2) represents the interaction effect of influencing factors X1 and X2, and q (X1) and q (X2) represent the respective effects of X1 and X2, respectively.
Table 8. Results for different factors of EVI.
FactorsNDVINPPETPRETEMELEDRSlopeLURPDSCDGDPD
q statistic0.9180.8680.7460.6000.3340.2390.1520.1500.0670.0630.0360.022
p Value0.0000.0000.0000.0000.0000.0000.0000.0000.0000.0000.0000.000
Publisher’s Note: MDPI stays neutral with regard to jurisdictional claims in published maps and institutional affiliations.