
Urban and Rural Population and Development Research on Medical Coordination: In View of Dalian 2008–2017 Official Statistics


Abstract
1. Introduction
2. Methods
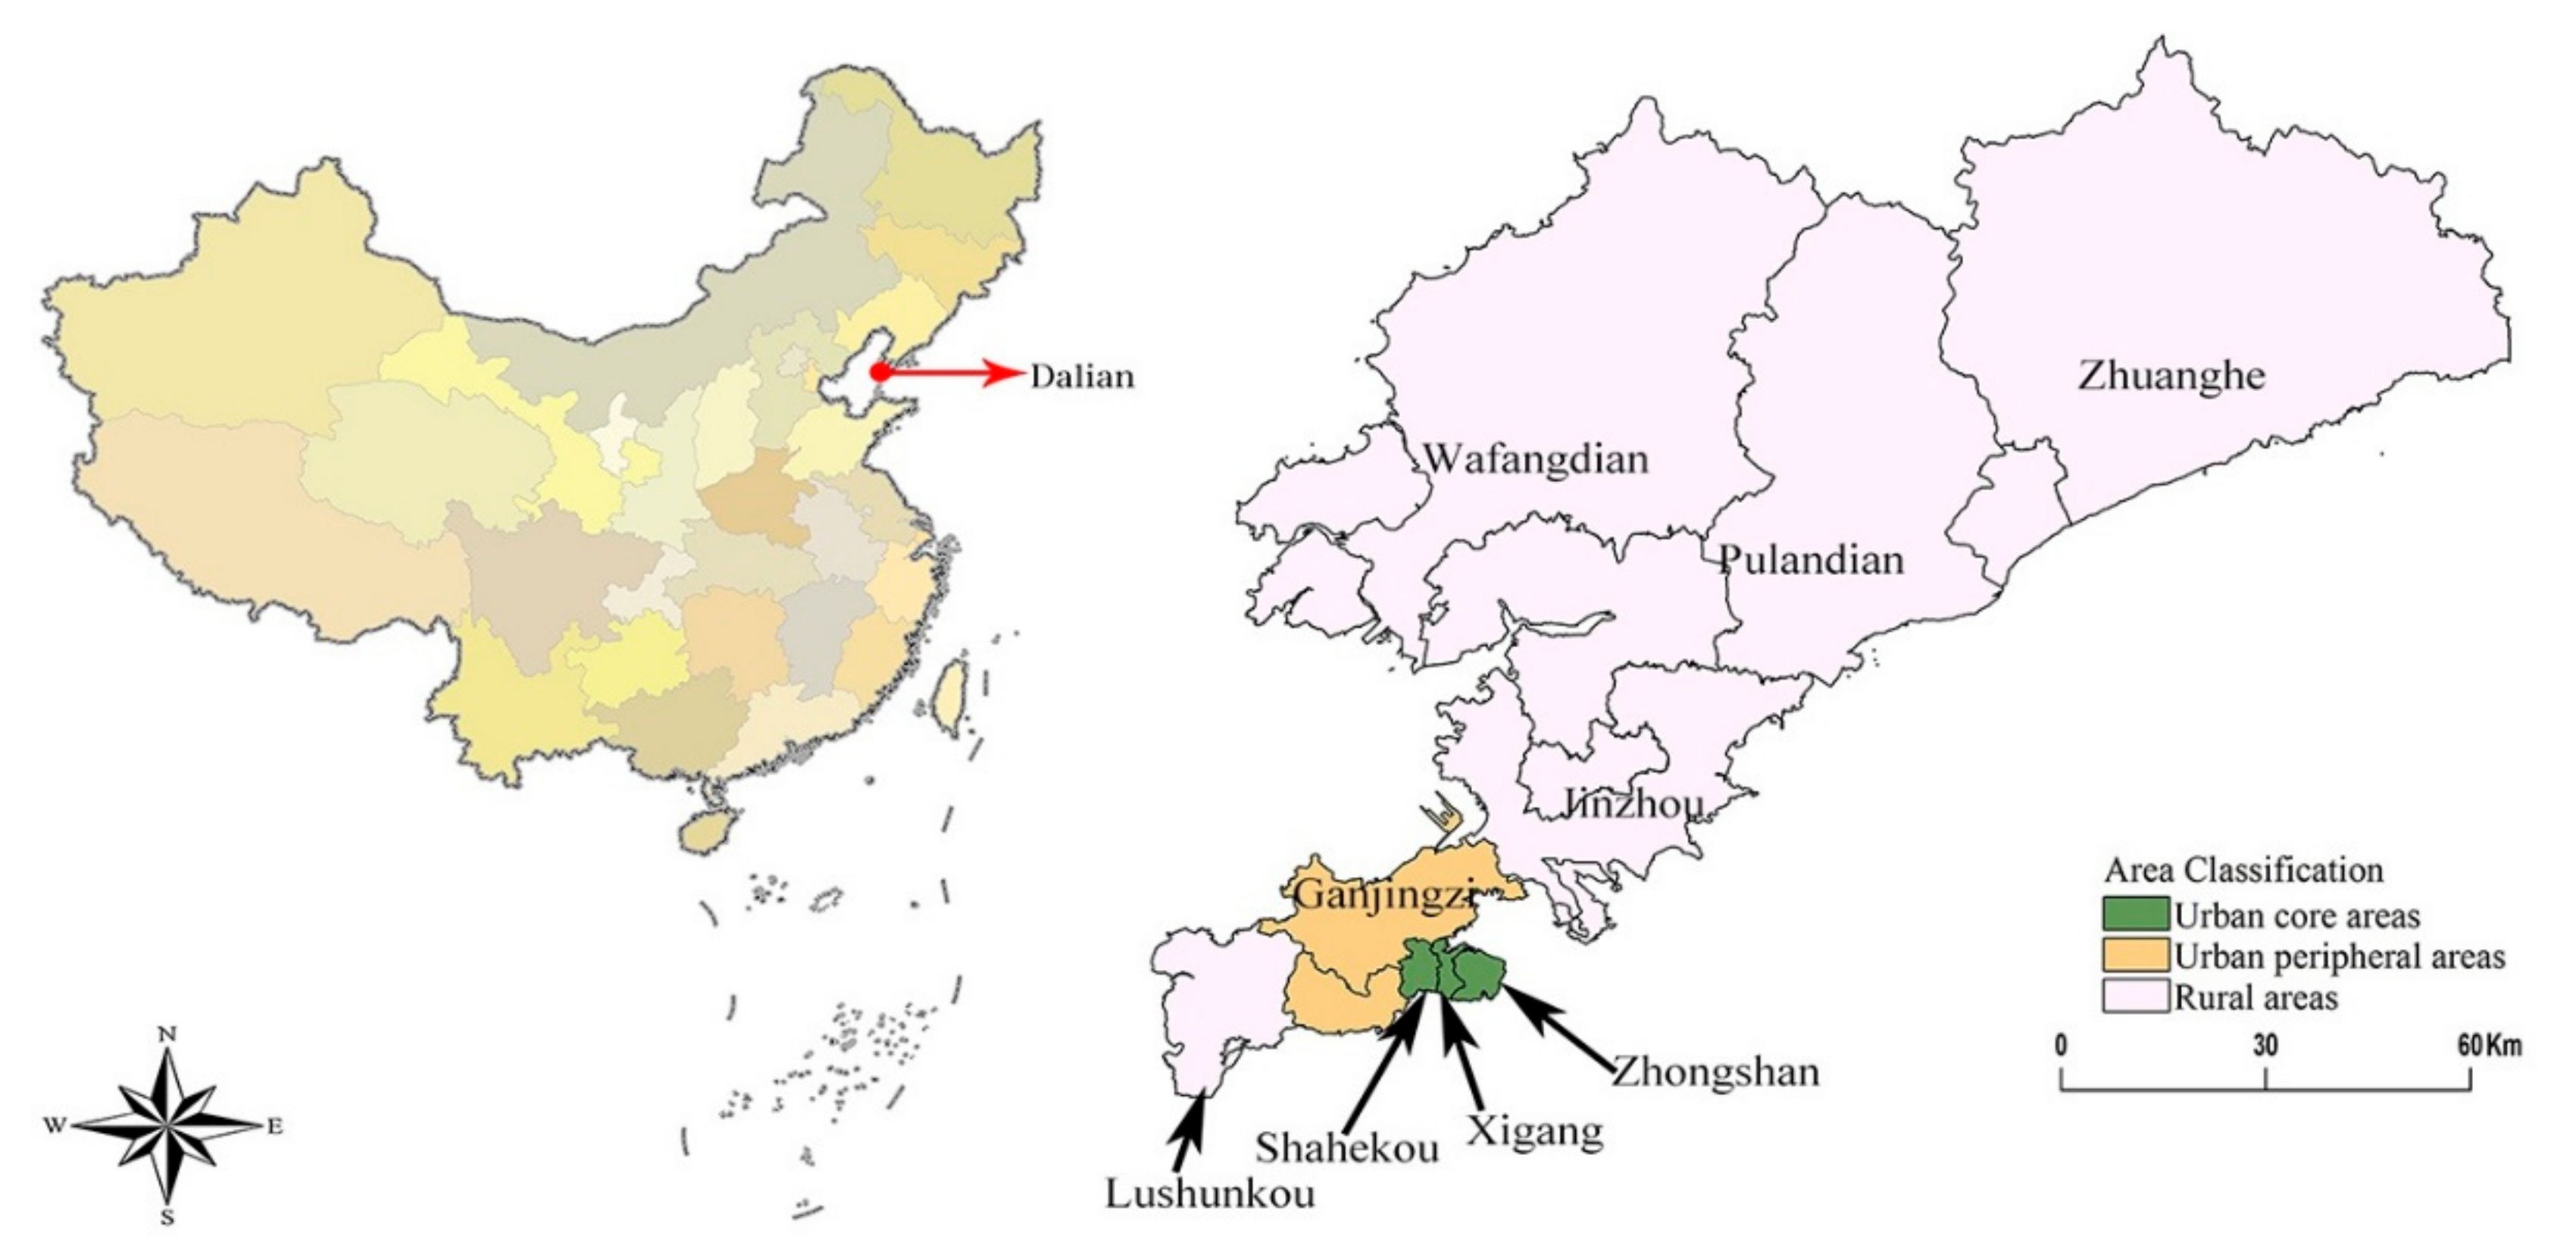
2.1. Study Design and Data Collection
2.2. Mathematical Model
2.2.1. Analytic Hierarchy Process (AHP)
2.2.2. Entropy Weight Method (EWP)
2.2.3. Comprehensive Weight Model
2.2.4. Comprehensive Development Index
2.2.5. Coupling Coordination Model
2.3. Statistical Analysis
3. Results
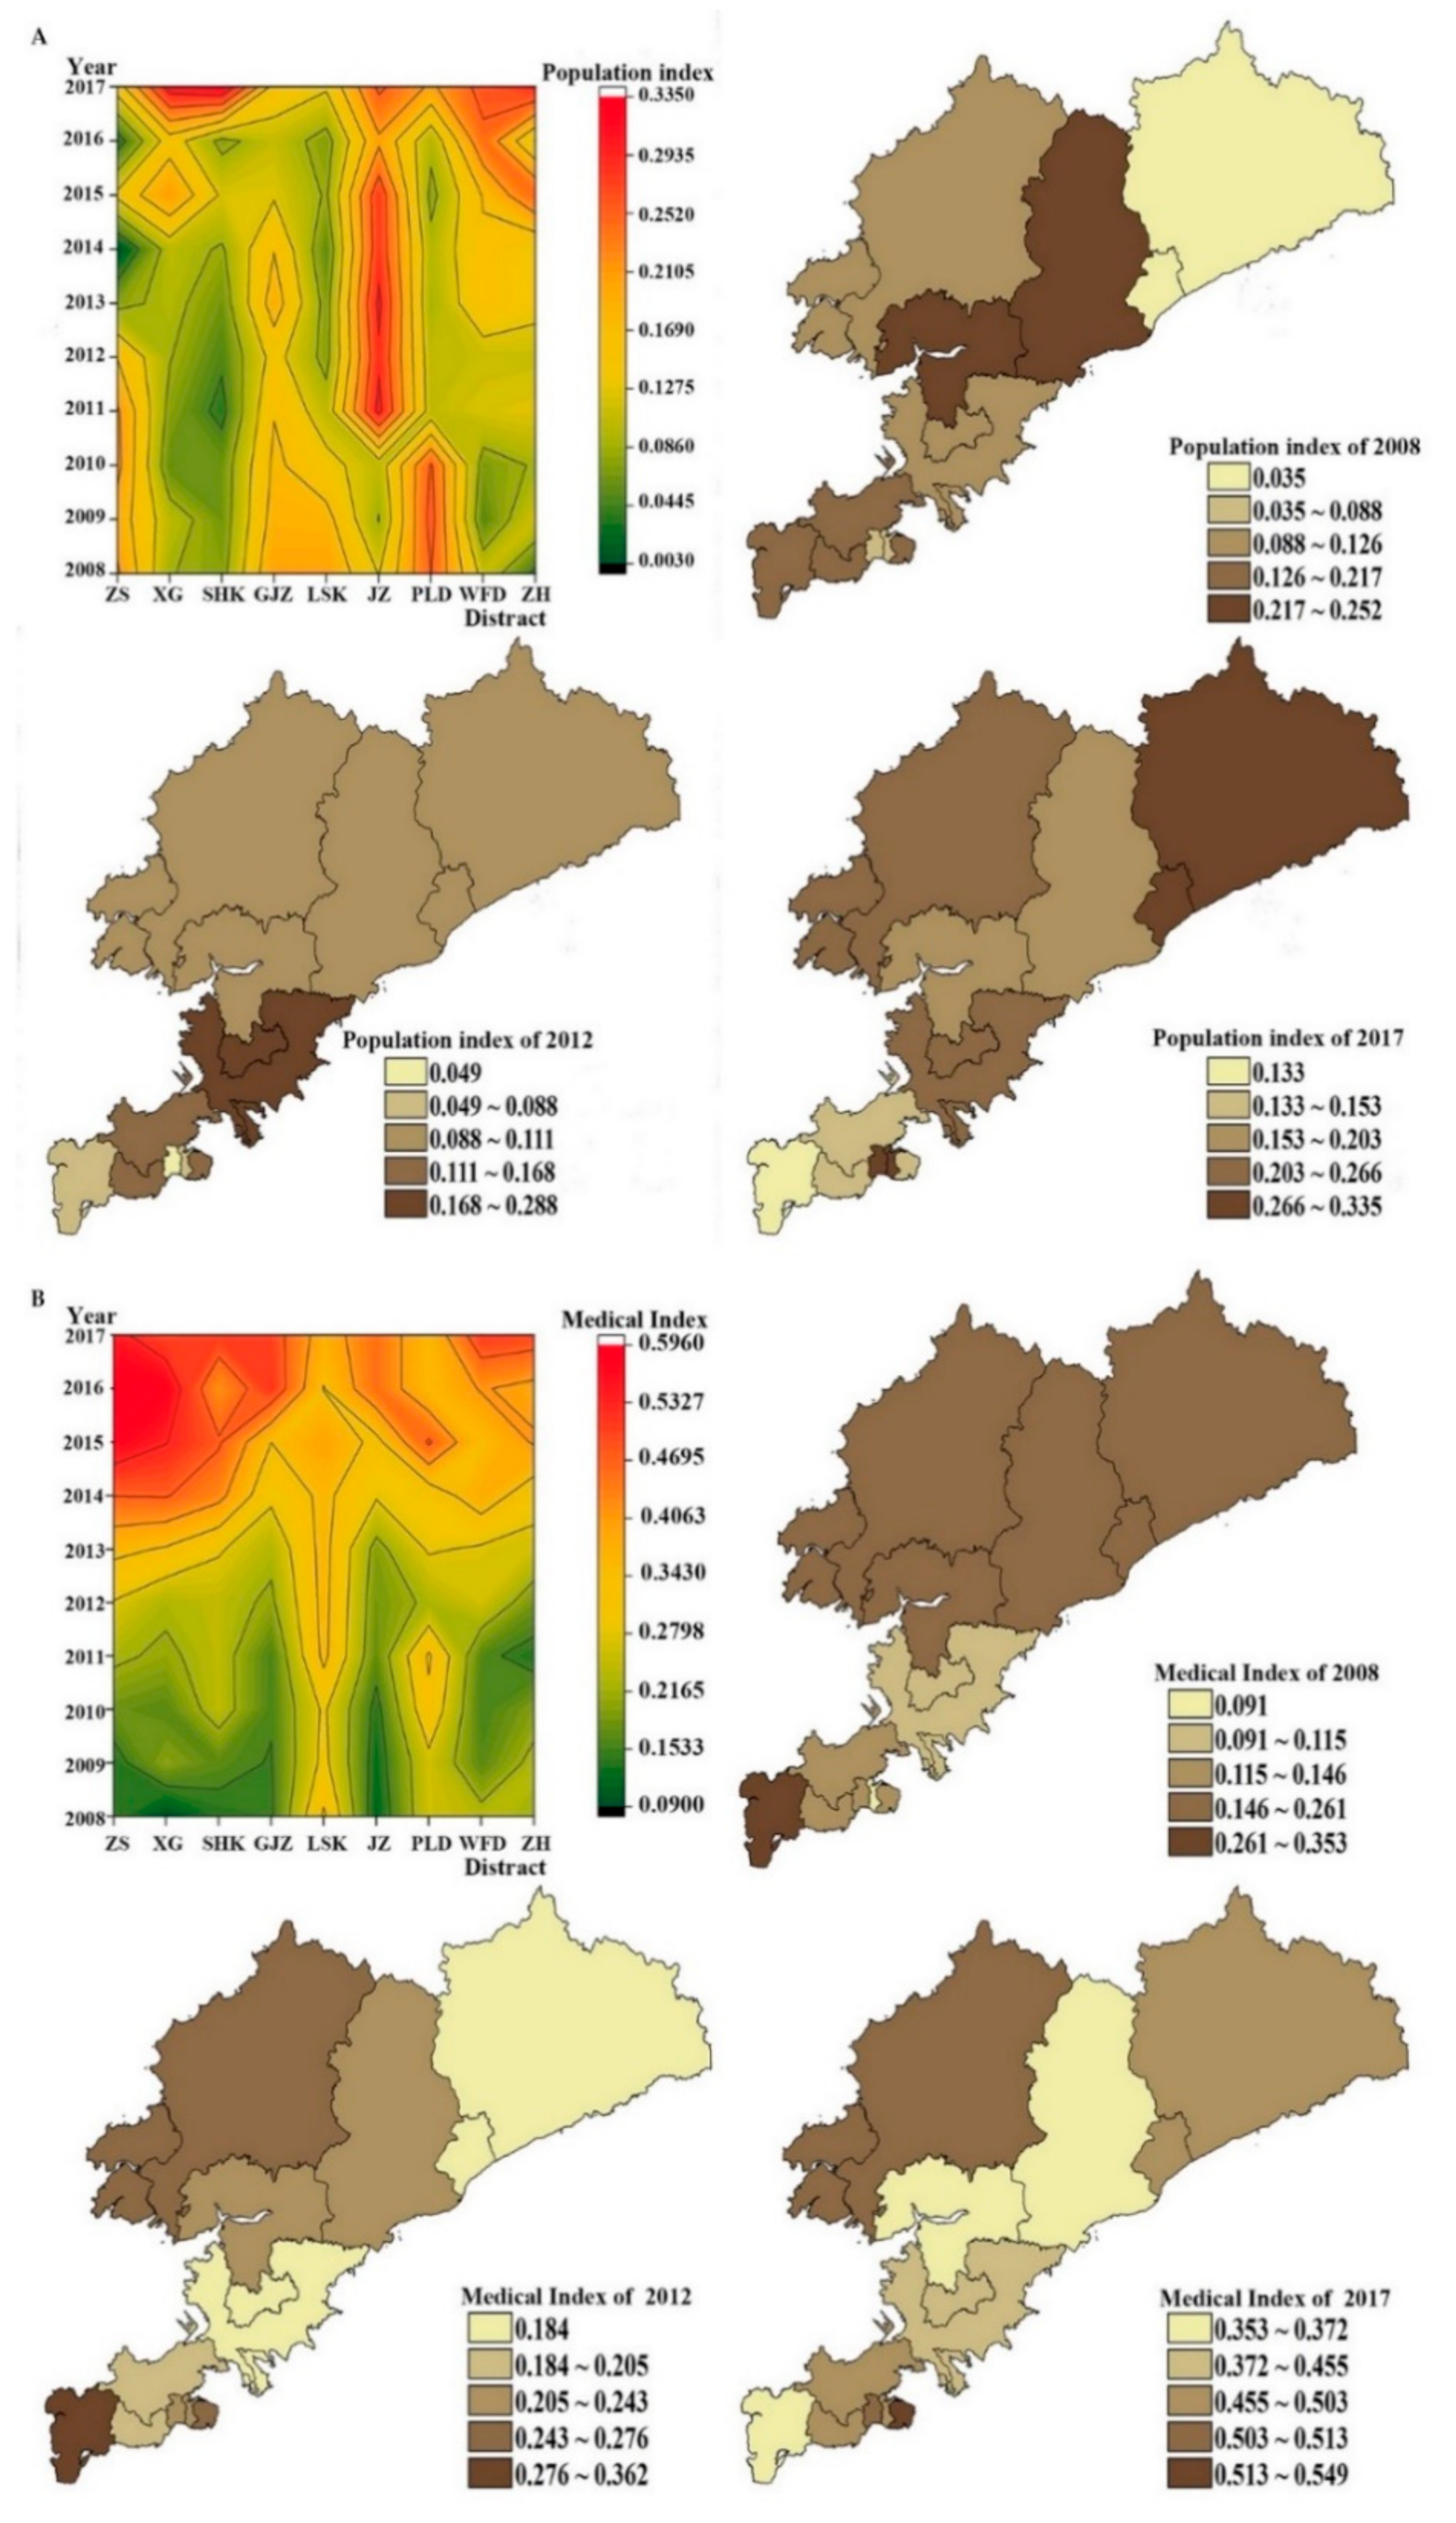
3.1. The Difference of Population and Medical Comprehensive Development Index in Urban and Rural Areas
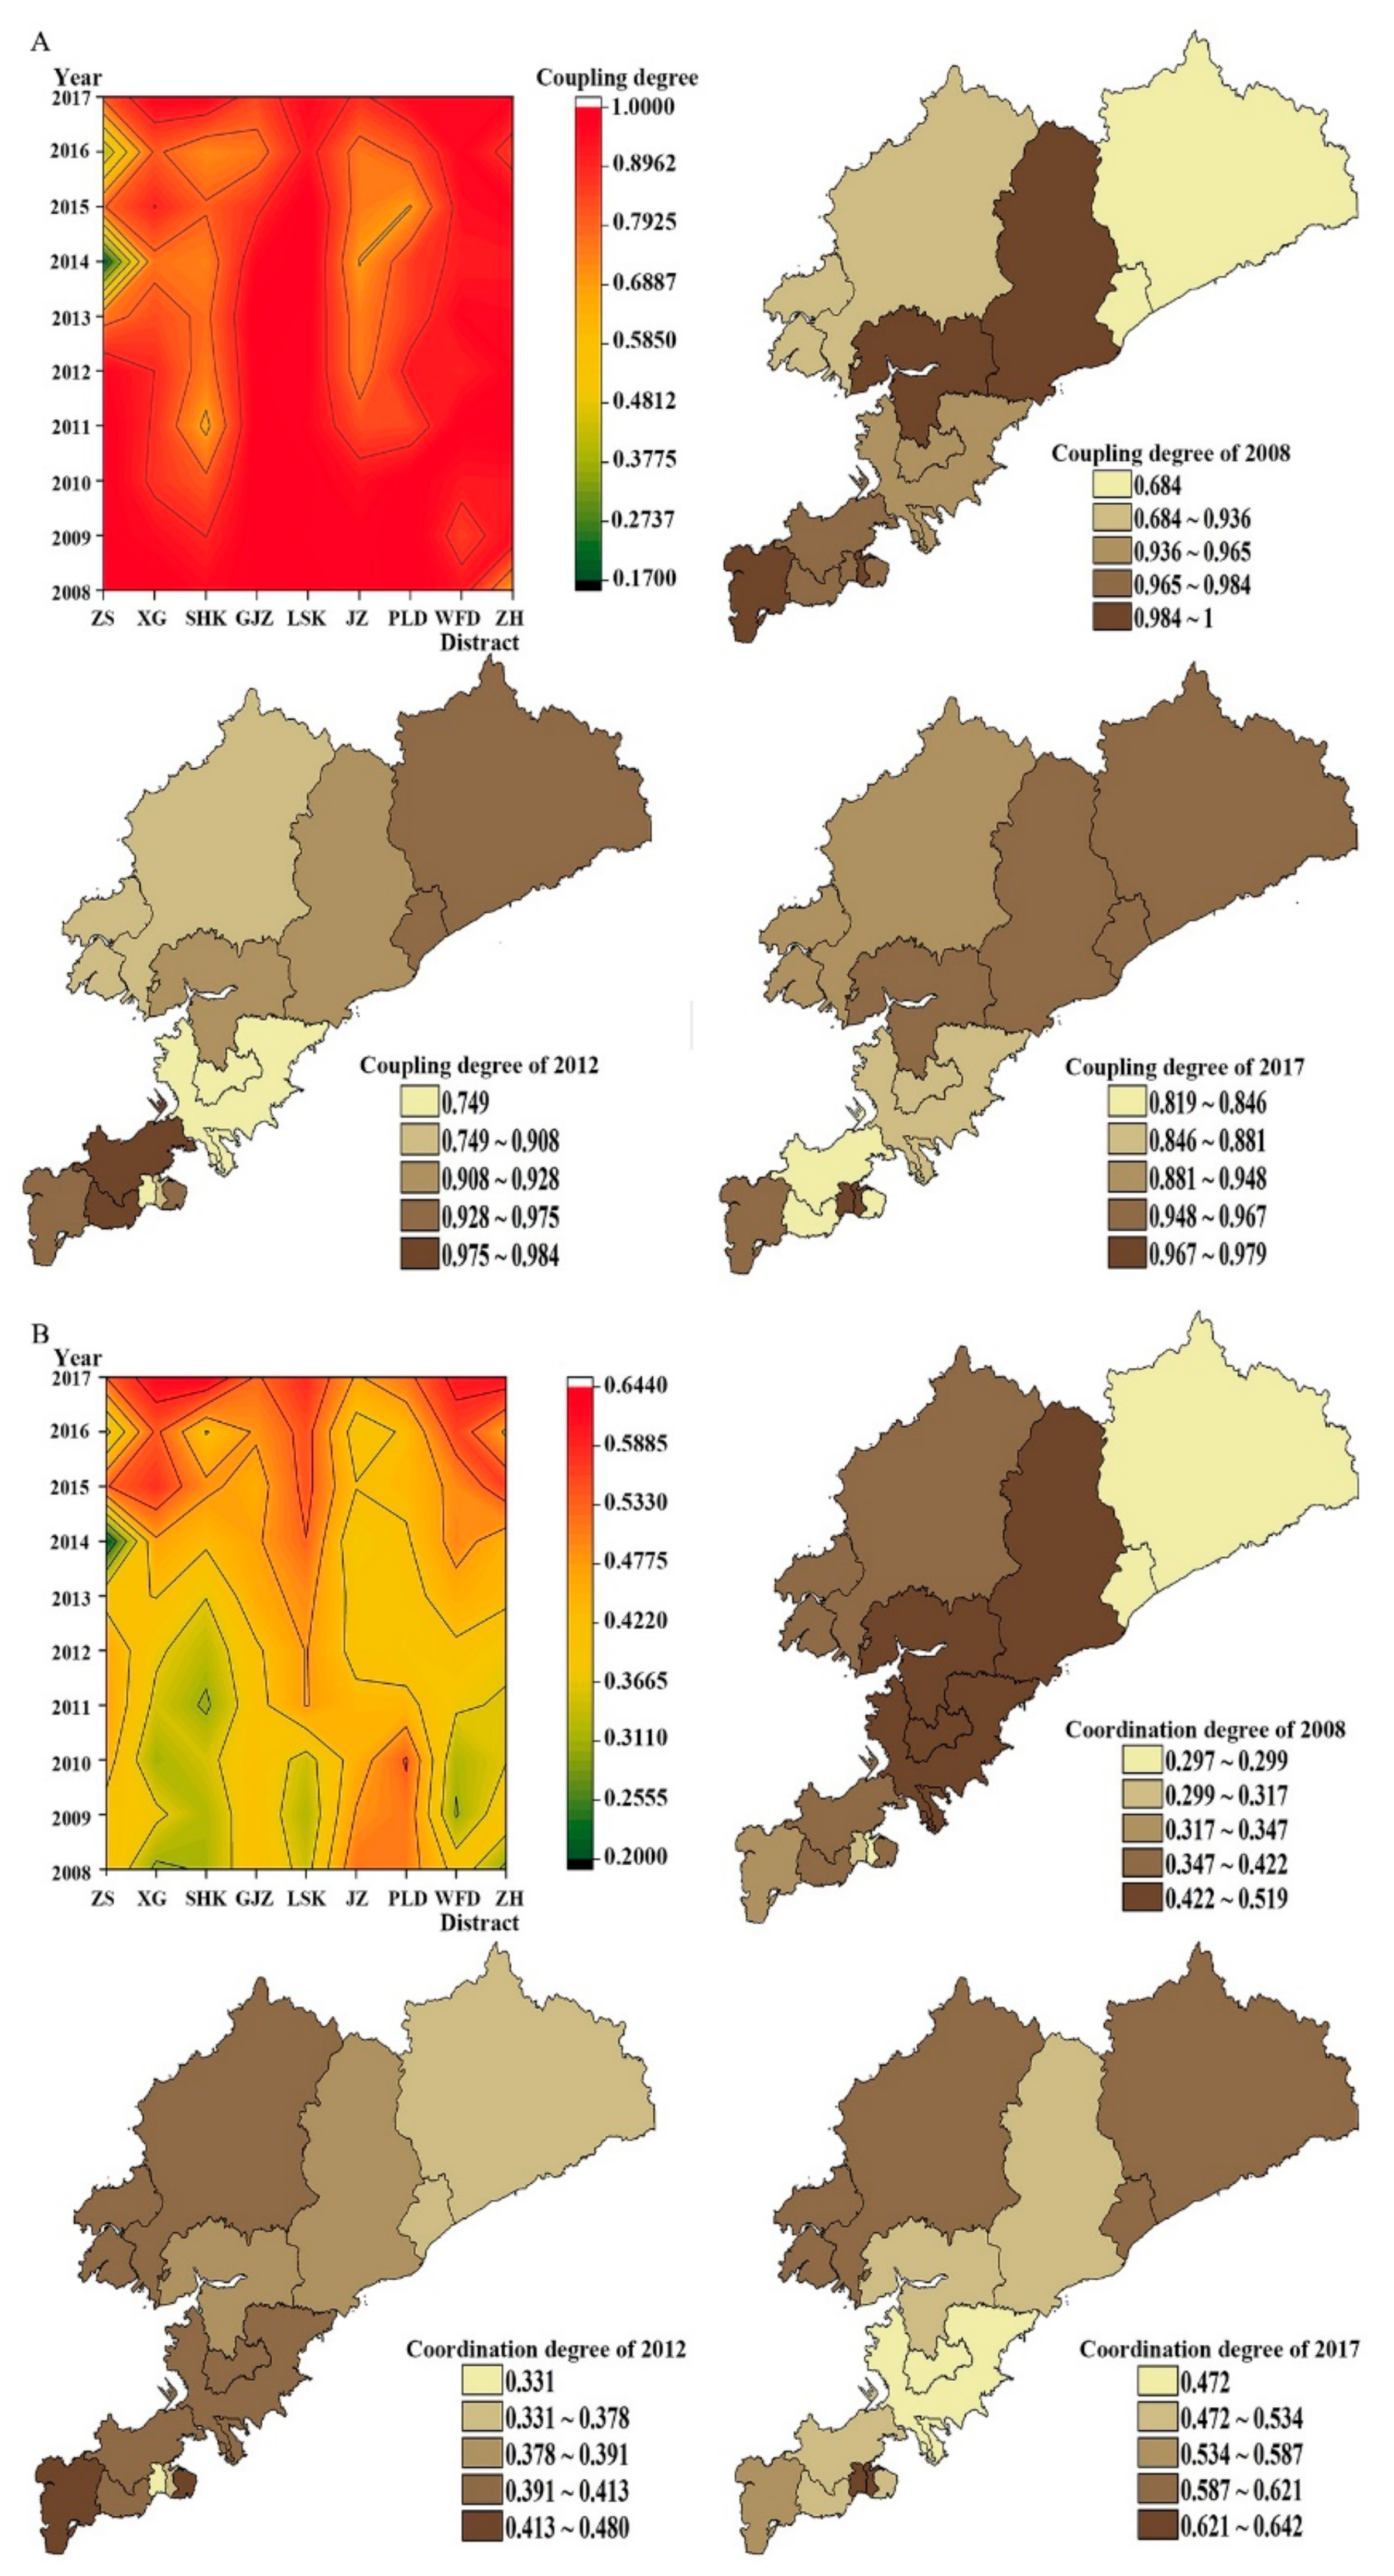
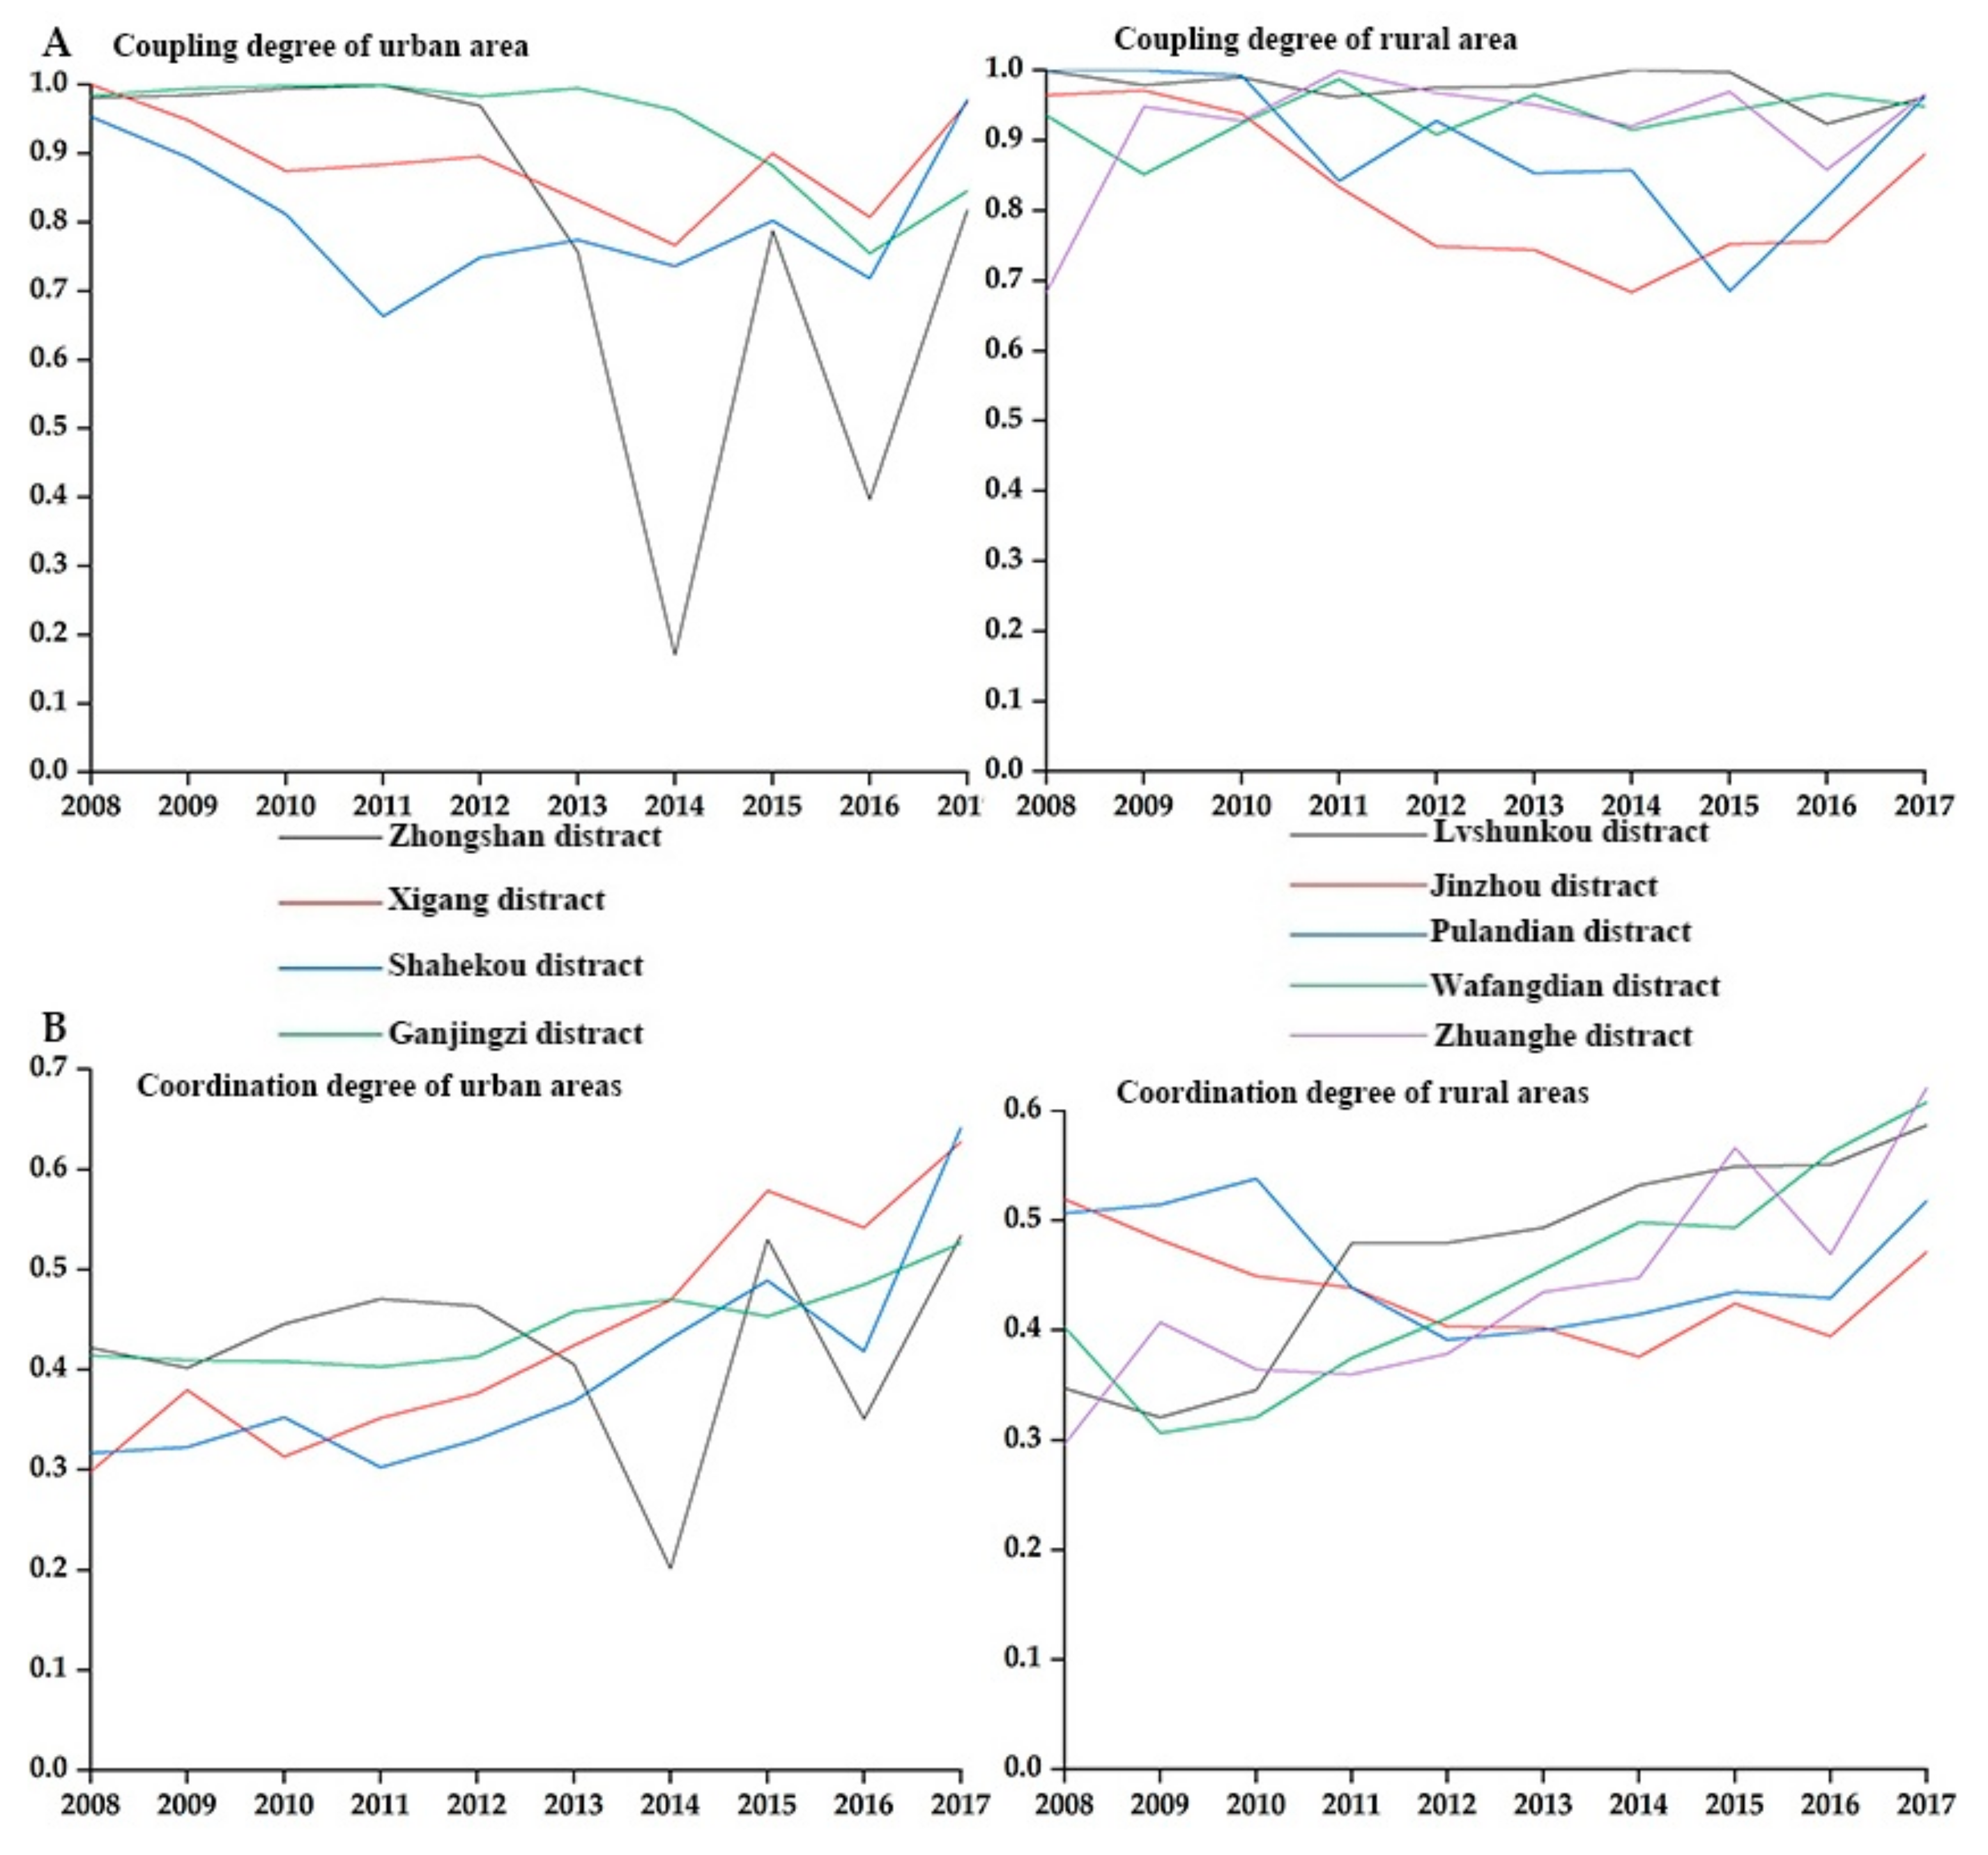
3.2. The Difference of Coupling Degree between Population and Medical Service in Urban and Rural Areas
3.3. The Difference in Coordination between Population and Medical Service in Urban and Rural Areas
4. Discussion
5. Conclusions
6. Limitations
Author Contributions
Funding
Institutional Review Board Statement
Informed Consent Statement
Data Availability Statement
Acknowledgments
Conflicts of Interest
References
- The Lancet. 2020: Unleashing the Full Potential of Nursing; Lancet: London, UK, 2019; Volume 394, p. 1879. [Google Scholar]
- China SCo. Notice of the State Council on Issuing the 13th Five-Year Plan to Deepen the Reform of the Medical and Health System; Shanghai Cooperation Organisation: Beijing, China, 2019. [Google Scholar]
- Bank, W. Atlas of Sustainable Development Goals 2017; World Bank Publications: Washington, DC, USA, 2017. [Google Scholar]
- Administration CNMS. Notice of the State Council on Issuing the 13th Five-Year Plan to Deepen the Reform of the Medical and Health System; Shanghai Cooperation Organisation: Beijing, China, 2016. [Google Scholar]
- China SCo. Opinions on Integrating the Basic Medical Insurance System for Urban and Rural Residents; Shanghai Cooperation Organisation: Beijing, China, 2016. [Google Scholar]
- China SCo. Notice on Doing a Good Job in the 2016 New Rural Cooperative Medical System; Shanghai Cooperation Organisation: Beijing, China, 2016. [Google Scholar]
- Yaya, S.; Uthman, O.A.; Okonofua, F.; Bishwajit, G. Decomposing the rural-urban gap in the factors of under-five mortality in sub-saharan africa? Evidence from 35 countries. BMC Public Health 2019, 19, 616. [Google Scholar] [CrossRef]
- Huang, X.; Peterson, S.; Lavergne, R.; Ahuja, M.; McGrail, K. Predicting the cost of health care services: A comparison of case-mix systems and comorbidity indices that use administrative data. Med. Care 2019, 58, 114–119. [Google Scholar] [CrossRef]
- Jung, A.L.; Jong, P.; Myung, K. Social and physical environments and self-rated health in urban and rural communities in korea. Int. J. Environ. Res. Public Health 2015, 12, 14329–14341. [Google Scholar]
- Han, W.; Ang, L. Analysis on the Integration of Urban and Rural Medical Insurance System. In Proceedings of the IOP Conference Series: Materials Science and Engineering, Nanjing, China, 17–19 August 2018. [Google Scholar]
- Xu, J.; Wang, J.; King, M.; Liu, R.; Yu, F.; Xing, J.; Su, L.; Lu, M. Rural-Urban Disparities in the Utilization of Mental Health Inpatient Services in China: The Role of Health Insurance. Int. J. Health Econ. Manag. 2018, 18, 377–393. [Google Scholar] [CrossRef]
- Li, Y.; Sun, Y.; Zhang, Y.; Yi, D.; Ma, C.; Ma, S. Rural–urban disparity in health care: Observations from Suzhou, China. Public Health 2016, 138, 164–167. [Google Scholar] [CrossRef]
- Fairchild, A.L. The rise and fall of the medical gaze: The political economy of immigrant medical inspection in modern America. Sci. Context 2006, 19, 337. [Google Scholar] [CrossRef] [PubMed]
- Linde, A. The impact of improvements in medical care resources on homicide trends: The case of germany (1977–2011). Eur. J. Crim. Policy Res. 2017, 24, 1–21. [Google Scholar] [CrossRef]
- Saaty, T.L. Decision-making with the ahp: Why is the principal eigenvector necessary. Eur. J. Oper. Res. 2003, 145, 85–91. [Google Scholar] [CrossRef]
- Ayag, Z. A fuzzy ahp-based simulation approach to concept evaluation in a npd environment. Iie Trans. 2005, 37, 827–842. [Google Scholar] [CrossRef]
- Ma, J.; Fan, Z.P.; Huang, L.H. A subjective and objective integrated approach to determine attribute weights. Eur. J. Oper. Res. 1999, 112, 397–404. [Google Scholar] [CrossRef]
- Zhang, H.; Gu, C.L.; Gu, L.W.; Zhang, Y. The evaluation of tourism destination competitiveness by topsis & information entropy—A case in the yangtze river delta of china. Tour. Manag. 2011, 32, 443–451. [Google Scholar]
- Parlak, I.B.; Tolga, A.C. Evaluation of Medical Devices Using Fuzzy Topsis with Type-2 Fuzzy Numbers. In Proceedings of the International Flins Conference on Decision Making & Soft Computing, Joao Pessoa, Brazil, 17–20 August 2014. [Google Scholar]
- Lin, C.T.; Tsai, M.C. Development of an expert selection system to choose ideal cities for medical service ventures. Expert Syst. Appl. 2009, 36, 2266–2274. [Google Scholar] [CrossRef]
- WHO. World Health Statistics 2017: Checking Health Status against the Sustainable Development Goals; WHO: Geneva, Switzerland, 2017. [Google Scholar]
- Li, Z.; Zza, D.; Ywa, B.; Qh, B.; Yong, S.; Dbb, D. Weighting of toilet assessment scheme in China implementing analytic hierarchy process. J. Environ. Manag. 2021, 283, 111992. [Google Scholar]
- Gul, M. Application of pythagorean fuzzy ahp and vikor methods in occupational health and safety risk assessment: The case of a gun and rifle barrel external surface oxidation and colouring unit. Int. J. Occup. Saf. Ergon. JOSE 2020, 26, 705–718. [Google Scholar] [CrossRef]
- Anser, M.K.; Mohsin, M.; Abbas, Q.; Chaudhry, I.S. Assessing the integration of solar power projects: Swot-based ahp–f-topsis case study of turkey. Environ. Sci. Pollut. Res. 2020, 27, 1–13. [Google Scholar]
- Hz, A.; Hy, A.; Rong, W.B.; Jing, T.A.; Mnm, C. An empirical investigation of the coordinated development of natural resources, financial development and ecological efficiency in china-sciencedirect. Resour. Policy 2020, 65, 101580. [Google Scholar]
- Selimefendigil, F.; Ztop, H.F. Effects of conductive curved partition and magnetic field on natural convection and entropy generation in an inclined cavity filled with nanofluid. Phys. A Stat. Mech. Appl. 2020, 540, 123004. [Google Scholar] [CrossRef]
- Alsabery, A.I.; Gedik, E.; Chamkha, A.J.; Hashim, I. Impacts of heated rotating inner cylinder and two-phase nanofluid model on entropy generation and mixed convection in a square cavity. Heat Mass Transf. 2020, 56, 321–338. [Google Scholar] [CrossRef]
- Razzak, M.I.; Imran, M.; Xu, G. Big data analytics for preventive medicine. Neural Comput. Appl. 2019, 32, 4417–4451. [Google Scholar] [CrossRef] [PubMed]
- Zhang, X.; Zhang, M.; Zhao, Z.; Huang, Z.; Deng, Q.; Li, Y.; Pan, A.; Li, C.; Chen, Z.; Zhou, M.; et al. Obesogenic environmental factors of adult obesity in China: A nationally representative cross-sectional study. Environ. Res. Lett. 2020, 15, 044009. [Google Scholar] [CrossRef]
- Hafezalkotob, A.; Hafezalkotob, A.; Liao, H.; Herrera, F. An overview of multimoora for multi-criteria decision-making: Theory, developments, applications, and challenges. Inf. Fusion 2018, 51, 145–177. [Google Scholar] [CrossRef]
- Fang, Y.; Nie, Y.; Penny, Z. Transmission dynamics of the COVID outbreak and effectiveness of government interventions: A data riven analysis. J. Med. Virol. 2020, 92, 645–659. [Google Scholar] [CrossRef] [PubMed]
- Fang, H.; Baret, F.; Plummer, S.; Schaepman-Strub, G. An overview of global leaf area index (lai): Methods, products, validation, and applications. Rev. Geophys. 2019, 57, 739–799. [Google Scholar] [CrossRef]
- Simms, K.T.; Steinberg, J.; Caruana, M.; Smith, M.A.; Lew, J.B.; Soerjomataram, I.; Castle, P.E.; Bray, F.; Canfell, K. Impact of scaled up human papillomavirus vaccination and cervical screening and the potential for global elimination of cervical cancer in 181 countries, 2020–2099: A modelling study. Lancet Oncol. 2019, 20, 394–407. [Google Scholar] [CrossRef]
- Geng, Y.; Wei, Z.; Zhang, H.; Maimaituerxun, M. Analysis and prediction of the coupling coordination relationship between tourism and air environment: Yangtze river economic zone in China as example. Discret. Dyn. Nat. Soc. 2020, 2020, 1406978. [Google Scholar] [CrossRef]
- Li, Y.; Zheng, Y. Regional agricultural industry economic development based on embedded system and internet of things. Microprocess. Microsyst. 2021, 82, 103852. [Google Scholar] [CrossRef]
- Harker, P. The Art and Science of Decision-Making. Anal. Hierarchy Process 1989, 3, 3–36. [Google Scholar]


| Primary Index | Secondary Index | Tertiary Index | Average Value | Positive/Negative Indicator Direction |
|---|---|---|---|---|
| Demographic factors (A1) | Population composition (B1) | Population size (C1) | 5,903,700 people | − |
| Population over 60 (C2) | 1.209 million people | − | ||
| Rural population (C3) | 2.109 million people | − | ||
| Medical service factors (A2) | Medical insurance (B2) | Number of residents participating in medical insurance (C4) | 75,400 people | + |
| The proportion of residents participating in medical insurance (C5) | 16.81% | + | ||
| Number of employees participating in medical insurance (C6) | 3.055 million people | + | ||
| The proportion of employees participating in medical insurance (C7) | 66.62% | + | ||
| Medical resource allocation (B3) | Number of doctors per thousand (C8) | 2.94 people | + | |
| Number of nurses per thousand (C9) | 3.23 people | + | ||
| Number of beds per thousand people (C10) | 6.08 beds | + | ||
| Number of medical institutions (C11) | 123 institutions | + | ||
| Government medical expenditure (C12) | 1886.638 million yuan | + | ||
| The proportion of medical expenditure in total public utility expenditure (C13) | 5.39% | + |
| AHP | EWP | |||||||||
|---|---|---|---|---|---|---|---|---|---|---|
| Indicators | City (%) | Rural (%) | ||||||||
| ZS | XG | SHK | GJZ | LSK | JZ | PLD | WFD | ZH | ||
| C1 | 6.55 | 8.22 | 6.75 | 6.29 | 4.94 | 10.50 | 4.64 | 4.18 | 11.28 | 3.30 |
| C2 | 6.76 | 12.36 | 16.23 | 20.22 | 4.89 | 5.91 | 2.50 | 3.29 | 10.93 | 7.92 |
| C3 | 6.90 | 0.00 | 0.00 | 0.00 | 9.04 | 7.10 | 4.18 | 6.30 | 7.29 | 8.14 |
| C4 | 7.53 | 7.21 | 7.59 | 9.14 | 6.45 | 6.97 | 5.09 | 6.89 | 6.44 | 6.36 |
| C5 | 6.87 | 3.67 | 3.85 | 3.77 | 3.73 | 6.23 | 6.11 | 4.49 | 10.55 | 10.00 |
| C6 | 8.22 | 7.48 | 7.97 | 5.49 | 4.93 | 3.54 | 11.02 | 5.59 | 5.62 | 7.88 |
| C7 | 6.57 | 3.25 | 3.09 | 3.18 | 8.84 | 7.81 | 3.99 | 6.53 | 3.35 | 8.83 |
| C8 | 6.02 | 6.32 | 7.60 | 4.03 | 14.79 | 5.73 | 6.62 | 2.70 | 6.91 | 6.33 |
| C9 | 6.61 | 6.83 | 6.83 | 6.68 | 5.58 | 6.52 | 4.78 | 5.67 | 5.54 | 6.81 |
| C10 | 6.26 | 8.08 | 7.05 | 6.39 | 8.23 | 6.96 | 11.94 | 4.67 | 6.04 | 8.44 |
| C11 | 10.65 | 9.76 | 14.27 | 13.51 | 2.30 | 3.25 | 4.26 | 19.67 | 4.96 | 8.65 |
| C12 | 10.43 | 11.53 | 5.99 | 7.99 | 11.67 | 5.67 | 10.68 | 5.87 | 13.21 | 6.29 |
| C13 | 10.63 | 7.92 | 6.07 | 5.90 | 9.68 | 13.73 | 19.63 | 9.31 | 5.62 | 7.51 |
| Indicators | City (%) | Rural (%) | ||||||||
|---|---|---|---|---|---|---|---|---|---|---|
| ZS | XG | SHK | GJZ | LSK | JZ | PLD | WFD | ZH | AHP | |
| C1 | 8.22 | 8.75 | 8.29 | 4.94 | 4.64 | 6.50 | 6.18 | 6.28 | 6.37 | 6.55 |
| C2 | 14.36 | 14.23 | 15.22 | 4.89 | 4.50 | 5.91 | 6.29 | 6.93 | 7.92 | 6.76 |
| C3 | - | - | - | 9.04 | 6.18 | 7.10 | 6.30 | 6.29 | 8.14 | 6.90 |
| C4 | 7.21 | 7.59 | 7.14 | 7.45 | 6.09 | 6.97 | 6.89 | 6.44 | 6.36 | 7.53 |
| C5 | 4.67 | 4.85 | 4.77 | 4.73 | 6.11 | 6.23 | 6.49 | 6.55 | 7.12 | 6.87 |
| C6 | 9.48 | 9.97 | 9.49 | 4.93 | 9.02 | 9.54 | 8.59 | 9.62 | 8.88 | 8.22 |
| C7 | 5.25 | 5.09 | 5.31 | 8.84 | 5.99 | 7.81 | 6.53 | 6.35 | 7.83 | 6.57 |
| C8 | 8.32 | 8.60 | 8.54 | 14.79 | 6.62 | 5.73 | 6.89 | 6.91 | 6.33 | 6.02 |
| C9 | 6.83 | 6.83 | 6.68 | 6.58 | 6.78 | 6.68 | 5.67 | 5.54 | 6.16 | 6.61 |
| C10 | 8.45 | 9.34 | 8.39 | 8.23 | 9.50 | 6.96 | 6.32 | 6.04 | 6.44 | 6.26 |
| C11 | 12.76 | 12.27 | 13.51 | 4.23 | 4.26 | 5.17 | 10.67 | 10.96 | 10.65 | 10.65 |
| C12 | 6.53 | 5.99 | 5.87 | 11.67 | 10.68 | 11.67 | 13.87 | 13.21 | 10.29 | 10.43 |
| C13 | 7.9% | 6.49 | 6.79 | 9.68 | 19.63 | 13.73 | 9.31 | 8.88 | 7.51 | 10.63 |
| Year | Y1 (Population Index) Y2 (Medical Service Index) | City | Rural | |||||||
|---|---|---|---|---|---|---|---|---|---|---|
| ZS | XG | SHK | GJZ | LSK | JZ | PLD | WFD | ZH | ||
| 2008 | y1 | 0.217 | 0.088 | 0.073 | 0.206 | 0.206 | 0.126 | 0.253 | 0.112 | 0.035 |
| y2 | 0.146 | 0.091 | 0.137 | 0.143 | 0.353 | 0.115 | 0.261 | 0.235 | 0.223 | |
| 2009 | y1 | 0.192 | 0.104 | 0.065 | 0.187 | 0.183 | 0.084 | 0.266 | 0.052 | 0.120 |
| y2 | 0.136 | 0.200 | 0.169 | 0.150 | 0.296 | 0.127 | 0.263 | 0.168 | 0.231 | |
| 2010 | y1 | 0.222 | 0.058 | 0.064 | 0.177 | 0.141 | 0.104 | 0.256 | 0.069 | 0.090 |
| y2 | 0.178 | 0.166 | 0.243 | 0.157 | 0.289 | 0.137 | 0.327 | 0.154 | 0.196 | |
| 2011 | y1 | 0.216 | 0.075 | 0.035 | 0.167 | 0.103 | 0.304 | 0.105 | 0.120 | 0.124 |
| y2 | 0.227 | 0.206 | 0.241 | 0.158 | 0.358 | 0.174 | 0.351 | 0.165 | 0.135 | |
| 2012 | y1 | 0.168 | 0.088 | 0.049 | 0.142 | 0.073 | 0.288 | 0.103 | 0.108 | 0.111 |
| y2 | 0.276 | 0.228 | 0.243 | 0.205 | 0.362 | 0.184 | 0.227 | 0.264 | 0.185 | |
| 2013 | y1 | 0.075 | 0.096 | 0.064 | 0.190 | 0.072 | 0.302 | 0.090 | 0.159 | 0.138 |
| y2 | 0.359 | 0.336 | 0.286 | 0.232 | 0.363 | 0.196 | 0.286 | 0.271 | 0.260 | |
| 2014 | y1 | 0.003 | 0.103 | 0.082 | 0.168 | 0.056 | 0.280 | 0.097 | 0.162 | 0.133 |
| y2 | 0.471 | 0.473 | 0.425 | 0.292 | 0.358 | 0.286 | 0.304 | 0.381 | 0.303 | |
| 2015 | y1 | 0.137 | 0.210 | 0.120 | 0.123 | 0.082 | 0.280 | 0.075 | 0.172 | 0.250 |
| y2 | 0.576 | 0.535 | 0.477 | 0.343 | 0.397 | 0.324 | 0.478 | 0.345 | 0.412 | |
| 2016 | y1 | 0.025 | 0.149 | 0.074 | 0.107 | 0.071 | 0.203 | 0.096 | 0.242 | 0.125 |
| y2 | 0.594 | 0.579 | 0.413 | 0.516 | 0.341 | 0.454 | 0.354 | 0.411 | 0.388 | |
| 2017 | y1 | 0.148 | 0.314 | 0.335 | 0.153 | 0.133 | 0.260 | 0.203 | 0.266 | 0.297 |
| y2 | 0.549 | 0.495 | 0.508 | 0.503 | 0.372 | 0.455 | 0.353 | 0.513 | 0.501 | |
| C (Coupling Degree) | D (Coupling Coordination Degree) | |
|---|---|---|
| (0, 0.3] | The system is at a lower level of coupling. | Low-coordinated coupling |
| (0.3, 0.5] | The coupling of the system is in a period of stagnation. | Moderately coordinated coupling |
| (0.5, 0.8] | The coupling of the system enters the running-in stage, and the two become benign coupling. | Highly coordinated coupling |
| (0.8, 1.0] | The system is at a high level of coupling. | Extremely coordinated coupling |
| 1 | The coupling degree of the system is the largest, and the system achieves a benign resonance coupling and tends to a new ordered structure. | Extremely coordinated coupling |
| Year | C (Coupling Degree) D (Coupling Coordination Degree) | City | Rural | |||||||
|---|---|---|---|---|---|---|---|---|---|---|
| ZS | XG | SHK | GJZ | LSK | JZ | PLD | WFD | ZH | ||
| 2008 | C | 0.981 | 1.000 | 0.953 | 0.984 | 0.999 | 0.965 | 1.000 | 0.936 | 0.684 |
| D | 0.422 | 0.299 | 0.317 | 0.414 | 0.347 | 0.519 | 0.507 | 0.403 | 0.297 | |
| 2009 | C | 0.985 | 0.948 | 0.894 | 0.994 | 0.979 | 0.972 | 1.000 | 0.852 | 0.949 |
| D | 0.402 | 0.380 | 0.323 | 0.410 | 0.321 | 0.482 | 0.514 | 0.306 | 0.408 | |
| 2010 | C | 0.994 | 0.875 | 0.812 | 0.998 | 0.991 | 0.938 | 0.993 | 0.925 | 0.928 |
| D | 0.446 | 0.313 | 0.353 | 0.408 | 0.346 | 0.449 | 0.538 | 0.321 | 0.364 | |
| 2011 | C | 1.000 | 0.884 | 0.663 | 1.000 | 0.962 | 0.834 | 0.842 | 0.988 | 0.999 |
| D | 0.471 | 0.352 | 0.303 | 0.403 | 0.480 | 0.439 | 0.439 | 0.375 | 0.360 | |
| 2012 | C | 0.970 | 0.896 | 0.749 | 0.984 | 0.975 | 0.749 | 0.928 | 0.908 | 0.968 |
| D | 0.464 | 0.376 | 0.331 | 0.413 | 0.480 | 0.404 | 0.391 | 0.411 | 0.378 | |
| 2013 | C | 0.756 | 0.833 | 0.774 | 0.995 | 0.977 | 0.744 | 0.853 | 0.966 | 0.951 |
| D | 0.405 | 0.424 | 0.368 | 0.458 | 0.493 | 0.402 | 0.400 | 0.456 | 0.435 | |
| 2014 | C | 0.171 | 0.767 | 0.736 | 0.963 | 1.000 | 0.684 | 0.858 | 0.915 | 0.921 |
| D | 0.201 | 0.470 | 0.432 | 0.470 | 0.532 | 0.376 | 0.415 | 0.498 | 0.448 | |
| 2015 | C | 0.788 | 0.900 | 0.803 | 0.882 | 0.997 | 0.753 | 0.685 | 0.943 | 0.969 |
| D | 0.530 | 0.579 | 0.489 | 0.454 | 0.549 | 0.424 | 0.435 | 0.494 | 0.566 | |
| 2016 | C | 0.397 | 0.807 | 0.719 | 0.755 | 0.924 | 0.756 | 0.820 | 0.966 | 0.859 |
| D | 0.351 | 0.542 | 0.418 | 0.485 | 0.551 | 0.395 | 0.430 | 0.562 | 0.469 | |
| 2017 | C | 0.819 | 0.975 | 0.979 | 0.846 | 0.962 | 0.881 | 0.963 | 0.948 | 0.967 |
| D | 0.534 | 0.628 | 0.642 | 0.527 | 0.587 | 0.472 | 0.518 | 0.608 | 0.621 | |
| City | Rural | ||||||||
|---|---|---|---|---|---|---|---|---|---|
| Year | ZS | XG | SHK | GJZ | LSK | JZ | PLD | WFD | ZH |
| 2008 | 0.070 | −0.003 | −0.064 | 0.063 | −0.147 | 0.011 | −0.008 | −0.122 | −0.188 |
| 2009 | 0.056 | −0.097 | −0.104 | 0.036 | −0.113 | −0.043 | 0.004 | −0.115 | −0.111 |
| 2010 | 0.043 | −0.109 | −0.179 | 0.020 | −0.148 | −0.033 | −0.071 | −0.085 | −0.107 |
| 2011 | −0.010 | −0.131 | −0.207 | 0.009 | −0.255 | 0.130 | −0.246 | −0.045 | −0.011 |
| 2012 | −0.108 | −0.141 | −0.193 | −0.062 | −0.288 | 0.104 | −0.123 | −0.156 | −0.074 |
| 2013 | −0.284 | −0.240 | −0.222 | −0.042 | −0.291 | 0.105 | −0.196 | −0.111 | −0.123 |
| 2014 | −0.467 | −0.370 | −0.343 | −0.124 | −0.302 | −0.006 | −0.206 | −0.219 | −0.170 |
| 2015 | −0.439 | −0.325 | −0.356 | −0.220 | −0.315 | −0.044 | −0.403 | −0.173 | −0.163 |
| 2016 | −0.569 | −0.430 | −0.339 | −0.408 | −0.270 | −0.251 | −0.258 | −0.169 | −0.263 |
| 2017 | −0.401 | −0.181 | −0.173 | −0.350 | −0.239 | −0.194 | −0.150 | −0.247 | −0.204 |
Publisher’s Note: MDPI stays neutral with regard to jurisdictional claims in published maps and institutional affiliations. |
© 2021 by the authors. Licensee MDPI, Basel, Switzerland. This article is an open access article distributed under the terms and conditions of the Creative Commons Attribution (CC BY) license (https://creativecommons.org/licenses/by/4.0/).
Share and Cite
Qiu, Y.; Lu, W.; Guo, J.; Sun, C.; Jia, P. Urban and Rural Population and Development Research on Medical Coordination: In View of Dalian 2008–2017 Official Statistics. Int. J. Environ. Res. Public Health 2021, 18, 6395. https://doi.org/10.3390/ijerph18126395
Qiu Y, Lu W, Guo J, Sun C, Jia P. Urban and Rural Population and Development Research on Medical Coordination: In View of Dalian 2008–2017 Official Statistics. International Journal of Environmental Research and Public Health. 2021; 18(12):6395. https://doi.org/10.3390/ijerph18126395
Chicago/Turabian StyleQiu, Yukun, Wei Lu, Jianke Guo, Caizhi Sun, and Peng Jia. 2021. "Urban and Rural Population and Development Research on Medical Coordination: In View of Dalian 2008–2017 Official Statistics" International Journal of Environmental Research and Public Health 18, no. 12: 6395. https://doi.org/10.3390/ijerph18126395
APA StyleQiu, Y., Lu, W., Guo, J., Sun, C., & Jia, P. (2021). Urban and Rural Population and Development Research on Medical Coordination: In View of Dalian 2008–2017 Official Statistics. International Journal of Environmental Research and Public Health, 18(12), 6395. https://doi.org/10.3390/ijerph18126395