Article

Impact of Air Pollution (PM2.5) on Child Mortality: Evidence from Sixteen Asian Countries

1
Department of Management Sciences, COMSATS University Islamabad, Attock Campus Kamra Road, Attock 43600, Pakistan
2
Department of Government and Public Policy, National University of Science & Technology, Islamabad 44000, Pakistan
3
Department of Health Policy & Management, Jackson State University, Jackson, MS 39217, USA
4
Swiss School of Public Health (SSPH+), 8001 Zurich, Switzerland
5
Institute of Global Health, Faculty of Medicine, University of Geneva, 8001 Zurich, Switzerland
*
Author to whom correspondence should be addressed.
Int. J. Environ. Res. Public Health 2021, 18(12), 6375; https://doi.org/10.3390/ijerph18126375
Submission received: 7 May 2021 / Revised: 7 June 2021 / Accepted: 8 June 2021 / Published: 12 June 2021
(This article belongs to the Section Health Economics)

Abstract

:
Air pollution in Asian countries represents one of the biggest health threats given the varied levels of economic and population growth in the recent past. The quantification of air pollution (PM2.5) vis à vis health problems has important policy implications in tackling its health effects. This paper investigates the relationship between air pollution (PM2.5) and child mortality in sixteen Asian countries using panel data from 2000 to 2017. We adopt a two-stage least squares approach that exploits variations in PM2.5 attributable to economic growth in estimating the effect on child mortality. We find that a one-unit annual increase in PM2.5 leads to a nearly 14.5% increase in the number of children dying before the age of five, suggesting the severity of the effects of particulate matter (PM2.5) on health outcomes in sixteen Asian countries considered in this study. The results of this study suggest the need for strict policy interventions by governments in Asian countries to reduce PM2.5 concentration alongside environment-friendly policies for economic growth.

1. Introduction

Air pollution has been considered a major environmental threat to global health in recent years. The World Health Organization (WHO) in 2018 claimed that nine out of ten people breathe polluted air, and more importantly, air pollution is responsible for 7 million deaths each year globally. Among all the air pollutants, fine particulate matter (diameter less than 2.5 microns, PM2.5) is one of the most severe threats to human health [1,2]. PM2.5 includes precarious airborne chemicals and particles with multiple forms and sources. The most hazardous of these sources are human activities, such as nitrogen dioxide from vehicles, sulfur dioxide from power plants, and ground-level ozone, as well as particulate matter. The last type is important due to its ability to penetrate into peoples’ lungs and enter their bloodstream [3,4]. Epidemiological researchers have substantiated that these health impacts are induced by continuing ambient PM2.5 concentrations and the coherent risk factors that vary from country to country [5,6].
Studies have rated PM2.5 as the most lethal of the particulate matters, in association with child mortality [7,8], given that growth-stage of infants (0–1 years) and children under five are more susceptible to poor air quality [3]. Children are relatively more exposed to air pollution than adults due to longer engagement in outdoor activities and mouth breathing, which increases their intake of air pollutants [9]. The WHO (2018) reported 543,000 deaths in children under 5 years of age and 52,000 deaths in those aged 5–15 due to ambient air pollution in 2016, which mostly occurred in low- and middle-income countries. Although the mortality rate of children under five has declined from 19.6 million in 1950 to 5.4 million in 2017, developing countries are still far away from developed countries in overcoming child mortality [10]. Asian countries are more prone to this threat, as 92% of the Asia and Pacific population are exposed to levels of air pollution that constitute a significant risk to their health (UN, 2019).
Asian countries are experiencing increasing levels of air pollution due to fast industrialization, urbanization, coal power plants, transportation, population growth and household solid fuel use [8,11]. The Asian region has become notorious for reported vulnerability to higher mortality (59% of total global deaths) due to low quality air [12,13,14]. The state of global air report claimed that the countries with the highest mortality rate due to air pollution were in Asia, and includes India, China, Pakistan, Bangladesh and Indonesia. The Asian countries with the highest mortality rate includes Bangladesh, India, Pakistan, Myanmar, Nepal, Philippines, Mongolia, China, Iran and Vietnam, with 38.3, 50.8, 84.7, 49.8, 46.0, 16.5, 13.2, 7.7, 10.2 and 12.6 (deaths per 100,000 (<5 years)), respectively, in the year 2016 (WHO, 2018), while the countries with moderate rates of mortality are Thailand (4.0), Turkey (2.7), Malaysia (1.4), Russia (1.3) and Sri Lanka (1.3). The PM2.5 exposure levels (micrograms per cubic meter) in the studied countries are Bangladesh (53.2), India (65.2), Pakistan (55.2), Myanmar (34.7), Nepal (94.3), Philippines (18.4), Mongolia (40.4), China (49.2), Iran (35.1), Vietnam (29.7), Thailand (26.2), turkey (42.0), Malaysia (16.0), Russia (13.7) and Sri Lanka (15.2), for the year 2016 (WHO, 2018).
Several studies have shown a positive relationship between air pollution (PM2.5) and child mortality in recent years. For example, Lien et al. and Owili et al. [15,16] showed a positive relationship of air pollution (PM2.5) with child mortality in those under five and maternal deaths in 45 Asian countries and Africa. Gouveia et al. [9] evaluated the impact of air pollution on child mortality in four Latin American cities (Mexico city, Santiago, Chile and Rio de Janeiro) using the generalized additive model with Poisson regression. The result suggests the positive relationship between air pollution and child mortality for these cities. Sarkodie et al. [17] examined the association between ambient air pollution (PM2.5), mortality and life expectancy in 54 countries, including Europe and North America, using time series data from 2000–2016. The study applied a generalized least square (GLS) random effect model with first-order autoregressive disturbance, which revealed a significant and positive association among ambient air pollution, mortality and life expectancy in the studied countries. The long-term health related assessment of PM2.5, mostly undertaken in developed countries, showed the positive association between PM2.5 and mortality over the years [18,19]. However, despite experiencing the worst air pollution and its impact on child mortality, there are limited cross-country studies available on Asian countries that examine the relationship between air pollution (PM2.5) and child mortality in those under five [15].
This study contributes to the literature in multiple aspects. Firstly, it takes into account the potential income effect of PM2.5 when explaining its impact on child mortality. We do this because of the potential endogeneity in PM2.5 when estimating its health effect through a reduced-form equation. Secondly, we use cross-country panel data from 2000 to 2017 for sixteen Asian countries, which allow us to apply country fixed effect (CFE) and year fixed effect (YFE) to address any omitted time-invariant and country-specific characteristics when estimating the effect of PM2.5 on child mortality. Thirdly, we selected Asian countries for two reasons. First, health issues, particularly in children under five, have been observed at high rates in Asian countries, including the populous countries India, Pakistan, Bangladesh and Indonesia [14]. Second, over the last twenty years, some Asian countries, such as China, Malaysia, Turkey and Russia, have adopted large-scale pollution mitigation measures, such as investment in wind and solar power, caps on coal use, and the use of filters and scrubbers [20,21]. Therefore, the purpose of this study is to examine the effect of PM2.5 on child mortality in Asian countries, thus confronting the serious environmental issues that have arisen in recent years. The following section explains the data, methods and empirical specification. Results are presented in the Section 3, followed by discussion and implications in the Section 4. The Section 5 concludes.

2. Materials and Methods
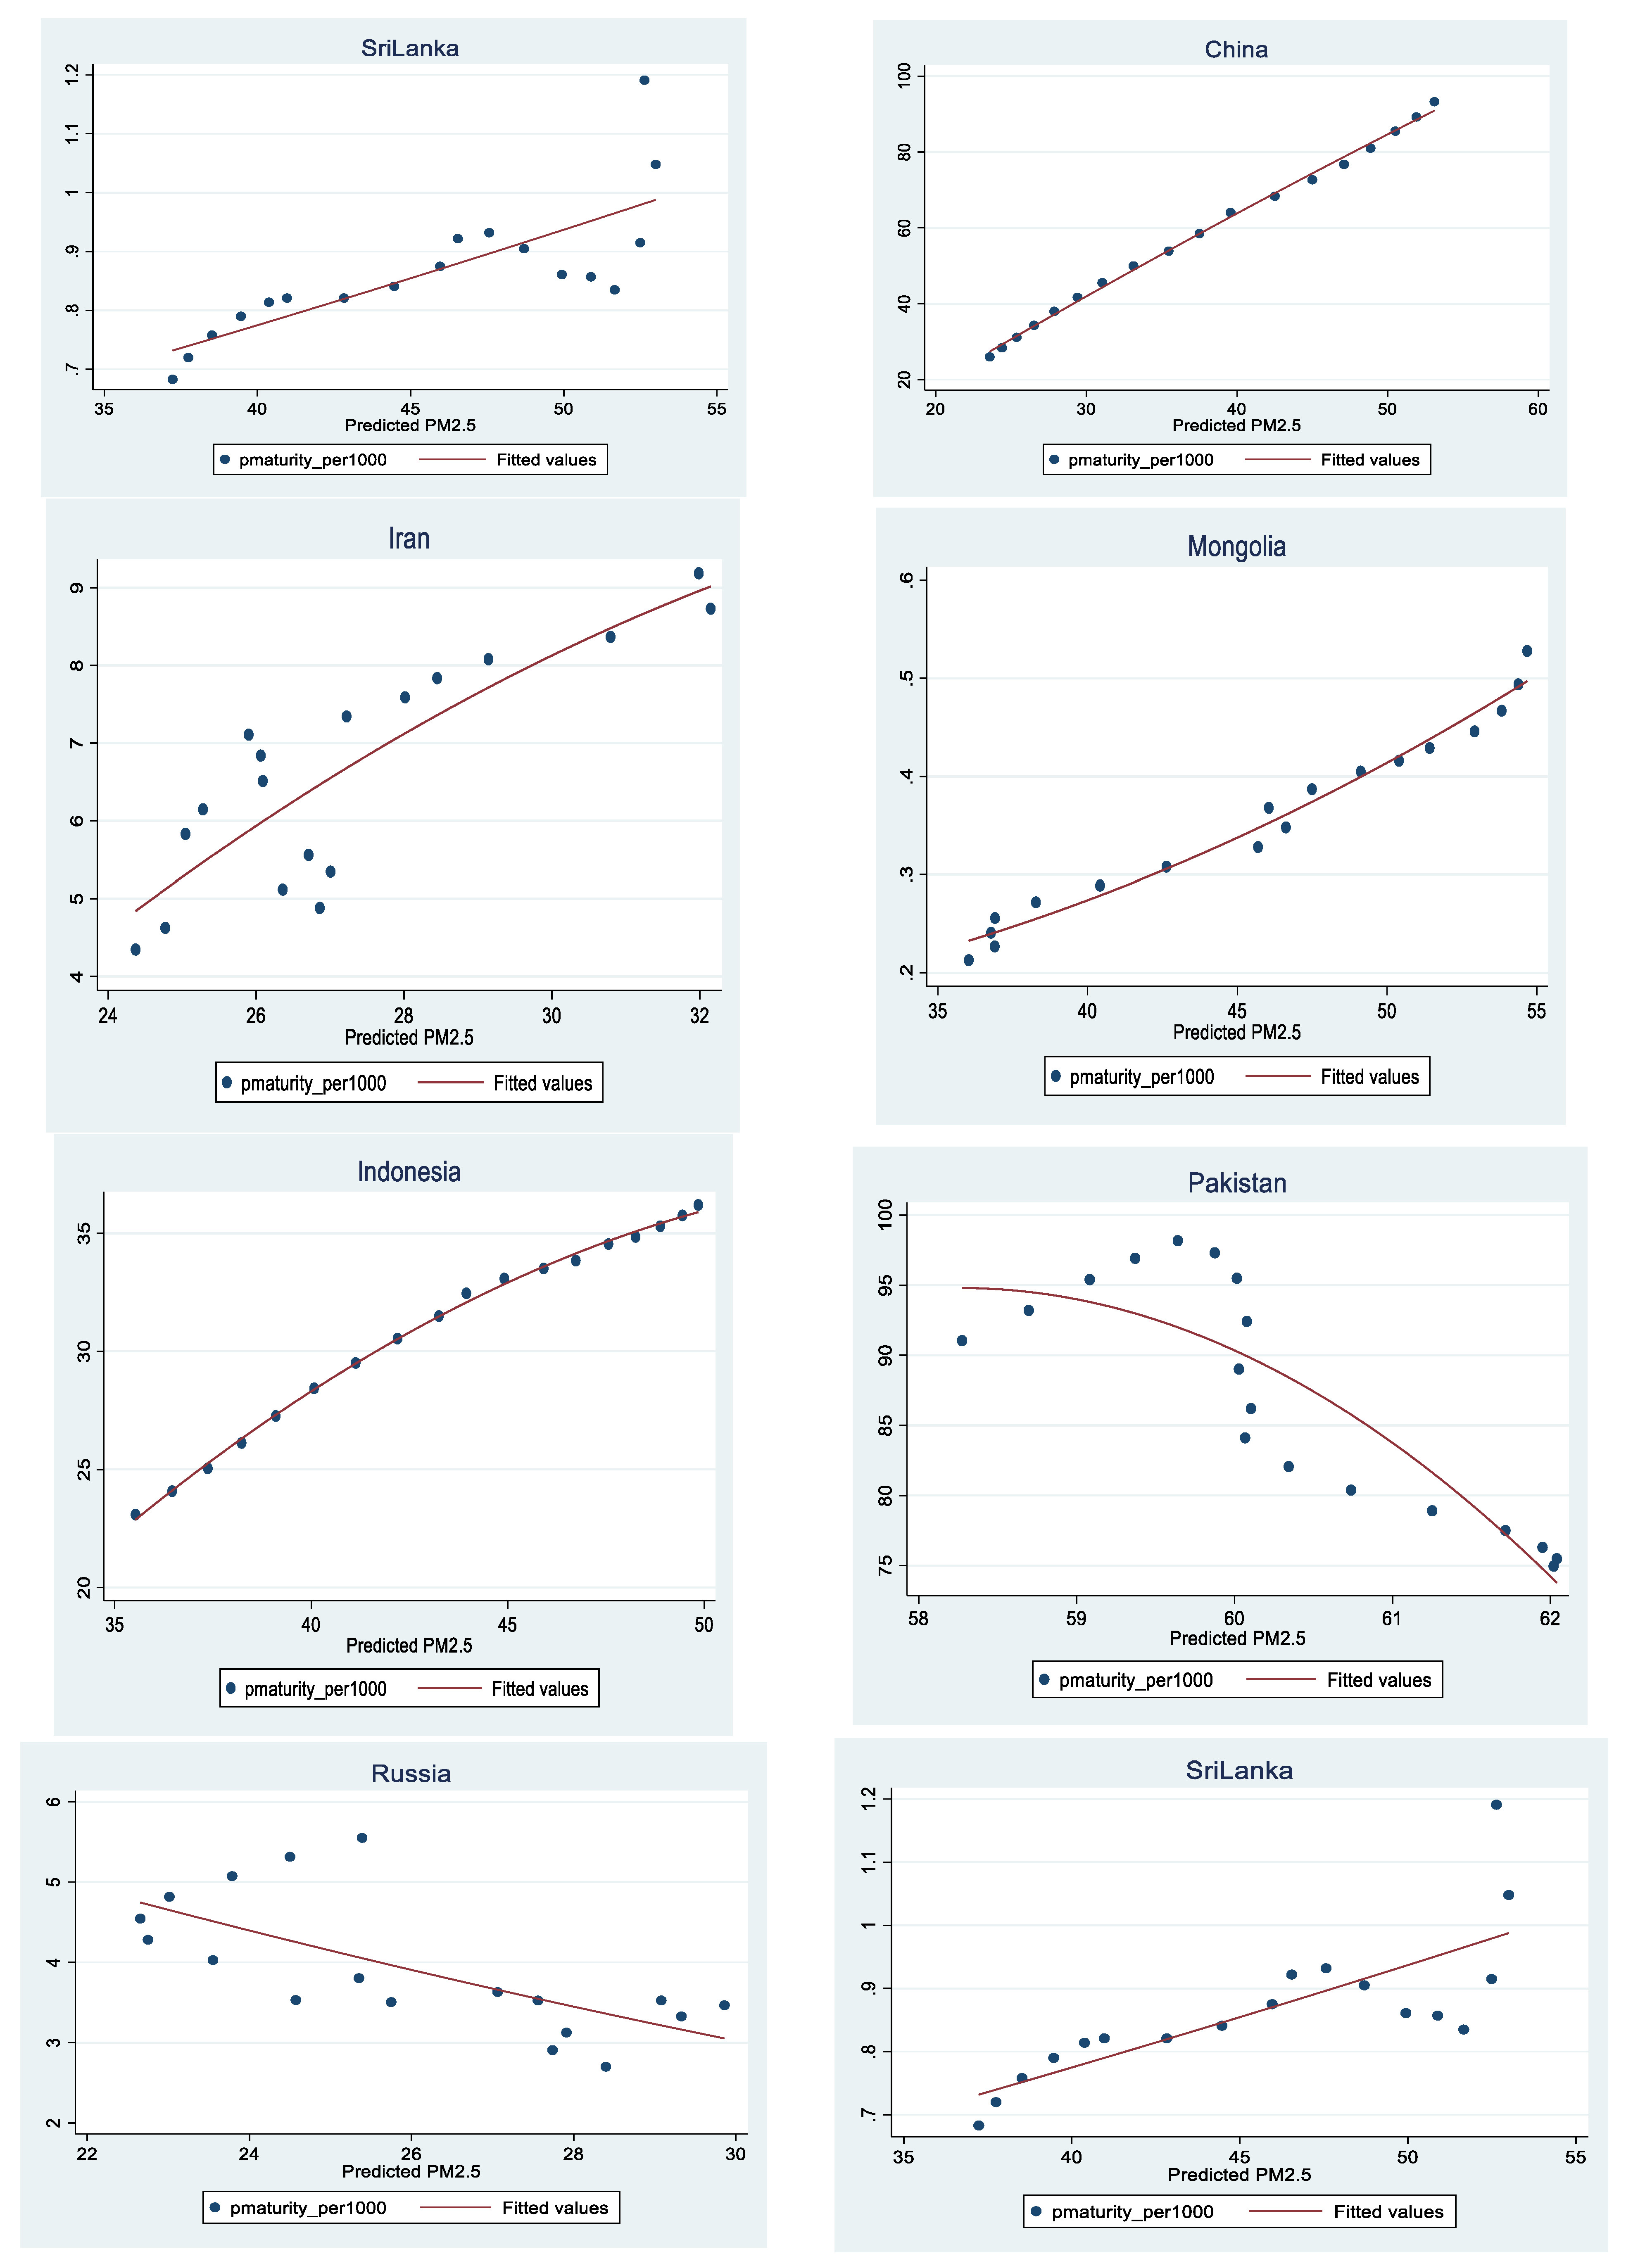
We follow the health production function proposed by [22], which is shown below:
H = h ( d ,   b )
D = d ( e , a )
H = h ( e , a , b )
In Equation (1), H represents health status, which is a function of the level of pollution exposure or dose (d) and mitigating activities (b). The pollution exposure, as represented by D in Equation (2), further depends on averting activities denoted by (a) and the concentration of pollutants (e). Averting behavior is the attitude of shunning a certain stimulus, whereas mitigating behavior involves studying the advent and propagation of a certain disorder and finding measures to root out its occurrence. In the reduced form, Equation (1) can be written as Equation (3), where d is substituted with (e,a). This reduced-form equation allows us to determine the indirect effect of averting behavior and pollutant concentration on the health status of individuals. In aggregate terms, however, the health production function can be measured through mortality rate (Thornton, 2002). Although the dose–response function yields weaker estimates for pollution reduction, this model is the only option that can be used to deal with aggregate data from large entities, such as countries and states, for which the implicit cost of pollution cannot be easily measured. Considering the aggregate health production function, the reduced-form Equation (3) becomes a dose–response function, with pollution and mortality as its key indicators and excluding the averting and mitigating costs (difficult to accurately measure) as given by Equation (4). Estimates of reduced forms such as Equation (4) or Equation (5) are useful both in providing policy-relevant parameters and in predicting the relationship between health and health-related inputs.
H = h ( e )  
Controlling for physical and socio-economic characteristics is important in the estimation of health production function, as suggested by [23]. The reduced-form equation for child mortality is consistent with findings obtained in earlier studies that point to the fact that families with relatively high incomes and education tend to spend more on health. In this study, we follow the proposed framework in analyzing the health production function via the aggregate data on the countries, as below:
E = e ( y ,   z )
where E is determined by economic development (y) and other components of pollution, such as population density and education. By incorporating Equation (5) in Equation (4), the health production function (4) is derived in Equation (6):
H   =   h ( e ( y ,   z ) )  
We first empirically estimate Equation (6) through the following reduced-form specification:
ln ( C h i l d   M o r t a l i t y ) i t = α 0 + α 1 P M 2.5 i t + α 2 ( G D P ) i t + α 3 ( G D P ) i t 2 + α 4 ( P O P ) i t + α 5 ( P O P ) i t 2 + α 6 E d u i t + γ i + ε i t
where the log of child mortality represents child mortality in those under five in country i in year t. PM2.5 represents mean annual exposure (micrograms per cubic meter) in country i in year t. Income is represented by per capita gross domestic product ( G D P i t ) and its square ( G D P ) i t 2 in country i in year t. Population density ( P O P i t ) is measured in terms of persons per square km in country i in year t. We used the square of GDP and the square of population density because, as found by a number of other studies (e.g., environmental Kuznets curves), PM2.5 has a non-linear relationship with income and population density. In other words, as income increases, the studies show, PM2.5 increases to begin with. However, as income increases to a certain threshold, pollution starts decreasing, indicating the mitigating behavior of individuals towards pollution after they achieve a certain income level. The same is true for population density. γ i represents the individual country-specific time invariant characteristics controlled through the fixed effect model. The ε i t is the error term clustered at the country level. The Asian countries included in this study on the basis of data availability are Bangladesh, China, India, Indonesia, Iran, Malaysia, Mongolia, Myanmar, Nepal, Pakistan, Philippines, Russia, Sri Lanka, Thailand, Turkey and Vietnam.
In Equation (7), the PM2.5 is considered endogenous because of the potential reverse causality of PM2.5 with child mortality. Since our sample of Asian countries includes middle-income economies such as Russia, Malaysia, Turkey and China, we suspect that increased child mortality will incite government responses through pollution control measures in big cities. Earlier studies, such as [24], also point out the potential endogeneity of PM2.5 in Asian countries. Our reduced-form results shown in Table 1 also confirm t instrument’s validity e.g., after controlling for population and the square of population and other covariates, the coefficients are jointly insignificant. We therefore adopt alternate specifications in our two-stage least square (2SLS) model by taking income and the square of income as instruments to estimate the first stage of variation in PM2.5. A number of studies have suggested the existence of a non-linear relationship between income and environment [25,26]. We exploit this variation in PM2.5 attributable to variation in income level measured in terms of GDP per capita in Asian countries. Our first-stage specification estimates the endogenous PM2.5 through the following:
P M 2.5 i t ^ = α 0 + α 1 ( G D P ) i t + α 2 ( G D P ) i t 2 + α 3 ( P O P ) i t + α 4 ( P O P ) i t 2 + γ i + ε i t
where P M 2.5 i t ^ in country i in year t is estimated by income measured in terms of per capita gross domestic product ( G D P i t ) and its square ( G D P ) i t 2 in country i in year t, and the population density ( P O P i t ) measured in terms of persons per square km in country i in year t. The ε i t is the error term clustered at the country level. The effect on the child mortality is estimated by the second-stage equation below.
ln ( C h i l d   M o r t a l i t y ) i t = β 0 + β 1 P M 2.5 ^ i t + β 2 E d u i t + γ i + V i t  
where child mortality in country i in year t is estimated by the estimated value of PM2.5 in the first stage. Our first-stage Equation (8) hypothesizes a U-shaped relationship between income and environment, which is consistent with earlier studies, such as [26].
The study uses child mortality under five as a dependent variable, the data for which is retrieved from the World Health Organization (WHO) Global Health Observatory repository and World Bank tables as shown in Table A1 in the Appendix A. The two datasets are included in the study to compare the results collected individually by the two different organizations. The World Bank defines child mortality as the probability of a child born in a specific year or period dying before reaching the age of 5 years, if subject to age-specific mortality rates of that period, expressed per 1000 live births. The data from WHO repository measures the prematurity deaths as the annual number of deaths due to specific cause among children less than five years. The data on air pollution (PM2.5) measured as mean annual exposure (micrograms per cubic meter), income (GDP per capita), average education (school enrollment, secondary (% gross)) and population density (persons per km2) are taken from the World Bank dataset for the period from 2000 to 2017 for sixteen Asian countries.

3. Results

Table 1 shows the reduced-form relationship between PM2.5 and child mortality in sixteen Asian countries. We find no significant effect of income and the square of income on child mortality under five after controlling for population density, the square of population density and education covariates, which suggests the endogeneity of PM2.5 as an explanatory variable. Throughout our regressions, we used country fixed effect to overcome any time-invariant, country-specific differences in the outcome variables.
In the first stage, by taking income (GDP per capita) and the square of it as instruments, we find significant variation in the endogenous variable (PM2.5) after controlling for the population covariates reported in Table 2. Thus, the first-stage results validate the use of PM2.5 as an endogenous variable to predict the indirect effect of income on the child mortality in sampled countries, as reflected by the F-test value of 15.85.
The results in Table 2 show negative effect of GDP per capita on PM2.5 and the positive effect of the square of GDP per capita on PM2.5, which suggests the existence of a U-shaped non-linear relationship in the aggregate data. Column (1) in Table 2 shows the simple OLS effect, while column (2) and column (3) show the fixed effect and random effect results, respectively. The application of the country fixed effect increases the significance level from 10% to 1%; however, it decreases the economic significance, as observed by the small values of the coefficient. Since our concern in the first stage is only to utilize the significance level (not the coefficients), we use the results of the fixed effect in the second-stage estimation.
This is surprising, since the sampled Asian countries have low pollution at the early stage of development, and high pollution at the later stages. One explanation for this U-shaped non-linearity could be the variation in the current economic development across these countries. For example, Russia, China, Turkey and Malaysia are categorized as upper-middle-income countries, while Pakistan, India and Bangladesh, etc., are lower-middle-income countries. We utilize the non-linearity of this relationship to observe the variation in the child mortality under five in the second stage. In view of the earlier studies on the squared effect of population density on air pollution (PM2.5) in the atmosphere, we also additionally control for the square of population density. The result is negative but not significant. The coefficient of the constant in Table 2 shows the average severe magnitude of particulate matter in the atmosphere of sampled countries.
Table 3 column (1) shows the 2SLS country fixed effect result of particulate matter PM2.5 (endogenous) on the log of child mortality across countries after integrating the income effect with PM2.5. More specifically, a one-unit annual increase in PM2.5 is likely to increase the mean of child mortality under five in sampled countries by 14.5%, with a 1% significance level controlling for the potential effect of population density (WHO dataset). This is striking given the mean number of children dying before the age of five (e.g., mean = 39,924, as per WHO dataset) in the studied countries shown in Table A1. Given the significant effect of PM2.5 on child mortality across countries, when we control for average education, the partial effect of PM2.5 becomes insignificant, suggesting the potential influence of average education on the attitude of people towards environmental pollution. Columns (3) and (4) in Table 3 shows the effect of endogenous PM2.5 on child mortality under five years in the sampled countries. Specifically, the annual increase by one unit in air pollution (PM2.5) is likely to increase the average mortality of children under five by 15.2% (WB dataset). After controlling for education, the result is not significant, which is consistent with the idea of education’s effect on peoples’ behavior.
We show the relationship between the predicted values of PM2.5 and child mortality in each country in Figure A1. The upward-trending quadratic fitted line in most of the sampled countries is consistent with our aggregate second-stage results shown in Table 3 except for Turkey, Russia and Pakistan. We observed that for most of the countries, our second-stage results are consistent, showing a positive effect of PM2.5 on child mortality.

4. Discussion

This study examined the relationship between air pollution (PM2.5) and child mortality in sixteen Asian countries over the period of 2000 to 2017. Our results are striking. Following an alternate model of two-stage least squares (2SLS), we found sizable 14.5% and 15.2% relationships between income and child mortality under five in both the WHO and WB datasets triggered by PM2.5 in the sixteen sampled countries, suggesting a transitional stage of these economies in terms of development. The high growth in these economies through industrialization has increased the combustion of energy resources such as coal, fuel and natural gas, with these being important resources for the economy’s production [5,11]. The thrust towards achieving higher economic growth in the sampled countries is resulting in deteriorated environmental conditions, pushing increased air pollution (PM2.5) and consequent serious health threats. Our results are corroborated by the studies of [5,15,16], who highlighted a significant relationship between air pollution (PM2.5) and child mortality. The studies in India, China [20,27], and other developing countries [3,13,28] have also established a significant relationship between air pollution and health outcomes. Some studies found that the incidence rates of child morbidity and mortality are higher among children living in highly polluted areas [29]. The WHO reports 2.3 billion people in Asian Pacific countries living with air pollution at levels considered harmful for human health. The environmental performance index developed by Columbia and Yale university shows Asia’s unsatisfactory performance, i.e., second lowest EPI score, which is just higher than Sub-Saharan Africa. The low performance in terms of environmental health is causing higher risks for the population in Asia, who are already subjected to polluted air and water, and excessive metal exposure. The continuing pace of economic growth and urbanization in Asian countries will result in even worse health outcomes due to air pollution as a result of poor resources and a lack of advanced technologies. Therefore, green finance is an environmentally friendly solution to the pollution faced by Asian countries.
Air pollution is responsible for one out of every eight deaths globally (WHO, 2016). Air pollution affects child mortality in different ways. During the gestation period, children’s lungs and immune systems are at the development stage, and therefore, are more vulnerable to air pollution [30,31]. Lelieveld et al. [1] reported that 96% of global childhood mortality is caused by air pollution and consequent lower respiratory infection (AAP-LRIs). One of the principal causes behind children’s vulnerability to LRIs is twofold, i.e., a higher breathing rate and oral inhaling, causing children to take in more air polluted with particulate matters, thus triggering lower respiratory infections [3,32]. Moreover, PM2.5 particles are very small in size, and can easily bypass the natural filters present in children’s nostrils, causing respiratory infections and consequent mortality [3].
Other associated factors include preterm birth and low birthweight, stimulating child mortality under five. The WHO (2016) attested that 1 million children die every year due to problems of preterm birth. Studies have shown that mothers exposed to pollutants experience premature births and low birth weights in their babies [33,34]. An alarming feature pushing preterm births is mounting air pollution. The countries with the highest numbers of preterm births are facing severe air pollution. Air pollution affects the pregnant mothers directly and indirectly, e.g., when the mother inhales polluted air containing CO2 and other pollutants, these pollutants mix between their bloodstream and the fetus, which has a direct effect on the baby’s health. A similar phenomenon was tested and proven by [35], who conducted studies on pregnant women exposed to particulate matters, and found carbon particles in placental samples taken after delivery of these fetuses.
The results further show that the average education decreases the severity of pollutants’ effects on child mortality. This is evident from adding average education as a control variable, as shown in Table 3. Education does not only help in increasing economic growth and individual’s incomes, but it also helps in developing behaviors and habits that contribute positively to an individuals’ health [36]. Educated parents have a greater ability to provide better care to their children, and make the best use of the health and other social services accessible to them. Education helps parents to make good and timely decisions about different health and disease factors, such as basic hygiene, prenatal care, immunization and nutrition, which are important in reducing the leading causes of child deaths under five.
Child mortality under five years has been studied in this article, but pollutants other than PM2.5, such as O3, NO2 and SO2, have not been investigated. The overall effect of these pollutants could be larger, and this requires further investigation. In addition to the two datasets, other datasets can be used to compare the results of the impact of air pollution on child mortality in those under five in future studies.

5. Conclusions

This study examined the impact of air pollution (PM2.5) on child mortality in sixteen Asian countries during 2000 to 2017. The study used data on child mortality as measured by the number of children dying before reaching the age of five (WHO and WB (per 1000 live births) data sets), air pollution measured (in terms of PM2.5) mean annual exposure (micrograms per cubic meter), education and population density. We adopted a two-staged least square model and explored variation in PM2.5 due to increasing economic growth. We found a non-linear relation of economic growth with PM2.5, suggesting a U-shaped income–environment relationship in Asian countries. Controlling for socio-economic covariates, our 2SLS fixed effect model found a significantly positive effect of PM2.5 on child mortality under five. When we controlled for average education, the effect of PM2.5 became insignificant, suggesting an important role of education in explaining the aggregate behavior of the population towards children’s health. Our results are also consistent in explaining the effect of PM2.5 on child mortality under five (WB dataset) in the sampled countries.
The results of this study will provide insights encouraging policy makers to admit the relation of children mortality to air pollution (PM2.5) and formulate effective policies to improve air quality for the general public at large. In this case, the governments of Asian countries may not wait for the long-term effects of income on PM2.5. Alternate policies, such as green financing and environmentally friendly technologies that reduce PM2.5 emissions, as well as further education programs and strategic urbanization policies to evenly distribute population density, should be implemented to overcome the severity of air pollution-related health effects. Moreover, the financial sector should focus on green investment opportunities and programs, such as green bonds, green home and building loans, and go green auto loans, to achieve green status and lower pollution in these countries.

Author Contributions

Conceptualization, A.A.; methodology, I.U., A.A.; software, I.U., A.A.; validation, A.A., I.U., M.Y., A.F.; formal analysis, I.U., A.A.; investigation, A.A.; resources, A.A.; data curation, A.A.; writing—original draft preparation, A.A., I.U.; writing—review and editing, A.A., I.U., M.Y., A.F.; visualization, A.A.; supervision, M.Y., A.F.; project administration, A.A. All authors have read and agreed to the published version of the manuscript.

Funding

This research received no external funding.

Institutional Review Board Statement

Not Applicable.

Informed Consent Statement

Not Applicable.

Data Availability Statement

The data presented in this study are available on request from the corresponding author.

Conflicts of Interest

The authors declare no conflict of interest.

Appendix A

Table A1. Descriptive Statistics.
Variable DescriptionObservationsMeanStandard DeviationMinMaxSource
Total Number of Premature Deaths (WHO) 28839,924.1789,881.62213442,544World Health OrganizationGlobal Health Repository
Premature Child Mortality per 1000 live births (WB data)28836.1325.817.4112.6Work Bank Tables
PM2.5 (Particulate Matter)16044.177424.5168611.09962100.7844Work Bank Tables
GDP Per Capita2883805.4893454.672346.774714,936.4Work Bank Tables
Population Density288223.1709265.39051.5431891265.036Work Bank Tables
Mortality (Less than 5 years)28836.1368125.816337.4112.6Work Bank Tables
Average Education28772.9287820.5227320.01234120.6316Work Bank Tables
Figure A1. Predicted PM2.5 effect on child mortality in Asian countries. Note: The above figures show the relationship between the predicted values of PM2.5 and child mortality in each country. The y-axis represents child mortality while the x-axis represents predicted PM2.5. The values of predicted PM2.5 are obtained through regressing PM2.5 on income, and the square of income. The upward-trending quadratic fitted line in most of the sampled countries is consistent with our aggregate second-stage results shown in Table 3, except for Turkey, Russia and Pakistan. We show this relationship in Figure A1 for all countries in our case. We observed that for most of the countries, our second-stage results are consistent, showing a positive effect of PM2.5 on child mortality. For some countries, this effect may not be observed in the Figures; however, as we use the conditional mean as the best linear unbiased estimator, any differences observed in individual countries do not falsify the inference inferred on average. We additionally control for the idiosyncratic behaviors of countries by using the country fixed effect in our estimation.
Ijerph 18 06375 g0a1aIjerph 18 06375 g0a1bIjerph 18 06375 g0a1c

References

  1. Lelieveld, J.; Haines, A.; Pozzer, A. Age-Dependent Health Risk from Ambient Air Pollution: A Modelling and Data Analysis of Childhood Mortality in Middle-Income and Low-Income Countries. Lancet Planet. Health 2018, 2, e292–e300. [Google Scholar] [CrossRef] [Green Version]
  2. Burnett, R.T.; Pope, C.A., III; Ezzati, M.; Olives, C.; Lim, S.S.; Mehta, S.; Shin, H.H.; Singh, G.; Hubbell, B.; Brauer, M.; et al. An Integrated Risk Function for Estimating the Global Burden of Disease Attributable to Ambient Fine Particulate Matter Exposure. Environ. Health Perspect. 2014, 122, 397–403. [Google Scholar] [CrossRef]
  3. Anwar, A.; Ayub, M.; Khan, N.; Flahault, A. Nexus between Air Pollution and Neonatal Deaths: A Case of Asian Countries. Int. J. Environ. Res. Public Health 2019, 16, 4148. [Google Scholar] [CrossRef] [Green Version]
  4. Tanaka, S. Environmental Regulations on Air Pollution in China and Their Impact on Infant Mortality. J. Health Econ. 2015, 42, 90–103. [Google Scholar] [CrossRef]
  5. Shi, L.; Zanobetti, A.; Kloog, I.; Coull, B.A.; Koutrakis, P.; Melly, S.J.; Schwartz, J.D. Low-Concentration PM2.5 and Mortality: Estimating Acute and Chronic Effects in a Population-Based Study. Environ. Health Perspect. 2016, 124, 46–52. [Google Scholar] [CrossRef] [Green Version]
  6. Korek, M.J.; Bellander, T.D.; Lind, T.; Bottai, M.; Eneroth, K.M.; Caracciolo, B.; De Faire, U.H.; Fratiglioni, L.; Hilding, A.; Leander, K.; et al. Traffic-Related Air Pollution Exposure and Incidence of Stroke in Four Cohorts from Stockholm. J. Expo. Sci. Environ. Epidemiol. 2015, 25, 517–523. [Google Scholar] [CrossRef] [PubMed] [Green Version]
  7. Chowdhury, S.; Dey, S.; Smith, K.R. Ambient PM 2.5 Exposure and Expected Premature Mortality to 2100 in India under Climate Change Scenarios. Nat. Commun. 2018, 9, 1–10. [Google Scholar] [CrossRef] [PubMed] [Green Version]
  8. Zhang, S.; Liu, X.; Bae, J. Does Trade Openness Affect CO2 Emissions: Evidence from Ten Newly Industrialized Countries? Environ. Sci. Pollut. Res. 2017, 24, 17616–17625. [Google Scholar] [CrossRef]
  9. Gouveia, N.; Junger, W.L.; Romieu, I.; Cifuentes, L.A.; de Leon, A.P.; Vera, J.; Strappa, V.; Hurtado-Díaz, M.; Miranda-Soberanis, V.; Rojas-Bracho, L.; et al. Effects of Air Pollution on Infant and Children Respiratory Mortality in Four Large Latin-American Cities. Environ. Pollut. 2018, 232, 385–391. [Google Scholar] [CrossRef] [PubMed]
  10. Burstein, R.; Henry, N.J.; Collison, M.L.; Marczak, L.B.; Sligar, A.; Watson, S.; Marquez, N.; Abbasalizad-Farhangi, M.; Abbasi, M.; Abd-Allah, F.; et al. Mapping 123 Million Neonatal, Infant and Child Deaths between 2000 and 2017. Nature 2019, 574, 353–358. [Google Scholar] [CrossRef] [Green Version]
  11. Koplitz, S.N.; Jacob, D.J.; Sulprizio, M.P.; Myllyvirta, L.; Reid, C. Burden of Disease from Rising Coal-Fired Power Plant Emissions in Southeast Asia. Environ. Sci. Technol. 2017, 51, 1467–1476. [Google Scholar] [CrossRef] [Green Version]
  12. Wu, Z.; Zhang, Y.; Zhang, L.; Huang, M.; Zhong, L.; Chen, D.; Wang, X. Trends of Outdoor Air Pollution and the Impact on Premature Mortality in the Pearl River Delta Region of Southern China during 2006–2015. Sci. Total Environ. 2019, 690, 248–260. [Google Scholar] [CrossRef]
  13. Shi, Y.; Matsunaga, T.; Yamaguchi, Y.; Zhao, A.; Li, Z.; Gu, X. Long-Term Trends and Spatial Patterns of PM2.5-Induced Premature Mortality in South and Southeast Asia from 1999 to 2014. Sci. Total Environ. 2018, 631–632, 1504–1514. [Google Scholar] [CrossRef]
  14. Cohen, A.J.; Brauer, M.; Burnett, R.; Anderson, H.; Frostad, J.; Estep, K.; Balakrishnan, K.; Brunekreef, B.; Dandona, L.; Dandona, R.; et al. Estimates and 25-Year Trends of the Global Burden of Disease Attributable to Ambient Air Pollution: An Analysis of Data from the Global Burden of Diseases Study 2015. Lancet 2017, 389, 1907–1918. [Google Scholar] [CrossRef] [Green Version]
  15. Lien, W.-H.; Opiyo Owili, P.; Muga, M.A.; Lin, T.-H. Ambient Particulate Matter Exposure and Under-Five and Maternal Deaths in Asia. Int. J. Environ. Res. Public Health 2019, 16, 3855. [Google Scholar] [CrossRef] [PubMed] [Green Version]
  16. Owili, P.O.; Lien, W.-H.; Muga, M.A.; Lin, T.-H.; Dirks, K.N. The Associations between Types of Ambient PM 2.5 and Under-Five and Maternal Mortality in Africa. Int. J. Environ. Res. Public Health 2017, 14, 359. [Google Scholar] [CrossRef] [Green Version]
  17. Sarkodie, S.A.; Strezov, V.; Jiang, Y.; Evans, T. Proximate Determinants of Particulate Matter (PM2.5) Emission, Mortality and Life Expectancy in Europe, Central Asia, Australia, Canada and the US. Sci. Total Environ. 2019, 683, 489–497. [Google Scholar] [CrossRef] [PubMed]
  18. Lepeule, J.; Laden, F.; Dockery, D.; Schwartz, J. Chronic Exposure to Fine Particles and Mortality: An Extended Follow-up of the Harvard Six Cities Study from 1974 to 2009. Environ. Health Perspect. 2012, 120, 965–970. [Google Scholar] [CrossRef] [PubMed]
  19. Kloog, I.; Ridgway, B.; Koutrakis, P.; Coull, B.A.; Schwartz, J.D. Long- and Short-Term Exposure to PM2.5 and Mortality: Using Novel Exposure Models. Epidemiology 2013, 24, 555–561. [Google Scholar] [CrossRef] [PubMed]
  20. Gao, J.; Woodward, A.; Vardoulakis, S.; Kovats, S.; Wilkinson, P.; Li, L.; Xu, L.; Li, J.; Yang, J.; Li, J.; et al. Haze, Public Health and Mitigation Measures in China: A Review of the Current Evidence for Further Policy Response. Sci. Total Environ. 2017, 578, 148–157. [Google Scholar] [CrossRef]
  21. Liu, J.; Kiesewetter, G.; Klimont, Z.; Cofala, J.; Heyes, C.; Schöpp, W.; Zhu, T.; Cao, G.; Gomez Sanabria, A.; Sander, R.; et al. Mitigation Pathways of Air Pollution from Residential Emissions in the Beijing-Tianjin-Hebei Region in China. Environ. Int. 2019, 125, 236–244. [Google Scholar] [CrossRef]
  22. Freeman, A.M., III. The Measurement of Environmental and Resource Values; RFF Press: Washington, DC, USA, 2010. [Google Scholar] [CrossRef]
  23. Fotourehchi, Z. Health Effects of Air Pollution: An Empirical Analysis for Developing Countries. Atmos. Pollut. Res. 2016, 7, 201–206. [Google Scholar] [CrossRef]
  24. Zhou, L.; Chen, X.; Tian, X. The Impact of Fine Particulate Matter (PM 2.5 ) on China’s Agricultural Production from 2001 to 2010. J. Clean. Prod. 2018, 178, 133–141. [Google Scholar] [CrossRef]
  25. Onafowora, O.A.; Owoye, O. Bounds Testing Approach to Analysis of the Environment Kuznets Curve Hypothesis. Energy Econ. 2014, 44, 47–62. [Google Scholar] [CrossRef]
  26. Oraby, T.; Bauch, C.; Anand, M. The Environmental Kuznets Curve Fails in a Globalized Socio-Ecological Metapopulation: A Sustainability Game Theory Approach. In Handbook of Statistics; Elsevier: Amsterdam, The Netherlands, 2018; Volume 39, pp. 215–341. [Google Scholar]
  27. Liu, M.; Huang, Y.; Ma, Z.; Jin, Z.; Liu, X.; Wang, H.; Liu, Y.; Wang, J.; Jantunen, M.; Bi, J.; et al. Spatial and Temporal Trends in the Mortality Burden of Air Pollution in China: 2004–2012. Environ. Int. 2017, 98, 75–81. [Google Scholar] [CrossRef] [PubMed] [Green Version]
  28. Egondi, T.; Ettarh, R.; Kyobutungi, C.; Ng, N.; Rocklöv, J. Exposure to Outdoor Particles (PM 2.5) and Associated Child Morbidity and Mortality in Socially Deprived Neighborhoods of Nairobi, Kenya. Atmosphere 2018, 9, 351. [Google Scholar] [CrossRef] [Green Version]
  29. Ghude, S.D.; Chate, D.M.; Jena, C.; Beig, G.; Kumar, R.; Barth, M.C.; Pfister, G.G.; Fadnavis, S.; Pithani, P. Premature Mortality in India Due to PM2.5 and Ozone Exposure. Geophys. Res. Lett. 2016, 43, 4650–4658. [Google Scholar] [CrossRef] [Green Version]
  30. Taksande, A.M.; Yeole, M. Risk Factors of Acute Respiratory Infection (ARI) in under-Fives in a Rural Hospital of Central India. J. Pediatr. Neonatal Individ. Med. 2016, 5, 50105. [Google Scholar] [CrossRef]
  31. You, D.; Hug, L.; Ejdemyr, S.; Idele, P.; Hogan, D.; Mathers, C.; Gerland, P.; New, J.R.; Alkema, L. Global, Regional, and National Levels and Trends in under-5 Mortality between 1990 and 2015, with Scenario-Based Projections to 2030: A Systematic Analysis by the Un Inter-Agency Group for Child Mortality Estimation. Lancet 2015, 386, 2275–2286. [Google Scholar] [CrossRef]
  32. Esposito, S.; Tenconi, R.; Lelii, M.; Preti, V.; Nazzari, E.; Consolo, S.; Patria, M.F. Possible Molecular Mechanisms Linking Air Pollution and Asthma in Children. BMC Pulm. Med. 2014, 14, 1–8. [Google Scholar] [CrossRef] [Green Version]
  33. Xu, X.; Ding, H.; Wang, X. Acute Effects of Total Suspended Particles and Sulfur Dioxides on Preterm Delivery: A Community-Based Cohort Study. Arch. Environ. Health 1995, 50, 407–415. [Google Scholar] [CrossRef]
  34. Sagiv, S.K.; Mendola, P.; Loomis, D.; Herring, A.H.; Neas, L.M.; Savitz, D.A.; Poole, C.A. Time-Series Analysis of Air Pollution and Preterm Birth in Pennsylvania, 1997-2001. Environ. Health Perspect. 2005, 113, 602–606. [Google Scholar] [CrossRef] [PubMed] [Green Version]
  35. Bové, H.; Bongaerts, E.; Slenders, E.; Bijnens, E.M.; Saenen, N.D.; Gyselaers, W.; Van Eyken, P.; Plusquin, M.; Roeffaers, M.B.J.; Ameloot, M.; et al. Ambient Black Carbon Particles Reach the Fetal Side of Human Placenta. Nat. Commun. 2019, 10, 1–7. [Google Scholar] [CrossRef] [PubMed]
  36. Anwar, A.; Khan, N.; Ayub, M.; Nawaz, F.; Shah, A.; Flahault, A. Modeling and Predicting Dengue Incidence in Highly Vulnerable Countries Using Panel Data Approach. Int. J. Environ. Res. Public Health 2019, 16, 2296. [Google Scholar] [CrossRef] [PubMed] [Green Version]
Table 1. Reduced-form effect of PM2.5 on child mortality.
Log of Child Mortality (WHO Dataset)Log of Child Mortality (WB Dataset)
(1)(2)(3)(4)
Log of PM2.5−0.0984−0.0885−0.176−0.168
(−1.047)(−0.821)(−1.392)(−1.093)
Log of GDP Per Capita1.0790.9611.1521.058
(1.414)(1.351)(1.289)(1.305)
Log of (GDP Per Capita)2−0.121 **−0.104 **−0.126 **−0.110 *
(−2.441)(−2.209)(−2.306)(−2.088)
Log of Population Density−0.356−0.403−1.458−1.486
(−0.388)(−0.449)(−1.533)(−1.542)
Log of (Population Density)20.03300.05510.05770.0709
(0.389)(0.582)(0.661)(0.758)
Average Education −0.00556 ** −0.00538 **
(−2.239) (−2.148)
Constant9.399 **9.267 ***8.236 **8.130 **
(2.886)(3.290)(2.292)(2.460)
Country FEYESYESYESYES
Observations160159160159
R-squared0.7450.7690.8530.874
Number of Countries16161616
Note: Table 1 shows the reduced-form results for the effect of covariates on child mortality. Standard errors are clustered at country-level. Unbalanced panel data from 2000 to 2017 are used for 16 Asian countries. The dependent variable in columns (1) and (2) is the log of total number of children dying under five (WHO dataset). As expected, it appears from the coefficients of covariates in columns (1) and (2) that after controlling for the square of GDP and population density, the effect of PM2.5 is statistically not significant. This means that the presence of GDP and population in the same regression with PM2.5 potentially underestimates the effect of PM2.5 on the outcome variable, strengthening the possibility that these two variables might have indirect effects on health, e.g., through PM2.5, which requires running regression in two stages. The dependent variable in columns (3) and (4) is the log of child mortality under five (per 1000 live births) (WB). Columns (3) and (4) show that GDP and the square of GDP have no direct effect on health. In using both datasets, the direct health effect of income and population is not significant. Therefore, in the two-stage least square model, we attempt to see the indirect effect (e.g., the effect of income and population on health through PM2.5). Values in brackets represent z-values. *** p < 0.01, ** p < 0.05, * p < 0.1.
Table 2. First-stage estimation for air pollution (PM2.5).
Dep. Var: PM2.5OLSOLS-FEOLS RE
GDP Per Capita−0.0105 *−0.00279 ***−0.00314 ***
(−1.990)(−3.109)(−3.491)
(GDP Per Capita)26.23 × 10−7 *1.24 × 10−7 **1.39 × 10⁻⁷ ***
(1.840)(2.648)(2.886)
Population Density0.01640.006260.0239
(0.228)(0.134)(0.624)
(Population Density)2−6.90 × 10⁻⁶−4.57 × 10⁻⁶−1.14 × 10⁻⁵
(−0.132)(−0.227)(−0.641)
Constant65.91 ***51.21 ***49.03 ***
(3.497)(6.588)(9.313)
F-Test15.8512.79-
R-squared0.3490.117-
Observations160160160
Note: the countries included in this study are Bangladesh, China, India, Indonesia, Iran, Malaysia, Mongolia, Myanmar, Nepal, Pakistan, Philippines, Russia, Sri Lanka, Thailand, Turkey and Vietnam. Standard errors are clustered at the country level. The dependent variable PM2.5 is measured in terms of mean annual exposure (micrograms per cubic meter). Unbalanced panel data from 2000 to 2017 are used for 16 Asian countries. Values in brackets represent T-values in the first two columns and Z-values in the last column. *** p < 0.01, ** p < 0.05, * p < 0.1.
Table 3. Second-stage estimation on child mortality.
Child Mortality (WHO Dataset)Child Mortality (WB Dataset)
(1)(2)(3)(4)
PM2.50.145 ***0.09350.152 **0.1000
(2.760)(1.568)(2.460)(1.463)
Population Density−0.0002180.00415−0.00514−0.00154
(−0.0255)(0.553)(−0.567)(−0.191)
(Population Density)2−8.28 × 10⁻⁷−2.57 × 10−61.25 × 10−6−1.65 × 10⁻⁷
(−0.225)(−0.806)(0.323)(−0.0490)
Average Education −0.0109 −0.0109
(−1.392) (−1.140)
Constant2.7425.054−2.492−0.0135
(3.253)(3.343)(3.695)(3.718)
Country FEYESYESYESYES
Observations160159160159
Number of country116161616
Note: Standard errors are clustered at country level. Unbalanced panel data from 2000 to 2017 are used for 16 Asian countries. The endogenous variable is the air pollution (PM2.5) estimated through GDP per capita and the square of GDP per capita. The dependent variable in columns (1) and (2) is the log of total number of children dying before the age of five (WHO datasets). The dependent variable in columns (3) and (4) is the log of child mortality under five per 1000 live deaths (WB dataset). Data are obtained from the WHO and World Bank tables. Values in brackets represent z-values. *** p < 0.01, ** p < 0.05.
Publisher’s Note: MDPI stays neutral with regard to jurisdictional claims in published maps and institutional affiliations.

