Article

Physiological Characterization of Sulfolobus acidocaldarius in a Controlled Bioreactor Environment

by
Kerstin Rastädter
,
David Johannes Wurm
,
Oliver Spadiut
and
Julian Quehenberger
*
Research Division Biochemical Engineering, Faculty of Technical Chemistry, Institute of Chemical, Environmental and Bioscience Engineering, TU Wien, 1060 Vienna, Austria
*
Author to whom correspondence should be addressed.
Int. J. Environ. Res. Public Health 2021, 18(11), 5532; https://doi.org/10.3390/ijerph18115532
Submission received: 18 April 2021 / Revised: 18 May 2021 / Accepted: 19 May 2021 / Published: 21 May 2021
(This article belongs to the Special Issue Industrial Microbiology and Bioprocess Technology)

Abstract

:
The crenarchaeal model organism Sulfolobus acidocaldarius is typically cultivated in shake flasks. Although shake flasks represent the state-of-the-art for the cultivation of this microorganism, in these systems crucial process parameters, like pH or substrate availability, are only set initially, but cannot be controlled during the cultivation process. As a result, a thorough characterization of growth parameters under controlled conditions is still missing for S. acidocaldarius. In this study, we conducted chemostat cultivations at 75 °C using a growth medium containing L-glutamate and D-glucose as main carbon sources. Different pH values and dilution rates were applied with the goal to physiologically characterize the organism in a controlled bioreactor environment. Under these controlled conditions a pH optimum of 3.0 was determined. Washout of the cells occurred at a dilution rate of 0.097 h−1 and the optimal productivity of biomass was observed at a dilution rate of 0.062 h−1. While both carbon sources were taken up by S. acidocaldarius concomitantly, a 6.6-fold higher affinity for L-glutamate was shown. When exposed to suboptimal growth conditions, S. acidocaldarius reacted with a change in the respiratory behavior and an increased trehalose production rate in addition to a decreased growth rate.

1. Introduction

The extremophile Sulfolobus acidocaldarius is a widely used model organism of the phylum Crenarchaeota. Its genome sequence is available [1] and a powerful genetic tool box for investigating and engineering gene functions has been developed [2] and is continuously being improved [3]. The organism thrives in a temperature range of 65 to 85 °C and at a pH ranging from pH 2.0 to 5.5 [4], while under laboratory conditions it is generally cultivated at temperatures of 70 to 75 °C and at a pH of 2.25 to 3.5 [5,6,7,8,9,10]. Most research with this organism is performed in batch cultivations using shake flasks as culture vessels [5,7,11]. However, a continuous cultivation in a stirred-tank reactor (CSTR) with the possibility to monitor and control pH, temperature and dissolved oxygen content (dO2) is the basis for stable growth conditions, thereby allowing the acquisition of reliable and reproducible process data [12]. Furthermore, providing the substrate in limiting amounts might also represent conditions that resembles the natural habitat of most microorganism more closely than the nutrient enriched system of batch cultivations [13,14,15]. In chemostat cultures the growth rate, biomass, substrate and product concentration remain constant after reaching steady state [16], thus making it a reliable tool for strain characterization as shown for a variety of microorganisms [17,18,19]. Critical parameters for bioprocess development, such as the optimal and critical dilution rate, affinity constants for substrates as well as maintenance coefficient, can be readily determined in a CSTR. All these parameters are missing in the current literature of Sulfolobales.
In a CSTR a potent technique to assess the physiological condition of an organism is the monitoring of the respiratory behavior, expressed as the respiratory quotient (RQ). The RQ is the molar ratio of produced CO2 to consumed O2 and depends on the state of oxidation of the metabolized substrate and the utilized catabolic pathways [20]. Higher RQs than the theoretical value for complete oxidation of the respective substrates imply incomplete substrate utilization and potential waste of energy, while lower RQs can signify a change in the carbon flow towards metabolites and hint towards a less efficient utilization of O2. A further way to monitor metabolic stress is the direct measurement of metabolites in the culture supernatant. S. acidocaldarius produces the non-reducing disaccharide trehalose, a compound that can be found in all three domains of life, where it functions as a general protecting agent against unfavorable environmental conditions [21].
In this study, the strain S. acidocaldarius DSM639 was grown in continuous cultivation on a medium containing L-glutamate and D-glucose as main carbon sources and was physiologically characterized regarding its pH optimum, maximum growth rate, specific substrate uptake rates and its stress response indicated by trehalose production and respiratory behavior.

2. Materials and Methods

2.1. Bioreactor Cultivations

S. acidocaldarius DSM639, obtained at German Collection of Microorganisms and Cell Cultures (DSMZ, Braunschweig, Germany), was continuously cultivated in a DASbox Mini Bioreactor System (Eppendorf AG, Hamburg, Germany) with a working volume of 200 mL per vessel. Four parallel bioreactors, filled with Vienna Defined (VD) Medium [22] with modified carbon source concentrations (2 g/L monosodium glutamate (MSG), 1 g/L D-glucose) were inoculated with a starting OD600 of 0.17, yielding a total batch volume of 150 mL. Feed used during fed-batch and chemostat phases contained a 5-times concentrated VD Medium with modified carbon source concentrations (9.5 g/L MSG, 4.5 g/L D-glucose and a minute amount of 0.5 g/L NZ-amine to rule out any long-term nutrient deficiencies). Fed-batch phase was performed with a continuous feed rate of 3.0 mL/h until a reactor volume of 200 mL was reached. During the following chemostat phase, the feed rate was set to 6.0 mL/h (D = 0.03 h−1). To maintain a constant volume of 200 mL, broth was withdrawn from the reactor via a bleed tube at a fixed height. The reactors were stirred with 600 rpm and supplied with 0.3 vvm (volumes gas flow per working volume per minute; equal to: 3.6 sL/h; liter at standardized conditions, 273.15 K and 1 bar per hour) pressurized air. A constant growth temperature of 75 °C was achieved by submerging the reactor vessels in a stirred heated oil bath. pH was measured with an EasyFerm Plus K8 120 electrode (Hamilton, OH, USA) and was adjusted by automatic addition of 4.8% H2SO4. Dissolved oxygen (dO2) was monitored by a VisiFerm DO225 probe (Hamilton, OH, USA). CO2 and O2 concentrations were measured using the DASGIP GA4 exhaust analyzer (Eppendorf AG, Hamburg, Germany).
To assess reproducibility three bioreactors of the DASbox Mini Bioreactor System were subjected to the same conditions (75 °C, pH 3.0, D = 0.03 h−1). Table 1 gives an overview of the experiments performed in this study.
Since the cultivation performed at pH 2.0 in the DASbox Mini Bioreactor System yielded an inexplicably high CO2 yield and consequently a C-balance that significantly exceeded a value of 1.0, this experiment was excluded from the study and was instead repeated in a 2 L Biostat A-plus bioreactor (Sartorius, Goettingen, Germany). The reactor was stirred at 300 rpm and supplied with 0.23 vvm (0.45 sL/h) pressurized air. The pH was measured with an EasyFerm Plus electrode (Hamilton, OH, USA) and controlled via automatic addition of 4.8% H2SO4. CO2 and O2 concentrations in the exhaust gas were measured using a gas analyzing unit (Müller Systems AG, Esslingen, Switzerland). The batch phase was started with 1.5 L and chemostat culturing was done at 2 L and a dilution rate of 0.03 h−1. During fed-batch an exponential feed was applied, starting with 14.8 g/h and a growth rate of 0.035 h−1. The cultivation was controlled using the Lucullus process control system (SecureCell AG, Urdorf, Switzerland). All other process parameters were set as mentioned for the DASbox Mini Bioreactor System.

2.2. Biomass Determination

Optical density, OD600, was determined photometrically at 600 nm with a spectrophotometer against a blank of deionized water (ONDA V-10 PLUS, XS instruments, Carpi, Italy). Samples were diluted with deionized water to stay in the linear range of the photometer. Due to the low biomass concentration and low reactor volume, dry cell weight (DCW) was not determined. A previously determined correlation factor of 0.586 g/L (see Supplementary Figure S1) between DCW concentration and OD600 was applied.

2.3. Substrate and Metabolites Analytics

At each sampling point, 1 mL of culture broth was centrifuged at 10,000 g for 10 min at 4 °C. The obtained supernatant was analyzed for its substrate and metabolite composition. D-glucose and trehalose concentrations in the supernatant were determined with an Aminex HPX-87H column (300 × 7.8 mm, Bio-Rad, Hercules, CA, USA) employing an Ultimate 3000 high-performance liquid chromatography (HPLC) system (Thermo Fisher Scientific, Waltham, MA, USA). 10 µL sample were analyzed at a flow rate of 0.6 mL/min and a column temperature of 60 °C. 4 mM H2SO4 served as mobile phase. For quantitative determination a RI detector (RefractoMax 520, Thermo Fisher Scientific, Waltham, MA, USA) and a UV detector (VH-D10-A, Thermo Fisher Scientific, Waltham, MA, USA) at 210 nm were used. Chromeleon 7.2.6 Chromatography Data System (Thermo Fisher Scientific, Waltham, MA, USA) was used for control and data analysis. Glutamic acid was determined via a photometric assay using a Cedex Bio HT Analyzer (Roche, Basel, Switzerland). The obtained concentration of glutamic acid was converted to the used substrate MSG by multiplication with the factor 1.15.

2.4. Calculation of Rates, Substrate Affinity Constants and Maintenance Coefficient

All rates, balances and yields were determined at each sampling point and then for each condition (pH & dilution rate) the mean value of the different sampling points was calculated.
Dilution rate, D [h−1], in the CSTR was calculated as the sum of feed and acid addition [L/h] divided by the reactor volume [L].
Dwell time, τ [h], is the invers value of the dilution rate.
Specific growth rate, µ [h−1], was determined as the difference in DCW between two sampling points divided by the average DCW between the sampling points per hour by taking into account the loss of biomass via the bleed.
µ = Δ X + Δ V b l e e d * x ¯ X ¯ * Δ t
Δt [h]  time between two sampling points
ΔX [g]  difference of total DCW in broth between the two sampling points
ΔVbleed [L]  bleed volume removed between the two sampling points
x ¯ [g/L]  average DCW concentration between sampling points
X ¯ [g]  average biomass in broth between sampling points
Cell productivity, biomass space time yield, D*x [g L−1 h−1], was calculated as the product of DCW concentration [g/L] and D [h−1].
Specific substrate uptake rates for D-glucose, qGlc [gGlc g(X)−1 h−1], and L-glutamate, qMSG [gMSG g(X)−1 h−1] (shown as MSG per DCW per hour), were calculated for every time span between sampling points as follows:
q S = Δ S r e a c t o r + S i n S o u t Δ t * X ¯  
ΔSreactor [g]  difference of amount of substrate in broth between the two sampling points
Sin [g]  substrate supplied to bioreactor within the time period
Sout [g]  substrate discharged via the bleed within the time period
Specific production rate of extracellular trehalose qTre [gTre g(X)−1 h−1] was calculated according to:
q P = Δ P r e a c t o r + P i n P o u t Δ t * X ¯  
ΔPreactor [g]  difference of amount of product in broth between the two sampling points
Pin [g]  product supplied to bioreactor within the time period
Pout [g]  product discharged via the bleed within the time period
Biomass Yield, YX/S [g(X)/g(S)], was calculated as the quotient of µ [h−1] and qS [g(S) g(X)−1 h−1].
CO2 yield, YCO2/S [C-molCO2/C-molS] was calculated as the quotient of the specific CO2 evolution rate [C-molCO2 g(X)−1 h−1] and qS [C-molS g(X)−1 h−1].
Trehalose yield, YTre/S [C-molTre/C-molS] was calculated as the quotient of qTre [C-molTre g(X)−1 h−1] and qS [C-molS g(X)−1 h−1].
C-balance was determined as the sum of YX/S, YCO2/S, and YTre/S, all in carbon-mol per carbon-mol. A C-balance close to 1.0 implies that all carbon atoms provided via substrate can be accounted for and are recovered either in the biomass (YX/S), in the exhaust gas (YCO2/S) or in metabolites (YTre/S).
Respiratory quotient, RQ, was calculated as the quotient of the carbon evolution rate [mmol L−1 h−1] and the oxygen uptake rate [mmol L−1 h−1]. Oxygen uptake rate and CO2 evolution rate were calculated by measuring the effluent concentrations of oxygen and CO2.
Specific carbon dioxide production rate, qCO2 [mmol g(X)−1 h−1], was determined by dividing the carbon dioxide production rate by the DCW concentration.
Specific oxygen consumption rate, qO2 [mmol g(X)−1 h−1], was determined by dividing the oxygen uptake rate by the DCW concentration.
Substrate affinity constants, Ks [g/L] for D-glucose and MSG and the maximum growth rate, µmax [h−1], were fitted by using the program SigmaPlot 14 (Systat Software, San Jose, CA, USA). The growth rate was plotted versus the substrate concentration in the supernatant and a Monod function (Equation (4)) was fitted accordingly. The standard errors for KS and µmax describing the quality of the fit were calculated with SigmaPlot.
µ = µ max S S + K S
µ [h−1]  growth rate calculated for each applied dilution rate
S [g/L]  substrate concentration, measured in the supernatant
With the obtained KS values and µmax the critical dilution rate, Dcrit [h−1] for both D-glucose and MSG were determined according to:
D c r i t = µ m a x S 0 K s + S 0
µmax [h−1]  maximum growth rate determined via Equation (4)
S0 [g/L]  substrate concentration (D-glucose or MSG) in the supplied feed
Optimal dilution rate, Dopt [h−1], for maximum cell productivity, was calculated as follows:
D o p t = µ m a x ( 1 K s K s + S 0   )
To determine the specific maintenance coefficient, ms [g(S) g(X)−1 h−1], Equation (7) was rearranged to Equation (8). Subsequently, the overall specific substrate uptake rate qS (qGlc + qMSG) was plotted against the specific growth rates resulting in a line with a slope equivalent to 1/YX/S* and an offset equivalent to ms.
µ = ( q S m S ) * Y X / S *
q S = 1 Y X / S * * µ + m S
qS [g(S) g(X)−1 h]  specific substrate uptake rate, the sum of qGlc and qMSG
YX/S* [g/g]  true biomass yield, used solely for growth
Standard deviation, STD [%], for each parameter of the reproducibility experiments was calculated as the square root of the variance divided by its mean.

3. Results

Reproducibility experiments, in which three reactors were subjected to the same conditions (75 °C, pH 3.0, D = 0.03 h−1), showed a standard deviation (STD) <3% for OD, µ and qMSG, whereas qGlc and qTre exhibited a STD of <10%. In the following experiments, each condition (shift of pH or dilution rate) was maintained for at least four theoretical dwell times. This number of dwell times, required for reaching steady state, was determined during the reproducibility studies (data not shown).

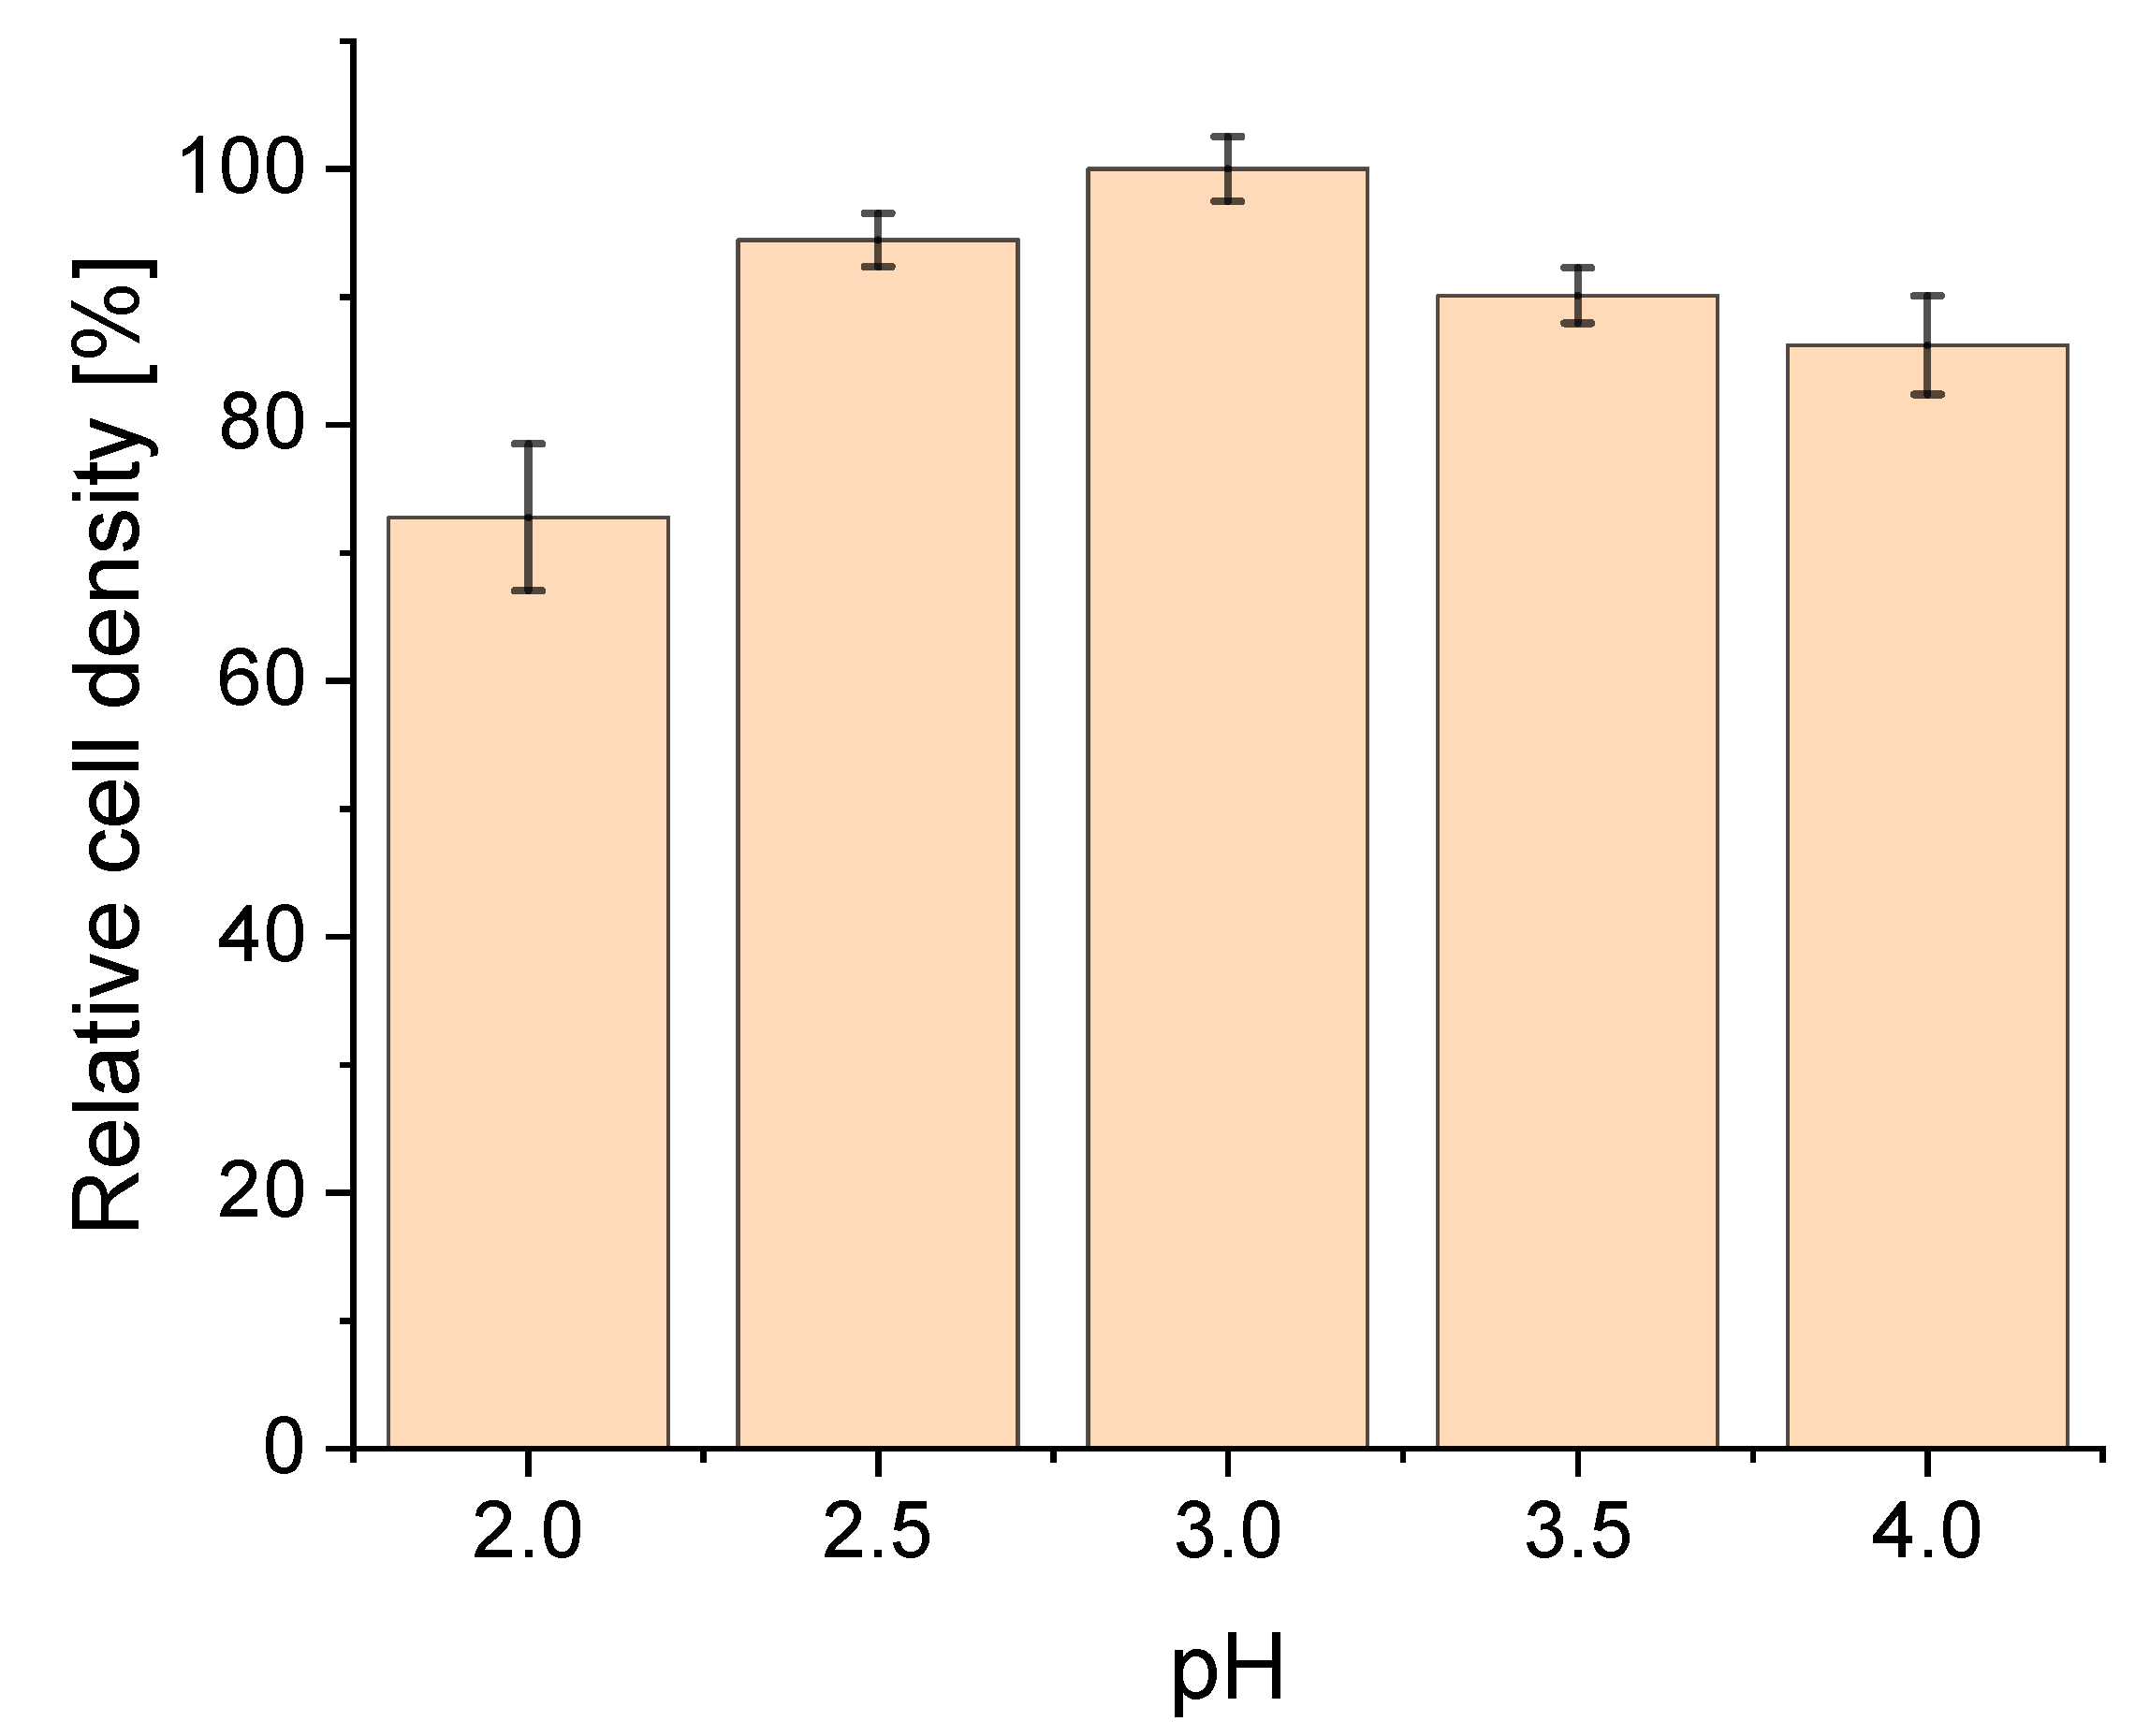
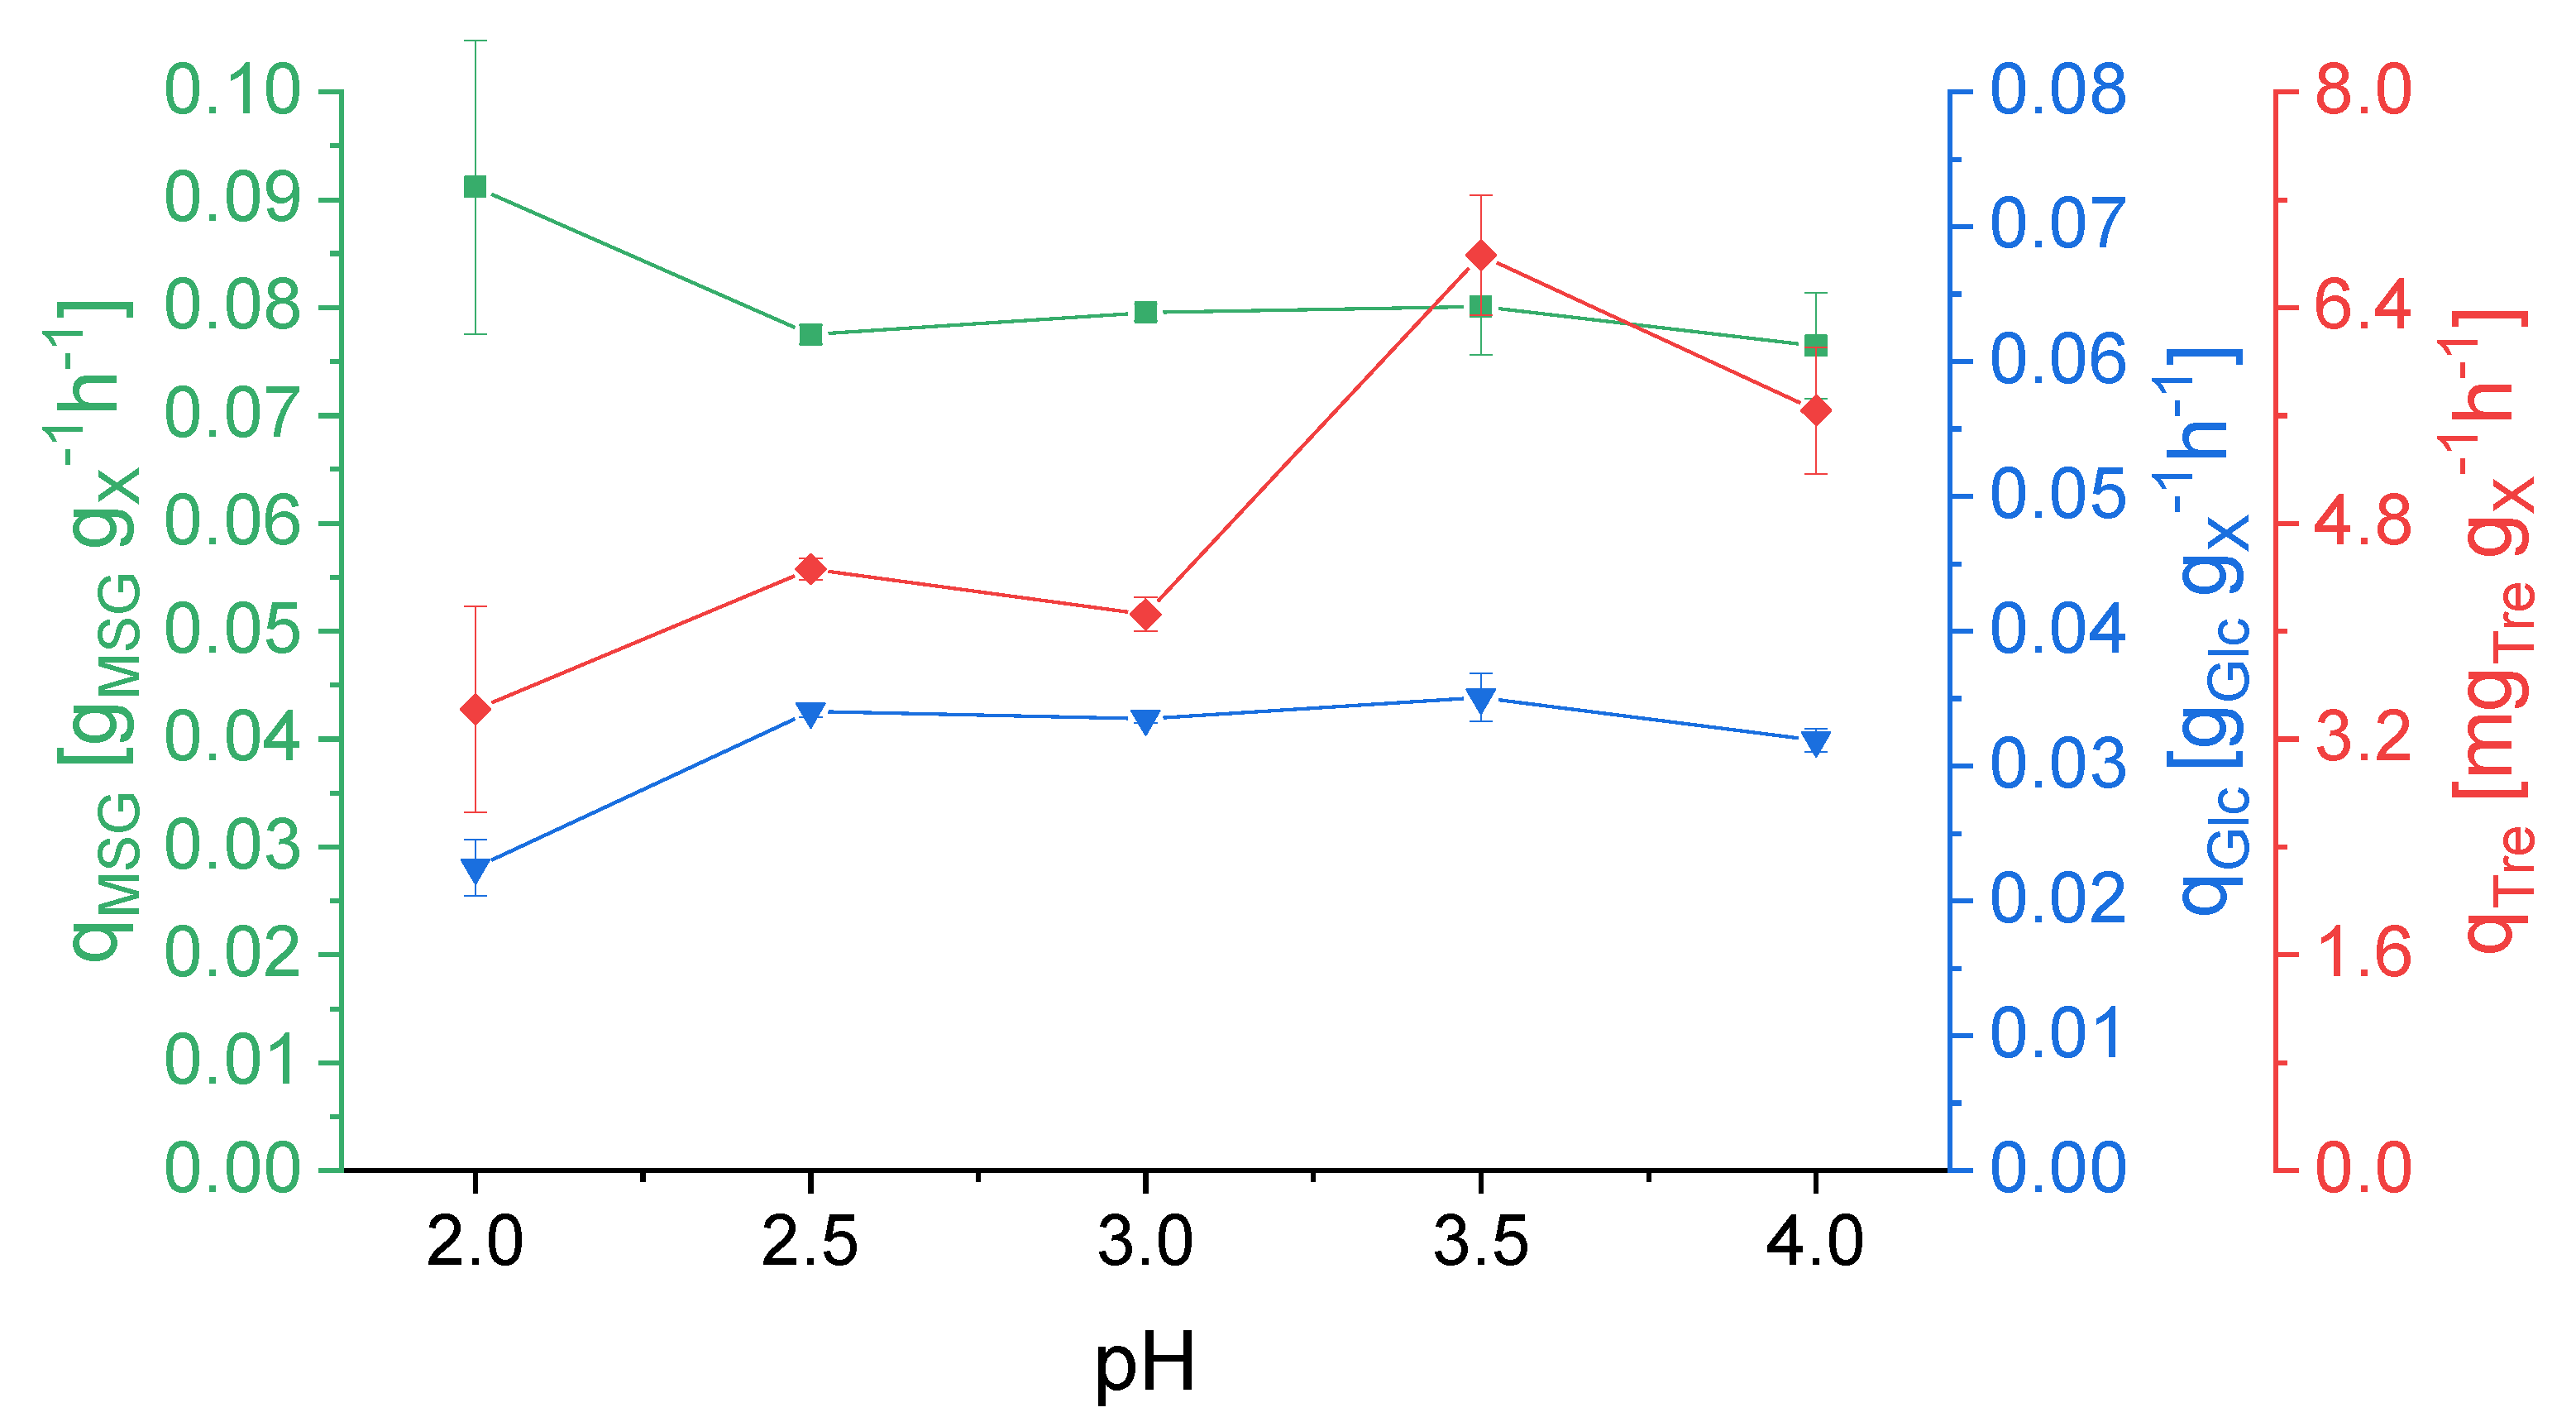
3.1. Effect of pH on Strain Physiology

Since the pH optimum of this organism is still disputed in literature and recently Cobban et al. [11] showed data conflicting with the broad consensus of the optimal pH of 3 to 3.5 [5,6,7,8,9,10], we determined the pH optimum by shifting the pH from 2.0 to 4.0 in increments of 0.5 pH units at a constant growth temperature of 75 °C and dilution rate of 0.03 h−1.
In our studies, highest cell densities were reached at pH 3.0 (Figure 1). Upon reducing the pH to 2.5 and 2.0, the cell density decreased by 9% and 27%, respectively. Increasing the pH to 3.5 and 4.0 resulted in a reduction of cell density by 13% and 14%, respectively.
The specific glutamate uptake rate, qMSG, was constant throughout the pH changes with only a slight, nonsignificant increase at pH 2.0 (Figure 2). The specific glucose uptake rate, qGlc, decreased considerably at pH 2.0. The specific production rate of trehalose, qTre, increased when the culture was subjected to pH values of 3.5 and 4.0 (1.64- and 1.37-fold, respectively), implicating a metabolic shift at higher pH values.
The C-balance of all cultivations closed at 1.0 ± 0.1. Also, RQ and biomass yield remained constant throughout all investigated pH values (Figure 3). Solely the CO2 yield increased at pH 2.0 compared to the other pH conditions.

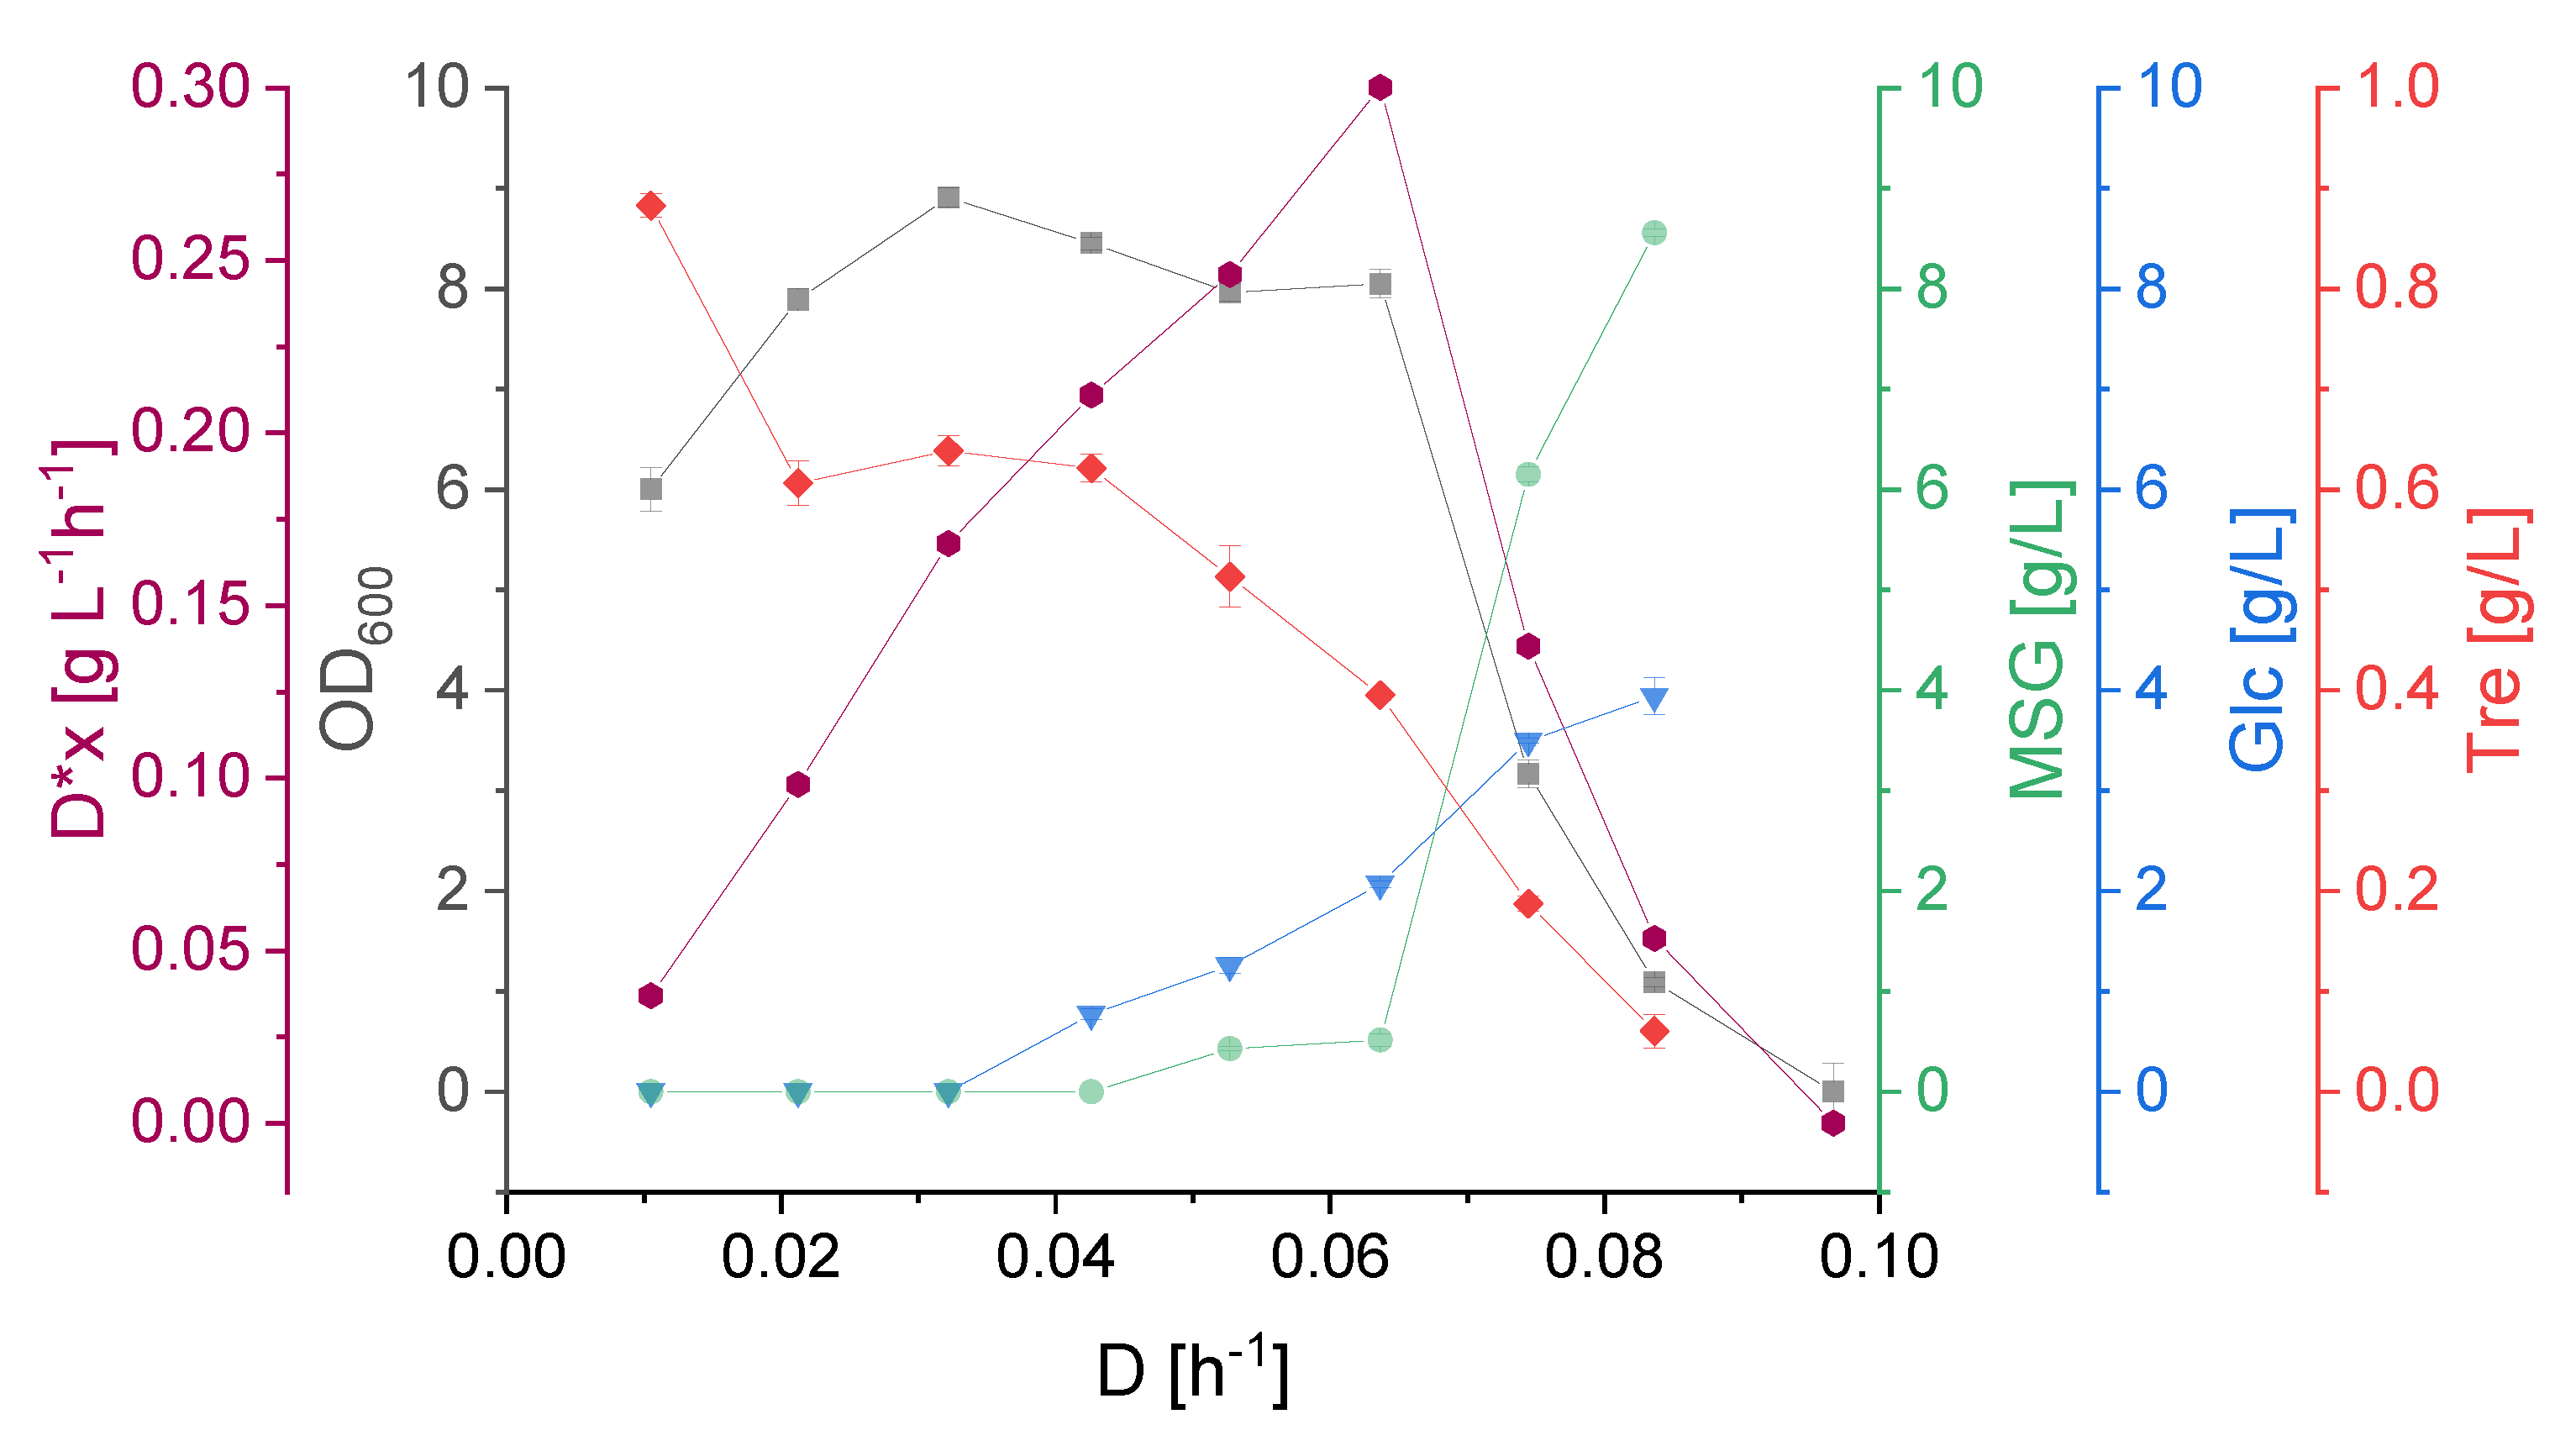
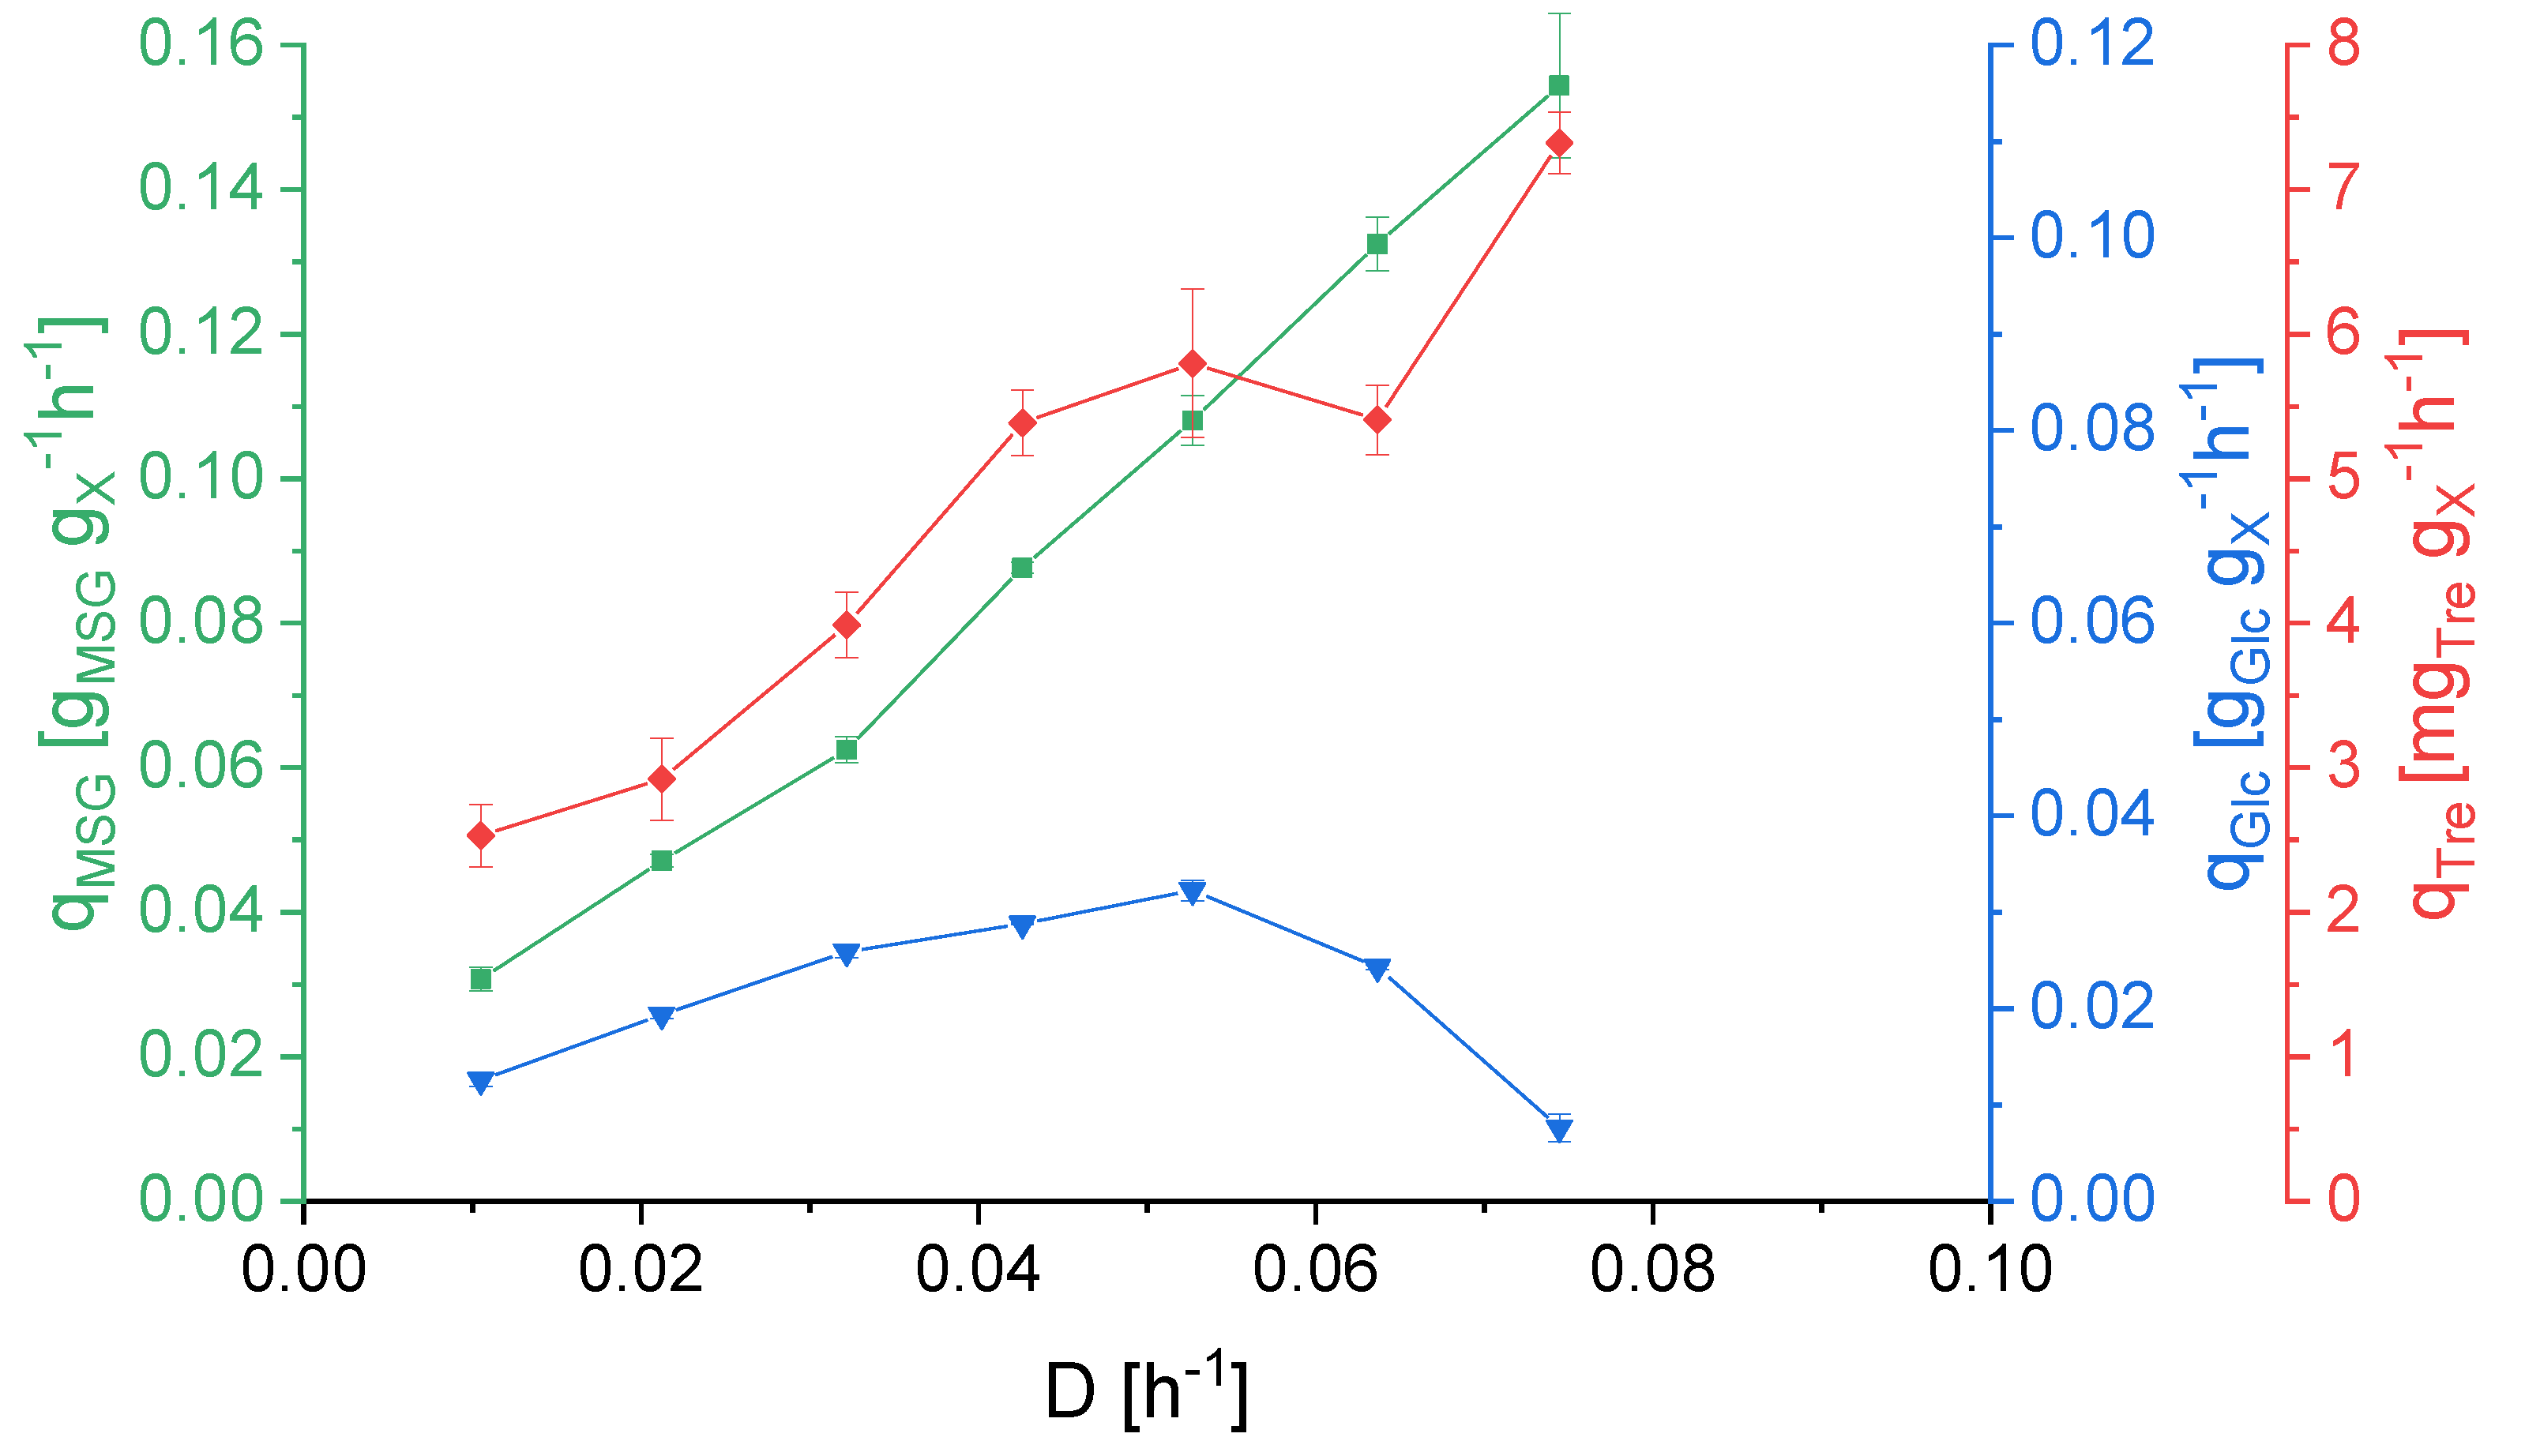
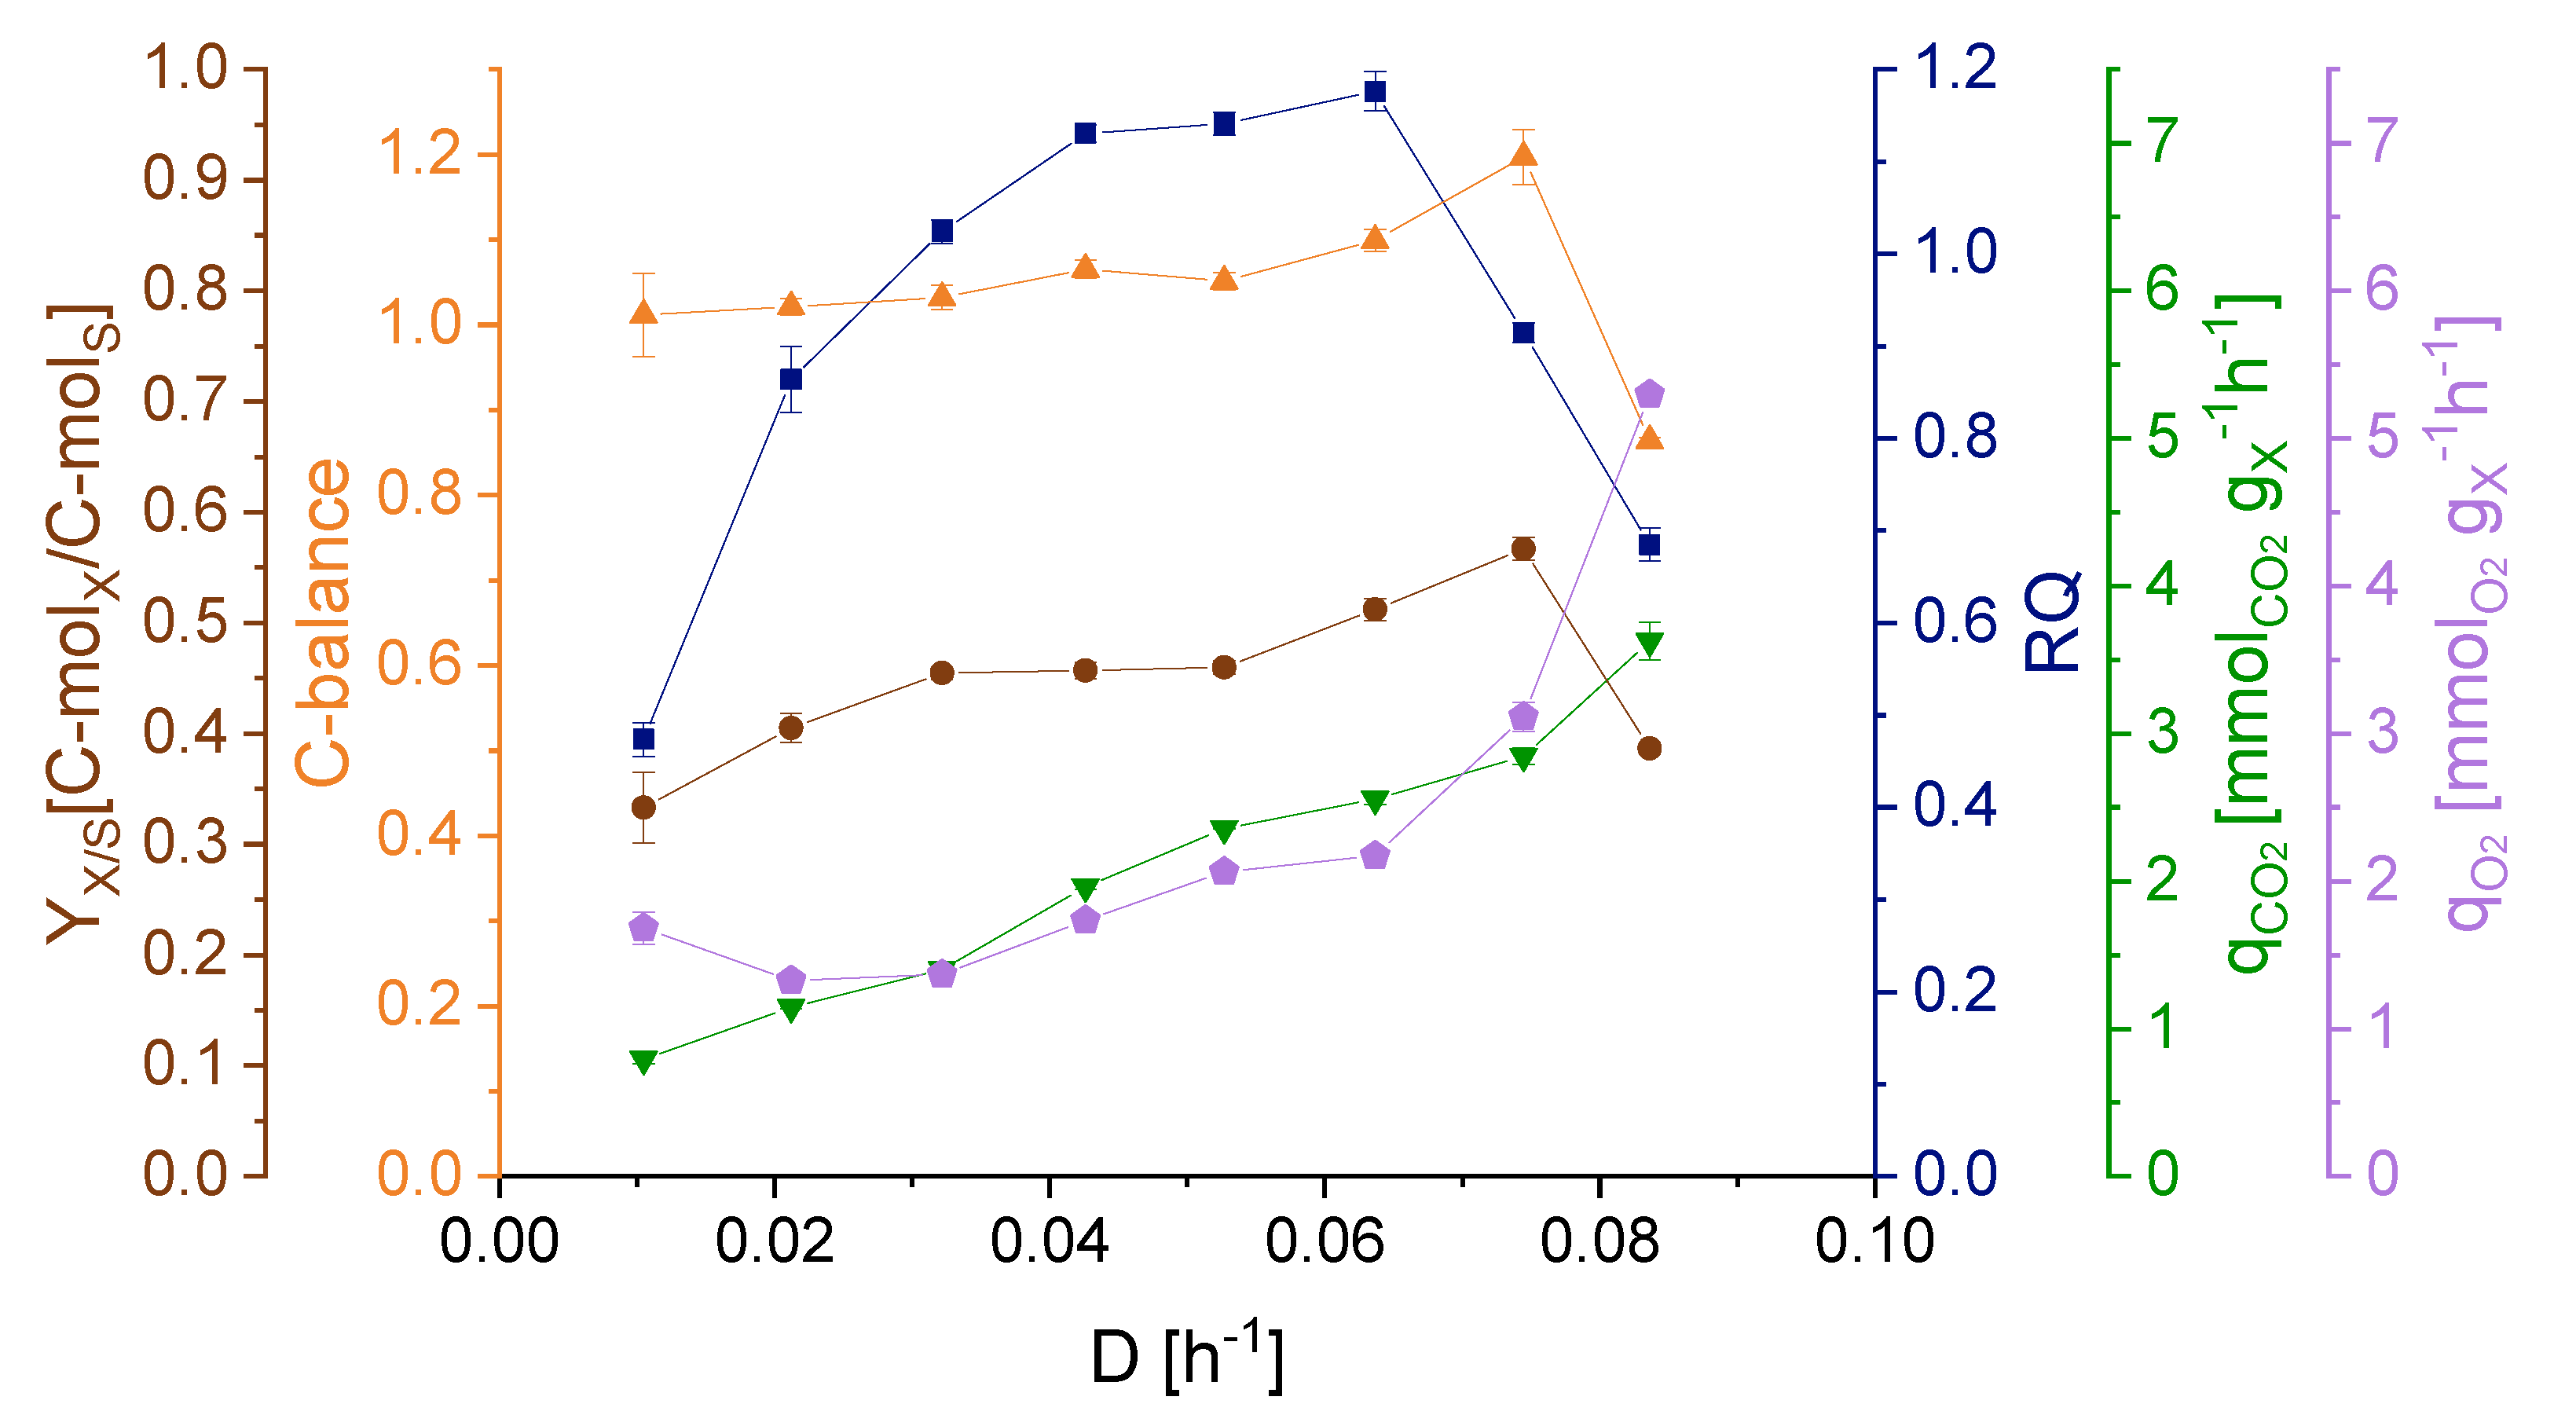
3.2. Effect of Dilution Rate on Strain Physiology

For determination of µmax, the optimum and critical dilution rate, the substrate affinity constants as well as the maintenance coefficient, S. acidocaldarius cultures were subjected to different dilution rates ranging from 0.010 to 0.097 h−1 at a constant pH of 3.0. The dilution rate was stepwise increased by increments of ~0.011 h−1. D-glucose started to accumulate prior to L-glutamate while the extracellular trehalose concentration decreased as a result of increasing dilution rates (Figure 4). The cell density was the highest at a dilution rate of 0.032 h−1. However, the biomass space time yield reached its maximum at D = 0.062 h−1 with a value of 0.3 g L−1 h−1. A dilution rate of 0.074 h−1 led to a rapid decrease of biomass concentration in the reactor. Washout, defined as the dilution rate at which no steady state could be established, occurred between 0.084 and 0.097 h−1.
Figure 5 shows the difference between the uptake rates of D-glucose and L-glutamate. While qMSG increased with the applied dilution rate, qGlc reached its peak at 0.053 h−1. Then qGlc decreased, indicating that the metabolic capacity had been exhausted for this substrate. The specific trehalose production was increasing in response to increasing dilution rates. This is a further indication for the role of trehalose production as part of a stress response [23]. Rising dilution rates put the cell under stress due to the growth rate approaching µmax and the organism is gradually approaching its maximal metabolic capacity [24,25].
The course of the RQ values mirrored the qGlc trend in relation to the different applied dilution rates (Figure 6). The highest RQ of 1.18 was determined at D = 0.064 h−1 and the lowest at D = 0.010 h−1. These decreased RQ values at the lower and higher dilution rates, indicate a lower CO2 production in relation to the O2 consumption. Since qO2 varies more greatly with the dilution rates than qCO2, the main reason for the shifted RQ values is a change in the specific oxygen uptake rate, qO2. A less efficient oxygen utilization in the respiratory chain as a result of the dilution rate is a possible explanation for the increasing demand for oxygen. The C-balance was around 1.0 until a dilution rate of 0.074 h−1. The over- and undershooting of the C-balance at dilution rates of 0.074 h−1 and higher can be interpreted as a sign for the culture reaching a non-steady state and approaching the point of washout.

3.3. KS Values, Optimal and Critical Dilution Rate

Based on the Monod fit of µ plotted versus the substrate concentration, the affinity constants for the used substrates, L-glutamate and D-glucose, were calculated. As shown in Figure 4, D-glucose started to accumulate at a dilution rate of 0.042 h−1 while L-glutamate did not accumulate until a dilution rate of 0.052 h−1. This is also reflected in the calculated KS values (Table 2). According to these, the affinity of S. acidocaldarius for D-glucose (0.99 g/L) is 6.6 times lower than for MSG (0.15 g/L). The resulting theoretical µmax, determined via the Monod fit, also differed for the two substrates, 0.077 h−1 for MSG and 0.095 h−1 for D-glucose. Based on the exponential increase of the CO2 concentration in the exhaust gas during the batch phase at the beginning of the cultivation, µmax was determined as 0.097 h−1.
The optimal dilution rate calculated in this study is different in depending on the different substrate uptakes (Table 2). A lower Dopt of 0.055 h−1 is postulated based on the utilization of D-glucose. However, for the main substrate L-glutamate an optimal dilution rate of 0.068 h−1 is calculated, which is supported by the D*x diagram (Figure 4). The considerable difference in KS values for the substrates causes the divergence of the actual Dopt to the one presumed based on D-glucose, while the uptake of L-glutamate increased the optimal dilution rate. The calculated Dcrit of around 0.077 h−1 after which washout should occur is slightly lower compared to the obtained experimental data (D = 0.084 h−1, Figure 4).

3.4. Maintenance

Maintenance respiration in thermoacidophiles is assumed to be relatively high [26], due to the need for retaining a near neutral cytosolic pH of 6.5 [27] as well as for repairing DNA and protein damage as a result of the high temperature [28] thereby possibly draining the supply of carbon sources available for biomass growth. Therefore, to further characterize S. acidocaldarius, its maintenance coefficient was calculated by plotting qS (qGlc + qMSG) versus growth rate. The maintenance coefficient for the total substrate was determined according to Equation (8), as well as the true biomass yield (the biomass yield per substrate used solely for growth). For this calculation, just the values of the dilution rates between 0.010 and 0.064 h−1 were considered, since higher dilution rate showed a flattening of the curve as the qS values differed only marginally. Thereby, a true biomass yield of 0.42 g(X)/g(S) was determined. The calculated maintenance requirement, mS, of 0.017 g(S) g(X)−1 h−1 for S. acidocaldarius for the mixed substrate feed with D-glucose and L-glutamate is surprisingly low, since Korz et al. postulated the maintenance coefficient in Escherichia coli to be 0.025 gS/gX/h cultivated in D-glucose or glycerol [29]. Nevertheless, in relative terms the ratio of mS to the observed total qS is around 10% at a dilution rate of 0.075 h−1 and increases with decreasing dilution rates to 39% at 0.010 h−1. Even though similar values of maintenance coefficients were observed in other organisms and the biomass yield for D-glucose is also comparable to E. coli [30], the possible qS values in bacteria is higher by up to 3.42–12.8 fold [30]. Hence, in that perspective the ratio maintenance coefficient to substrate uptake rates is much higher in this extremophilic organism. Studies in other bacteria showed a high variability in maintenance coefficients within the same species. This variation, in addition to differently specified coefficient units, impedes comparison with other species. Nevertheless, a trend towards higher maintenance coefficients was observed under anaerobic cultivation conditions [31,32]. Unfortunately, no comparative results for maintenance coefficient in Archaea was found.

4. Discussion

While there is broad consensus on the optimal growth temperature of S. acidocaldarius being at 75 °C [7,8,9,10,33] the described optimal cultivation pH still varies [5,6,7,8,9,10]. Our study determined a pH optimum of 3.0 in regards to the cell density during continuous cultivation (Figure 2), contradicting the recent publication by Cobban et al. [11], in which higher biomass yields were observed at pH 2.0 and 4.0 compared to pH 3.0. A possible reason for the differences could be the used cultivation temperature for their experiments of 70 °C and that cultivations were performed in batch mode using a different medium.
The applied pH influenced the specific glucose uptake rate and the specific trehalose production rate (Figure 3). According to the obtained data, higher pH triggered trehalose production while lower pH had no effect. Koerdt et al. [34] showed increasing biofilm formation with increasing pHs as well as upregulated sugar transport for the formation of the biofilm. In the present study, specific trehalose production was upregulated at higher pHs, possibly going hand-in-hand with the observed increased biofilm formation at higher pH values by Koerdt et al.
The substrate uptake rates (Figure 5) are in accordance with the obtained Ks values (Table 2). D-glucose, like other saccharides, is transported into the cell via an ATP binding cassettes (ABC) transporter [35,36]. The transporter for L-glutamate has not been identified yet. Until now, ABC transporters were only found to be responsible for di- and oligopeptide uptake in Saccharolobus solfataricus (Sulfolobus solfataricus) and Sulfurisphaera tokodaii (Sulfolobus tokodaii) [35]. However, these are all close relatives of S. acidocaldarius. Amino acids have also been shown to be transported into organisms by facilitated diffusion [37]. Despite the organism’s preference of MSG over D-glucose, the presence of the latter is still beneficial. The specific uptake rate increases until D = 0.053 h−1, confirming the organism’s capacity for metabolizing D-glucose and MSG concomitantly.
Upon changing dilution rates, the respiratory behavior, as shown by the RQ values, as well as the calculated C-balances (Figure 6) indicate a shift in the carbon flow. Additionally, the elevated oxygen consumption at low and high dilution rates further propose an impairment in the respiratory chain, implying a higher O2 need for substrate metabolization.
With the obtained data a range of 0.077 to 0.097 h−1 for µmax was identified. According to the exponential increase in the batch phase µmax is 0.097 h−1. In the applied chemostat cultivation µmax lies between 0.084 and 0.097 h−1. Based on the Monod fit for each substrate, µmax varies significantly between 0.077 h−1 for MSG and 0.095 h−1 for D-glucose. The overall range of obtained µmax is in accordance with data obtained in shake flask cultivation within the genus Sulfolobus spp. [22,38].
The characterization of S. acidocaldarius in a continuous bioreactor environment and determination of the relationship between pH, substrate uptake and trehalose production rate showed indications for distinctive stress responses at extreme pH values and dilution rates expressed as low RQ values, increased trehalose production and decreased specific glucose uptake rates. This study demonstrates the value of CSTR setups for fast and reliable generation of physiological parameters in a highly reproducible environment. As an outlook, the methodology described in this work can be used for medium optimization based on substrate affinity, control of biomass and metabolite production and optimization of time-space-yields in production processes in industrial settings, as well as the determination of operation windows of process conditions where robust cultivation of S. acidocaldarius is possible. Overall, with this study we could bring novel insight in the physiology of S. acidocaldarius under steady-state conditions and provide a basis for further bioprocess development, monitoring and control.

5. Conclusions

In this study, physiological characterization in a controlled chemostat cultivation using a modified VD Medium at a constant temperature of 75 °C was conducted. The pH optimum was confirmed to be 3.0. The affinity constants of the used carbon sources, D-glucose and MSG was determined. The specific glucose uptake rates in response to the dilution rates imply a possible overflow metabolism in which the substrate is incompletely oxidized despite the availability of oxygen which however has to be further investigated for possible verification. The maximum growth rate was determined to be 0.097 h−1. Respiratory behavior and trehalose production changed as a response to the different pH and dilution rate, indicating a stress response of the organism. All in all, it was shown that controlled cultivation conditions employing S. acidocaldarius are possible and beneficiary for further research topics of this crenarchaeal model organism and represent a solid foundation for further bioprocess development.

Supplementary Materials

The following are available online at https://www.mdpi.com/article/10.3390/ijerph18115532/s1, Figure S1: Correlation between dry cell weight (DCW) and OD600 of Sulfolobus acidocaldarius.

Author Contributions

Conceptualization, K.R., D.J.W., O.S. and J.Q.; investigation, K.R.; writing—original draft preparation, K.R.; writing—review and editing, J.Q., D.J.W. and O.S.; visualization, K.R.; supervision, J.Q.; project administration, D.J.W.; funding acquisition, O.S. All authors have read and agreed to the published version of the manuscript.

Funding

J.Q. acknowledges funding from the Austrian Science Fund (FWF) via the project “CO2 fixation in extreme conditions” (Project Nr.: I 4508). Additionally, the authors acknowledge the TU Wien Bibliothek for financial support through its Open Access Funding Program.

Institutional Review Board Statement

Not applicable.

Informed Consent Statement

Not applicable.

Acknowledgments

Open Access Funding by the Austrian Science Fund (FWF).

Conflicts of Interest

The authors declare no conflict of interest.

References

  1. Chen, L.; Brügger, K.; Skovgaard, M.; Redder, P.; She, Q.; Torarinsson, E.; Greve, B.; Awayez, M.; Zibat, A.; Klenk, H.-P.; et al. The Genome of Sulfolobus Acidocaldarius, a Model Organism of the Crenarchaeota. J. Bacteriol. 2005, 187, 4992–4999. [Google Scholar] [CrossRef] [Green Version]
  2. Wagner, M.; van Wolferen, M.; Wagner, A.; Lassak, K.; Meyer, B.H.; Reimann, J.; Albers, S.-V. Versatile Genetic Tool Box for the Crenarchaeote Sulfolobus Acidocaldarius. Front. Microbiol. 2012, 3. [Google Scholar] [CrossRef] [Green Version]
  3. Gudbergsdottir, S.; Deng, L.; Chen, Z.; Jensen, J.V.K.; Jensen, L.R.; She, Q.; Garrett, R.A. Dynamic Properties of the Sulfolobus CRISPR/Cas and CRISPR/Cmr Systems When Challenged with Vector-Borne Viral and Plasmid Genes and Protospacers. Mol. Microbiol. 2011, 79, 35–49. [Google Scholar] [CrossRef] [Green Version]
  4. Grogan, D.W. Phenotypic Characterization of the Archaebacterial Genus Sulfolobus: Comparison of Five Wild-Type Strains. J Bacteriol. 1989, 171, 6710–6719. [Google Scholar] [CrossRef] [PubMed] [Green Version]
  5. Zhou, A.; Weber, Y.; Chiu, B.K.; Elling, F.J.; Cobban, A.B.; Pearson, A.; Leavitt, W.D. Energy Flux Controls Tetraether Lipid Cyclization in Sulfolobus Acidocaldarius. Environ. Microbiol. 2020, 22, 343–353. [Google Scholar] [CrossRef] [PubMed]
  6. Buetti-Dinh, A.; Dethlefsen, O.; Friedman, R.; Dopson, M. Transcriptomic Analysis Reveals How a Lack of Potassium Ions Increases Sulfolobus Acidocaldarius Sensitivity to PH Changes. Microbiology 2016, 162, 1422–1434. [Google Scholar] [CrossRef]
  7. Quehenberger, J.; Pittenauer, E.; Allmaier, G.; Spadiut, O. The Influence of the Specific Growth Rate on the Lipid Composition of Sulfolobus Acidocaldarius. Extremophiles 2020. [Google Scholar] [CrossRef] [PubMed] [Green Version]
  8. Zeng, Z.; Liu, X.-L.; Wei, J.H.; Summons, R.E.; Welander, P.V. Calditol-Linked Membrane Lipids Are Required for Acid Tolerance in Sulfolobus Acidocaldarius. Proc. Natl. Acad. Sci. USA 2018, 115. [Google Scholar] [CrossRef] [PubMed] [Green Version]
  9. Bischof, L.F.; Haurat, M.F.; Hoffmann, L.; Albersmeier, A.; Wolf, J.; Neu, A.; Pham, T.K.; Albaum, S.A.; Jakobi, T.; Schouten, S.; et al. Early Response of Sulfolobus Acidocaldarius to Nutrient Limitation. Front. Microbiol. 2019, 9. [Google Scholar] [CrossRef]
  10. Guan, Z.; Delago, A.; Nußbaum, P.; Meyer, B.; Albers, S.-V.; Eichler, J. Gene Deletions Leading to a Reduction in the Number of Cyclopentane Rings in Sulfolobus Acidocaldarius Tetraether Lipids. Fems Microbiol. Lett. 2018, 365. [Google Scholar] [CrossRef]
  11. Cobban, A.; Zhang, Y.; Zhou, A.; Weber, Y.; Elling, F.J.; Pearson, A.; Leavitt, W.D. Multiple Environmental Parameters Impact Lipid Cyclization in Sulfolobus Acidocaldarius. Environ. Microbiol. 2020, 22, 4046–4056. [Google Scholar] [CrossRef] [PubMed]
  12. Garcia-Ochoa, F.; Santos, V.E.; Gomez, E. 2.15-Stirred Tank Bioreactors. In Comprehensive Biotechnology, 2nd ed.; Moo-Young, M., Ed.; Academic Press: Burlington, NJ, USA, 2011; pp. 179–198. ISBN 978-0-08-088504-9. [Google Scholar]
  13. Brock, T.D.; Mosser, J.L. Rate of Sulfuric-Acid Production in Yellowstone National Park. Gsa Bull. 1975, 86, 194–198. [Google Scholar] [CrossRef]
  14. Spangler, L.E.; Susong, D.D. Use of Dye Tracing to Determine Ground-Water Movement to Mammoth Crystal Springs, Sylvan Pass Area, Yellowstone National Park, Wyoming; Scientific Investigations Report; U.S. Geological Survey: Reston, VA, USA, 2006; Volume 2006–5126, p. 19. [Google Scholar]
  15. McMillan, N.; Larson, P.; Fairley, J.; Mulvaney-Norris, J.; Lindsey, C.R. Direct Measurement of Advective Heat Flux from Several Yellowstone Hot Springs, Wyoming, USA. Geosphere 2018. [Google Scholar] [CrossRef]
  16. Žnidaršič-Plazl, P.; Plazl, I. 2.21-Microbioreactors. In Comprehensive Biotechnology, 2nd ed.; Moo-Young, M., Ed.; Academic Press: Burlington, NJ, USA, 2011; pp. 289–301. ISBN 978-0-08-088504-9. [Google Scholar]
  17. Weusthuis, R.A.; Pronk, J.T.; van den Broek, P.J.; van Dijken, J.P. Chemostat Cultivation as a Tool for Studies on Sugar Transport in Yeasts. Microbiol Rev 1994, 58, 616–630. [Google Scholar] [CrossRef] [PubMed]
  18. Dunham, M.J.; Kerr, E.O.; Miller, A.W.; Payen, C. Chemostat Culture for Yeast Physiology and Experimental Evolution. Cold Spring Harb. Protoc. 2017, 2017. [Google Scholar] [CrossRef] [PubMed] [Green Version]
  19. Lin, H.; Bennett, G.N.; San, K.-Y. Chemostat Culture Characterization of Escherichia Coli Mutant Strains Metabolically Engineered for Aerobic Succinate Production: A Study of the Modified Metabolic Network Based on Metabolite Profile, Enzyme Activity, and Gene Expression Profile. Metab. Eng. 2005, 7, 337–352. [Google Scholar] [CrossRef] [PubMed]
  20. Patel, H.; Kerndt, C.C.; Bhardwaj, A. Physiology, Respiratory Quotient. In StatPearls; StatPearls Publishing: Treasure Island, FL, USA, 2020. [Google Scholar]
  21. Elbein, A.D.; Pan, Y.T.; Pastuszak, I.; Carroll, D. New Insights on Trehalose: A Multifunctional Molecule. Glycobiology 2003, 13, 17R–27R. [Google Scholar] [CrossRef]
  22. Quehenberger, J.; Albersmeier, A.; Glatzel, H.; Hackl, M.; Kalinowski, J.; Spadiut, O. A Defined Cultivation Medium for Sulfolobus Acidocaldarius. J. Biotechnol. 2019, 301, 56–67. [Google Scholar] [CrossRef]
  23. Stracke, C.; Meyer, B.H.; Hagemann, A.; Jo, E.; Lee, A.; Albers, S.-V.; Cha, J.; Bräsen, C.; Siebers, B. Salt Stress Response of Sulfolobus Acidocaldarius Involves Complex Trehalose Metabolism Utilizing a Novel Trehalose-6-Phosphate Synthase (TPS)/Trehalose-6-Phosphate Phosphatase (TPP) Pathway. Appl. Environ. Microbiol. 2020, 86. [Google Scholar] [CrossRef]
  24. Vemuri, G.N.; Altman, E.; Sangurdekar, D.P.; Khodursky, A.B.; Eiteman, M.A. Overflow Metabolism in Escherichia Coli during Steady-State Growth: Transcriptional Regulation and Effect of the Redox Ratio. Appl. Environ. Microbiol. 2006, 72, 3653–3661. [Google Scholar] [CrossRef] [Green Version]
  25. Valgepea, K.; Adamberg, K.; Nahku, R.; Lahtvee, P.-J.; Arike, L.; Vilu, R. Systems Biology Approach Reveals That Overflow Metabolism of Acetate in Escherichia Coli Is Triggered by Carbon Catabolite Repression of Acetyl-CoA Synthetase. BMC Syst. Biol. 2010, 4, 166. [Google Scholar] [CrossRef] [Green Version]
  26. Valentine, D.L. Adaptations to Energy Stress Dictate the Ecology and Evolution of the Archaea. Nat. Rev. Microbiol. 2007, 5, 316–323. [Google Scholar] [CrossRef] [PubMed]
  27. Brock, T.D.; Brock, K.M.; Belly, R.T.; Weiss, R.L. Sulfolobus: A New Genus of Sulfur-Oxidizing Bacteria Living at Low PH and High Temperature. Arch. Mikrobiol. 1972, 84, 54–68. [Google Scholar] [CrossRef] [PubMed]
  28. Granata, V.; Graziano, G.; Ruggiero, A.; Raimo, G.; Masullo, M.; Arcari, P.; Vitagliano, L.; Zagari, A. Stability against Temperature of Sulfolobus Solfataricus Elongation Factor 1α, a Multi-Domain Protein. Biochim. Biophys. Acta (Bba) Proteins Proteom. 2008, 1784, 573–581. [Google Scholar] [CrossRef] [PubMed]
  29. Korz, D.J.; Rinas, U.; Hellmuth, K.; Sanders, E.A.; Deckwer, W.-D. Simple Fed-Batch Technique for High Cell Density Cultivation of Escherichia Coli. J. Biotechnol. 1995, 39, 59–65. [Google Scholar] [CrossRef]
  30. Shiloach, J.; Fass, R. Growing E. Coli to High Cell Density—A Historical Perspective on Method Development. Biotechnol. Adv. 2005, 23, 345–357. [Google Scholar] [CrossRef] [PubMed]
  31. Singh, R.; Tevatia, R.; White, D.; Demirel, Y.; Blum, P. Comparative Kinetic Modeling of Growth and Molecular Hydrogen Overproduction by Engineered Strains of Thermotoga Maritima. Int. J. Hydrog. Energy 2019, 44, 7125–7136. [Google Scholar] [CrossRef] [Green Version]
  32. Pirt, S.J. The Maintenance Energy of Bacteria in Growing Cultures. Proc. R. Soc. Lond. Ser. B Biol. Sci. 1965, 163, 224–231. [Google Scholar]
  33. Vetter, A.M.; Helmecke, J.; Schomburg, D.; Neumann-Schaal, M. The Impact of Pyroglutamate: Sulfolobus Acidocaldarius Has a Growth Advantage over Saccharolobus Solfataricus in Glutamate-Containing Media. Archaea 2019, 2019, 3208051. [Google Scholar] [CrossRef] [Green Version]
  34. Koerdt, A.; Gödeke, J.; Berger, J.; Thormann, K.M.; Albers, S.-V. Crenarchaeal Biofilm Formation under Extreme Conditions. PLoS ONE 2010, 5, e14104. [Google Scholar] [CrossRef]
  35. Albers, S.-V.; Koning, S.; Konings, W.; Driessen, A. Insights into ABC Transport in Archaea. J. Bioenerg. Biomembr. 2004, 36, 5–15. [Google Scholar] [CrossRef] [PubMed] [Green Version]
  36. Wagner, M.; Shen, L.; Albersmeier, A.; van der Kolk, N.; Kim, S.; Cha, J.; Bräsen, C.; Kalinowski, J.; Siebers, B.; Albers, S.-V. Sulfolobus Acidocaldarius Transports Pentoses via a Carbohydrate Uptake Transporter 2 (CUT2)-Type ABC Transporter and Metabolizes Them through the Aldolase-Independent Weimberg Pathway. Appl. Environ. Microbiol. 2018, 84. [Google Scholar] [CrossRef] [PubMed] [Green Version]
  37. Cooper, G.M. Transport of Small Molecules. In The Cell: A Molecular Approach, 2nd ed.; Sinauer Associates: Sunderland, MA, USA, 2000. [Google Scholar]
  38. McCarthy, S.; Johnson, T.; Pavlik, B.L.; Payne, S.; Schackwitz, W.; Martin, J.; Lipzen, A.; Keffeler, E.; Blum, P. Expanding the Limits of Thermoacidophily in the Archaeon Sulfolobus Solfataricus by Adaptive Evolution. Appl. Environ. Microbiol. 2016, 82. [Google Scholar] [CrossRef] [PubMed] [Green Version]
Figure 1. Relative cell density [%] of Sulfolobus acidocaldarius in response to different pH values (2.0–4.0) in a chemostat cultivation at 75 °C and a set dilution rate of 0.03 h−1. Error bars indicate the standard deviation of cell density between sampling points after reaching steady state.
Ijerph 18 05532 g001
Figure 2. Specific uptake rates for L-glutamate (qMSG) and D-glucose (qGlc) and specific production rate of trehalose (qTre) in dependence of the pH value. Error bars indicate the difference between the various sampling points after reaching steady state in the continuous cultivation.
Ijerph 18 05532 g002
Figure 3. C-balance, respiratory quotient (RQ), biomass yield (YX/S) and CO2 yield (YCO2/S) in dependence of the pH value. Error bars indicate the difference between the various sampling points after reaching steady state in the continuous cultivation. The RQ at pH 4.0 could not be calculated due to a malfunction of the O2 analyzer during the cultivation.
Ijerph 18 05532 g003
Figure 4. D-x graph: space time yield (D*x) and cell density (OD600), monosodium glutamate (MSG), D-glucose concentration (Glc) and trehalose (Tre) concentration in the supernatant as a function of the applied dilution rate (D). Error bars indicate the difference between the various sampling points after reaching steady state in the continuous cultivation.
Ijerph 18 05532 g004
Figure 5. Specific substrate uptake rates for L-glutamate (qMSG) and for D-glucose (qGlc) and specific production rates of trehalose (qTre) in dependence of the different applied dilution rates. The specific rates at the dilution rate of 0.084 h−1 are not depicted as this dilution rate yielded highly variable rates due to it lying too close to the point of washout. Error bars indicate the difference between the various sampling points after reaching steady state in the continuous cultivation.
Ijerph 18 05532 g005
Figure 6. Biomass yield (YX/S), C-balance, respiratory quotient (RQ), specific carbon dioxide production rate (qCO2) and specific oxygen consumption rate (qO2) at each dilution rate. Error bars indicate the difference between the various sampling points after reaching steady state in the continuous cultivation.
Ijerph 18 05532 g006
Table 1. Experimental plan of this study: chemostat cultivations with a dilution rate (D) of 0.03 h−1 were performed at 5 different pH values. The following set of experiments where the dilution rate was varied from 0.010 h−1 to 0.097 h−1 was then performed at the prior determined pH optimum of 3.0.
Fixed ParameterVariable Parameter
D0.03 h−1pH2.0, 2.5, 3.0, 3.5, 4.0
pH3.0D0.010 h−1, 0.021 h−1, 0.032 h−1, 0.043 h−1, 0.053 h−1, 0.064 h−1, 0.074 h−1, 0.084 h−1, 0.097 h−1
Table 2. Affinity constants (KS) and maximum growth rates (µmax) for D-glucose and monosodium glutamate, obtained by fitting the growth rates versus the substrates concentration in the supernatant to the Monod equation with SigmaPlot. With the obtained values, the optimal (Dopt) and critical dilution rate (Dcrit) were calculated.
ParametersD-GlucoseMonosodium Glutamate (MSG)
µmax [h−1]0.095 ± 0.0040.077 ± 0.003
KS [g/L]0.99 ± 0.130.15 ± 0.04
Dopt [h−1]0.0550.068
Dcrit [h−1]0.0780.077
Publisher’s Note: MDPI stays neutral with regard to jurisdictional claims in published maps and institutional affiliations.

