
Mapping the Burden of Hypertension in South Africa: A Comparative Analysis of the National 2012 SANHANES and the 2016 Demographic and Health Survey


 , ,
, ,
Abstract
1. Introduction
2. Materials and Methods
2.1. Study Population
2.2. Outcome Measure
2.3. Covariates
2.4. Statistical Analysis
3. Results
3.1. Descriptive Analyses
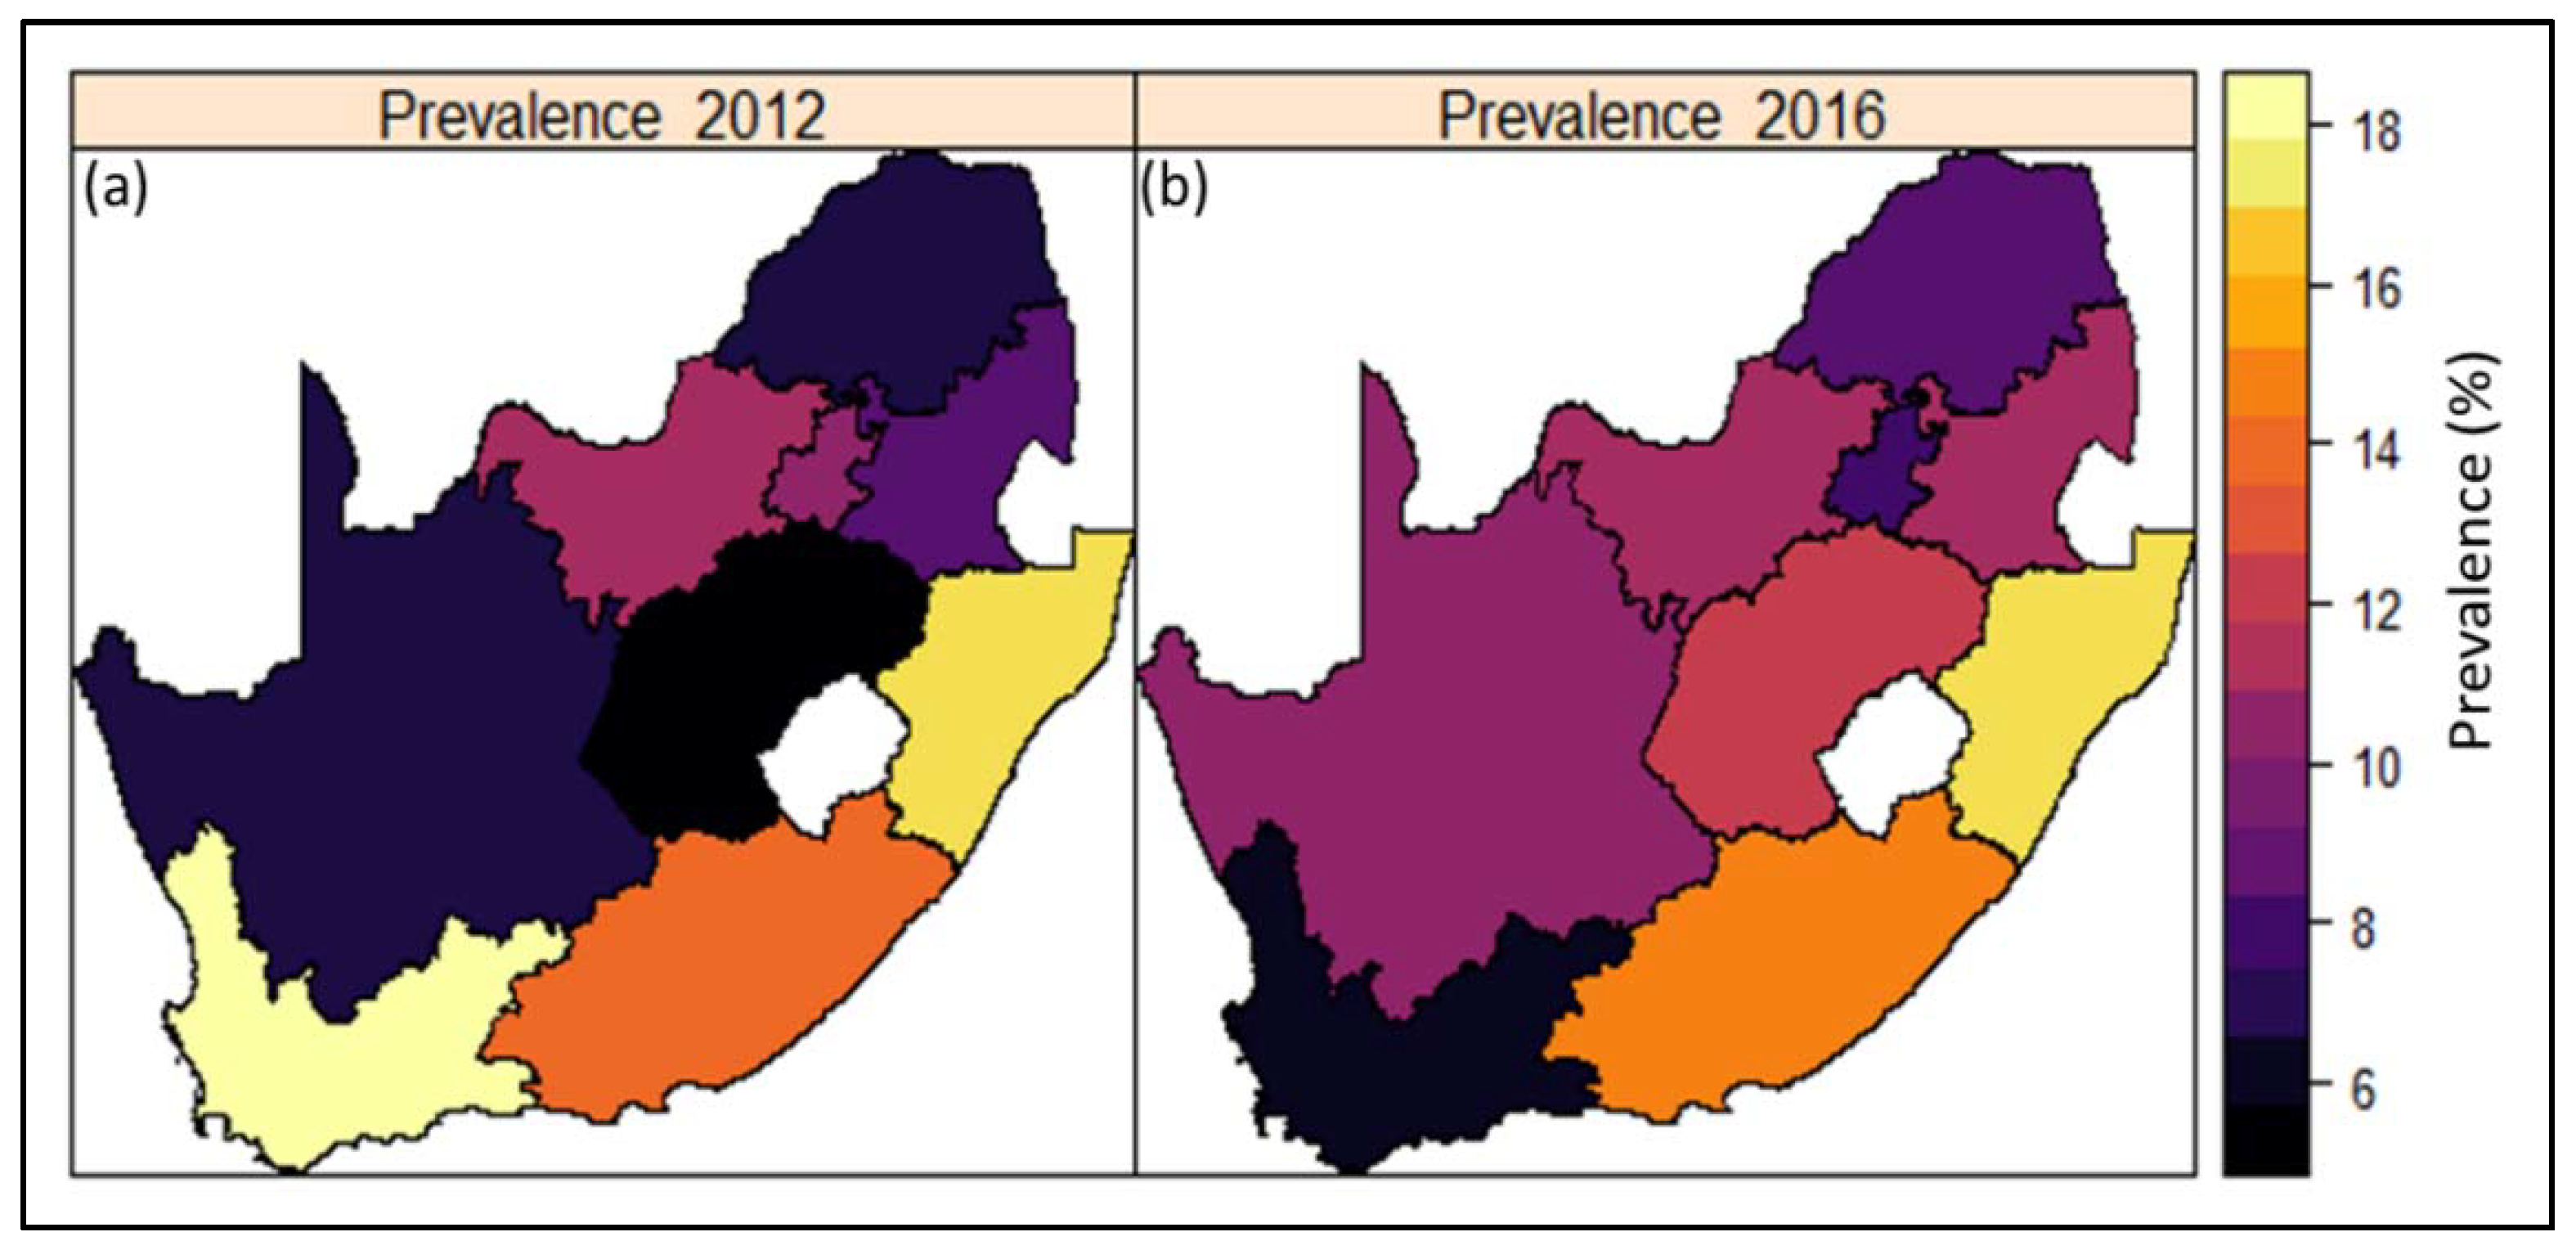
3.2. Geographic Variation in Hypertension
3.3. Bayesian Geo-Additive Regression Results
4. Discussion
5. Conclusions
Author Contributions
Funding
Institutional Review Board Statement
Informed Consent Statement
Data Availability Statement
Acknowledgments
Conflicts of Interest
References
- Salomon, J.A.; Murray, C.J.L. The Epidemiologic transition revisited: Compositional models for causes of death by age and sex. Popul. Dev. Rev. 2002, 28, 205–228. [Google Scholar] [CrossRef]
- Mathers, C.D.; Loncar, D. Projections of global mortality and burden of disease from 2002 to 2030. PLoS Med. 2006, 3, e442. [Google Scholar] [CrossRef] [PubMed]
- Gaziano, T.A. Reducing the growing burden of cardiovascular disease in the developing world. Health Aff. 2007, 26, 13–24. [Google Scholar] [CrossRef]
- World Health Organization Factsheet on Hypertension. Available online: https://www.who.int/news-room/fact-sheets/detail/hypertension (accessed on 25 September 2020).
- Bradshaw, D.; Nannan, N.; Groenewald, P.; Joubert, J.; Laubscher, R.; Nojilana, B.; Norman, R.; Pieterse, D.; Schneider, M. Provincial mortality in South Africa, 2000--priority-setting for now and a benchmark for the future. South Afr. Med, J. 2005, 95, 496–503. [Google Scholar]
- Shisana, O.; Labadarios, D.; Rehle, T.; Simbayi, L.; Zuma, K.; Dhansay, A.; Reddy, P.; Parker, W.; Hoosain, E.; Naidoo, P.; et al. South African National Health and Nutrition Examination Survey (SANHANES-1); HSRC Press: Cape Town, South Africa, 2014. [Google Scholar]
- National Department of Health (NDoH); Statistics South Africa (Stats SA); South African Medical Research Council (SAMRC); ICF. South Africa Demographic and Health Survey 2016: Key Indicator Report; NDoH: Port Moresby, Papua New Guinea; Stats SA: KwaDukuza, South Africa; SAMRC: Cape Town, South Africa; ICF: Lexington, KY, USA, 2017.
- Adeloye, D.; Basquill, C. Estimating the Prevalence and Awareness Rates of Hypertension in Africa: A Systematic Analysis. PLoS ONE 2014, 9, e104300. [Google Scholar] [CrossRef] [PubMed]
- Kandala, N.-B.; Tigbe, W.; Manda, S.O.; Stranges, S. Geographic Variation of Hypertension in Sub-Saharan Africa: A Case Study of South Africa. Am. J. Hypertens. 2013, 26, 382–391. [Google Scholar] [CrossRef] [PubMed]
- Barker, L.E.; Kirtland, K.A.; Gregg, E.W.; Geiss, L.S.; Thompson, T.J. Geographic Distribution of Diagnosed Diabetes in the U.S.: A Diabetes Belt. Am. J. Prev. Med. 2011, 40, 434–439. [Google Scholar] [CrossRef] [PubMed]
- Shrestha, S.; Kirtland, A.; Thompson, T.; Barker, L.; Gregg, E.; Geiss, L. Spatial clusters of county-level diagnosed diabetes and associated risk factors in the United States. Open Diabetes J. 2012, 5, 29–37. [Google Scholar] [CrossRef]
- Liu, L.; Núñez, A.E.; Yu, X.; Yin, X.; Eisen, H.J. Multilevel and Spatial–Time Trend Analyses of the Prevalence of Hypertension in a Large Urban City in the USA. J. Hered. 2013, 90, 1053–1063. [Google Scholar] [CrossRef] [PubMed]
- Kershaw, K.N.; Roux, A.V.D.; Carnethon, M.; Darwin, C.; Goff, D.C.; Post, W.; Schreiner, P.J.; Watson, K. Geographic Variation in Hypertension Prevalence Among Blacks and Whites: The Multi-Ethnic Study of Atherosclerosis. Am. J. Hypertens. 2010, 23, 46–53. [Google Scholar] [CrossRef]
- Pedigo, A.; Aldrich, T.; Odoi, A. Neighborhood disparities in stroke and myocardial infarction mortality: A GIS and spatial scan statistics approach. BMC Public Health 2011, 11, 644. [Google Scholar] [CrossRef]
- Stevens, C.D.; Schriger, D.L.; Raffetto, B.; Davis, A.C.; Zingmond, D.; Roby, D.H. Geographic Clustering of Diabetic Lower-Extremity Amputations in Low-Income Regions Of California. Health Aff. 2014, 33, 1383–1390. [Google Scholar] [CrossRef] [PubMed]
- Seedat, Y.K.; Rayner, B.L.; Veriava, Y. South African hypertension practice guideline 2014: Review article. Cardiovasc. J. Afr. 2014, 25, 288–294. [Google Scholar] [CrossRef] [PubMed]
- Kandala, N.-B.; Ghilagaber, G. A Geo-Additive Bayesian Discrete-Time Survival Model and its Application to Spatial Analysis of Childhood Mortality in Malawi. Qual. Quant. 2006, 40, 935–957. [Google Scholar] [CrossRef]
- Ibrahim, M.M.; Damasceno, A. Hypertension in developing countries. Lancet 2012, 380, 611–619. [Google Scholar] [CrossRef]
- Boateng, D.; Wekesah, F.; Browne, J.L.; Agyemang, C.; Agyei-Baffour, P.; Aikins, A.D.-G.; Smit, H.A.; Grobbee, D.E.; Klipstein-Grobusch, K. Knowledge and awareness of and perception towards cardiovascular disease risk in sub-Saharan Africa: A systematic review. PLoS ONE 2017, 12, e0189264. [Google Scholar] [CrossRef] [PubMed]
- Busari, O.A.; Olusegun, T.; Olufemi, O.; Desalu, O.; Opadijo, O.G.; Jimoh, A.K.; Agboola, S.M.; Busari, O.E.; Olalekan, O. Impact of patients’ knowledge, attitude and practices on hypertension on compliance with antihypertensive drugs in a resource-poor setting. TAF Prev. Med. Bull. 2010, 9, 87–92. [Google Scholar]
- Massyn, N.; Peer, N.; English, R.; Padarath, A.; Barron, P.; Day, C. (Eds.) District Health Barometer 2015/16. Health Systems Trust: Durban. 2016. Available online: https://www.hst.org.za/publications/District%20Health%20Barometers/District%20Health%20Barometer%202015_16.pdf (accessed on 12 December 2020).
- Goldstein, H. Multilevel Statistical Models, 1st ed.; John Wiley & Sons, Inc.: Hoboken, NJ, USA, 1999; Available online: http://multilevel.ioe.ac.uk/index.html (accessed on 1 December 2020).
- Nnanatu, C.C.; Atilola, G.; Komba, P.; Mavatikua, L.; Moore, Z.; Matanda, D.; Obianwu, O.; Kandala, N.-B. Evaluating changes in the prevalence of female genital mutilation/cutting among 0–14 years old girls in Nigeria using data from multiple surveys: A novel Bayesian hierarchical spatio-temporal model. PLoS ONE 2021, 16, e0246661. [Google Scholar] [CrossRef]
- Langford, I.H.; Leyland, A.H.; Rasbash, J.; Goldstein, H. Multilevel modelling of the geographical distributions of diseases. J. R. Stat. Soc. Ser. C Appl. Stat. 1999, 48, 253–268. [Google Scholar] [CrossRef] [PubMed]
- Borgoni, R.; Billardi, F.C. Bayesian spatial analysis of demographic survey data: An application to contraceptive use at first sexual intercourse. Demogr. Res. 2003, 8, 61–92. [Google Scholar] [CrossRef]
- Lachenbruch, P.A.; Rabe-Hesketh, S.; Everitt, B. A Handbook of Statistical Analyses Using Stata. Am. Stat. 2000, 54, 153. [Google Scholar] [CrossRef]
- Bolstad, M.W.; Manda, O.S. Investigating Child Mortality in Malawi Using Family and Community Random Effects: A Bayesian Analysis. J. Am. Stat. Assoc. 2001, 96, 12–19. [Google Scholar] [CrossRef]


| DHS 2016 | SANHANES 2012 | |||||
|---|---|---|---|---|---|---|
| % Hypertensive: 48.2% (n = 8230) | % Hypertensive: 38.4% (n = 6867) | |||||
| Variable | Normotensive (n = 4227) | Hypertensive (n = 4003) | p-Value 1 | Normotensive (n = 3827) | Hypertensive (n = 3040) | p-Value 1 |
| Total | 4227 (100) | 4003 (100) | ||||
| Mean age (S.E) | 31.6 (0.28) | 47.9 (0.53) | <0.001 | 30.5 (0.35) | 46.8 (0.73) | <0.001 |
| Sex (%) | ||||||
| Male | 1719 (40.7) | 1527 (37.8) | 1367 (44.2) | 991 (41) | ||
| Female | 2508 (59.3) | 2476 (62.2) | 0.04 | 2460 (55.8) | 2048 (59) | 0.128 |
| Ethnicity (%) | ||||||
| Black/African | 3793 (89.9) | 3335 (83) | 2765 (80.8) | 2005 (73.5) | ||
| White | 98 (3) | 201 (6.6) | 60 (5.9) | 71 (11) | ||
| Coloured | 284 (5.3) | 414 (8.5) | 829 (9.8) | 774 (12.6) | ||
| Indian/Asian | 51 (1.8) | 50 (2) | <0.001 | 162 (3.4) | 181 (3) | 0.021 |
| Education (%) | ||||||
| No education | 195 (4.3) | 561 (12.3) | 187 (4.7) | 412 (9.2) | ||
| Primary education | 701 (14.6) | 960 (22.7) | 614 (15.3) | 782 (22.4) | ||
| Secondary education | 2975 (72.1) | 2123 (55.9) | 2317 (71.8) | 1217 (56.8) | ||
| Higher education | 324 (9) | 314 (9.1) | <0.001 | 176 (8.3) | 145 (11.6) | <0.001 |
| Place of residence (%) | ||||||
| Urban | 2090 (61.1) | 2229 (65) | 2263 (60) | 1860 (64.7) | ||
| Rural | 2137 (38.9) | 1774 (35) | 0.037 | 1564 (40) | 1180 (35.3) | 0.029 |
| Wealth index | ||||||
| Poorest | 957 (21.2) | 814 (19.8) | 764 (22.1) | 550 (19.6) | ||
| Poorer | 995 (21.7) | 808 (18.1) | 632 (20.6) | 496 (17.9) | ||
| Middle | 1025 (22) | 907 (21.1) | 698 (22) | 525 (19.5) | ||
| Richer | 760 (18.9) | 858 (20.4) | 677 (20.5) | 569 (21.8) | ||
| Richest | 490 (16.1) | 616 (20.6) | 0.002 | 395 (14.8) | 344 (21.2) | 0.003 |
| Body Mass Index (kg/m2) (%) | ||||||
| <25 kg/m2 | 2385 (56) | 1478 (35.5) | 2169 (58.7) | 1052 (37.6) | ||
| 25–29.9 kg/m2 | 974 (23.6) | 997 (26.1) | 770 (21.4) | 698 (24.2) | ||
| ≥30 kg/m2 | 824 (20.4) | 1457 (38.4) | <0.001 | 754 (19.9) | 1134 (38.3) | <0.001 |
| Waist circumference (tertile) (%) | ||||||
| 1 (lowest) | 1840 (43.9) | 841 (21.2) | 1554 (42.9) | 583 (20.3) | ||
| 2 (middle) | 1419 (35) | 1258 (31.4) | 1291 (34.8) | 974 (35.1) | ||
| 3 (highest) | 885 (21.1) | 1829 (47.3) | <0.001 | 835 (22.4) | 1337 (44.6) | <0.001 |
| Smoking status (%) | ||||||
| Noncurrent smoker | 3439 (80.9) | 3208 (80.6) | 2809 (83.5) | 2218 (79.4) | ||
| Current smoker | 788 (19.1) | 795 (19.4) | 0.829 | 619 (16.5) | 568 (20.6) | 0.058 |
| Drinking status (past 12 months) (%) | ||||||
| Noncurrent drinker | 340 (17) | 323 (20.2) | 2616 (74.1) | 2157 (71.4) | ||
| Current drinker | 1394 (83) | 1199 (79.8) | 0.095 | 796 (25.9) | 629 (28.6) | 0.236 |
| Diabetes (%) | ||||||
| No | 4152 (98.5) | 3669 (91.8) | 3327 (98.1) | 2350 (86.9) | ||
| Yes | 60 (1.5) | 314 (8.2) | <0.001 | 76 (1.9) | 411 (13.1) | <0.001 |
| High blood cholesterol (%) | ||||||
| No | 4172 (99) | 3783 (93.5) | 3246 (98.3) | 2452 (88.5) | ||
| Yes | 36 (1) | 195 (6.5) | <0.001 | 49 (1.7) | 238 (11.5) | <0.001 |
| Heart attack or angina (%) | ||||||
| No | 4134 (98) | 3764 (94.6) | 3333 (96.6) | 2532 (92.5) | ||
| Yes | 83 (2) | 227 (5.4) | <0.001 | 101 (3.4) | 248 (7.5) | <0.001 |
| Stroke (%) | ||||||
| No | 4186 (99.5) | 3903 (97.6) | 3398 (99.2) | 2641 (95) | ||
| Yes | 29 (0.5) | 92 (2.4) | <0.001 | 30 (0.8) | 152 (5) | <0.001 |
| Region of residence (province) | ||||||
| Western Cape | 204 (7.4) | 244 (10.4) | 621 (11.9) | 549 (15.4) | ||
| Eastern Cape | 569 (12.5) | 593 (14.4) | 534 (12.8) | 436 (12.9) | ||
| Northern cape | 323 (2) | 407 (2.5) | 238 (2.5) | 209 (2.2) | ||
| Free state | 401 (5.2) | 464 (6.3) | 191 (3.5) | 177 (3.5) | ||
| Kwazulu-Natal | 553 (16.1) | 710 (21.9) | 570 (19.9) | 507 (20.8) | ||
| Northwest | 530 (9.2) | 439 (6.9) | 327 (5.4) | 337 (6.5) | ||
| Gauteng | 391 (26) | 328 (22.3) | 440 (22.1) | 329 (25.1) | ||
| Mpumalanga | 534 (8.5) | 465 (8.3) | 518 (9) | 292 (6.1) | ||
| Limpopo | 722 (13.1) | 353 (6.9) | <0.001 | 388 (12.9) | 204 (7.5) | 0.001 |
| DHS 2016 | SANHANES 2012 | |||
|---|---|---|---|---|
| POR | POR | |||
| Variable | Unadjusted Mean (95% CI) DIC = 11,849.05 | Adjusted Mean (95% CI) DIC = 3586.07 | Unadjusted Mean (95% CI) DIC = 9248.18 | Adjusted Mean (95% CI) DIC = 2580.84 |
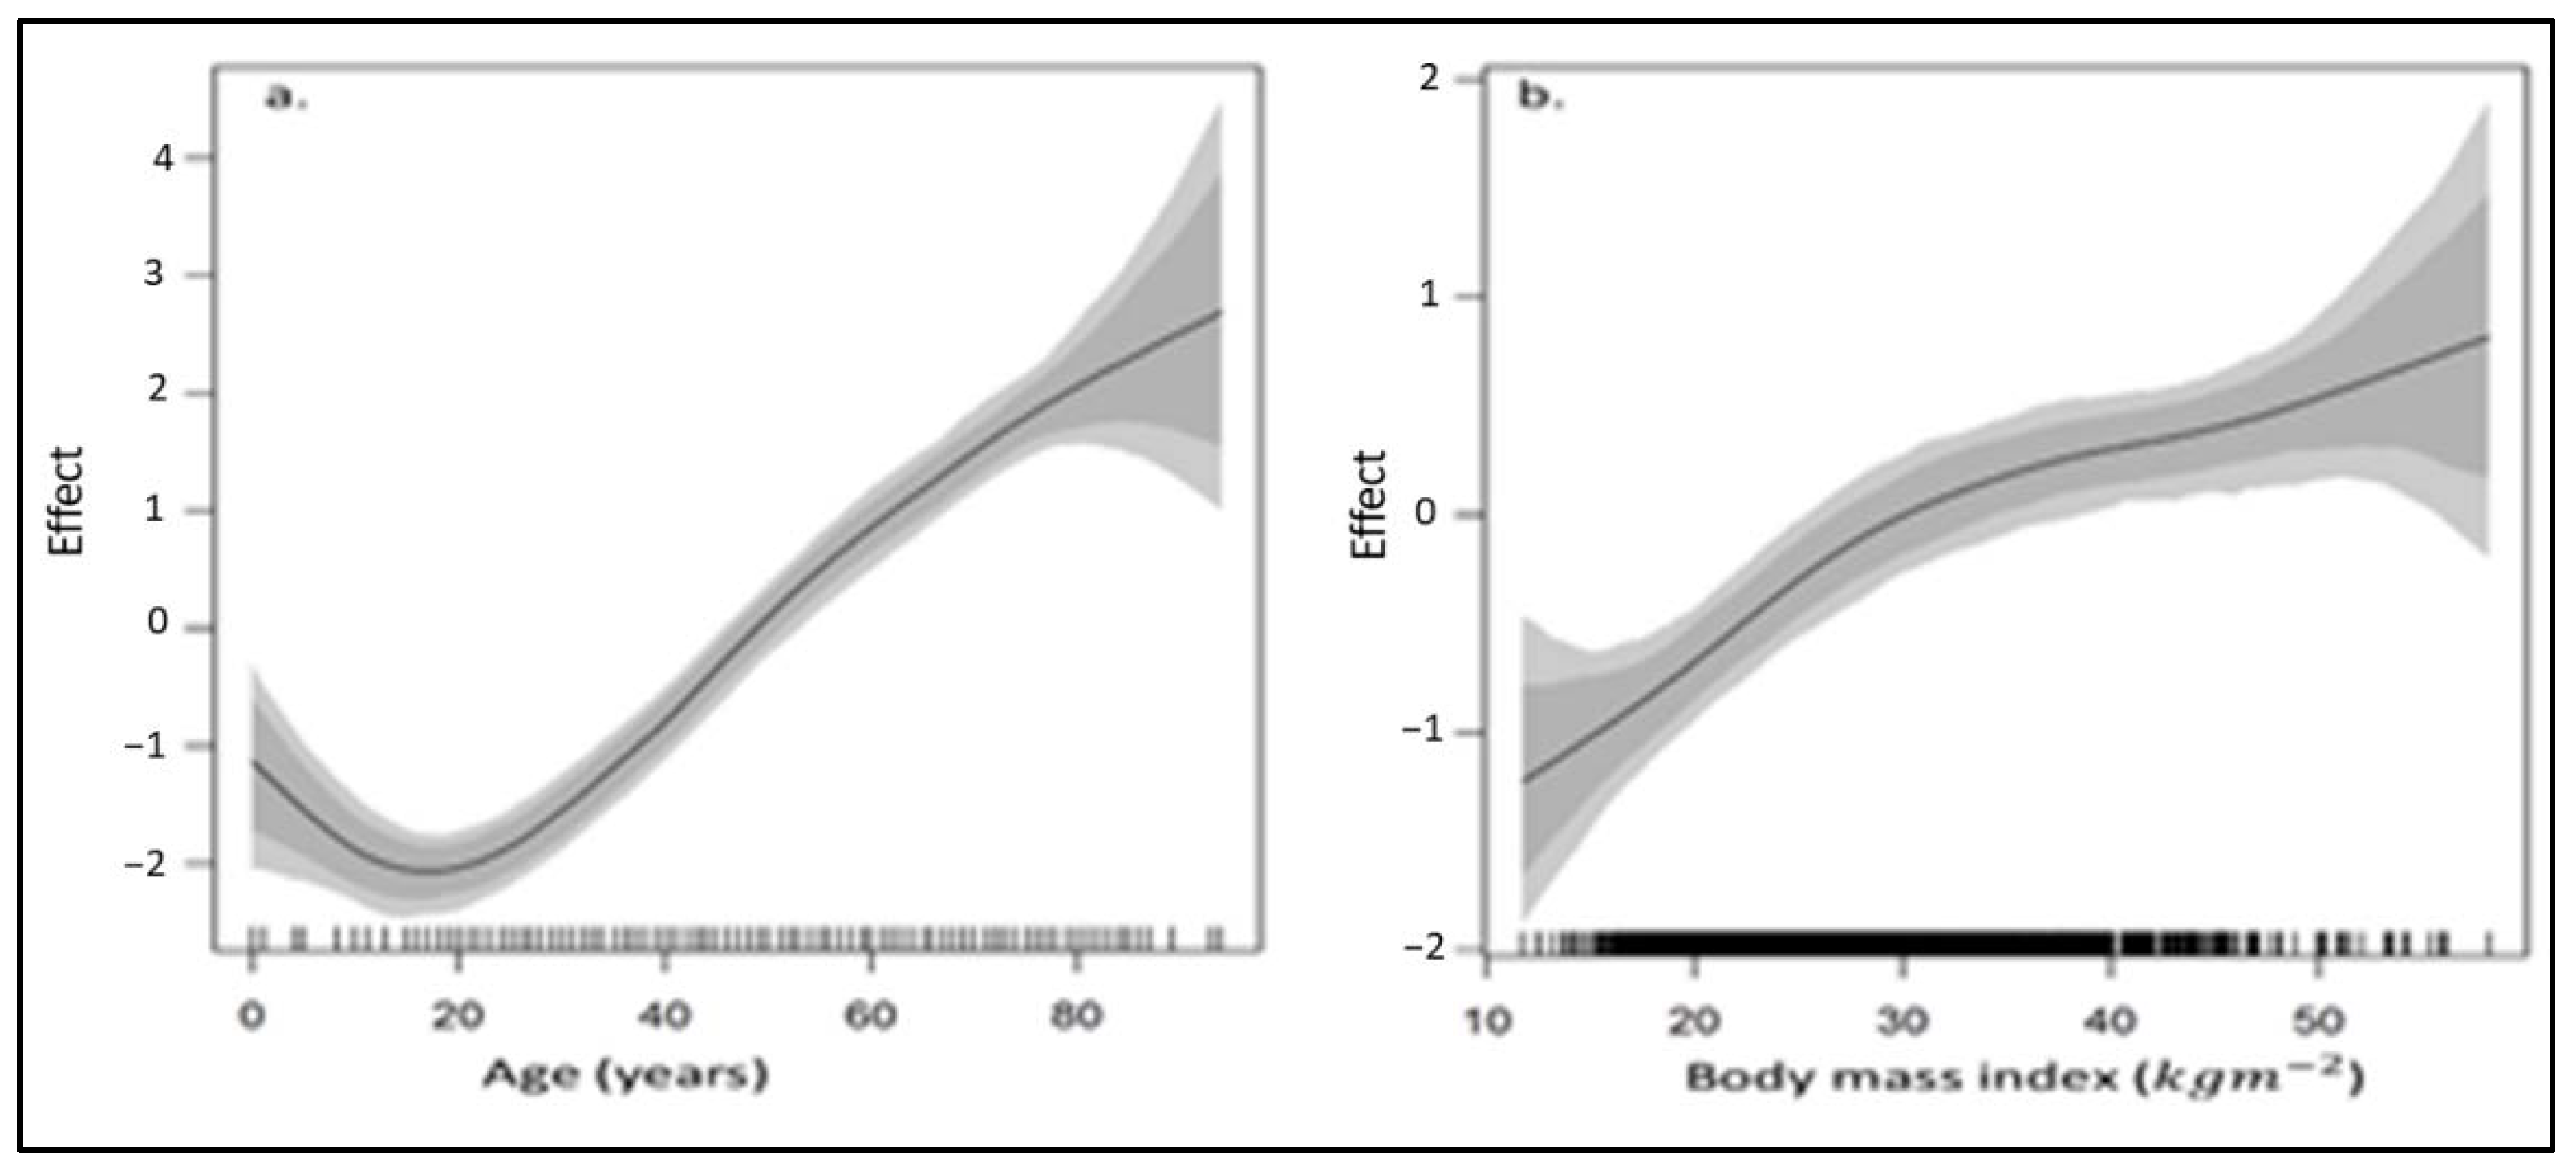
| Age | See graph (Figure 5) | See graph (Figure 6) | ||
| Sex | ||||
| Male | 1.289 (1.071, 1.569) | 1.279 (1.036, 1.563) | 1.264 (1.027, 1.560) | 1.317 (1.069, 1.625) |
| Female (ref) | 1.000 | 1.000 | 1.000 | 1.000 |
| Ethnicity | ||||
| Black/African (ref) | 1.000 | 1.000 | 1.000 | 1.000 |
| White | 1.201 (0.789, 1.728) | 1.136 (0.742, 1.716) | 0.746 (0.363, 1.442) | 0.683 (0.348, 1.323) |
| Coloured | 1.703 (1.206, 2.428) | 1.672 (1.216, 2.412) | 1.305 (0.984, 1.748) | 1.278 (0.962, 1.694) |
| Indian/Asian | 0.630 (0.251, 1.615) | 0.675 (0.263, 1.753) | 0.705 (0.423, 1.174) | 0.776 (0.484, 1.211) |
| Education | ||||
| No education | 1.235 (0.797, 1.962) | 1.312 (0.846, 2.022) | 8.917 (0.726, 747.901) | 9.241 (0.817, 328.448) |
| Primary education | 1.198 (0.849, 1.695) | 1.236 (0.879, 1.772) | 0.939 (0.603, 1.408) | 0.944 (0.611, 1.409) |
| Secondary education | 1.186 (0.906, 1.582) | 1.196 (0.886, 1.637) | 0.998 (0.679, 1.527) | 1.014 (0.671, 1.496) |
| Higher education (ref) | 1.000 | 1.000 | 1.000 | 1.000 |
| Place of residence | ||||
| Urban | 1.217 (1.005, 1.485) | 1.229 (1.016, 1.475) | 0.991 (0.789, 1.239) | 0.986 (0.786, 1.226) |
| Rural (ref) | 1.000 | 1.000 | 1.000 | 1.000 |
| Body Mass Index (kg/m2) | See graph Figure 5 | See graph (Figure 6) | ||
| <25 kg/m2 (ref) | 1.000 | |||
| 25–29.9 kg/m2 | 1.002 (0.780, 1.268) | 1.595 (1.236, 2.035) | ||
| ≥30 kg/m2 | 1.200 (0.883, 1.691) | 2.067 (1.568, 2.693) | ||
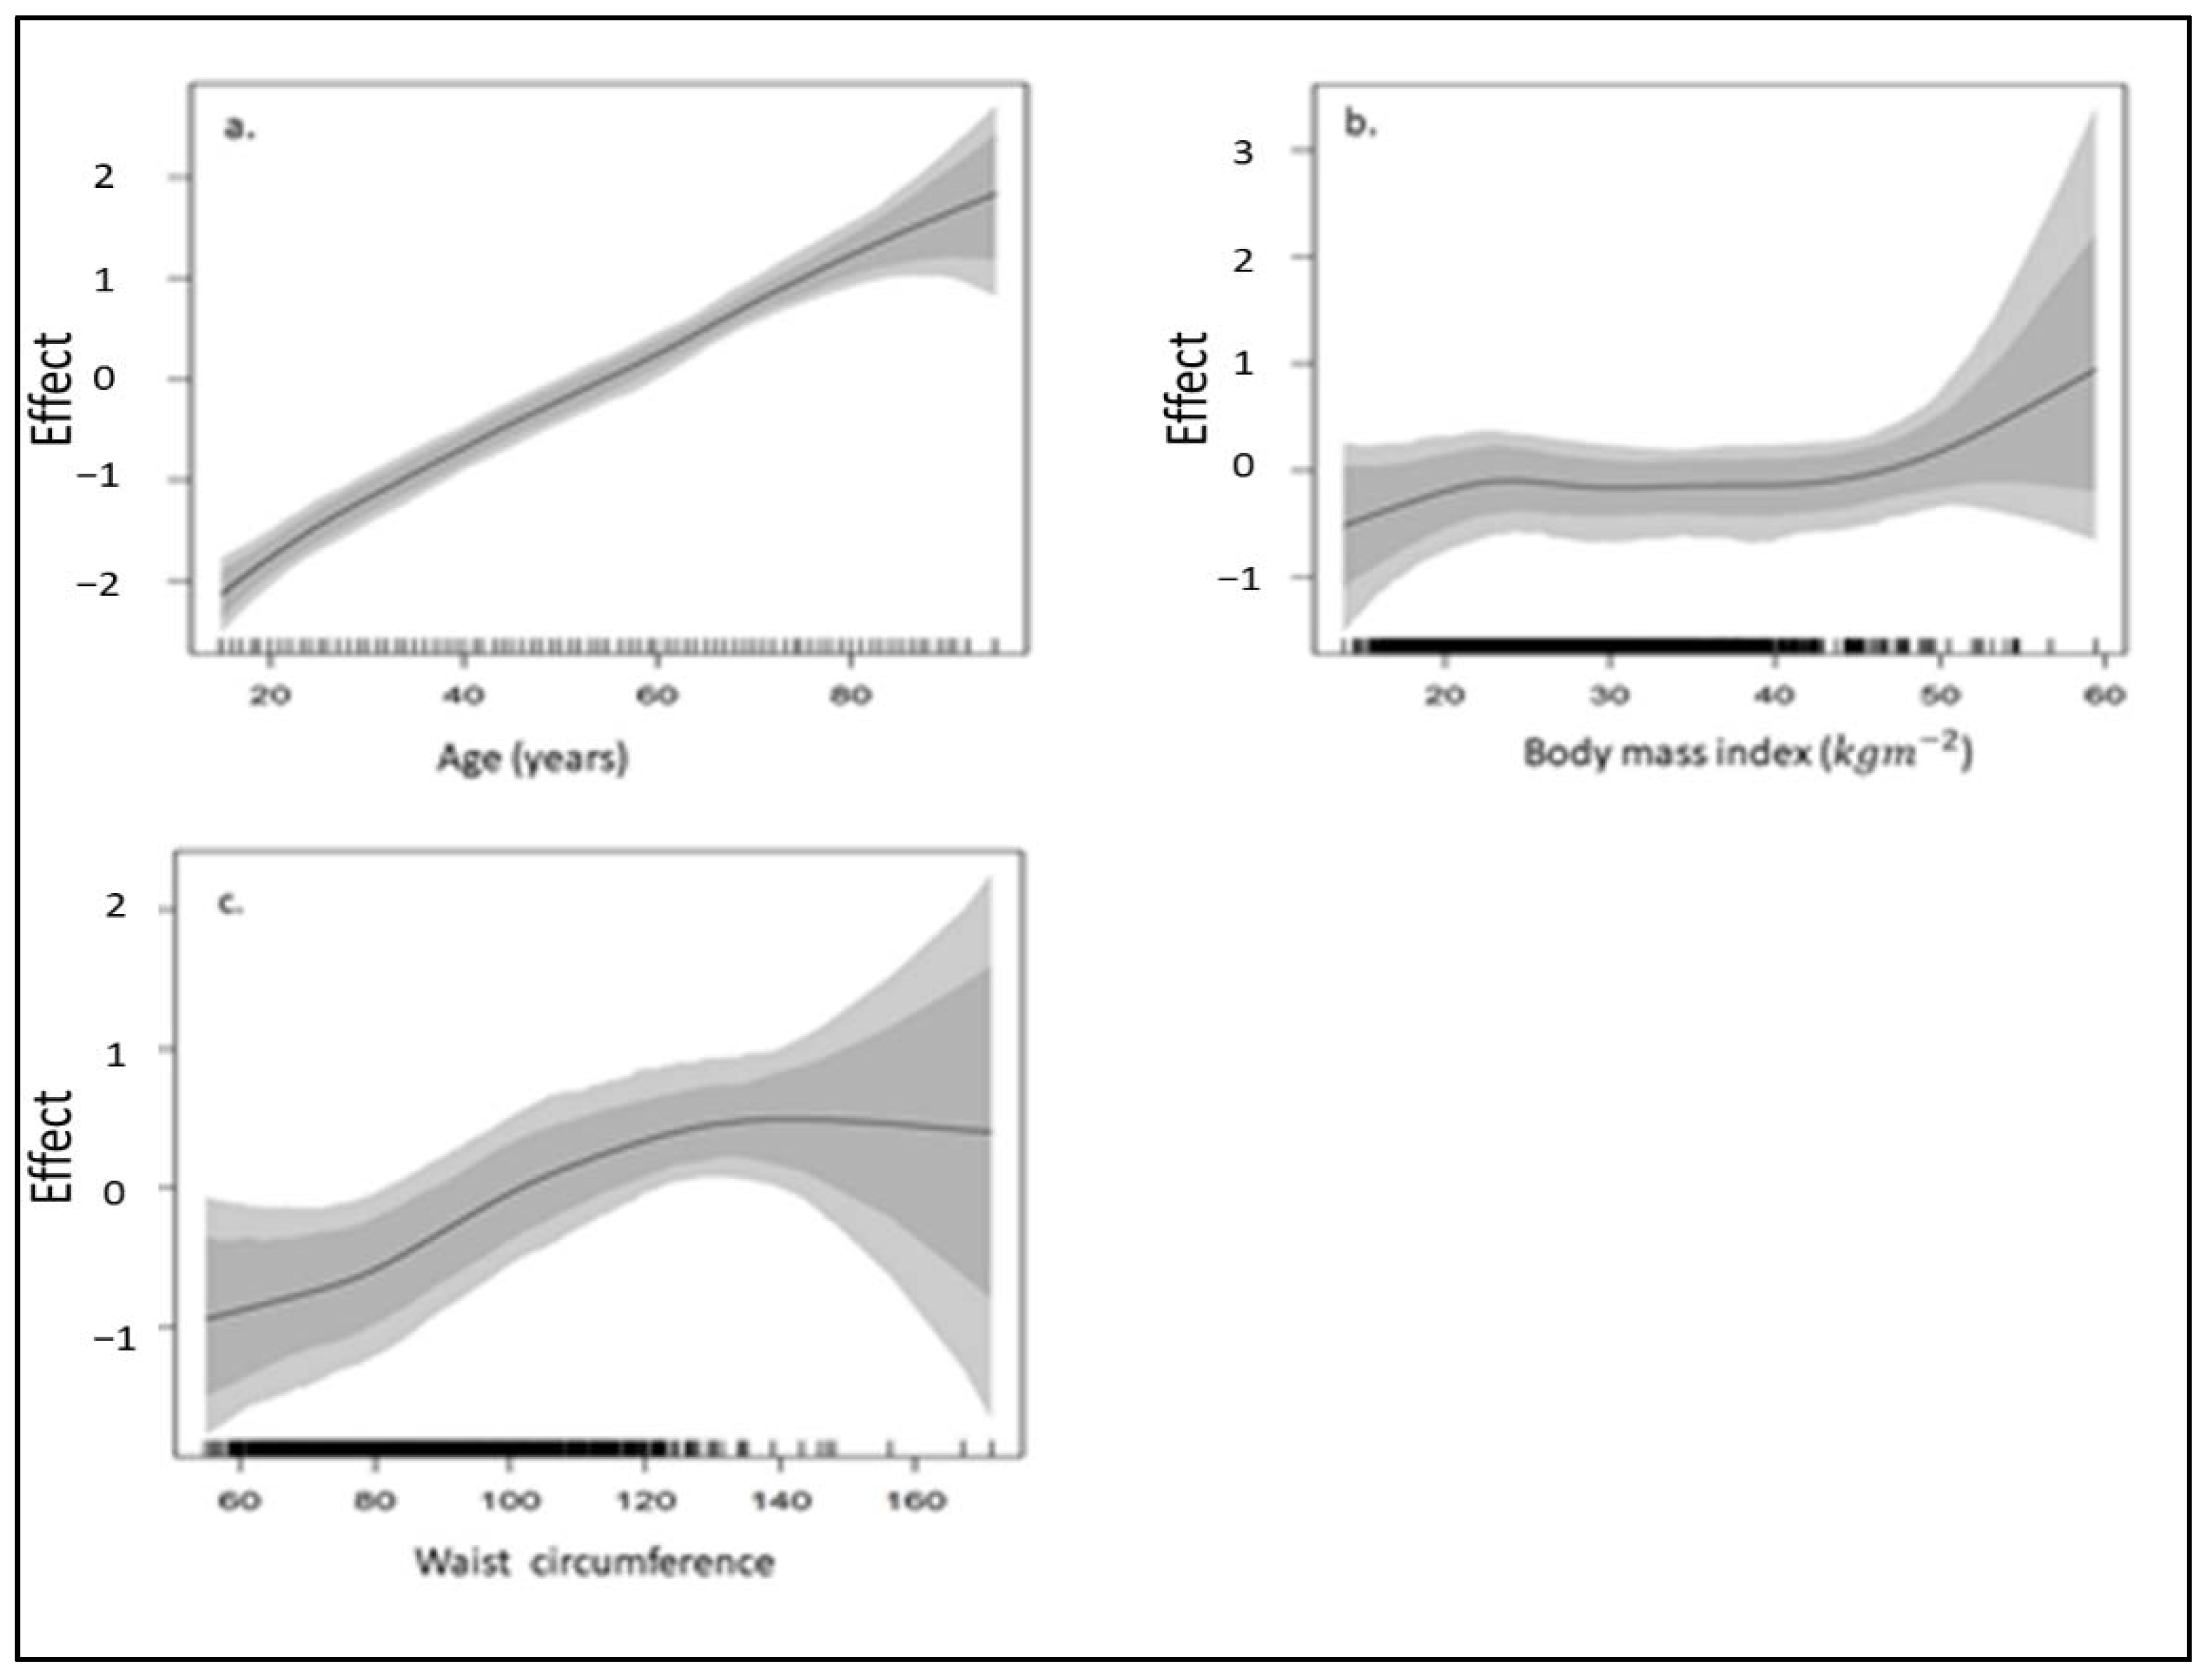
| Waist circumference (tertile) | See graph (Figure 5) | |||
| 1 (lowest) (ref) | 1.000 | 1.000 | ||
| 2 (middle) | 1.190 (0.973, 1.466) | |||
| 3 (highest) | 1.807 (1.314, 2.485) | |||
| Smoking status | ||||
| Noncurrent smoker (ref) | 1.000 | 1.000 | 1.000 | 1.000 |
| Current smoker | 1.022 (0.845, 1.232) | 1.059 (0.887, 1.279) | 1.128 (0.879, 1.447) | 1.134 (0.878, 1.461) |
| Drinking status (past 12 months) | ||||
| Noncurrent drinker (ref) | 1.000 | 1.000 | 1.000 | 1.000 |
| Current drinker | 1.148 (0.909, 1.415) | 1.148 (0.936, 1.420) | ||
| Diabetes/High sugar | ||||
| No (ref) | 1.000 | 1.000 | 1.000 | 1.000 |
| Yes | 1.407 (0.827, 2.409) | 1.309 (0.790, 2.287) | 2.097 (1.523, 2.861) | 2.066 (1.503, 2.894) |
| High blood cholesterol | ||||
| No (ref) | 1.000 | 1.000 | 1.000 | 1.000 |
| Yes | 2.113 (1.118, 4.063) | 2.017 (1.104, 4.054) | 1.650 (1.331, 2.040) | 1.634 (1.270, 2.025) |
| Heart attack or angina | ||||
| No (ref) | 1.000 | 1.000 | 1.000 | 1.000 |
| Yes | 1.202 (0.761, 2.060) | 1.198 (0.740, 1.899) | 1.121 (0.737, 1.720) | 1.226 (0.768, 1.882) |
| Stroke | ||||
| No (ref) | 1.000 | 1.000 | 1.000 | 1.000 |
| Yes | 1.021 (0.467, 2.141) | 1.070 (0.513, 2.242) | 1.739 (0.932, 3.587) | 1.744 (0.925, 3.295) |
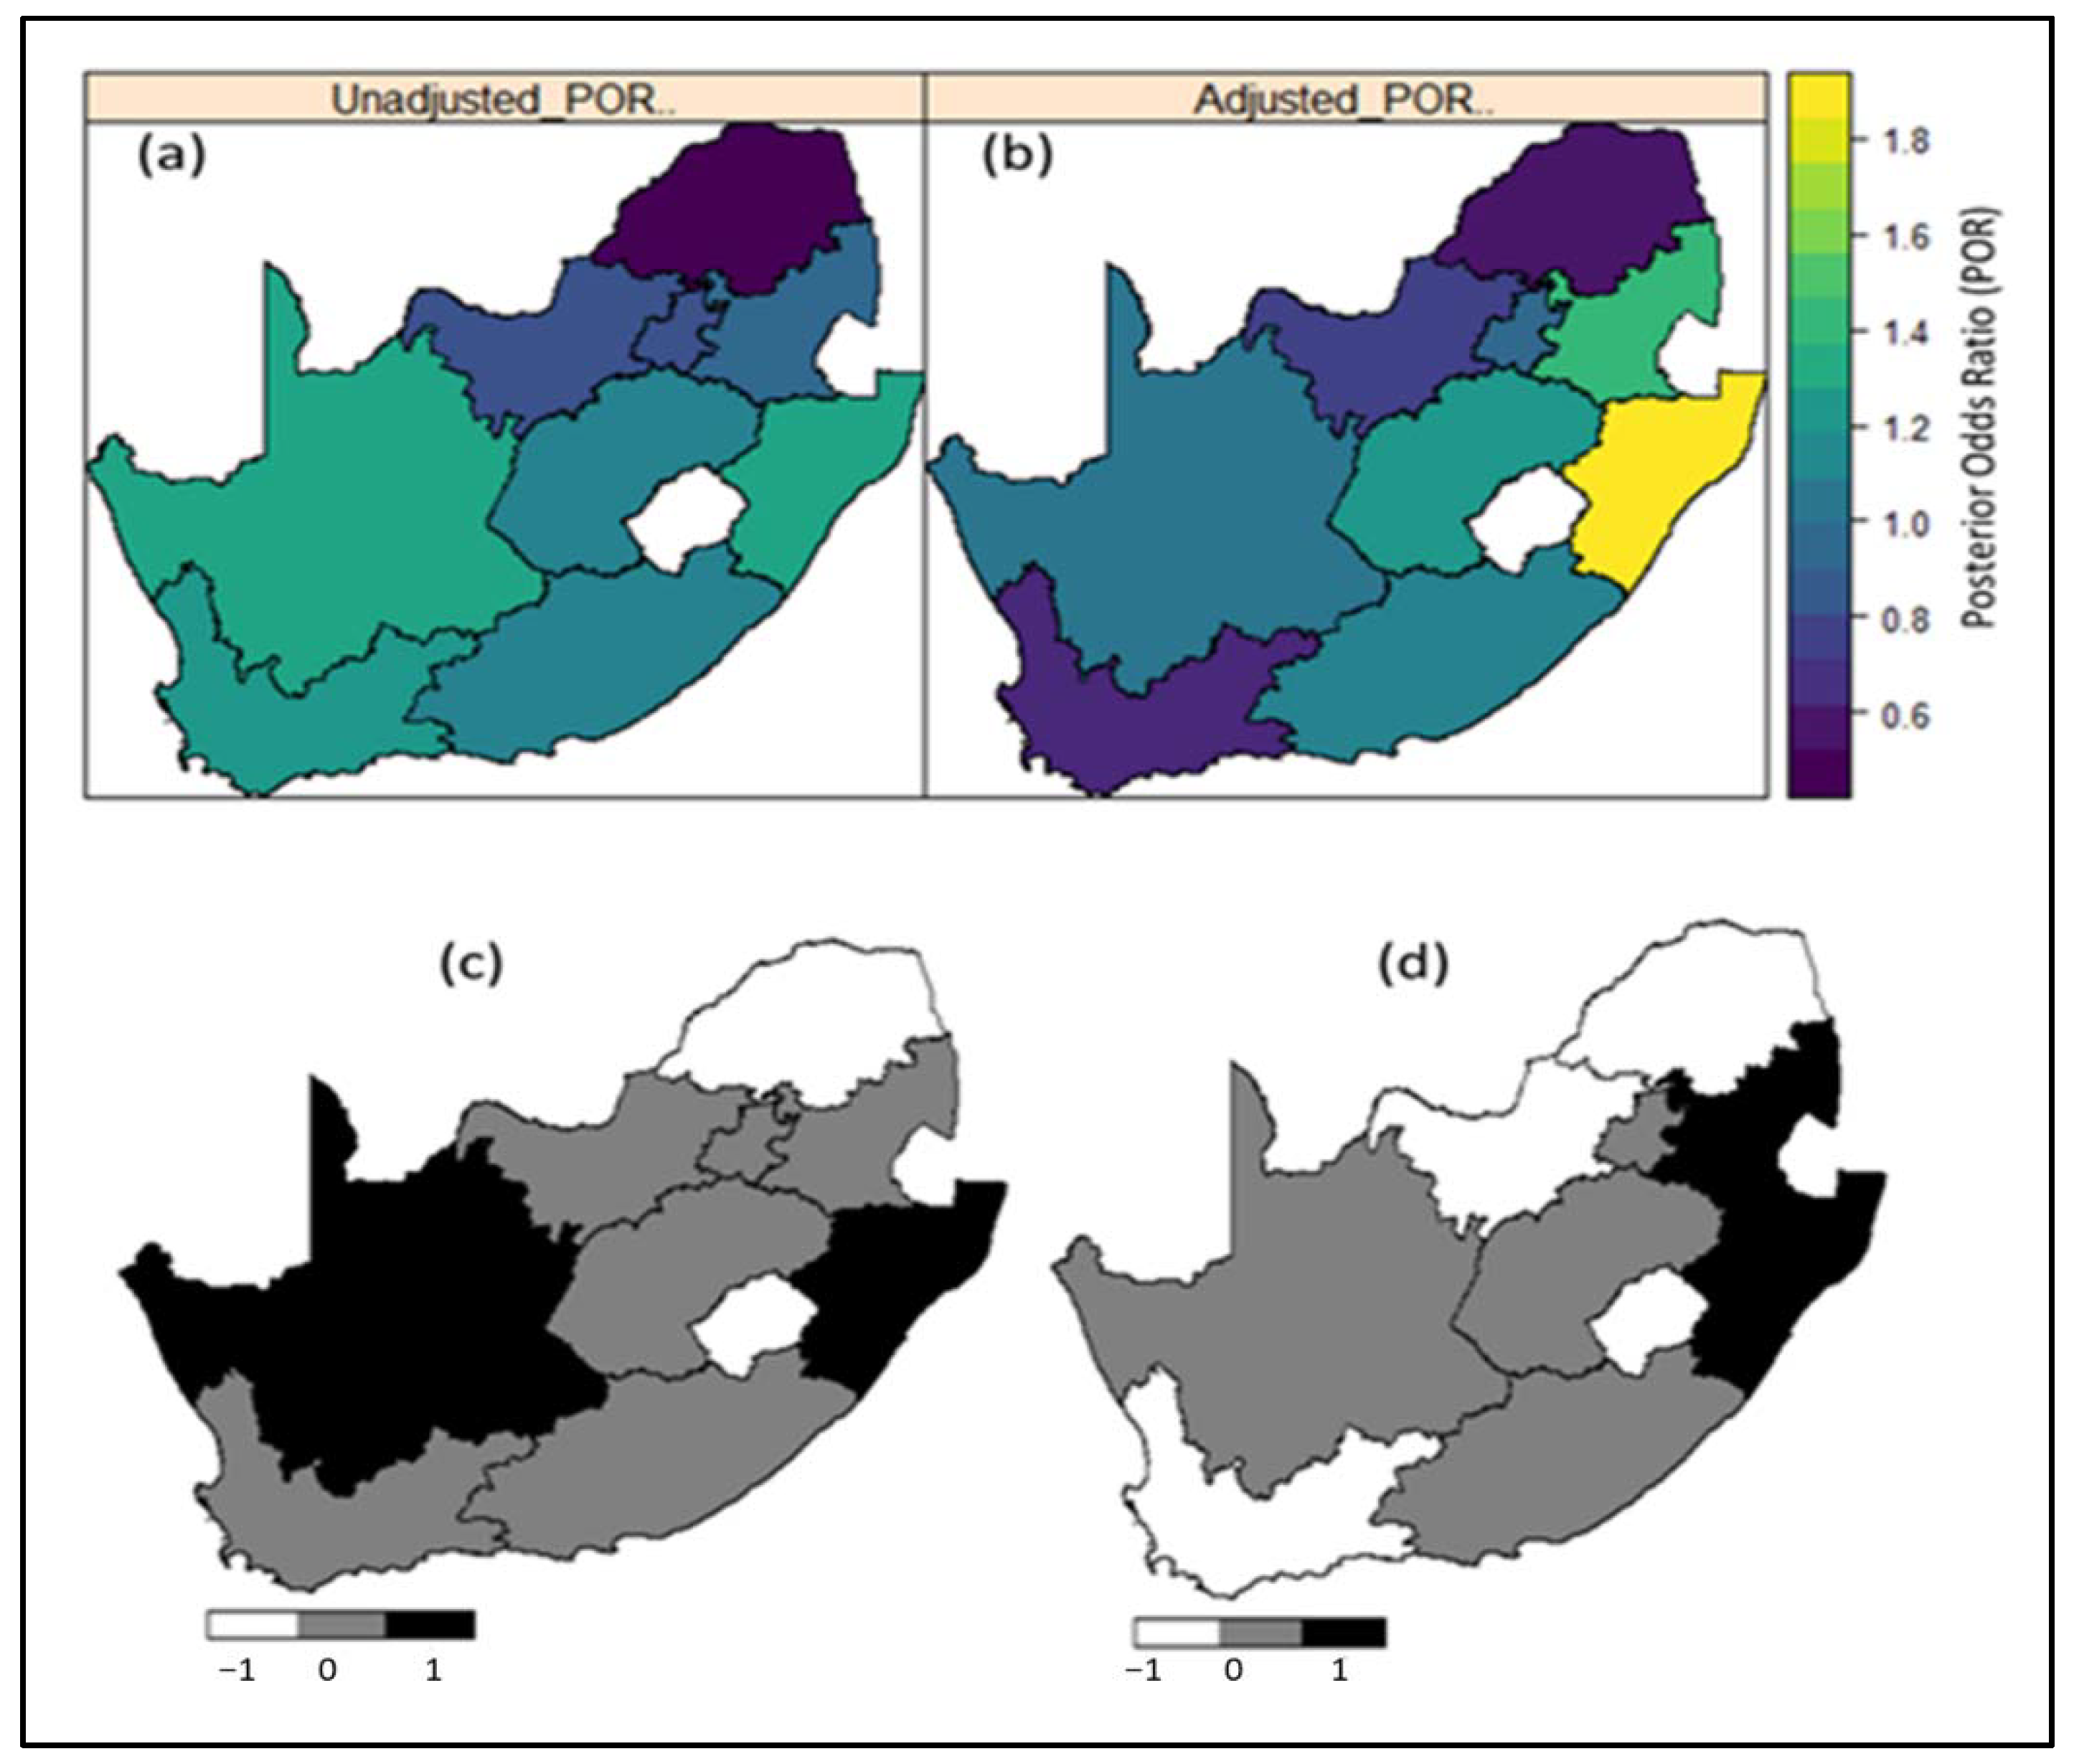
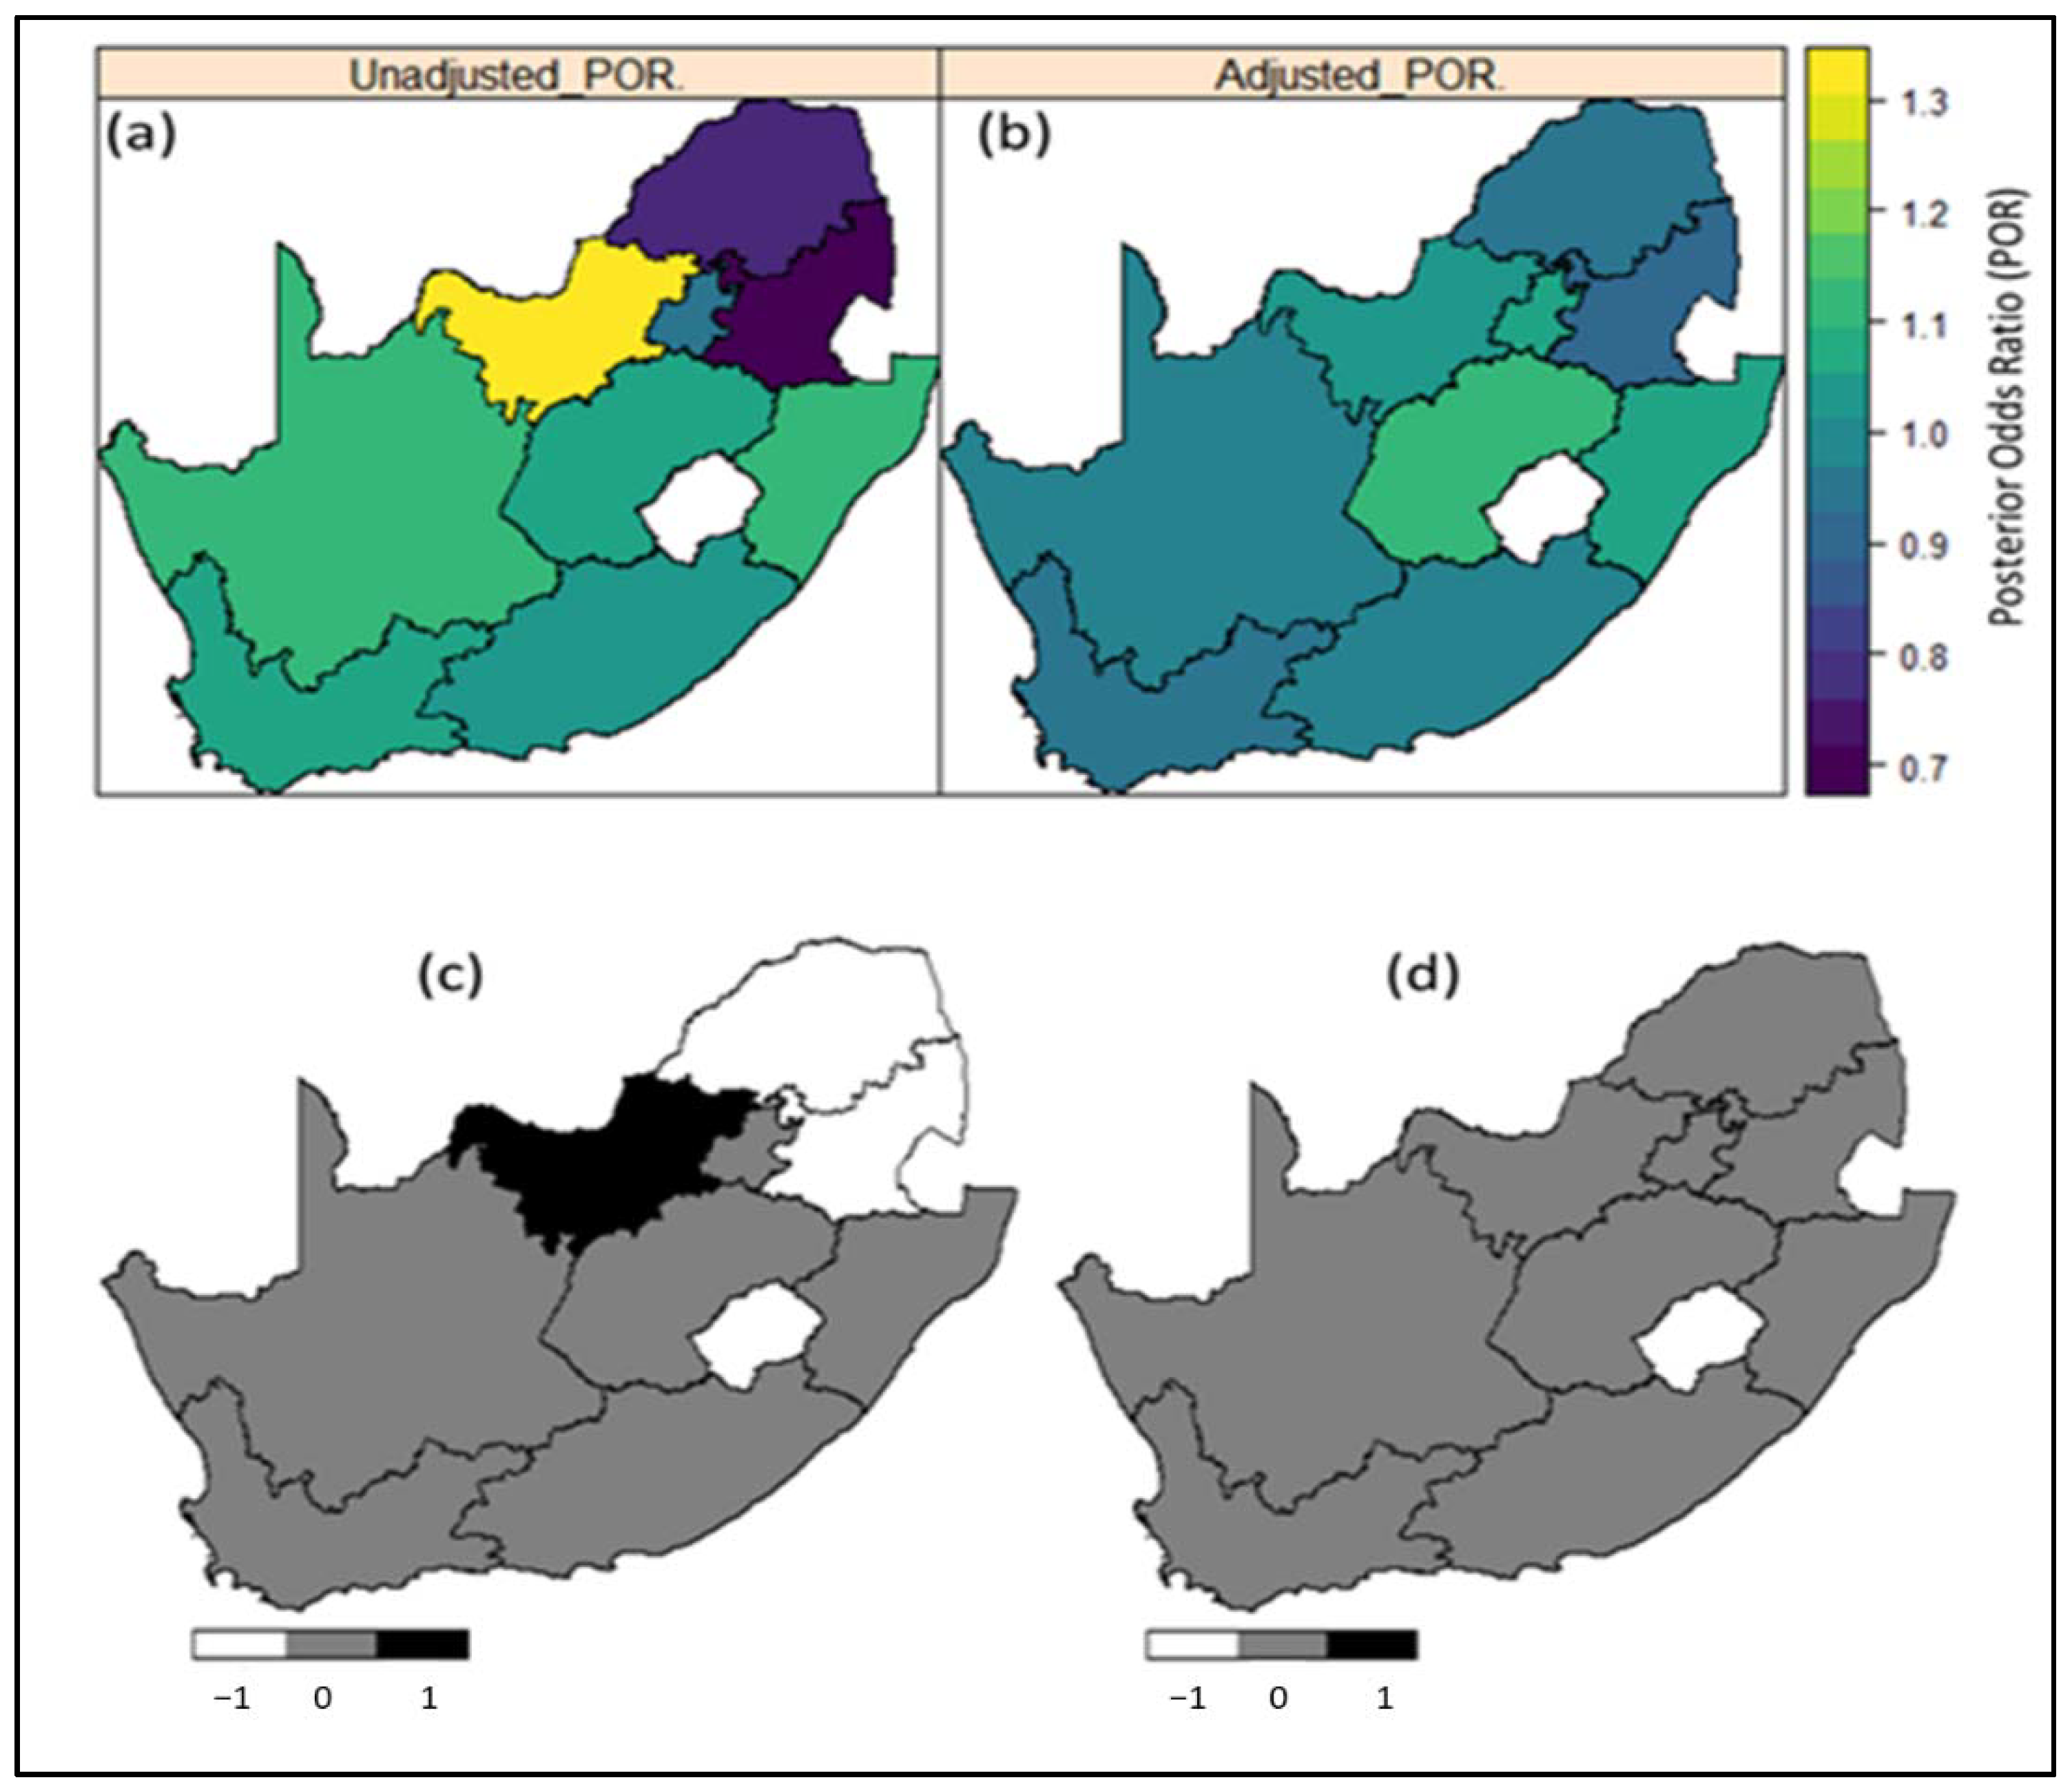
| Region of residence (province) | See maps (Figure 3) | See maps (Figure 4) | ||
| Western cape | 1.212 (0.723, 2.011) | 1.086 (0.623, 2.108) | ||
| Eastern cape | 2.078 (1.473, 2.928) | 1.283 (0.753, 2.373) | ||
| Northern cape | 1.942 (1.333, 2.947) | 1.269 (0.689, 2.596) | ||
| Free state | 2.351 (1.591, 3.511) | 1.900 (1.040, 3.944) | ||
| KwaZulu-Natal | 3.621 (2.495, 5.318) | 1.547 (0.842, 3.028) | ||
| Northwest | 1.241 (0.890, 1.761) | 1.547 (0.852, 3.047) | ||
| Gauteng | 1.688 (1.182, 2.445) | 1.624 (0.884, 3.340) | ||
| Mpumalanga | 2.623 (1.818, 3.699) | 0.826 (0.433, 1.580) | ||
| Limpopo (Ref) | 1.00 | 1.00 | ||
Publisher’s Note: MDPI stays neutral with regard to jurisdictional claims in published maps and institutional affiliations. |
© 2021 by the authors. Licensee MDPI, Basel, Switzerland. This article is an open access article distributed under the terms and conditions of the Creative Commons Attribution (CC BY) license (https://creativecommons.org/licenses/by/4.0/).
Share and Cite
Kandala, N.-B.; Nnanatu, C.C.; Dukhi, N.; Sewpaul, R.; Davids, A.; Reddy, S.P. Mapping the Burden of Hypertension in South Africa: A Comparative Analysis of the National 2012 SANHANES and the 2016 Demographic and Health Survey. Int. J. Environ. Res. Public Health 2021, 18, 5445. https://doi.org/10.3390/ijerph18105445
Kandala N-B, Nnanatu CC, Dukhi N, Sewpaul R, Davids A, Reddy SP. Mapping the Burden of Hypertension in South Africa: A Comparative Analysis of the National 2012 SANHANES and the 2016 Demographic and Health Survey. International Journal of Environmental Research and Public Health. 2021; 18(10):5445. https://doi.org/10.3390/ijerph18105445
Chicago/Turabian StyleKandala, Ngianga-Bakwin, Chibuzor Christopher Nnanatu, Natisha Dukhi, Ronel Sewpaul, Adlai Davids, and Sasiragha Priscilla Reddy. 2021. "Mapping the Burden of Hypertension in South Africa: A Comparative Analysis of the National 2012 SANHANES and the 2016 Demographic and Health Survey" International Journal of Environmental Research and Public Health 18, no. 10: 5445. https://doi.org/10.3390/ijerph18105445
APA StyleKandala, N.-B., Nnanatu, C. C., Dukhi, N., Sewpaul, R., Davids, A., & Reddy, S. P. (2021). Mapping the Burden of Hypertension in South Africa: A Comparative Analysis of the National 2012 SANHANES and the 2016 Demographic and Health Survey. International Journal of Environmental Research and Public Health, 18(10), 5445. https://doi.org/10.3390/ijerph18105445