Evaluating the Effects of Holidays on Road Crash Injuries in the United Kingdom

 ,
,  ,
, 
Abstract
1. Introduction
2. Materials and Methods
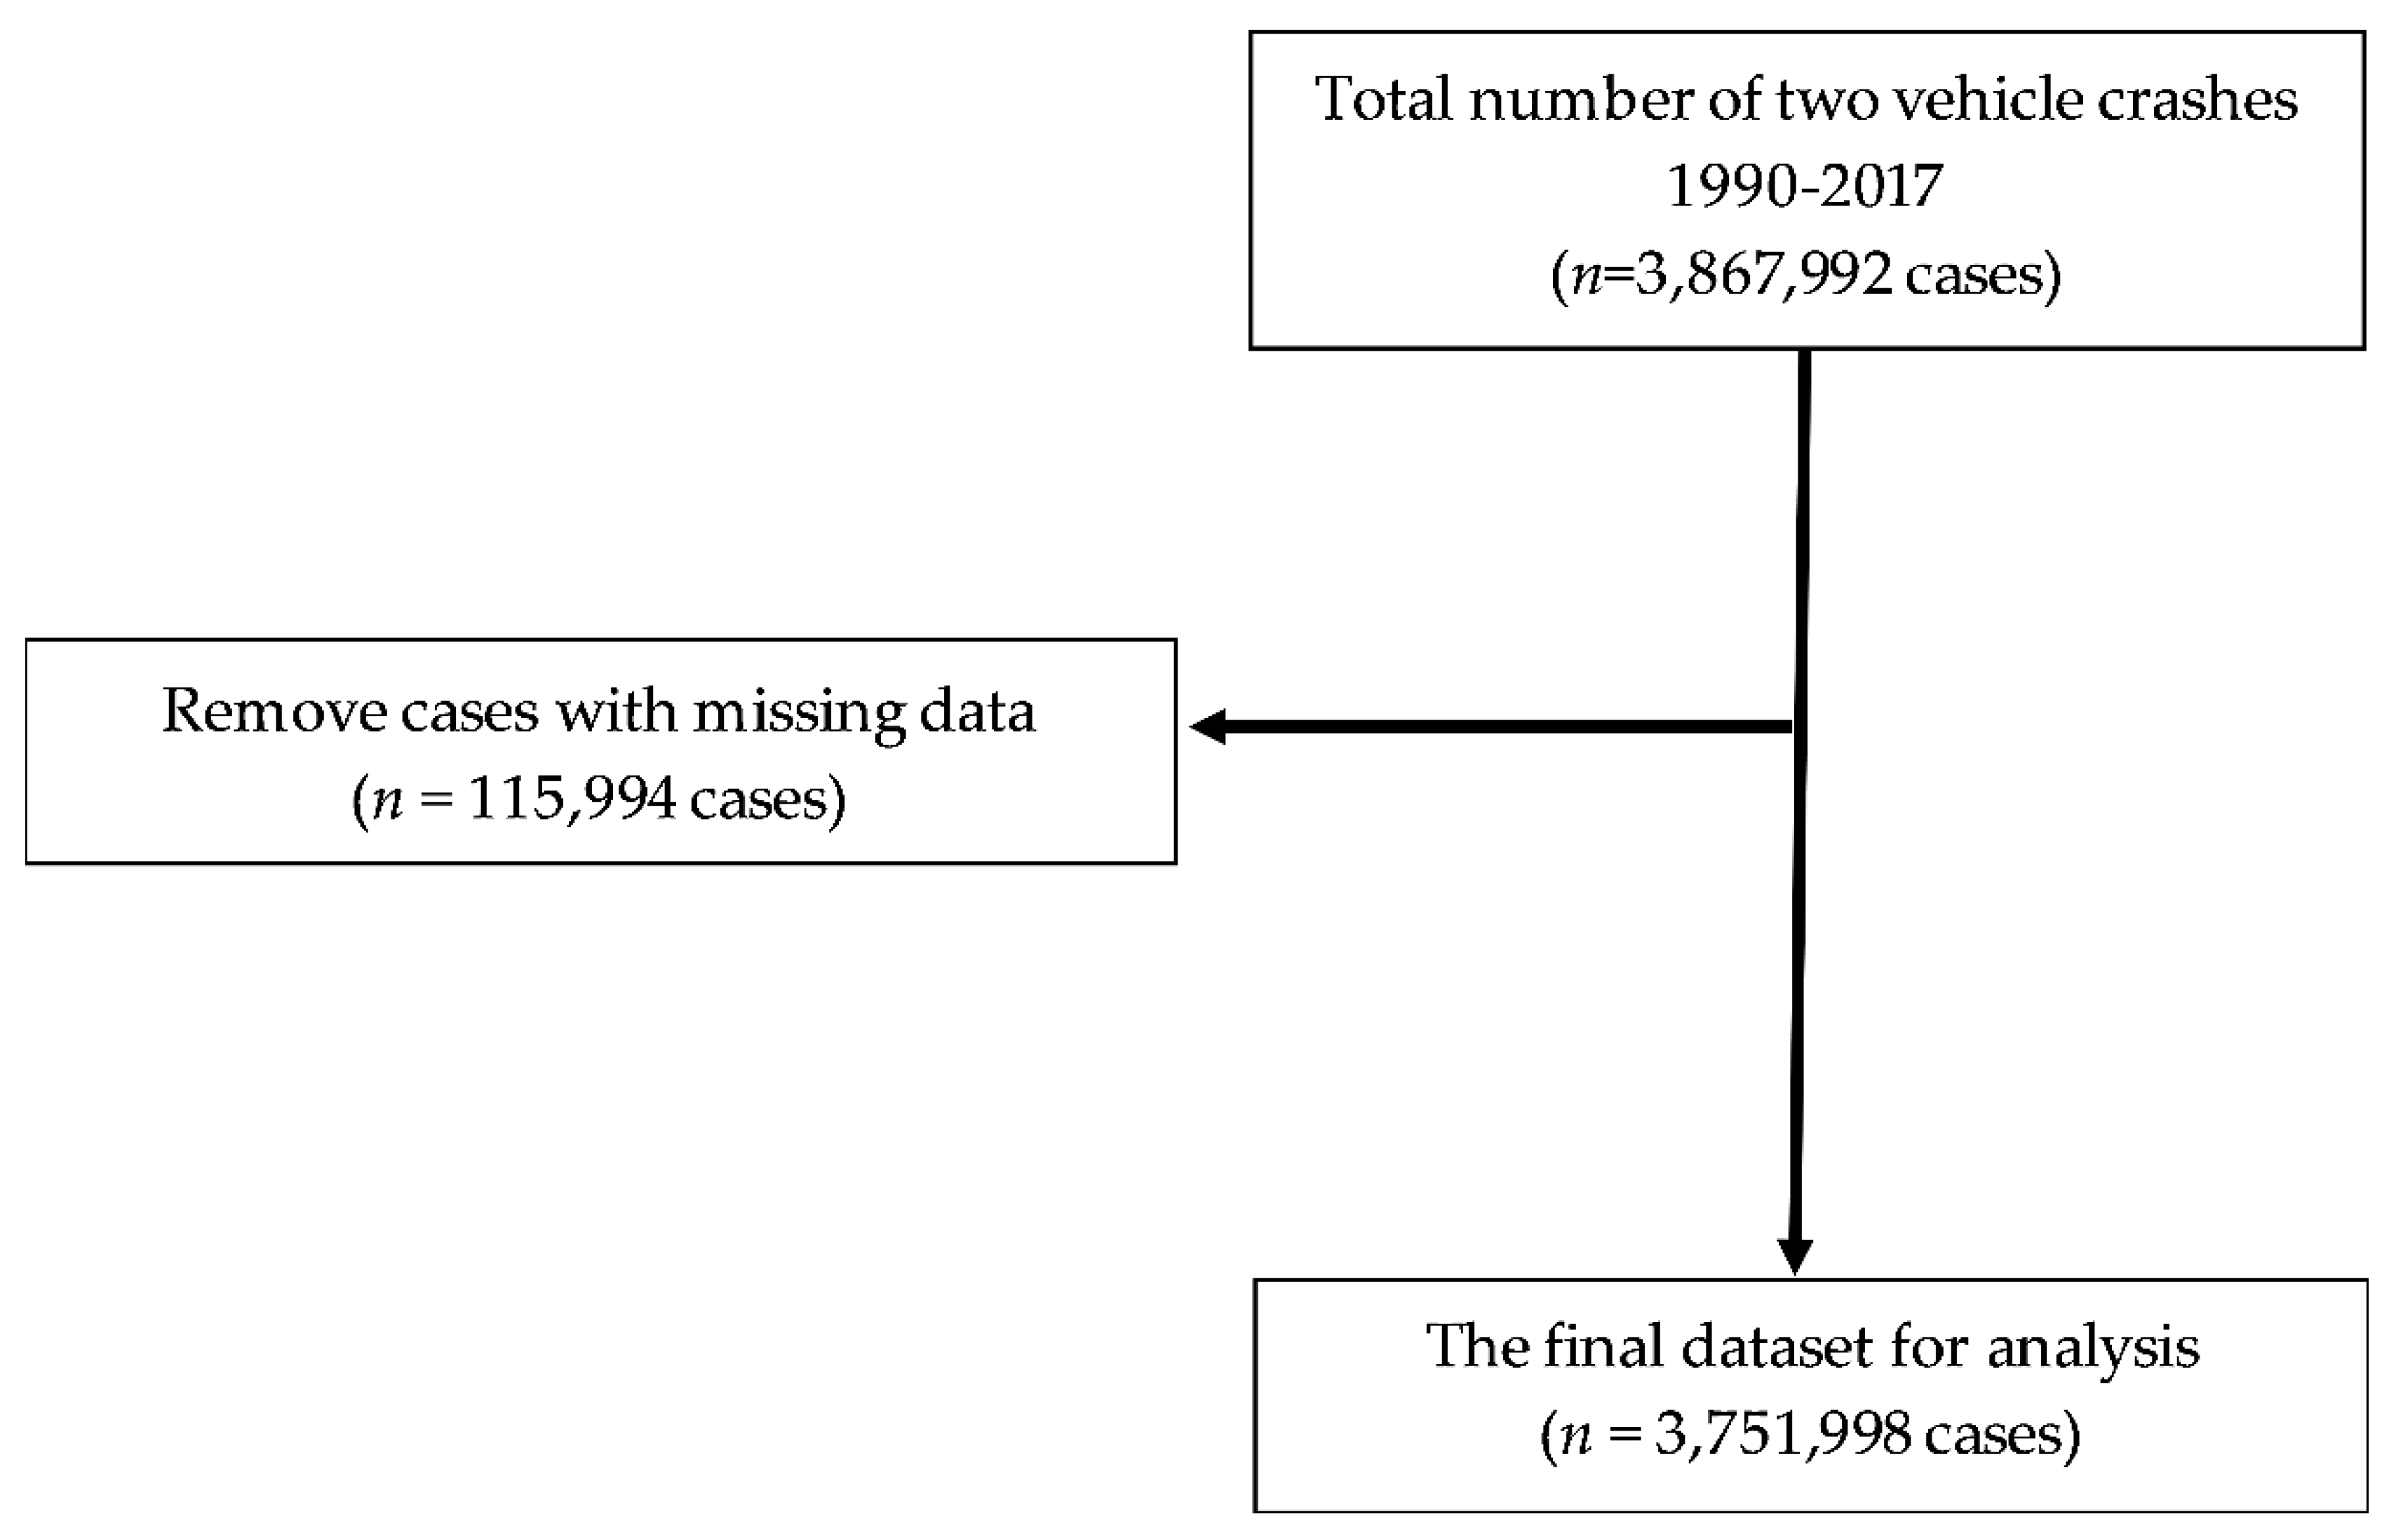
2.1. Study Design and Setting
2.2. Casualties
2.3. Outcome and Variable Definitions
2.4. Statistical Analysis
3. Results
4. Discussion
5. Conclusions
Author Contributions
Funding
Institutional Review Board Statement
Informed Consent Statement
Data Availability Statement
Acknowledgments
Conflicts of Interest
Appendix A


References
- World Health Organization. WHO-Road Traffic Accidents; WHO: Geneva, Switzerland, 2015. [Google Scholar]
- Department for Transport. Department for Transport Reported Road Casualties in Great Britain: Main Results 2018; Department for Transport: London, UK, 2019; pp. 1–41.
- Kalsi, J.; Tervo, T.; Bachour, A.; Partinen, M. Sleep versus non−sleep-related fatal road accidents. Sleep Med. 2018, 51, 148–152. [Google Scholar] [CrossRef] [PubMed]
- Gariazzo, C.; Stafoggia, M.; Bruzzone, S.; Pelliccioni, A.; Forastiere, F. Association between mobile phone traffic volume and road crash fatalities: A population-based case-crossover study. Accid. Anal. Prev. 2018, 115, 25–33. [Google Scholar] [CrossRef] [PubMed]
- Wilson, F.A.; Stimpson, J.P.; Tibbits, M.K. The role of alcohol use on recent trends in distracted driving. Accid. Anal. Prev. 2013, 60, 189–192. [Google Scholar] [CrossRef] [PubMed]
- Summala, H. Fatal accidents among car and truck drivers: Effects of fatigue, age, and alcohol consumption. Hum. Factors 2015, 36, 315–326. [Google Scholar] [CrossRef] [PubMed]
- Philip, P.; Ghorayeb, I.; Stoohs, R.; Menny, J.C.; Dabadie, P.; Bioulac, B.; Guilleminault, C. Determinants of sleepiness in automobile drivers. J. Psychosom. Res. 1996, 41, 279–288. [Google Scholar] [CrossRef]
- Zhang, G.; Yau, K.K.W.; Zhang, X.; Li, Y. Traffic accidents involving fatigue driving and their extent of casualties. Accid. Anal. Prev. 2016, 87, 34–42. [Google Scholar] [CrossRef]
- Bloch, S.; Shin, H.; Labin, S. Time to party: A comparative analysis of holiday drinking and driving. In Proceedings of the 17th International Conference on Alcohol, Drugs and Traffic Safety, Glasgow, UK, 8–13 August 2004; pp. 8–13. [Google Scholar]
- Anowar, S.; Yasmin, S.; Tay, R. Comparison of crashes during public holidays and regular weekends. Accid. Anal. Prev. 2013, 51, 93–97. [Google Scholar] [CrossRef]
- Foster, S.; Gmel, G.; Estévez, N.; Bähler, C.; Mohler-kuo, M. Temporal patterns of alcohol consumption and alcohol-related road accidents in young Swiss men: Seasonal, weekday and public holiday effects. Alcohol Alcohol. 2015, 50, 565–572. [Google Scholar] [CrossRef]
- Mäkelä, P.; Martikainen, P.; Nihtilä, E. Temporal variation in deaths related to alcohol intoxication and drinking. Int. J. Epidemiol. 2005, 34, 765–771. [Google Scholar] [CrossRef]
- Farmer, C.M.; Williams, A.F. Temporal factors in motor vehicle crash deaths. Inj. Prev. 2005, 11, 18–23. [Google Scholar] [CrossRef]
- Redelmeier, D.A.; Stewart, C.L. Driving Fatalities on Super Bowl Sunday. N. Engl. J. Med. 2003, 348, 368–369. [Google Scholar] [CrossRef] [PubMed]
- Redelmeier, D.A.; Tibshirani, R.J. Driving Fatalities on US Presidential Election Days. JAMA 2008, 300, 1518–1520. [Google Scholar] [CrossRef] [PubMed]
- Staples, J.A.; Yip, C.; Redelmeier, D.A. Pedestrian Fatalities Associated With Halloween in the United States. JAMA Pediatr. 2019, 173, 101–103. [Google Scholar] [CrossRef] [PubMed]
- Zhang, F.; Aronow, P.M. Driving fatalities on US presidential election days: A reanalysis. BMC Res. Notes 2016, 9, 6–8. [Google Scholar] [CrossRef][Green Version]
- Radin, U.R.S.; Mackay, M.G.; Hills, B.L. Modelling of conspicuity-related motorcycle accidents in Seremban and Shah Alam, Malaysia. Accid. Anal. Prev. 1996, 28, 325–332. [Google Scholar] [CrossRef]
- Zhang, G.; Li, Y.; King, M.J.; Zhong, Q. Overloading among crash-involved vehicles in China: Identification of factors associated with overloading and crash severity. Inj. Prev. 2019, 25, 36–46. [Google Scholar] [CrossRef]
- Anowar, S.; Yasmin, S.; Tay, R. Reducing the severity of crashes during holidays: Are we targeting the right behaviors? TRB Annu. Meet. 2013, 1, 1–16. [Google Scholar]
- Zhang, G.; Yau, K.K.W.; Gong, X. Traffic violations in Guangdong Province of China: Speeding and drunk driving. Accid. Anal. Prev. 2014, 64, 30–40. [Google Scholar] [CrossRef]
- Harper, S.; Palayew, A. The annual cannabis holiday and fatal traffic crashes. Inj. Prev. 2019, 25, 433–437. [Google Scholar] [CrossRef]
- Staples, J.A.; Redelmeier, D.A. The April 20 Cannabis Celebration and Fatal Traffic Crashes in the United States. JAMA Intern. Med. 2018, 178, 569–572. [Google Scholar] [CrossRef]
- Department for Transport. UK STATS19 Data. Available online: https://data.gov.uk/dataset/road-accidents-safety-data (accessed on 20 January 2020).
- The United Kingdom. Road Traffic Act 1988. Available online: https://www.legislation.gov.uk/ukpga/1988/52/contents (accessed on 1 May 2020).
- Department for Transport. Reported road casualties in Great Britain: 2019 annual report. Dep. Transp. 2020, 1, 1–51. [Google Scholar]
- JIRB TMU. IRB Approval N202011030; TMU Joint Institutional Review Board: Taipei, Taiwan, 2020.
- Kang, H. The prevention and handling of the missing data. Korean J. Anesthesiol. 2013, 64, 402–406. [Google Scholar] [CrossRef] [PubMed]
- Wiratama, B.S.; Chen, P.-L.; Ma, S.-T.; Chen, Y.-H.; Saleh, W.; Lin, H.-A.; Pai, C.-W. Evaluating the combined effect of alcohol-involved and un-helmeted riding on motorcyclist fatalities in Taiwan. Accid. Anal. Prev. 2020, 143, 105594. [Google Scholar] [CrossRef] [PubMed]
- Pai, C.W.; Saleh, W. Exploring motorcyclist injury severity resulting from various crash configurations at T-junctions in the United Kingdom—An application of the ordered probit models. Traffic Inj. Prev. 2007, 8, 62–68. [Google Scholar] [CrossRef] [PubMed]
- Pai, C.W.; Saleh, W. Modelling motorcyclist injury severity by various crash types at T-junctions in the UK. Saf. Sci. 2008, 46, 1234–1247. [Google Scholar] [CrossRef]
- Chen, P.L.; Pai, C.W. Evaluation of injuries sustained by motorcyclists in approach-turn crashes in Taiwan. Accid. Anal. Prev. 2019, 124, 33–39. [Google Scholar] [CrossRef]
- Chen, S.J.; Chen, C.Y.; Lin, M.R. Risk factors for crash involvement in older motorcycle riders. Accid. Anal. Prev. 2018, 111, 109–114. [Google Scholar] [CrossRef]
- Chen, P.L.; Wang, M.H.; Linkov, V.; Pai, C.W. Motorcycle door crashes: An evaluation of crash characteristics in Taipei City, Taiwan. PLoS ONE 2018, 13, e0208016. [Google Scholar] [CrossRef]
- Siviroj, P.; Peltzer, K.; Pengpid, S.; Morarit, S. Helmet use and associated factors among thai motorcyclists during Songkran festival. Int. J. Environ. Res. Public Health 2012, 9, 3286–3297. [Google Scholar] [CrossRef]
- Huang, S.; Ruscio, D.; Ariansyah, D.; Yi, J.; Bordegoni, M. Does the familiarity of road regulation contribute to driving violation? A simulated study on familiar and unfamiliar road intersections among young Chinese drivers. In Proceedings of the International Conference on Applied Human Factors and Ergonomics; Stanton, N.A., Ed.; Springer International Publishing: New York, NY, USA, 2017; pp. 307–318. [Google Scholar]
- Kim, J.K.; Ulfarsson, G.F.; Kim, S.; Shankar, V.N. Driver-injury severity in single-vehicle crashes in California: A mixed logit analysis of heterogeneity due to age and gender. Accid. Anal. Prev. 2013, 50, 1073–1081. [Google Scholar] [CrossRef]
- Feng, S.; Li, Z.; Ci, Y.; Zhang, G. Risk factors affecting fatal bus accident severity: Their impact on different types of bus drivers. Accid. Anal. Prev. 2016, 86, 29–39. [Google Scholar] [CrossRef] [PubMed]
- Yau, K.K.W. Risk factors affecting the severity of single vehicle traffic accidents in Hong Kong. Accid. Anal. Prev. 2004, 36, 333–340. [Google Scholar] [CrossRef]
- Valent, F.; Schiava, F.; Savonitto, C.; Gallo, T.; Brusaferro, S.; Barbone, F. Risk factors for fatal road traffic accidents in Udine, Italy. Accid. Anal. Prev. 2002, 34, 71–84. [Google Scholar] [CrossRef]
- Chang, H.L.; Yeh, T.H. Motorcyclist accident involvement by age, gender, and risky behaviors in Taipei, Taiwan. Transp. Res. Part F Traffic Psychol. Behav. 2007, 10, 109–122. [Google Scholar] [CrossRef]
- Huang, Y.W.; Lin, P.C.; Wang, J. The influence of bus and taxi drivers’ public self-consciousness and social anxiety on aberrant driving behaviors. Accid. Anal. Prev. 2018, 117, 145–153. [Google Scholar] [CrossRef] [PubMed]
- Font-Ribera, L.; Garcia-Continente, X.; Pérez, A.; Torres, R.; Sala, N.; Espelt, A.; Nebot, M. Driving under the influence of alcohol or drugs among adolescents: The role of urban and rural environments. Accid. Anal. Prev. 2013, 60, 1–4. [Google Scholar] [CrossRef]
- Ahmed, N.; Greenberg, P. Assessing the impact of blood alcohol concentration on the rate of in-hospital mortality following traumatic motor vehicle crash injury: A matched analysis of the National Trauma Data Bank. Injury 2019, 50, 33–38. [Google Scholar] [CrossRef]
- Zhou, M.; Chin, H.C. Factors affecting the injury severity of out-of-control single-vehicle crashes in Singapore. Accid. Anal. Prev. 2019, 124, 104–112. [Google Scholar] [CrossRef]
- Bernhoft, I.M.; Hels, T.; Lyckegaard, A.; Houwing, S.; Verstraete, A.G. Prevalence and risk of injury in europe by driving with alcohol, illicit drugs and medicines. Procedia Soc. Behav. Sci. 2012, 48, 2907–2916. [Google Scholar] [CrossRef]
- Gjerde, H.; Normann, P.T.; Christophersen, A.S.; Ove, S.; Mørland, J. Alcohol, psychoactive drugs and fatal road traffic accidents in Norway: A case—control study. Accid. Anal. Prev. 2011, 43, 1197–1203. [Google Scholar] [CrossRef]
- Abegaz, T.; Berhane, Y.; Worku, A.; Assrat, A.; Assefa, A. Effects of excessive speeding and falling asleep while driving on crash injury severity in Ethiopia: A generalized ordered logit model analysis. Accid. Anal. Prev. 2014, 71, 15–21. [Google Scholar] [CrossRef] [PubMed]
- Nakahara, S.; Chadbunchachai, W.; Ichikawa, M.; Tipsuntornsak, N.; Wakai, S. Temporal distribution of motorcyclist injuries and risk of fatalities in relation to age, helmet use, and riding while intoxicated in Khon Kaen, Thailand. Accid. Anal. Prev. 2005, 37, 833–842. [Google Scholar] [CrossRef] [PubMed]
- Gegenfurtner, K.R.; Mayser, H.; Sharpe, L.T. Seeing movement in the dark. Nature 1999, 398, 475–476. [Google Scholar] [CrossRef] [PubMed]
- Plainis, S.; Murray, I.J.; Pallikaris, I.G. Road traffic casualties: Understanding the night-time death toll. Inj. Prev. 2006, 12, 125–138. [Google Scholar] [CrossRef]
- Rosey, F.; Aillerie, I.; Espie, S.; Vienne, F. Driver behaviour in fog is not only a question of degraded visibility–A simulator study. Saf. Sci. 2017, 95, 50–61. [Google Scholar] [CrossRef]
- Rezapour, M.; Moomen, M.; Ksaibati, K. Ordered logistic models of influencing factors on crash injury severity of single and multiple-vehicle downgrade crashes: A case study in Wyoming. J. Safety Res. 2019, 68, 107–118. [Google Scholar] [CrossRef]
- Rifaat, S.M.; Chin, H.C. Accident severity analysis using ordered probit model. J. Adv. Transp. 2007, 41, 91–114. [Google Scholar] [CrossRef]
- Rifaat, S.M.; Tay, R.; De Barros, A. Severity of motorcycle crashes in Calgary. Accid. Anal. Prev. 2012, 49, 44–49. [Google Scholar] [CrossRef]
- George, Y.; Athanasios, T.; George, P. Investigation of road accident severity per vehicle type. Transp. Res. Procedia 2017, 25, 2081–2088. [Google Scholar] [CrossRef]
- Kockelman, K.M.; Kweon, Y.J. Driver injury severity: An application of ordered probit models. Accid. Anal. Prev. 2002, 34, 313–321. [Google Scholar] [CrossRef]
- Peek-Asa, C.; Kraus, J.F. Alcohol use, driver, and crash characteristics among injured motorcycle drivers. J. Trauma Acute Care Surg. 1996, 41, 989–993. [Google Scholar] [CrossRef] [PubMed]
- Zuxuan, D.; Ivan, J.N.; Gårder, P. Analysis of factors affecting the severity of head-on crashes two-lane rural highways in Connecticut. Transp. Res. Rec. 2006, 1953, 137–146. [Google Scholar] [CrossRef]
- Afukaar, F.K. Speed control in developing countries: Issues, challenges and opportunities in reducing road traffic injuries. Inj. Control Saf. Promot. 2003, 10, 77–81. [Google Scholar] [CrossRef] [PubMed]
- Lin, M.-R.; Huang, W.; Hwang, H.-F.; Wu, H.-D.I.; Yen, L.-L. The effect of crash experience on changes in risk taking among urban and rural young people. Accid. Anal. Prev. 2004, 36, 213–222. [Google Scholar] [CrossRef]
- Ooi, S.S.; Wong, S.V.; Yeap, J.S.; Umar, R. Relationship between cervical spine injury and helmet use in motorcycle road crashes. Asia Pac. J. Public Health 2011, 23, 608–619. [Google Scholar] [CrossRef]
- Viano, D.C.; Parenteau, C.S. Injury risks in frontal crashes by delta V and body region with focus on head injuries in low-speed collisions. Traffic Inj. Prev. 2010, 11, 382–390. [Google Scholar] [CrossRef]
- Yu, W.Y.; Chen, C.Y.; Chiu, W.T.; Lin, M.R. Effectiveness of different types of motorcycle helmets and effects of their improper use on head injuries. Int. J. Epidemiol. 2011, 40, 794–803. [Google Scholar] [CrossRef]
- Awadzi, K.D.; Classen, S.; Hall, A.; Duncan, R.P.; Garvan, C.W. Predictors of injury among younger and older adults in fatal motor vehicle crashes. Accid. Anal. Prev. 2008, 40, 1804–1810. [Google Scholar] [CrossRef]
- Lundberg, C.; Hakamies-Blomqvist, L.; Almkvist, O.; Johansson, K. Impairments of some cognitive functions are common in crash-involved older drivers. Accid. Anal. Prev. 1998, 30, 371–377. [Google Scholar] [CrossRef]
- Rubin, G.S.; Ng, E.S.W.; Bandeen-Roche, K.; Keyl, P.M.; Freeman, E.E.; West, S.K. A prospective, population-based study of the role of visual impairment in motor vehicle crashes among older drivers: The SEE study. Invest. Ophthalmol. Vis. Sci. 2007, 48, 1483–1491. [Google Scholar] [CrossRef]
- Ball, K.K.; Roenker, D.L.; Wadley, V.G.; Edwards, J.D.; Roth, D.L.; McGwin, G., Jr.; Raleigh, R.; Joyce, J.J.; Cissell, G.M.; Dube, T. Can high-risk older drivers be identified through performance-based measures in a Department of Motor Vehicles setting? J. Am. Geriatr. Soc. 2006, 54, 77–84. [Google Scholar] [CrossRef] [PubMed]
- Marottoli, R.A.; Cooney, L.M.; Wagner, D.R.; Doucette, J.; Tinetti, M.E. Predictors of automobile crashes and moving violations among elderly drivers. Ann. Intern. Med. 1994, 121, 842–846. [Google Scholar] [CrossRef] [PubMed]
- Marottoli, R.A.; Richardson, E.D.; Stowe, M.H.; Miller, E.G.; Brass, L.M.; Cooney, L.M., Jr.; Tinetti, M.E. Development of a test battery to identify older drivers at risk for self-reported adverse driving events. J. Am. Geriatr. Soc. 1998, 46, 562–568. [Google Scholar] [CrossRef] [PubMed]


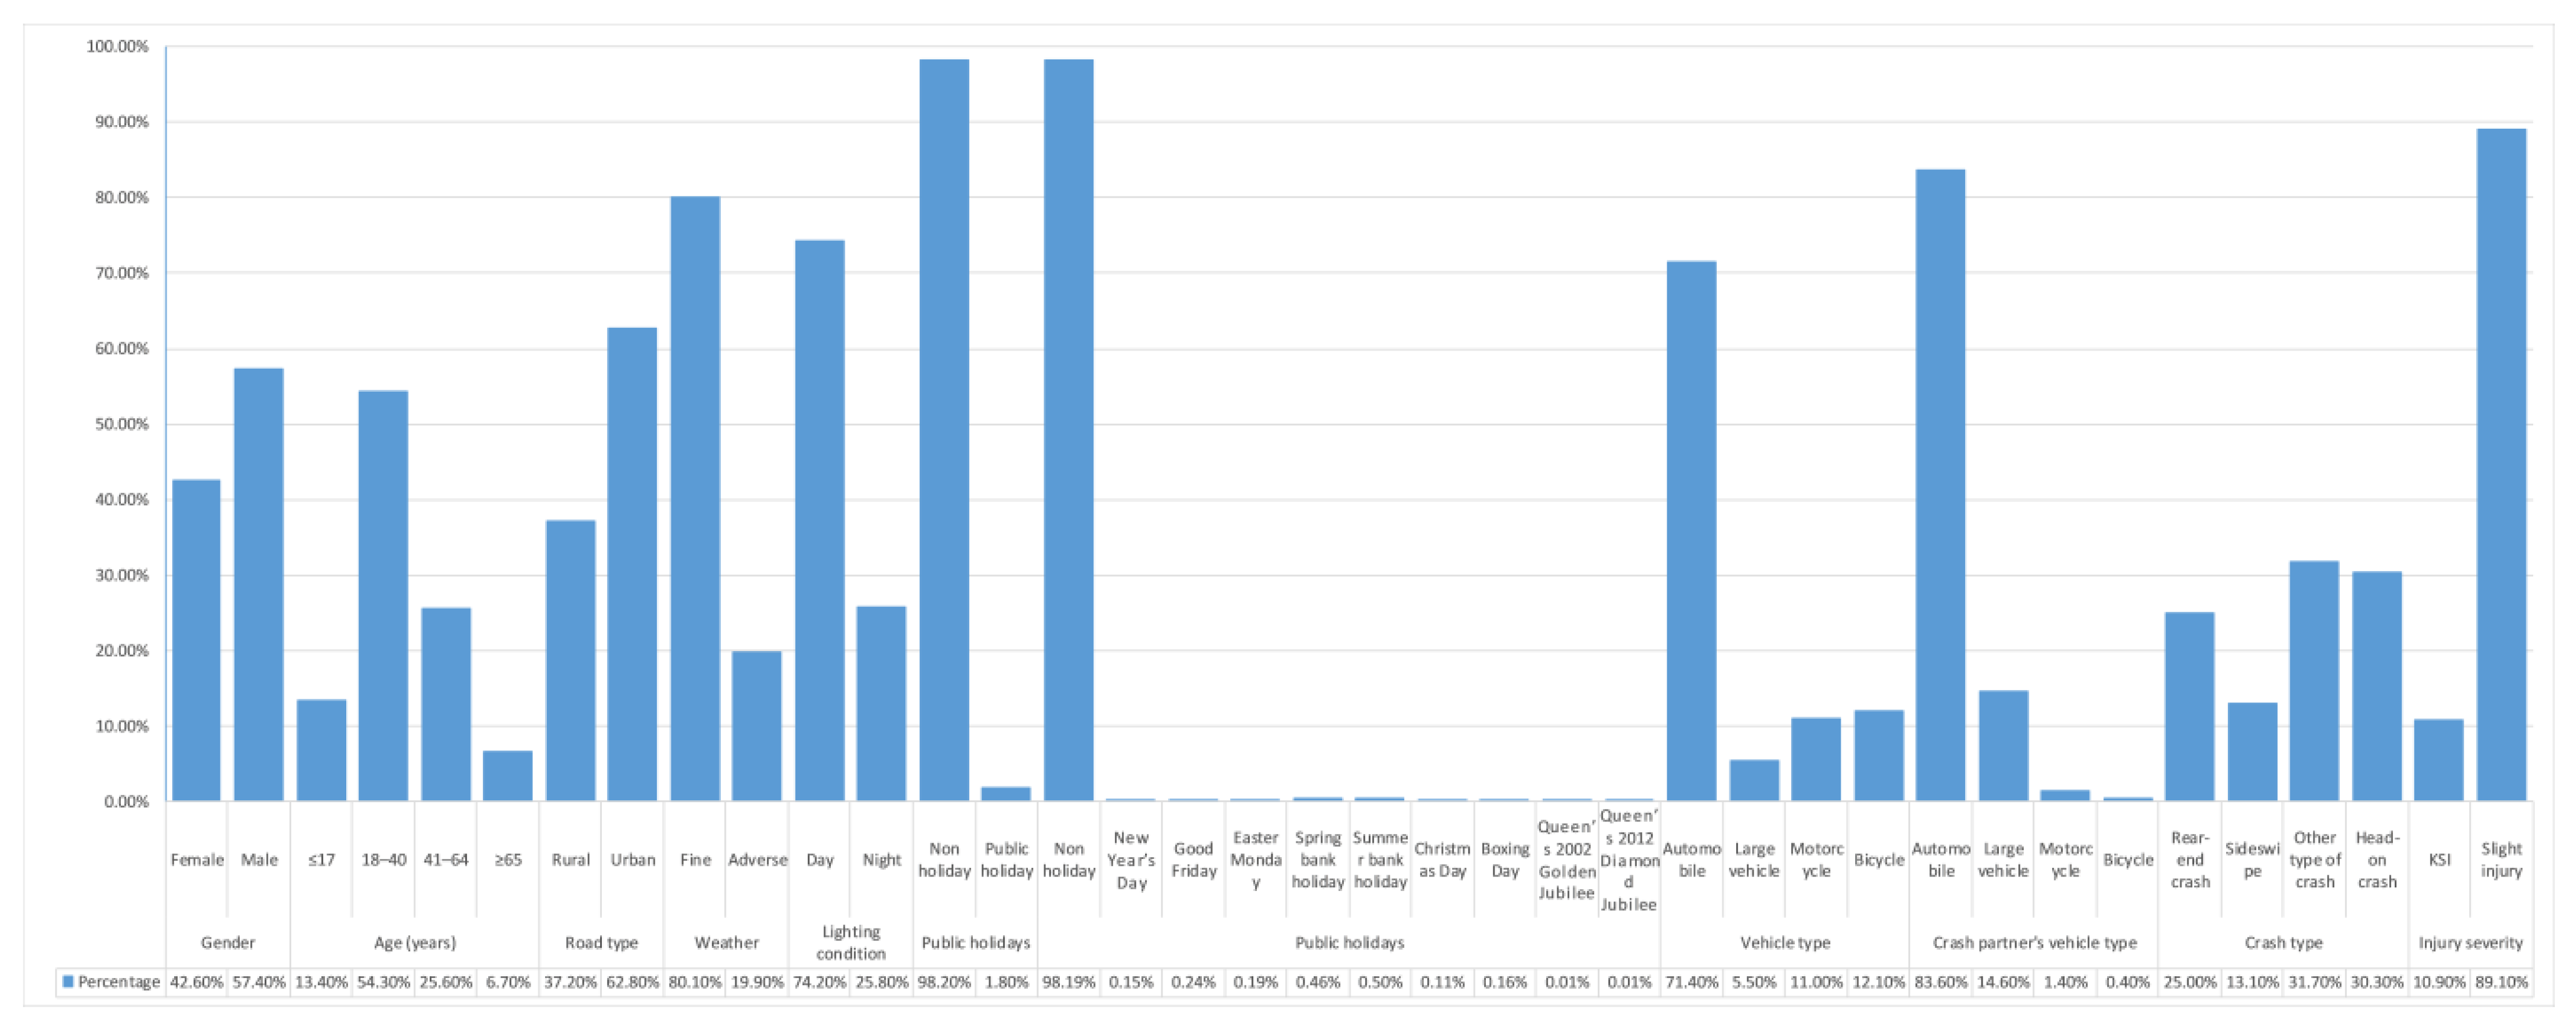
| Characteristics | Number of Casualties (n) | Percentage (%) |
|---|---|---|
| Sex | ||
| Female | 1,598,979 | 42.6 |
| Male | 2,153,019 | 57.4 |
| Driver’s age | ||
| ≤17 years | 504,442 | 13.4 |
| 18–40 years | 2,037,233 | 54.3 |
| 41–64 years | 959,904 | 25.6 |
| ≥65 years | 250,419 | 6.7 |
| Road type | ||
| Urban | 1,397,266 | 37.2 |
| Rural | 2,354,732 | 62.8 |
| Weather | ||
| Fine | 3,006,380 | 80.1 |
| Adverse | 745,618 | 19.9 |
| Lighting condition | ||
| Day | 2,782,762 | 74.2 |
| Night | 969,236 | 25.8 |
| Public holiday | ||
| Non holiday | 3,683,987 | 98.2 |
| Public holiday | 68,011 | 1.8 |
| Public holiday | ||
| Non holiday | 3,683,987 | 98.19 |
| New Year’s Day | 5529 | 0.15 |
| Good Friday | 8995 | 0.24 |
| Easter Monday | 7139 | 0.19 |
| Spring bank holiday | 17,114 | 0.46 |
| Summer bank holiday | 18,760 | 0.50 |
| Christmas Day | 4009 | 0.11 |
| Boxing Day | 5870 | 0.16 |
| Queen’s 2002 Golden Jubilee | 348 | 0.01 |
| Queen’s 2012 Diamond Jubilee | 247 | 0.01 |
| Vehicle type | ||
| Automobile | 2,677,961 | 71.4 |
| Large vehicle | 206,965 | 5.5 |
| Motorcycle | 413,863 | 11.0 |
| Bicycle | 453,209 | 12.1 |
| Crash partner vehicle type | ||
| Automobile | 3,135,481 | 83.6 |
| Large vehicle | 546,738 | 14.6 |
| Motorcycle | 52,902 | 1.4 |
| Bicycle | 16,877 | 0.4 |
| Crash type | ||
| Rear-end crash | 936,691 | 25.0 |
| Sideswipe | 491,465 | 13.1 |
| Other type of crash | 1,188,627 | 31.7 |
| Head-on crash | 1,135,215 | 30.3 |
| Injury severity | ||
| KSI | 410,299 | 10.9 |
| Slight injury | 3,341,699 | 89.1 |
| Total | 3,751,998 | 100.0 |
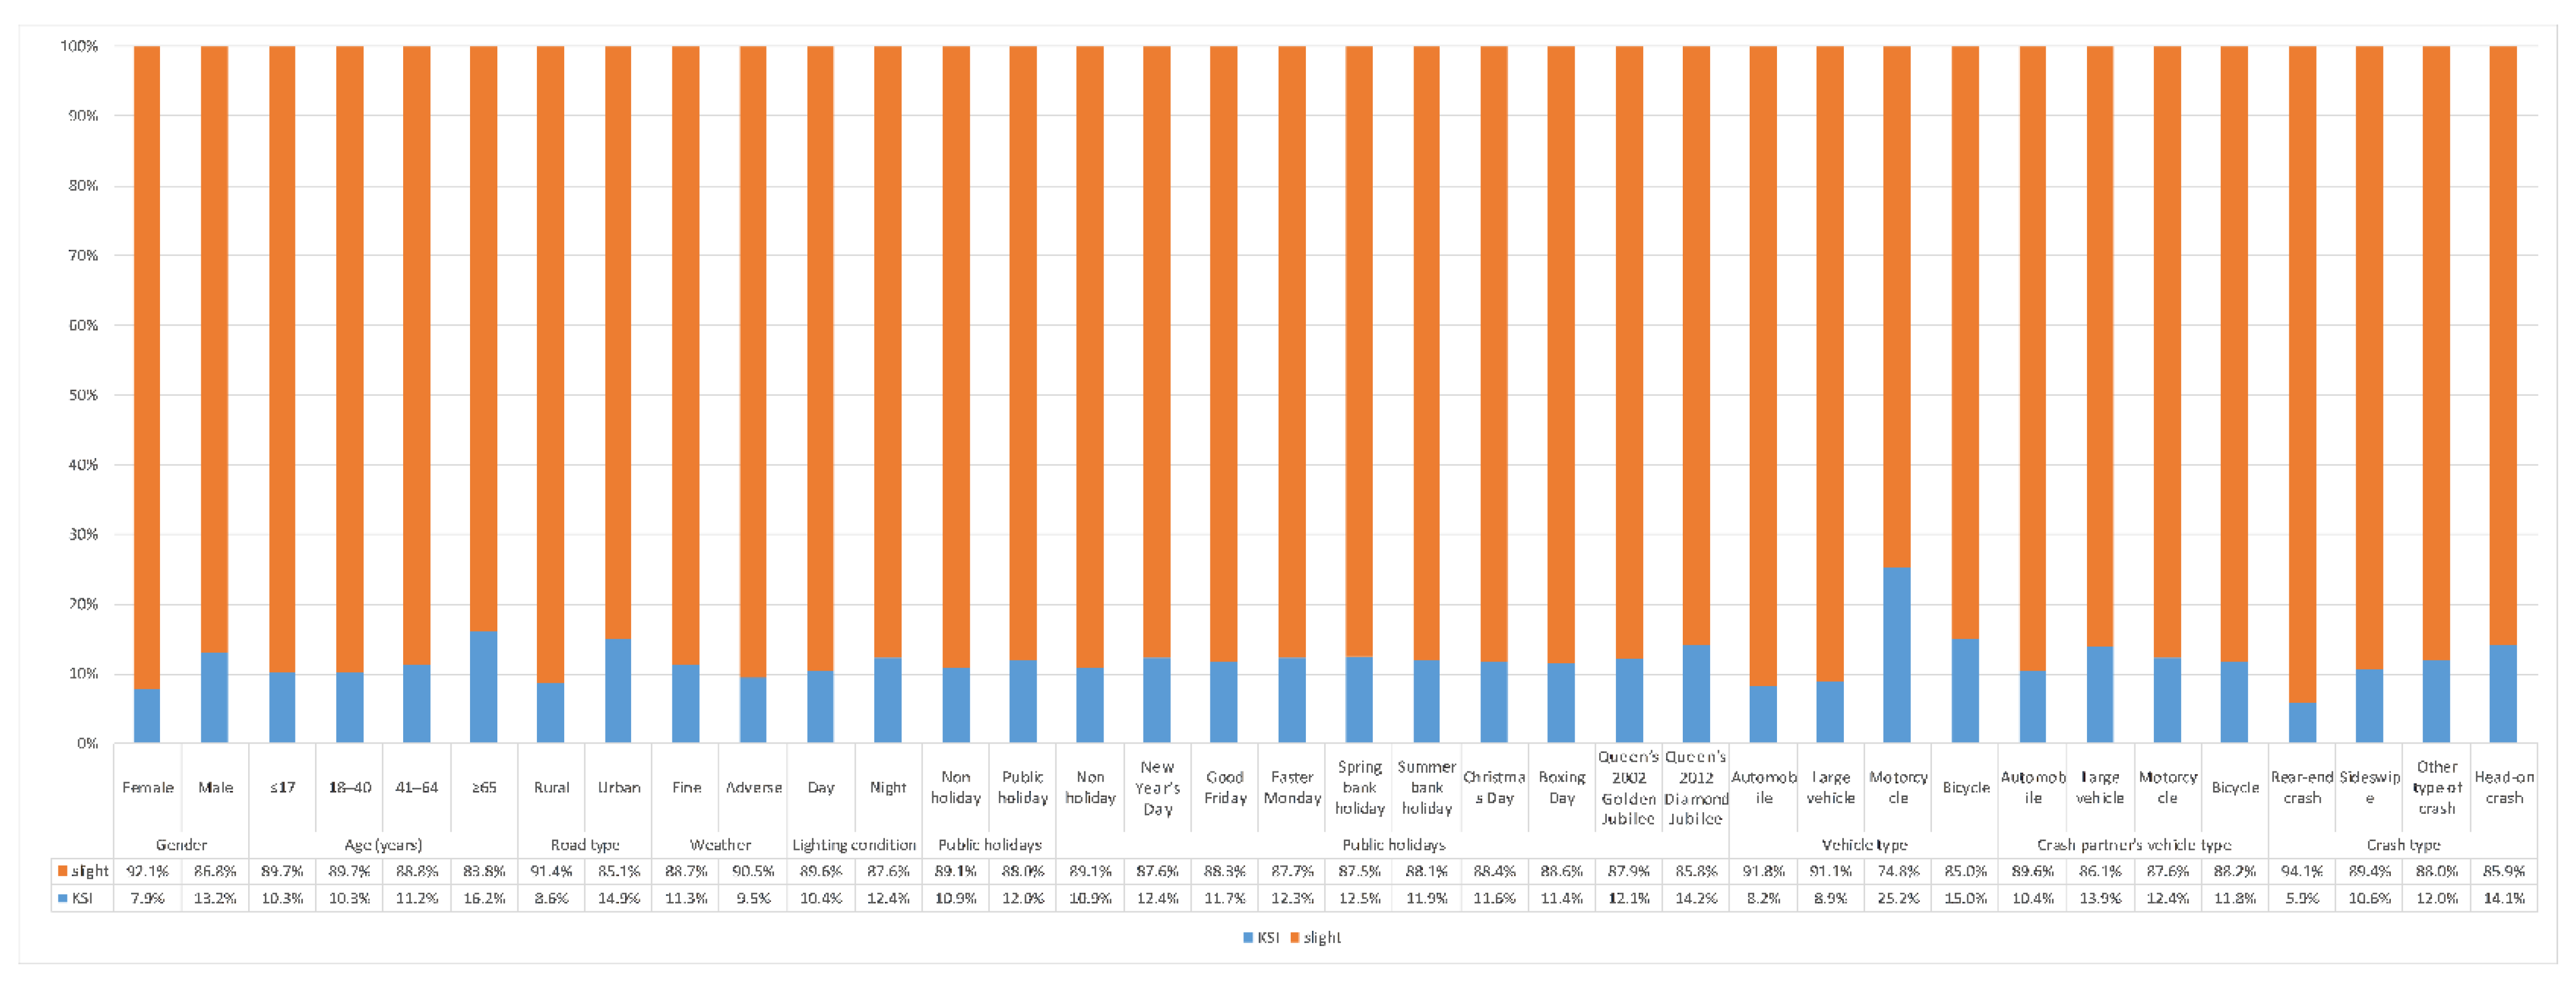
| Characteristics | Killed or Seriously Injured (KSI) n (%) | Slight Injury n (%) | p-Value |
|---|---|---|---|
| Sex | <0.001 | ||
| Female | 126,295 (7.9%) | 1,472,684 (92.1%) | |
| Male | 284,004 (13.2%) | 1,869,015 (86.8%) | |
| Driver’s age | <0.001 | ||
| ≤17 years | 52,137 (10.3%) | 452,305 (89.7%) | |
| 18–40 years | 209,736 (10.3%) | 1,827,497 (89.7%) | |
| 41–64 years | 107,955 (11.2%) | 851,949 (88.8%) | |
| ≥65 years | 40,471 (16.2%) | 209,948 (83.8%) | |
| Road type | <0.001 | ||
| Urban | 202,542 (8.6%) | 2,152,190 (91.4%) | |
| Rural | 207,757 (14.9%) | 1,189,509 (85.1%) | |
| Weather | <0.001 | ||
| Fine | 339,131 (11.3%) | 2,667,249 (88.7%) | |
| Adverse | 71,168 (9.5%) | 674,450 (90.5%) | |
| Lighting condition | <0.001 | ||
| Day | 290,460 (10.4%) | 2,492,302 (89.6%) | |
| Night | 119,839 (12.4%) | 849,397 (87.6%) | |
| Public holiday | <0.001 | ||
| Non holiday | 402,109 (10.9%) | 3,281,878 (89.1%) | |
| Public holiday | 8190 (12.0%) | 59,821 (88.0%) | |
| Public holiday | <0.001 | ||
| Non holiday | 402,109 (10.9%) | 3,281,878 (89.1%) | |
| New Year’s Day | 686 (12.4%) | 4843 (87.6%) | |
| Good Friday | 1048 (11.7%) | 7947 (88.3%) | |
| Easter Monday | 881 (12.3%) | 6258 (87.7%) | |
| Spring bank holiday | 2137 (12.5%) | 14,977 (87.5%) | |
| Summer bank holiday | 2228 (11.9%) | 16,532 (88.1%) | |
| Christmas Day | 466 (11.6%) | 3543 (88.4%) | |
| Boxing Day | 667 (11.4%) | 5203 (88.6%) | |
| Queen’s 2002 Golden Jubilee | 42 (12.1%) | 306 (87.9%) | |
| Queen’s 2012 Diamond Jubilee | 35 (14.2%) | 212 (85.8%) | |
| Vehicle type | <0.001 | ||
| Automobile | 219,321 (8.2%) | 2,458,640 (91.8%) | |
| Large vehicle | 18,508 (8.9%) | 188,457 (91.1%) | |
| Motorcycle | 104,366 (25.2%) | 309,497 (74.8%) | |
| Bicycle | 68,104 (15.0%) | 385,105 (85.0%) | |
| Crash partner vehicle type | <0.001 | ||
| Automobile | 325,552 (10.4%) | 2,809,929 (89.6%) | |
| Large vehicle | 76,218 (13.9%) | 470,520 (86.1%) | |
| Motorcycle | 6534 (12.4%) | 46,368 (87.6%) | |
| Bicycle | 1995 (11.8%) | 14,882 (88.2%) | |
| Crash type | <0.001 | ||
| Rear-end crash | 55,210 (5.9%) | 881,841 (94.1%) | |
| Sideswipe | 51,929 (10.6%) | 439,536 (89.4%) | |
| Other type of crash | 143,217 (12.0%) | 1,045,410 (88.0%) | |
| Head-on crash | 159,943 (14.1%) | 975,272 (89.1%) |
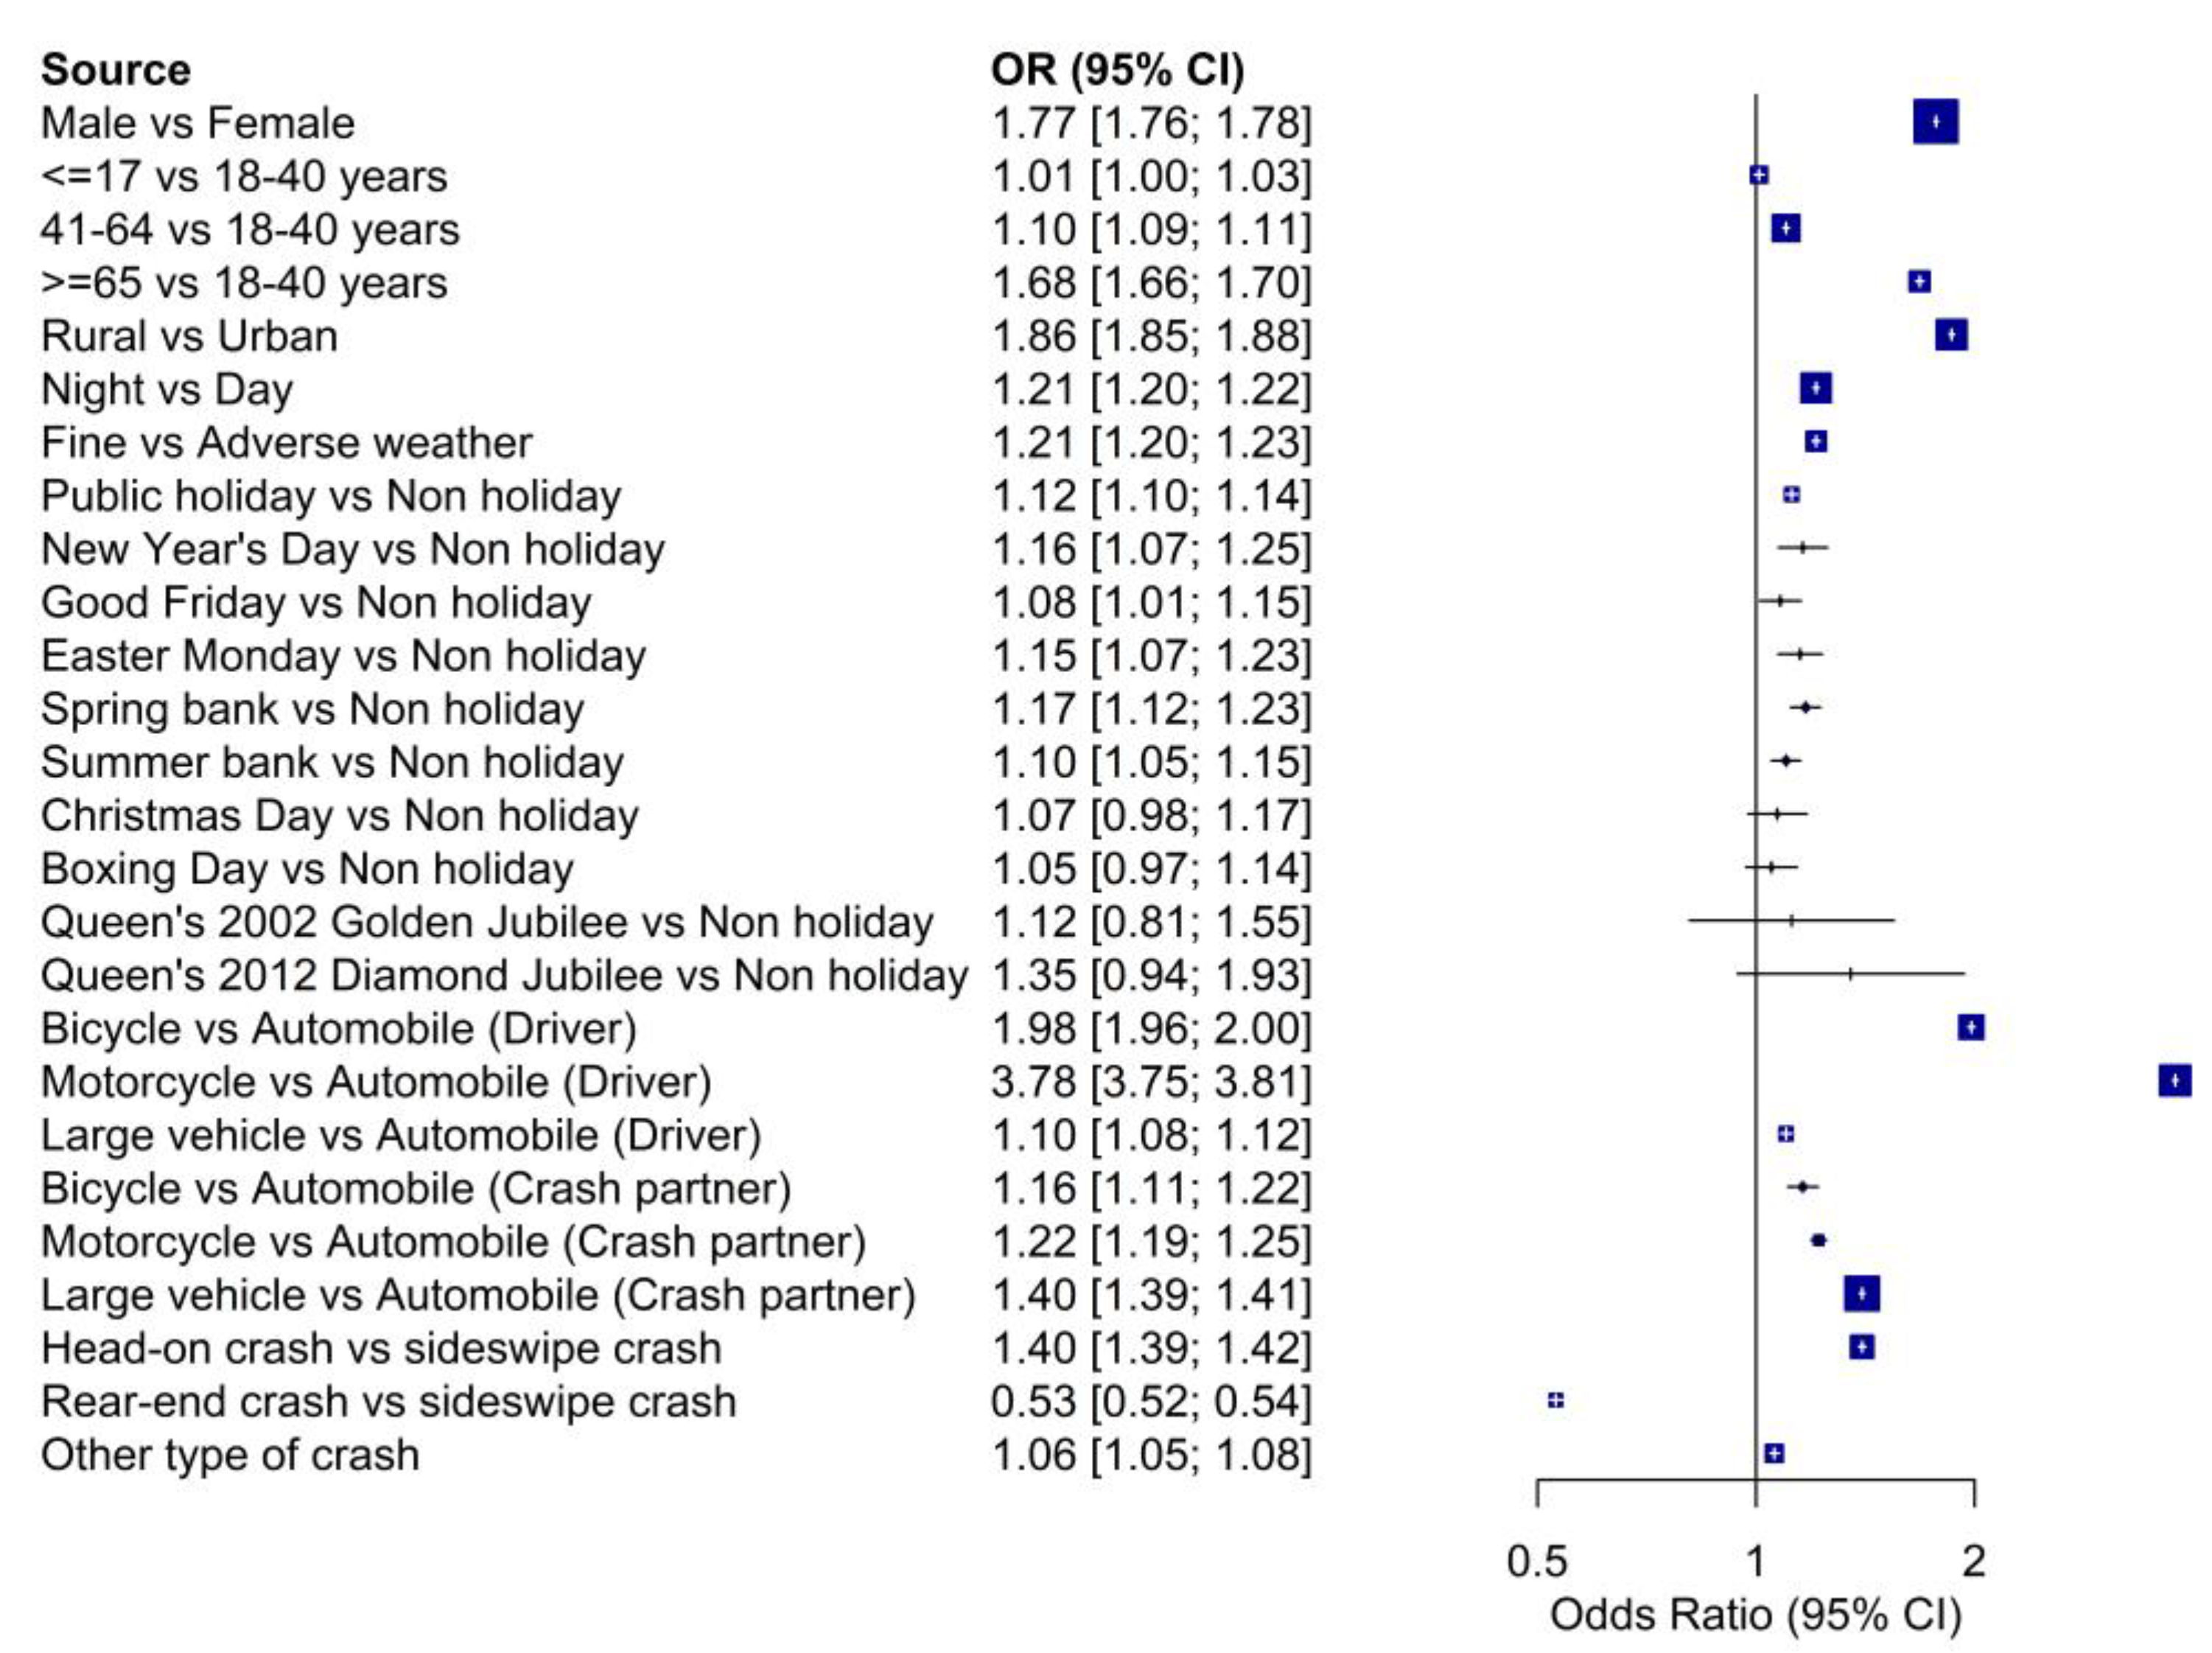
| Variable | β | OR (95% CI) | p-Value |
|---|---|---|---|
| Sex | |||
| Male | 0.57 | 1.77 (1.76–1.78) | <0.001 |
| Female (Ref.) | - | 1 | |
| Age (y) | |||
| ≤17 | 0.04 | 1.01 (0.99–1.02) | 0.020 |
| 18–40 (Ref.) | - | 1 | |
| 41–64 | 0.10 | 1.10 (1.09–1.11) | <0.001 |
| ≥65 | 0.52 | 1.68 (1.66–1.70) | <0.001 |
| Road type | |||
| Rural | 0.62 | 1.86 (1.84–1.87) | <0.001 |
| Urban (Ref.) | 1 | ||
| Lighting condition | |||
| Night | 0.19 | 1.21 (1.20–1.22) | <0.001 |
| Day (Ref.) | 1 | ||
| Weather | |||
| Fine | 0.19 | 1.21 (1.19–1.22) | <0.001 |
| Adverse (Ref.) | - | 1 | |
| Public holiday | |||
| Public holiday | 0.11 | 1.12 (1.10–1.14) | <0.001 |
| Non holiday (Ref.) | - | 1 | |
| Public holiday | |||
| New Year’s Day | 0.15 | 1.16 (1.07–1.25) | <0.001 |
| Good Friday | 0.07 | 1.08 (1.01–1.15) | 0.025 |
| Easter Monday | 0.14 | 1.15 (1.07–1.23) | <0.001 |
| Spring bank holiday | 0.15 | 1.17 (1.11–1.22) | <0.001 |
| Summer bank holiday | 0.10 | 1.10 (1.05–1.15) | <0.001 |
| Christmas Day | 0.07 | 1.07 (0.98–1.18) | 0.150 |
| Boxing Day | 0.05 | 1.05 (0.97–1.14) | 0.272 |
| Queen’s 2002 Golden Jubilee | 0.11 | 1.12 (0.81–1.55) | 0.490 |
| Queen’s 2012 Diamond Jubilee | 0.30 | 1.35 (0.94–1.93) | 0.102 |
| Non holiday (Ref.) | - | 1 | |
| Vehicle type | |||
| Bicycle | 0.68 | 1.98 (1.96–2.00) | <0.001 |
| Motorcycle | 1.33 | 3.78 (3.75–3.81) | <0.001 |
| Large vehicle | 0.10 | 1.10 (1.08–1.12) | <0.001 |
| Automobile (Ref.) | - | 1 | |
| Crash partner vehicle type | |||
| Bicycle | 0.15 | 1.16 (1.10–1.21) | <0.001 |
| Motorcycle | 0.20 | 1.22 (1.19–1.25) | <0.001 |
| Large vehicle | 0.34 | 1.40 (1.39–1.41) | <0.001 |
| Automobile (Ref.) | - | 1 | |
| Crash type | |||
| Head-on crash | 0.33 | 1.40 (1.38–1.41) | <0.001 |
| Rear-end crash | −0.64 | 0.53 (0.52–0.54) | <0.001 |
| Other type of crash | 0.15 | 1.06 (1.05–1.08) | <0.001 |
| Sideswipe crash | - | 1 |
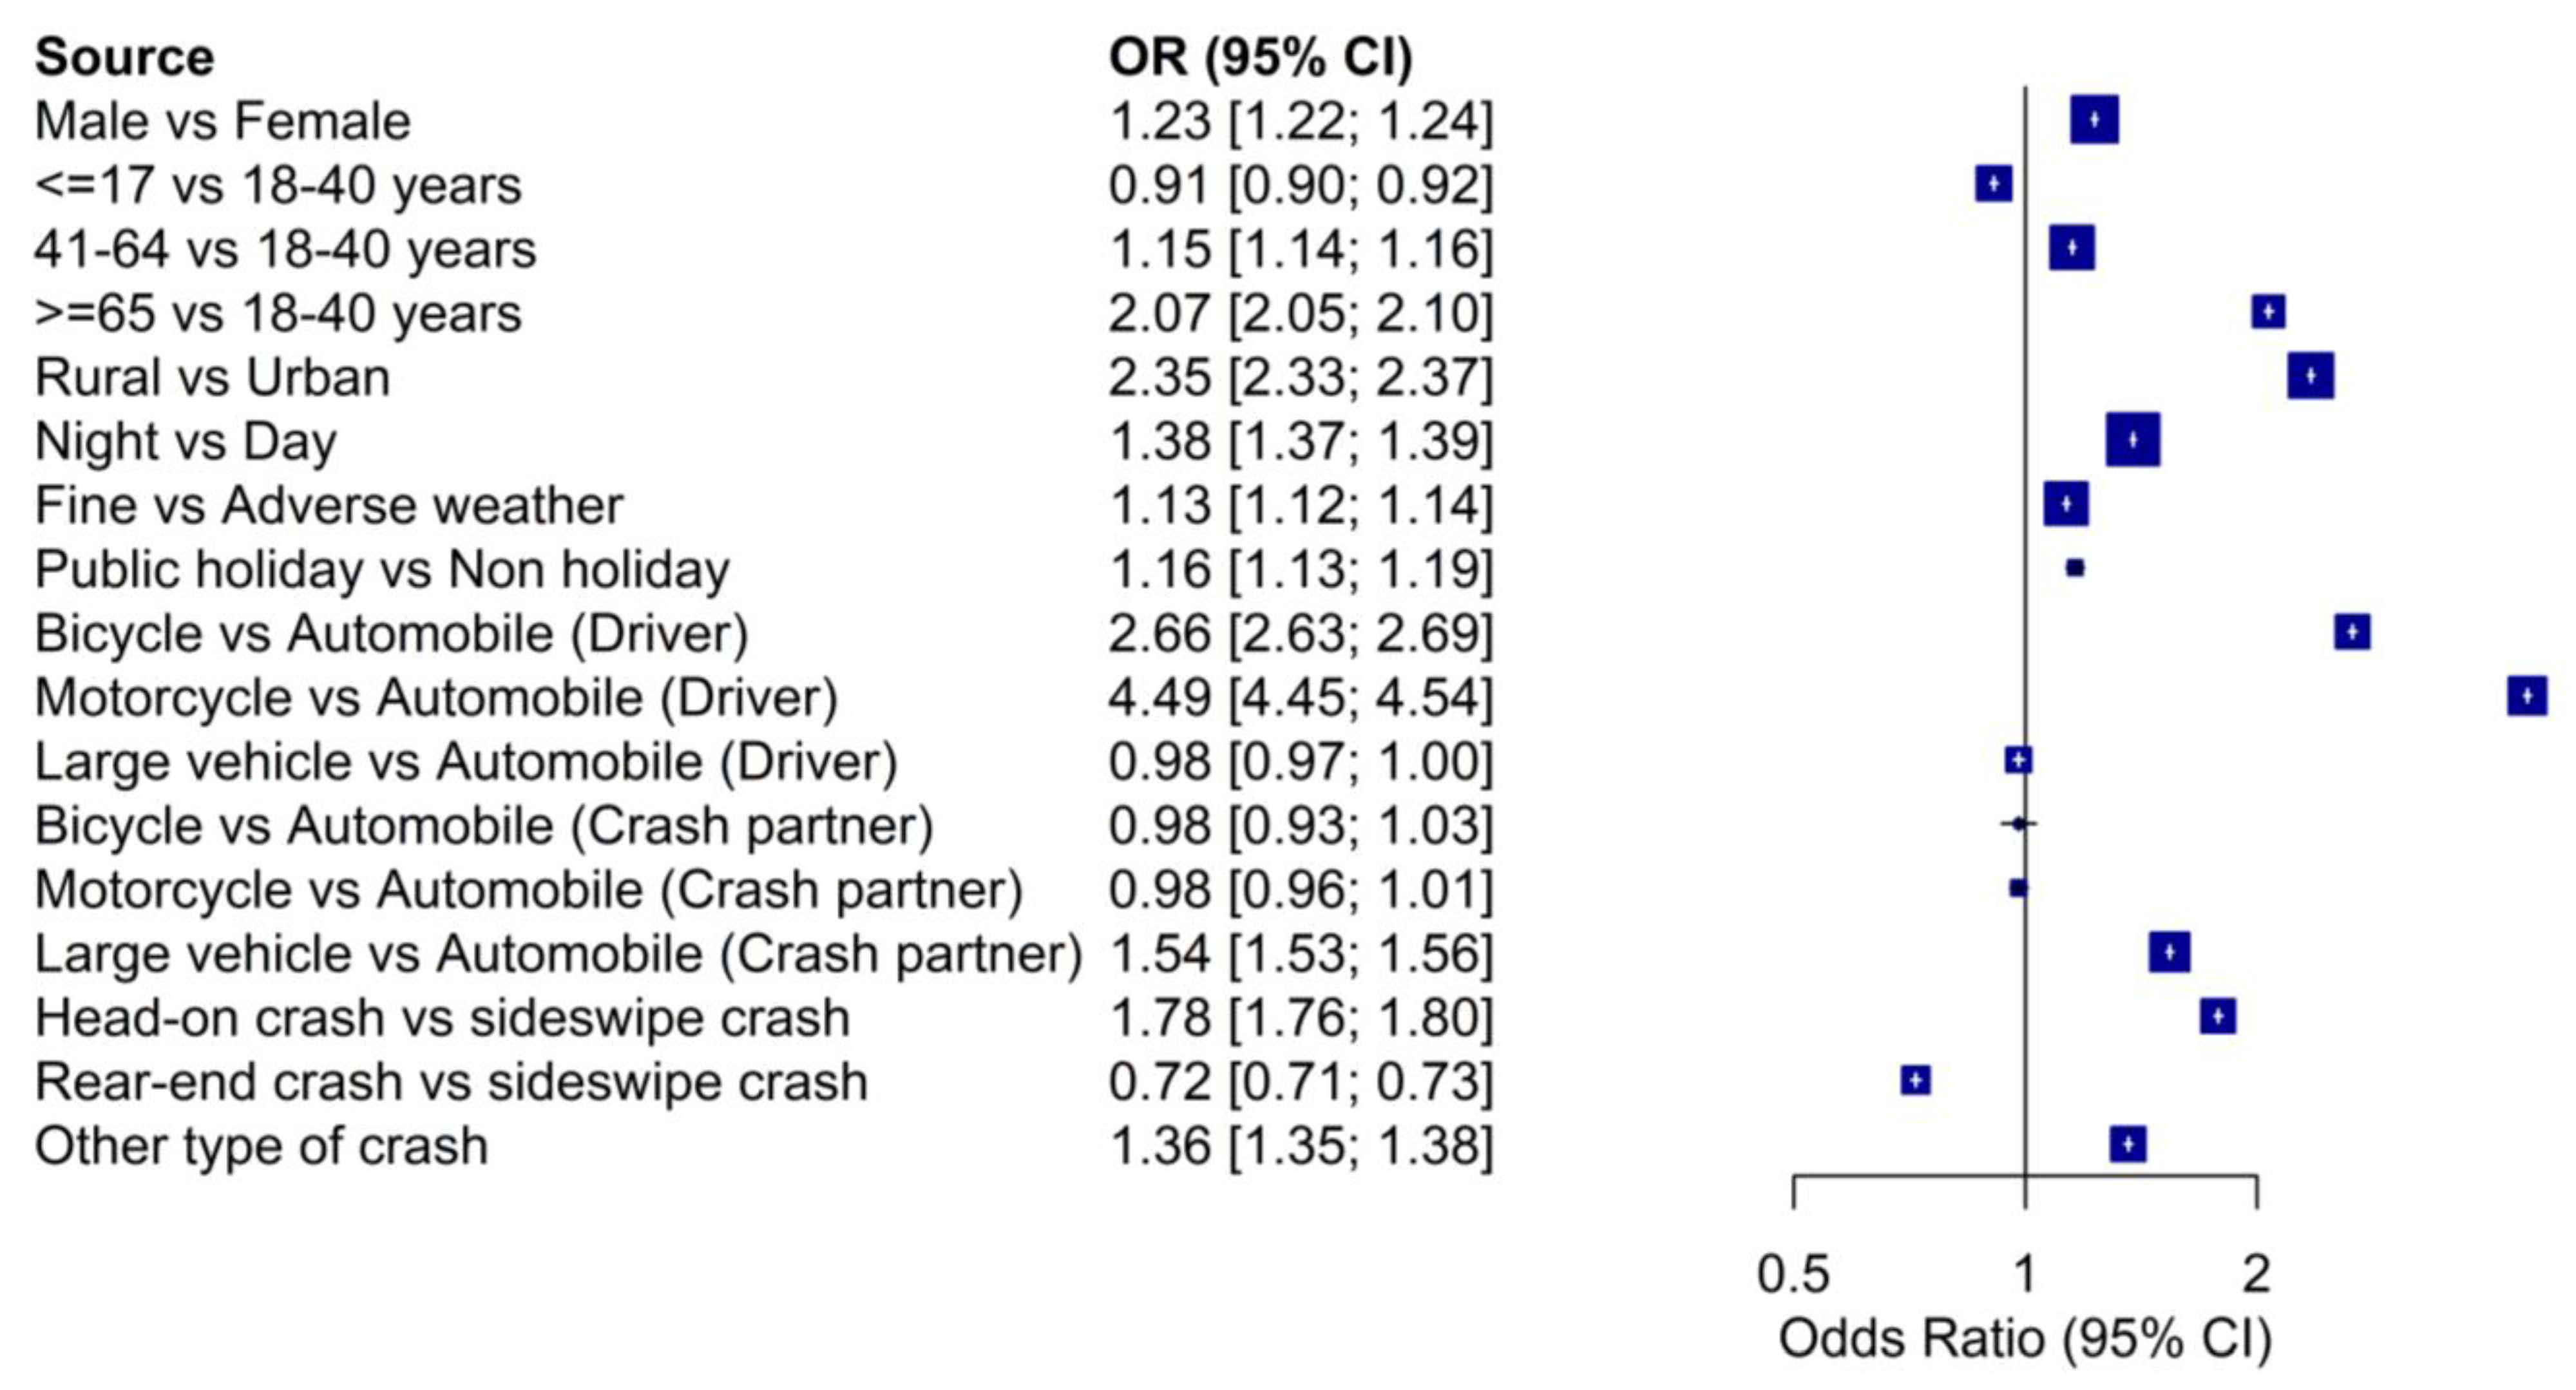
| Variable | β | OR (95% CI) | p-Value |
|---|---|---|---|
| Sex | |||
| Male | 0.21 | 1.23 (1.22–1.24) | <0.001 |
| Female (Ref.) | - | 1 | |
| Age (y) | |||
| ≤17 | −0.09 | 0.91 (0.90–0.92) | <0.001 |
| 18–40 (Ref.) | - | 1 | |
| 41–64 | 0.14 | 1.15 (1.14–1.16) | <0.001 |
| ≥65 | 0.73 | 2.07 (2.05–2.10) | <0.001 |
| Road type | |||
| Rural | 0.85 | 2.35 (2.33–2.37) | <0.001 |
| Urban (Ref.) | - | 1 | |
| Lighting condition | |||
| Night | 0.32 | 1.38 (1.37–1.39) | <0.001 |
| Day (Ref.) | - | 1 | |
| Weather | |||
| Fine | 0.12 | 1.13 (1.12–1.14) | <0.001 |
| Adverse (Ref.) | - | 1 | |
| Public holiday | |||
| Public holiday | 0.15 | 1.16 (1.13–1.19) | <0.001 |
| Non holiday (Ref.) | - | 1 | |
| Vehicle type | |||
| Bicycle | 0.98 | 2.66 (2.63–2.69) | <0.001 |
| Motorcycle | 1.50 | 4.49 (4.44–4.53) | <0.001 |
| Large vehicle | −0.02 | 0.98 (0.96–0.99) | 0.012 |
| Automobile (Ref.) | - | 1 | |
| Crash partner vehicle type | |||
| Bicycle | −0.02 | 0.98 (0.93–1.03) | 0.330 |
| Motorcycle | −0.07 | 0.98 (0.96–1.01) | 0.216 |
| Large vehicle | 0.43 | 1.54 (1.53–1.56) | <0.001 |
| Automobile (Ref.) | - | 1 | |
| Crash type | |||
| Head-on crash | 0.58 | 1.78 (1.76–1.80) | <0.001 |
| Rear-end crash | −0.34 | 0.72 (0.71–0.73) | <0.001 |
| Other type of crash | 0.31 | 1.36 (1.35–1.38) | <0.001 |
| Sideswipe crash | - | 1 | |
| Pseudo R2 = 0.116 |
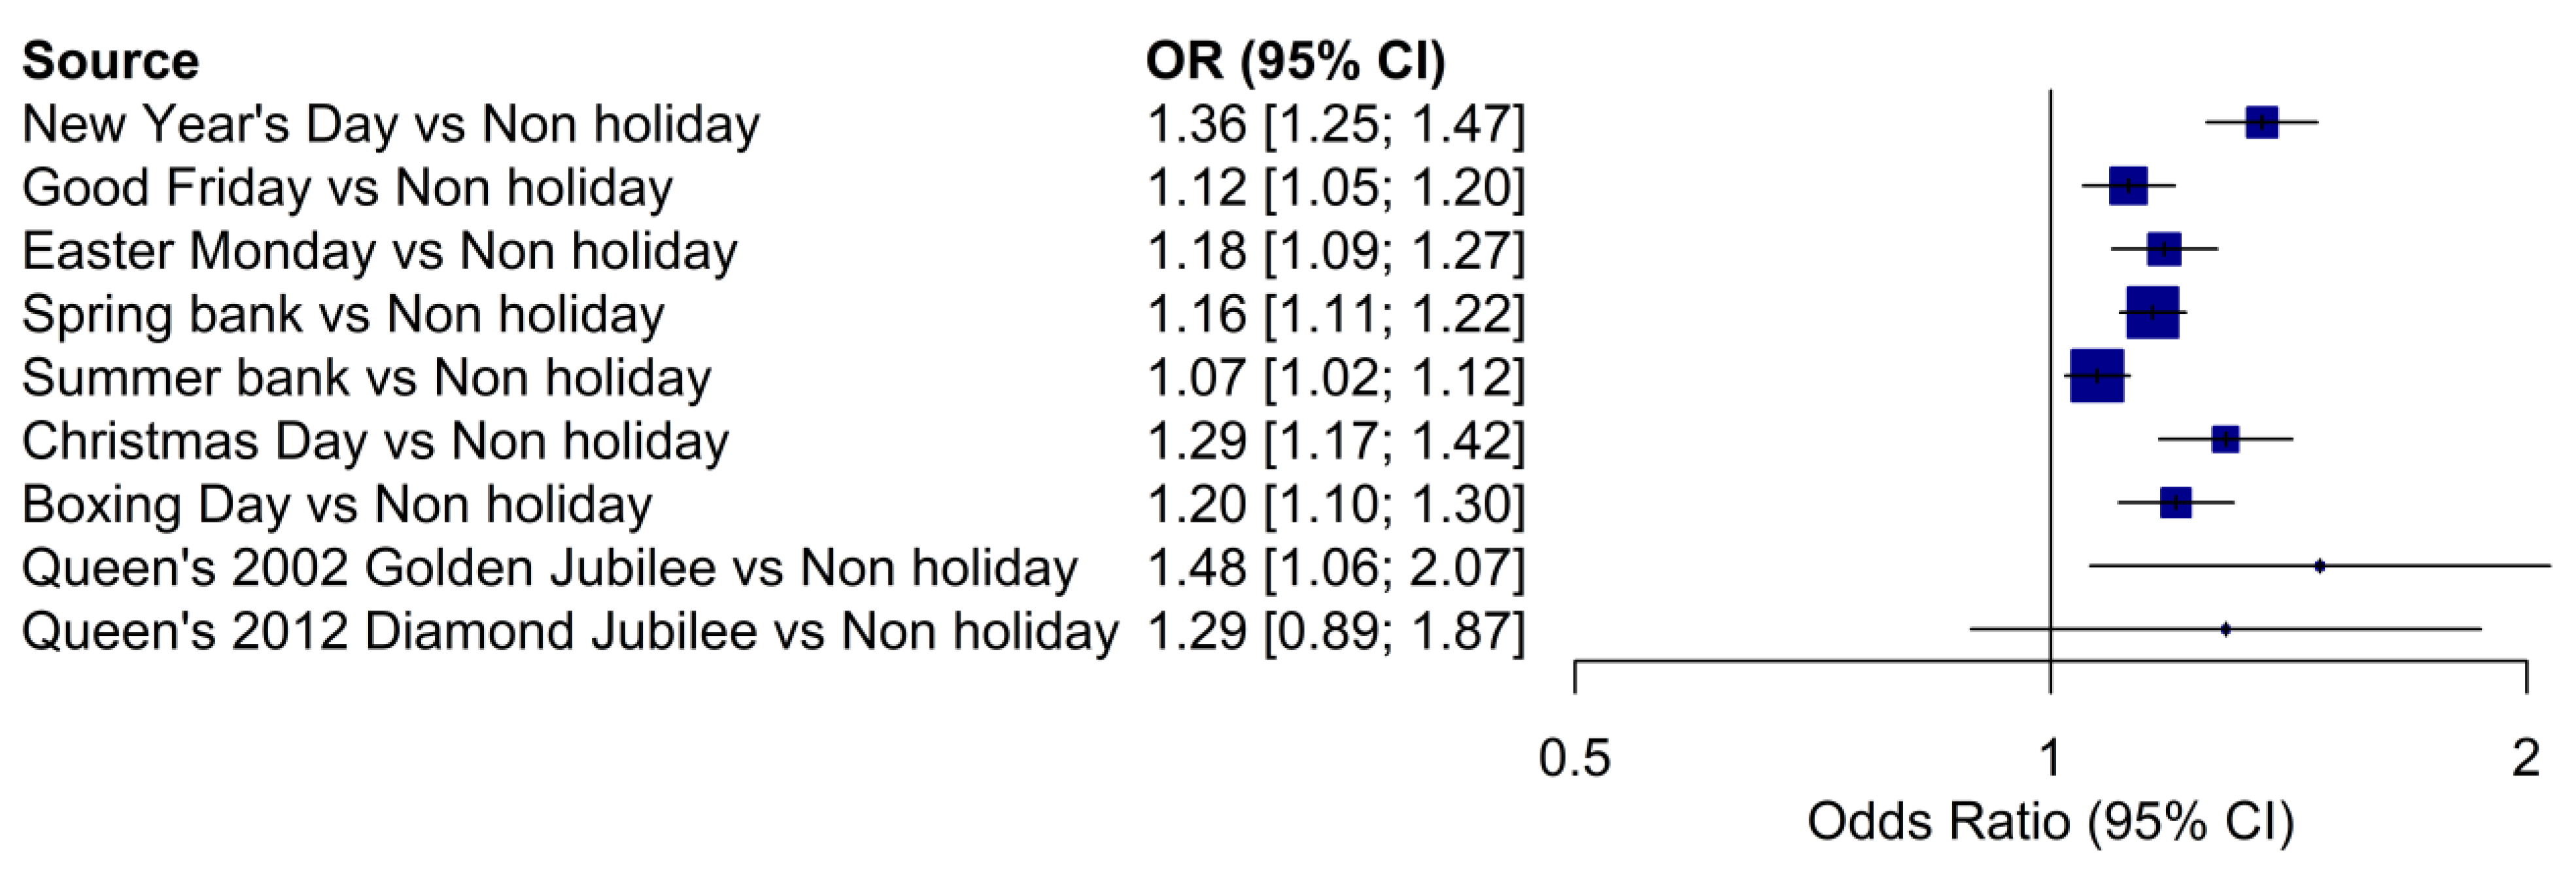
| Variable | β | OR (95% CI) | p-Value |
|---|---|---|---|
| Public holiday a | |||
| New Year’s Day | 0.31 | 1.36 (1.26–1.48) | <0.001 |
| Good Friday | 0.12 | 1.12 (1.05–1.20) | 0.001 |
| Easter Monday | 0.16 | 1.18 (1.09–1.27) | <0.001 |
| Spring bank holiday | 0.15 | 1.16 (1.10–1.21) | <0.001 |
| Summer bank holiday | 0.07 | 1.07 (1.02–1.12) | 0.004 |
| Christmas Day | 0.25 | 1.29 (1.17–1.42) | <0.001 |
| Boxing Day | 0.18 | 1.20 (1.10–1.30) | <0.001 |
| Queen’s 2002 Golden Jubilee | 0.39 | 1.48 (1.06–2.07) | 0.022 |
| Queen’s 2012 Diamond Jubilee | 0.25 | 1.29 (0.89–1.87) | 0.182 |
| Non holiday (Ref.) | - | 1 | |
| Pseudo R2 = 0.116 |
Publisher’s Note: MDPI stays neutral with regard to jurisdictional claims in published maps and institutional affiliations. |
© 2021 by the authors. Licensee MDPI, Basel, Switzerland. This article is an open access article distributed under the terms and conditions of the Creative Commons Attribution (CC BY) license (http://creativecommons.org/licenses/by/4.0/).
Share and Cite
Wiratama, B.S.; Chen, P.-L.; Chen, L.-H.; Saleh, W.; Chen, S.-K.; Chen, H.-T.; Lin, H.-A.; Pai, C.-W. Evaluating the Effects of Holidays on Road Crash Injuries in the United Kingdom. Int. J. Environ. Res. Public Health 2021, 18, 280. https://doi.org/10.3390/ijerph18010280
Wiratama BS, Chen P-L, Chen L-H, Saleh W, Chen S-K, Chen H-T, Lin H-A, Pai C-W. Evaluating the Effects of Holidays on Road Crash Injuries in the United Kingdom. International Journal of Environmental Research and Public Health. 2021; 18(1):280. https://doi.org/10.3390/ijerph18010280
Chicago/Turabian StyleWiratama, Bayu Satria, Ping-Ling Chen, Liang-Hao Chen, Wafaa Saleh, Shang-Ku Chen, Hui-Tsai Chen, Hui-An Lin, and Chih-Wei Pai. 2021. "Evaluating the Effects of Holidays on Road Crash Injuries in the United Kingdom" International Journal of Environmental Research and Public Health 18, no. 1: 280. https://doi.org/10.3390/ijerph18010280
APA StyleWiratama, B. S., Chen, P.-L., Chen, L.-H., Saleh, W., Chen, S.-K., Chen, H.-T., Lin, H.-A., & Pai, C.-W. (2021). Evaluating the Effects of Holidays on Road Crash Injuries in the United Kingdom. International Journal of Environmental Research and Public Health, 18(1), 280. https://doi.org/10.3390/ijerph18010280