Article

Comparative Toxic Effects of Manufactured Nanoparticles and Atmospheric Particulate Matter in Human Lung Epithelial Cells

1
Jiangsu Key Laboratory of Atmospheric Environment Monitoring and Pollution Control (AEMPC), Collaborative Innovation Center of Atmospheric Environment and Equipment Technology (AEET), School of Environmental Science and Engineering, Nanjing University of Information Science & Technology (NUIST), Nanjing 210044, China
2
School of Chemical Engineering and Light Industry, Guangdong University of Technology, Guangzhou 510006, China
3
School of Atmospheric Sciences, Nanjing University, Nanjing 210023, China
*
Author to whom correspondence should be addressed.
Int. J. Environ. Res. Public Health 2021, 18(1), 22; https://doi.org/10.3390/ijerph18010022
Submission received: 18 November 2020 / Revised: 16 December 2020 / Accepted: 17 December 2020 / Published: 22 December 2020
(This article belongs to the Section Environmental Health)

Abstract

:
Although nanoparticles (NPs) have been used as simplified atmospheric particulate matter (PM) models, little experimental evidence is available to support such simulations. In this study, we comparatively assessed the toxic effects of PM and typical NPs (four carbonaceous NPs with different morphologies, metal NPs of Fe, Al, and Ti, as well as SiO2 NPs) on human lung epithelial A549 cells. The EC50 value of PM evaluated by cell viability assay was 148.7 μg/mL, closest to that of SiO2 NPs, between the values of carbonaceous NPs and metal NPs. All particles caused varying degrees of reactive oxygen species (ROS) generation and adenosine triphosphate (ATP) suppression. TiO2 NPs showed similar performance with PM in inducing ROS production (p < 0.05). Small variations between two carbonaceous NPs (graphene oxides and graphenes) and PM were also observed at 50 μg/mL. Similarly, there was no significant difference in ATP inhibition between carbonaceous NPs and PM, while markedly different effects were caused by SiO2 NP and TiO2 NP exposure. Our results indicated that carbonaceous NPs could be served as potential surrogates for urban PM. The identification of PM model may help us further explore the specific roles and mechanisms of various components in PM.

Graphical Abstract

1. Introduction

Atmospheric particulate matter (PM) is a major environmental pollutant endangering human health. It can penetrate and deposit deep inside the lungs, initiate a local inflammation or attack remote tissues by translocated particles [1,2]. Epidemiological and toxicological studies have demonstrated that chronic exposure to PM may induce or aggravate a variety of diseases including asthma, stroke, ischemic heart disease, chronic obstructive pulmonary disease, and lung cancer [3,4,5]. PM is an extremely complicated mixture of black carbon, sulfate, nitrate, ammonium, metals, and many organic compounds [6,7]. PM also varies greatly in particle size and surface property. Therefore, although there are numerous studies on the toxic effects of PM, its exact toxic components and the underlying mechanisms are largely unknown.
Meanwhile, nanotechnology is a rapidly growing area with a number of emerging materials. The widespread application of nanoparticles (NPs) in industrial and consumer products raises important concerns about human exposure and health risk [8,9]. Although oral ingestion and dermal absorption are important routes of NPs entry into the body, inhalation exposure is also considered as a common route and has received much attention [10]. NPs can be deposited in the lungs and a part of them can spread into the blood circulation, causing harmful effects on multiple organs and systems. At present, the action mechanisms of NPs include (but are not limited to): generation of reactive oxygen species (ROS) and proinflammatory cytokines, impairment of phagocytosis and biological barriers, alteration of cell cycle regulation and metabolic activity [8,11]. Similarly, there are great variations in shape, composition, and property of NPs, which complicate their toxicity.
Theoretically, NPs with clearer structures and simpler components might be considered as suitable models for investigating the key toxic components and their associations in PM, since the microscopic structures of most PM are aggregates consisting of NPs ranging in size from 40 to 70 nm [12]. For example, Soto et al. [13] used the commercial carbonaceous particles as surrogate materials for combustion PM. Jia et al. [5] used carbon nanocarriers with adsorbed pollutants to study the specific roles of various pollutants in PM2.5, and indicated that Cr(VI) and Pb2+ contributed to PM2.5-induced reduction in cell viability. However, to the best of our knowledge, there is little systematic study on the comparative toxicity of NPs and PM, let alone the underlying mechanisms (similar or different). Therefore, little experimental evidence is available to support such model simplification.
In the present study, we compared the toxic effects of PM and NPs on human lung epithelial A549 cells (target models). Considering the major components of PM, eight manufactured NPs with different compositions, structures, and dimensions were selected, including aluminum oxide nanoparticles (Al2O3 NPs), titanium dioxide nanoparticles (TiO2 NPs), silicon dioxide nanoparticles (SiO2 NPs), iron oxide nanoparticles (FeOx NPs), multi-walled carbon nanotubes (MWCNTs), black carbons (BCs), graphene oxides (GOs), and graphenes. We examined the physicochemical properties of different particles and their toxic effects on cell viability, ROS generation, and adenosine triphosphate (ATP) synthesis, seeking to explore which NPs could be used as suitable surrogates for urban PM, if any.

2. Materials and Methods

2.1. Test Substances

Al2O3 NPs, TiO2 NPs, SiO2 NPs, MWCNTs, BCs, and GOs were purchased from XFNANO Materials Tech Co., Ltd. (Nanjing, China), and graphenes were provided by Strem Chemicals, Inc (Newburyport, MA, USA). FeOx NPs were synthesized using iron (III) chloride hexahydrate (FeCl3·6H2O) according to a mechanochemical method with a few modifications (three times KCl addition) [14]. The urban particulate matter sample (SRM 1648a), obtained from the National Institute of Standards and Technology (NIST), was used as a standard for comparative toxicity evaluation between PM and NPs.
All particles were subjected to the same procedure for characterization. After dispersion in the culture medium by ultrasonication (5 min), number-weighted hydrodynamic diameters and zeta potentials were characterized by dynamic light scattering (DLS, Brookhaven NanoBrook 90Plus PALS, Holtsville, NY, USA) and zeta potential analyzer (Malvern, Zetasizer Nano ZS90, Worcestershire, UK), respectively. The shape, size, and agglomeration status of NP/PM samples were then determined using a field emission scanning electron microscope (FESEM, Hitachi SU8220, Tokyo, Japan).

2.2. Cell Culture and Exposure Conditions

The human lung epithelial cell line A549 was obtained from Nanjing University of Chinese Medicine. The cells were cultured in Minimum Essential Medium (MEM, KeyGEN BioTECH, Nanjing, China) supplemented with 10% fetal bovine serum (FBS, Gibco, Melbourne, Australia), at 37 °C in a humidified atmosphere with 5% CO2. Phosphate Buffer Saline (PBS) and trypsin (0.25%), purchased from KeyGEN BioTECH, Nanjing, China, were also used during cell subculture. At 80% confluence, A549 cells were seeded in 96-well plates (5 × 10³ cells per well) or 6-well plates (5 × 10⁵ cells per well). After incubation overnight, cells were washed with PBS and treated with different concentrations of particles. Dimethyl sulfoxide (DMSO) was used to facilitate the solution of particles, and its final concentrations (0.1%) in the exposure medium showed no measurable effect on our tested endpoints. Stock solutions of particles were diluted with MEM, and ultrasonicated to ensure better dispersion before use. Based on the results of our preliminary experiments, six concentrations of each stimulus were selected for cell viability assay to calculate the concentration that produced 50% of maximal effect (EC50). The nominal concentrations were: Al2O3 NPs (0, 50, 150, 200, 350 and 500 μg/mL), TiO2 NPs (0, 50, 120, 180, 300 and 500 μg/mL), SiO2 NPs (0, 50, 150, 180, 300 and 500 μg/mL), FeOx NPs (0, 0.5, 5, 10, 40 and 100 μg/mL), MWCNTs (0, 20, 40, 100, 150 and 300 μg/mL), BCs (0, 10, 50, 120, 150 and 300 μg/mL), GOs (0, 1, 30, 50, 100 and 125 μg/mL), graphenes (0, 10, 50, 80, 100 and 150 μg/mL), and SRM 1648a (0, 10, 60, 100, 120 and 150 μg/mL). Further, an identical concentration of 50 μg/mL (toxic concentration) and the corresponding EC50 (obtained from cell viability assay) were chosen for ROS and ATP detection.

2.3. Cell Viability Assay

Contrasting effects of PM and NPs on A549 cells were first measured by CCK-8 assay (Cell counting kit-8, Beyotime, Shanghai, China) according to the manufacturer’s guidelines. Briefly, cells were seeded in 96-well plates, incubated overnight, and then exposed to different levels of particles for 24 h. Afterward, 10 μL of CCK-8 solution was added to each well, and the plates were incubated at 37 °C for another 1 h. The absorbance at 450 nm was monitored with a multifunction microplate reader (Molecular Devices SpectraMax-iD3, Sunnyvale, CA, USA). In addition, the interferences of particles on absorbance were reduced by subtracting the absorbance of exposed cells in the exposure medium at 600 nm [15]. Cell viability was calculated by the following equation: cell viability (%) = (A − B)/(C − B) × 100%, where A is the absorbance of the treated cells; B is the absorbance of blank controls (culture medium only); and C is the absorbance of the untreated cells. These experiments were performed in sextuplicate and repeated at least twice.

2.4. ROS Measurement

A peroxide sensitive fluorescent probe, 2′,7′-dichlorofluorescein diacetate (DCFH-DA, Sigma, USA), was used for the assessment of intracellular ROS production. A549 cells were seeded in 6-well plates and incubated overnight. The culture medium was then carefully replaced by the exposure medium containing the designated concentrations of stimuli (0, 50 μg/mL and the calculated EC50 for each stimulus). After 24 h of exposure, the cells were washed with PBS twice, and incubated with 1 mL of DCFH-DA (20 μM) for 25 min at 37 °C. Thereafter, the cells were washed again with PBS, detached with trypsin, and collected by centrifugation (400× g, 2 min). For each sample, at least 5000 cells were analyzed for the corresponding fluorescence with a flow cytometer (Beckman CytoFLEX FCM, Brea, CA, USA) at 488 nm excitation and 525 nm emission. ROS content was expressed as the relative fluorescence of treated cells relative to that of untreated cells. These experiments were performed in triplicate and repeated at least twice.

2.5. ATP Measurement

Effects of NPs and PM on cellular ATP concentrations were detected by the luciferin-luciferase method [16] following the protocol of ATP assay kit (Beyotime, Shanghai, China). Confluent A549 cells were treated with three concentrations of particles (0, 50 μg/mL and the calculated EC50 for each stimulus) in 6-well plates for 24 h. After washing twice with PBS, 200 μL of lysis buffer was added to facilitate ATP release. The suspension was then centrifuged at 400× g for 5 min (4 °C), and 20 μL of the supernatant was mixed with an ATP detection buffer. Luminescence analysis was carried out with a multifunction microplate reader. ATP levels were calculated using the standard curve prepared in a similar manner (10 nM to 3 μM). These experiments were performed in triplicate and repeated at least twice.

2.6. Statistical Analysis

The results were presented as the mean ± standard deviation (SD). Linear interpolation method (ICPIN software, version 2.0, USEPA) was used to calculate the EC50 in the CCK-8 assay. Differences among treatments were analyzed using one-way analysis of variance (ANOVA), with the Duncan post hoc test or with Dunnett’s test where applicable (SPSS version 26.0, IBM company, Armonk, NY, USA). Statistical significance was accepted when p < 0.05.

3. Results

3.1. Characterization of Test Particles

PM and NPs with different physicochemical properties were studied in a comparative way. FESEM images of these nine particles exhibited considerable diversity in their morphologies and agglomeration (Figure 1). Al2O3 NPs, TiO2 NPs, SiO2 NPs, and BCs were near-spherical ranging in size from 10 to 60 nm in diameter, and tended to aggregate to hundreds to thousands of nm. Synthesized FeOx NPs presented a nano-plate structure, while MWCNTs revealed the expected tubular structure of 10 to 50 nm in diameter and 0.5 to 2.0 μm in length (data from manufacturers). Both GOs and graphenes showed a sheet-like morphology; however, different brightness intensities were observed on the GO and graphene flakes, indicating their different thicknesses and surface wrinkles. The PM sample showed an irregular morphology due to its complex composition, with a wide particle size range of 1 to 26 μm.
Table 1 shows the hydrodynamic diameters (0 h and 48 h) and zeta potentials of NP and PM samples. The mean agglomerate diameters (0 h) followed the order of SiO2 NPs < BCs < TiO2 NPs < FeOx NPs < Al2O3 NPs < MWCNTs < GOs < PM < graphenes, and remained relatively constant over 48 h of interaction (p > 0.05), with a few exceptions (TiO2 NPs, SiO2 NPs, and GOs). The results of zeta potentials showed that all particles were negatively charged at pH 7.4 (between −18.8 ± 2.3 mV and −27.6 ± 1.6 mV).

3.2. Cytotoxicity and Intracellular Response

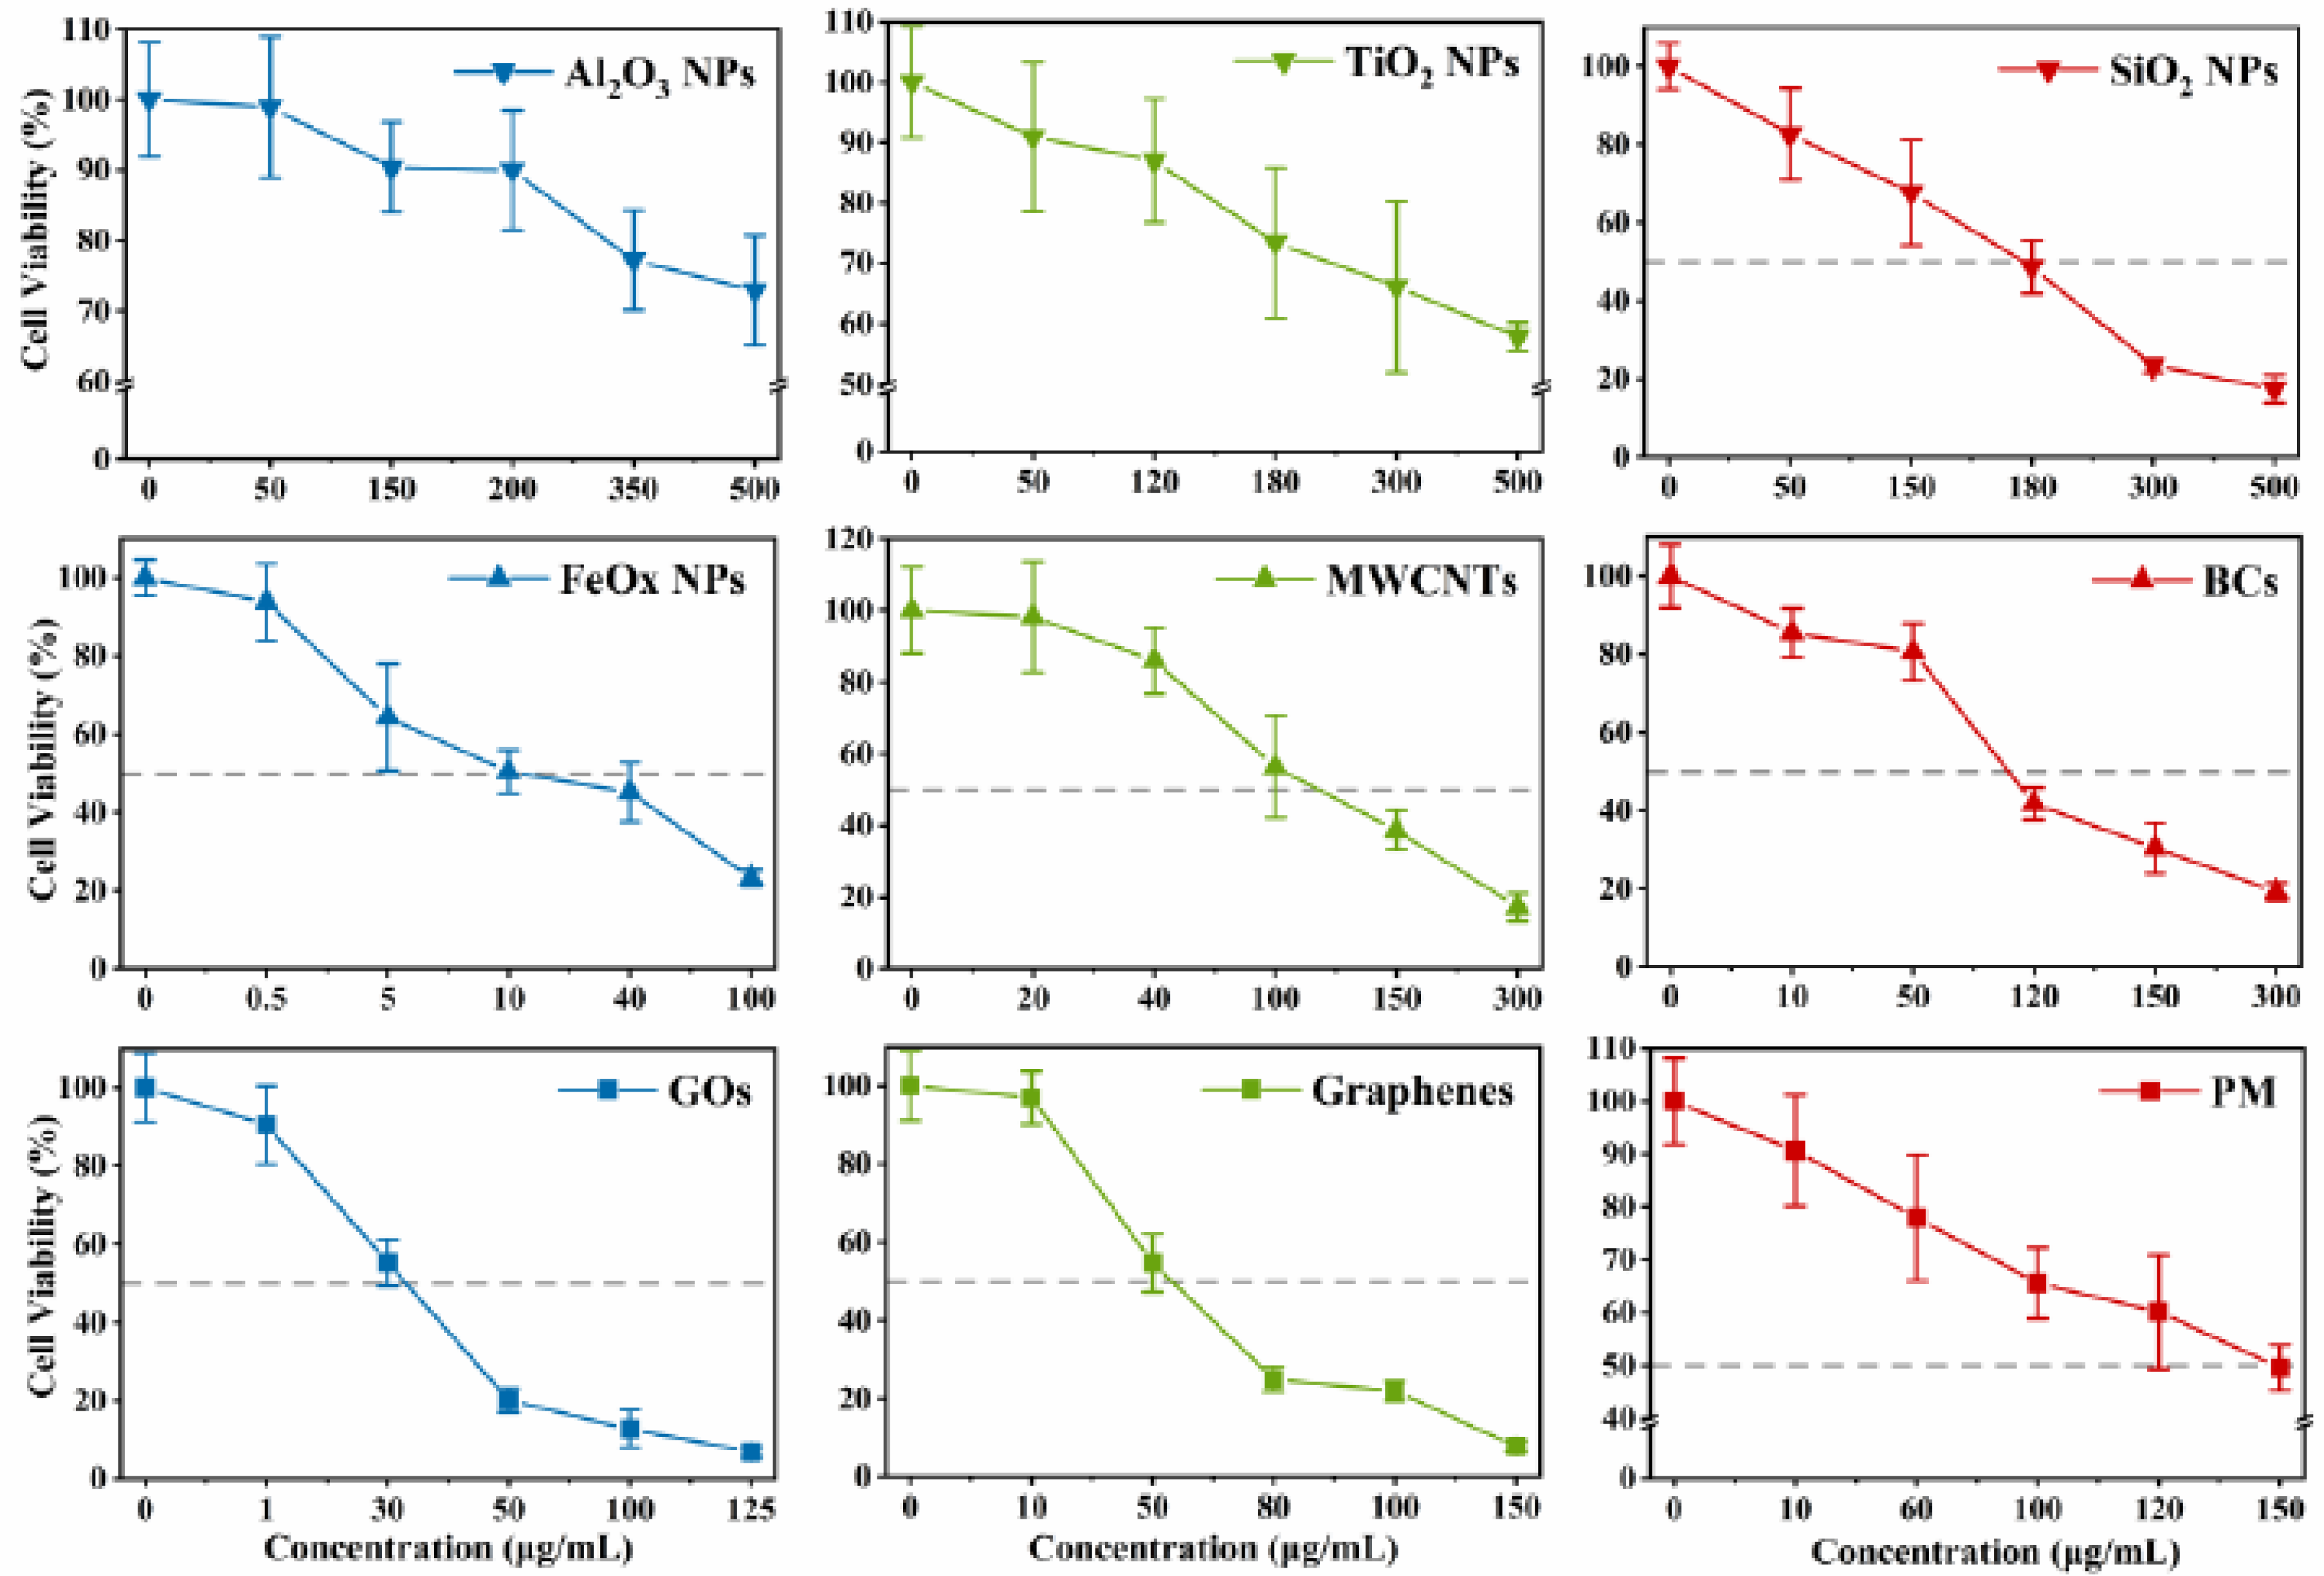
The changes in the viability of A549 cells exposed to different NP/PM concentrations (up to 500 μg/mL) are shown in Figure 2, and the calculated EC50 values for all test particles are shown in Figure 3. Generally, NP/PM exposure decreased A549 cell viability in a dose-dependent manner with different cytotoxicity profiles. The EC50 values of Al2O3 NPs and TiO2 NPs were not available within the concentration ranges tested. When the concentration of Al2O3 NPs and TiO2 NPs was below 350 and 300 μg/mL, respectively, no significant decrease was observed in cell viability, indicating their relatively low cytotoxicity. Based on the obtained EC50 values, SiO2 NPs exhibited the lowest cytotoxicity, while FeOx NPs showed the highest cytotoxicity. The variation in EC50 among the four carbonaceous NPs was large (MWCNTs: 116.3 μg/mL; BCs: 110.3 μg/mL; GOs: 32.0 μg/mL; and graphenes: 55.1 μg/mL), which may be related to their different chemical compositions and structural features. The EC50 value of PM was 148.7 μg/mL, somewhere in between the carbonaceous NPs and metal NPs. Significant differences were observed at 50 µg/mL of SiO2 NPs, FeOx NPs, BCs, GOs, and graphenes compared to controls (p < 0.05). Therefore, we further compared the toxic effects between NPs and PM at two concentrations: the same concentration (50 µg/mL) and different concentrations but having similar effects in cell viability assay (EC50), in the following experiments.
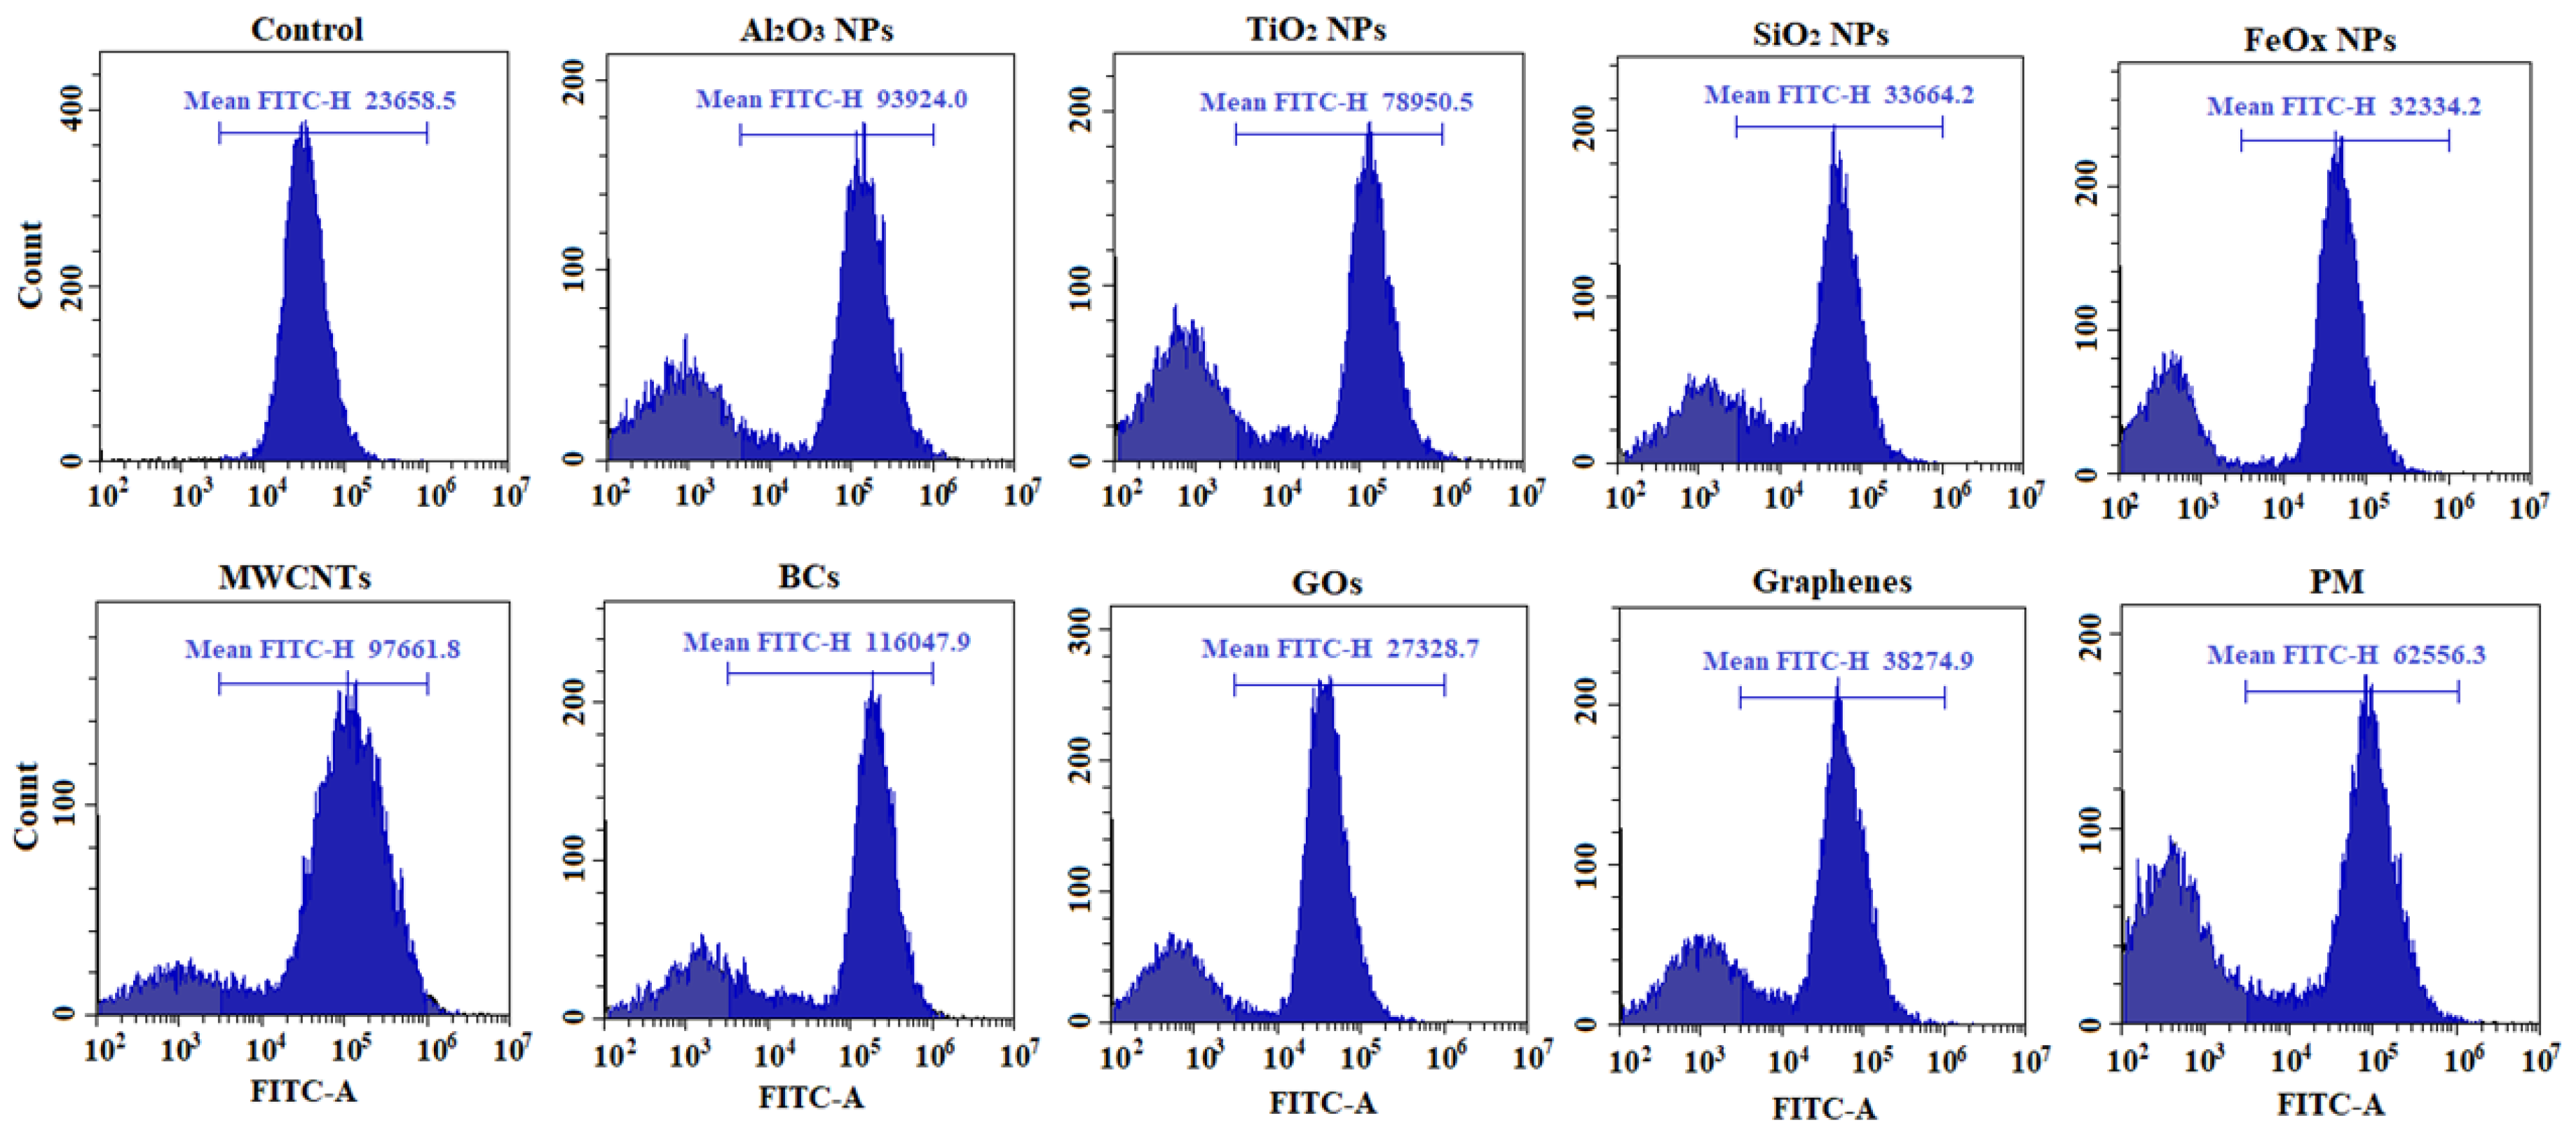
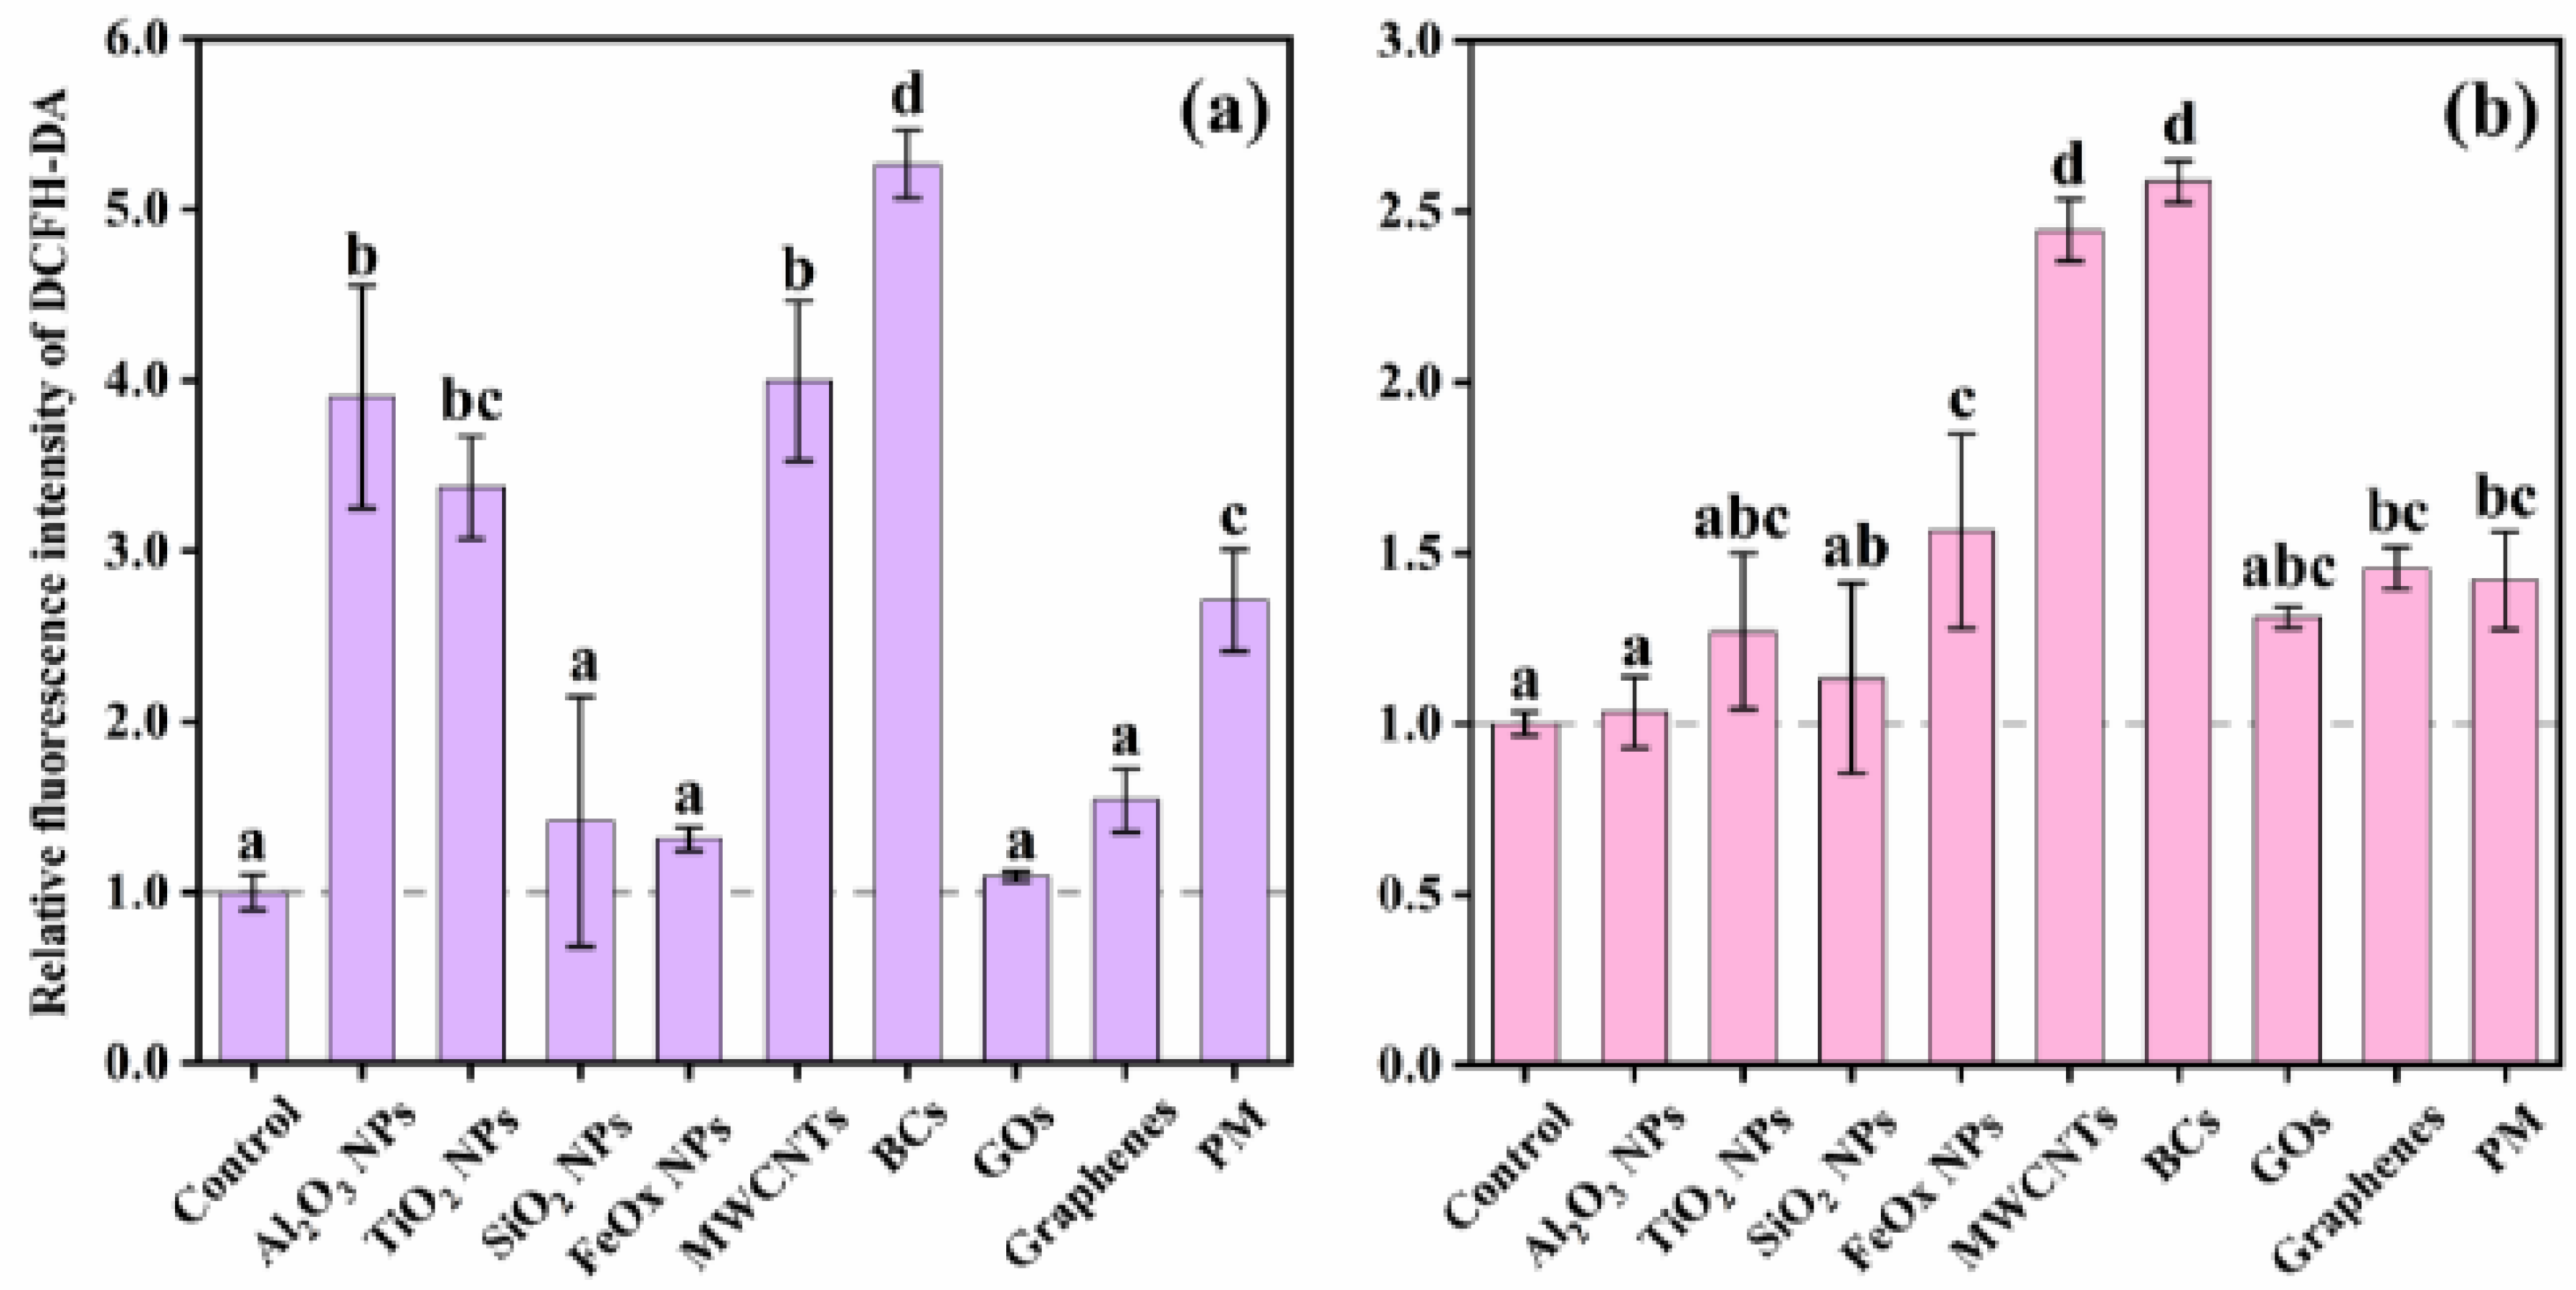
Representative histograms of flow cytometric analysis of ROS production in A549 cells with or without NP/PM exposure are shown in Figure 4, and relative ROS induction at the EC50 for each stimulus is shown in Figure 5a. Although cell viability was reduced to a similar level (50%), ROS production varied greatly and exhibited the following sequence: BCs > MWCNTs > Al2O3 NPs > TiO2 NPs > PM > graphenes > SiO2 NPs > FeOx NPs > GOs. Exposure to the former five led to a statistically significant increase in the intracellular ROS level in comparison to controls, while exposure to the latter four showed comparable or slightly higher ROS generation than those of the controls. Further, comparative effects of nine particles on ROS generation were assessed at a constant concentration of 50 μg/mL (Figure 5b). Similarly, BCs and MWCNTs induced the most amount of ROS (2.6-fold and 2.4-fold, respectively), indicating their strong ability to produce oxidative stress. Additionally, the minimum ROS levels were found in A549 cells upon exposure to Al2O3 NPs, SiO2 NPs, and TiO2 NPs (p < 0.05) at the designated concentration. Different from the results obtained at the EC50, ROS production induced by Al2O3 NPs and TiO2 NPs showed no significant difference with respect to untreated controls, which may be related to the dramatic variation in exposure concentration (500 μg/mL vs. 50 μg/mL). FeOx NPs, graphenes, GOs, and PM caused comparable degrees of oxidative stress response (1.3–1.6 fold). When we combined these two figures, we found that intracellular ROS production induced by PM was similar to that induced by TiO2 NPs. Small variations between two carbonaceous nanomaterials (GOs and graphenes) and PM were observed at the EC50 (1.1–2.7 fold), while these variations were insignificant at the concentration of 50 μg/mL (p < 0.05), which might be explained by the fact that carbonaceous particles are major components in PM.
Mitochondria are one of the major target organelles for excessive ROS. Structural and functional impairment of mitochondria could result in metabolic arrest, and then affect ATP synthesis. Therefore, we determined the levels of ATP in NP/PM-treated cells (Figure 6). As expected, almost all test particles showed damage to mitochondrial function, with varying degrees of ATP inhibition. Particularly, SiO2 NPs had the strongest effects on ATP synthesis (2.8 ± 0.6% at the EC50 and 3.9 ± 0.1% at 50 μg/mL), although these particles did not induce the largest amount of intracellular ROS, indicating that other damage mechanisms might be involved. Consistent with the results of ROS measurement, effects on ATP content inhibited by Al2O3 NPs and TiO2 NPs occurred in a dose-dependent manner that particles at 500 μg/mL revealed a more pronounced inhibition than at 50 μg/mL. There was no statistical difference in the intracellular ATP content between A549 cells treated with carbonaceous particles and PM (EC50: 82.2 ± 13.6% for MWCNTs, 67.5 ± 10.3% for BCs, 85.7 ± 4.2% for GOs, 84.8 ± 14.5% for graphenes, 72.2 ± 9.8% for PM; 50 μg/mL: 83.4 ± 2.0% for MWCNTs, 75.2 ± 11.5% for BCs, 80.1 ± 9.4% for GOs, 87.0 ± 2.6% for graphenes, 85.1 ± 3.0% for PM). The results obtained at these two concentrations again implied their comparable toxic effects.

4. Discussion

PM can penetrate deep into the respiratory tracts, induce epithelial cell damage and disrupt normal lung function [17]. Consistent with our previous study [18], PM exhibited marked toxicity to A549 cells with an EC50 of 148.7 µg/mL. However, the chemical composition, size distribution, and surface structure of PM are extremely complex, not only related to the sources of PM but also to the influences of environmental conditions [5,19]. Consequently, there was notable variation in the EC50 values of ambient PM (in the range of tens to hundreds µg/mL) [5,20]. Moreover, these variations make it difficult to understand the mechanisms of PM-induced toxicity. Simplified models were then proposed to promote the study of PM toxicity.
Chemical-induced toxicity depends firstly on the substance contained therein; thus, surrogate models should ideally have similar constituents as ambient PM. Numerous studies have analyzed the principal components of PM: carbonaceous particles were the dominant component in urban areas characterized by high traffic intensity and combustion emission [21]; silicon was a major component of PM core originated from soil dust and construction activity [22]; metal particles represented another important component of PM, and iron oxide particles were the most abundant species [23]. Therefore, four carbonaceous particles with different morphologies, metal NPs of Fe, Al and Ti, as well as SiO2 NPs, were selected as PM candidates in this study. According to the EC50 values from cell viability assay, the toxic effects of PM were most closely related to those of SiO2 NPs (177.9 μg/mL), MWCNTs (116.3 μg/mL), and BCs (110.3 μg/mL), followed by other carbonaceous particles. These results indicated that SiO2 NPs or carbonaceous NPs might be used as PM cores to study their toxicity. And more attention should be paid to the PM core itself, which might contribute to the majority of PM-induced toxicity directly. Further, it has been reported that metal components in PM contributed to approximately 7.3–22.9% of PM-induced toxicity [18,24], while organic components (e.g., polycyclic aromatic hydrocarbon) might not play important roles in cell toxicity [13]. Because the chemical compositions of PM are extremely complex, PM models adsorbed with varying degrees of substances could facilitate our understanding of their toxic contributions and mechanisms.
Both PM and NPs can affect membrane integrity through direct mechanical action due to their irregular size and/or shape [25,26]. Observed reductions in cell viability may be partly explained by particle damage to cell membranes. In addition, oxidative stress is now well accepted as a major mechanism for the toxic effects of inhaled PM and NPs [8,27]. For one thing, particles can directly induce ROS generation [28]; for another, cellular responses also contribute to oxidative stress upon exposure to particles [29]. Then, elevated ROS levels can cause DNA, protein and membrane damage, leading eventually to cell death/apoptosis [30], which explains part of the suppression of cell viability. Furthermore, particles with multiple sizes and chemical compositions have been shown to be preferentially located in mitochondria. Mechanical action together with oxidative stress result in the destruction of mitochondria [31,32]. Impairment of mitochondrial structure and function initiates a series of cellular reactions, including disruption of metabolic activities and inhibition of ATP synthesis [32]. As expected, our results showed that all nine particles at two concentrations reduced cell viability, increased ROS production, and decreased ATP content to different degrees. ROS generation induced by PM was similar to that induced by TiO2 NPs, as well as two carbonaceous NPs (GOs and graphenes), intracellular ATP content showed no significant difference between carbonaceous NP treatments and PM treatments, again implying their comparable toxic actions. Although SiO2 NPs had similar effects on cell viability compared with PM, they showed contradictory results in ATP inhibition, probably because SiO2 NPs directly caused mitochondrial damage and thus dramatically decreased intracellular ATP content [33]. When we combined our results, we could conclude that carbonaceous NPs (including BCs, MWCNTs, GOs, and graphenes) had similar cytotoxicity and action mechanisms with PM, indicating their potentials as surrogate models for PM.
Apart from material compositions, physicochemical properties of particles have been considered as important factors governing their toxic effects, such as size distribution [34], particle shape [35], aggregation state [36], and surface charge [37]. Generally, NPs with smaller sizes and larger surface areas are expected to have higher toxicity [38]. The same is true for atmospheric particles, despite the fact that finer particles contained higher amounts of inorganic and organic pollutants [19]. Although spherical particles are preferentially taken up into cells, the geometry of non-spherical particles have been hypothesized to cause higher toxicity because of their damage to cell membrane and cellular structure [39,40]. An observational study in urban areas characterized carbonaceous PM and reported two different morphologies: chains of spherules with dimensions up to 2 μm and aggregated spherules with diameters between 360 nm and 4 μm [12]. Irregular-shaped plates ranging in size from 1 to 26 μm were also observed in this study. PM is very different in size and shape. Thus, it is desirable to mimic the toxicity of PM using two or more carbonaceous NPs. Carbonaceous NPs used in this study (except for BCs) were micrometer-scale particles in at least one dimension, and they might agglomerate in solution. Therefore, hydrodynamic diameters of PM were comparable to those of carbonaceous NPs. In addition, both PM and NPs were negatively-charged, which could be absorbed onto the positively-charged lipids in cell membrane [41]. Considering the complexity of PM properties and their similarity with carbonaceous NPs, we hypothesize that a mixture of carbonaceous NPs may be a more suitable surrogate for PM, yet the detailed formula deserves further investigation.

5. Conclusions

Our study provided experimental evidences that carbonaceous NPs could be used as surrogate models to study the toxic mechanisms of PM. NPs and PM reduced cell viability, increased ROS production, and decreased ATP content to varying extents. The reduction in cell viability caused by PM was almost equivalent to that caused by SiO2 NPs, followed by four carbonaceous NPs. Small variations in ROS generation and ATP inhibition were also observed between carbonaceous NPs and PM. However, SiO2 NPs had the strongest negative effects on ATP synthesis, which may be explained by their direct damage to mitochondria. These results indicated that PM-induced toxicity depended greatly on its components. Considering the fact that toxic effects of PM resided somewhere among several carbonaceous NPs, further experiments should be performed to develop suitable carbonaceous NP mixture models for urban PM.

Author Contributions

Conceptualization, Y.W. (Yun Wu); formal analysis, M.W., Y.G., D.N., and Z.X.; Funding acquisition, M.C.; investigation, Y.G., D.N., Z.X., and Y.W. (Yue Wu); methodology, Y.W. (Yun Wu) and M.W.; project administration, M.C.; resources, S.L.; supervision, X.G.; validation, M.W. and S.L.; writing—original draft, Y.W. (Yue Wu) and M.W.; writing—review and editing, X.G. All authors have read and agreed to the published version of the manuscript.

Funding

This research was funded by the National Natural Science Foundation of China, grant number 21976093, 21976094, 41877337, 41601090; and the China Postdoctoral Science Foundation, grant number 2019M661790.

Institutional Review Board Statement

Not applicable.

Informed Consent Statement

Not applicable.

Data Availability Statement

“MDPI Research Data Policies” at https://www.mdpi.com/ethics.

Conflicts of Interest

The authors declare no conflict of interest.

References

  1. Seaton, A.; Godden, D.; MacNee, W.; Donaldson, K. Particulate air pollution and acute health effects. Lancet 1995, 345, 176–178. [Google Scholar] [CrossRef]
  2. Nemmar, A.; Vanbilloen, H.; Hoylaerts, M.F.; Hoet, P.H.M.; Verbruggen, A.; Nemery, B. Passage of Intratracheally Instilled Ultrafine Particles from the Lung into the Systemic Circulation in Hamster. Am. J. Respir. Crit. Care Med. 2001, 164, 1665–1668. [Google Scholar] [CrossRef] [PubMed]
  3. Nie, D.; Chen, M.; Wu, Y.; Ge, X.; Hu, J.; Zhang, K.; Ge, P. Characterization of Fine Particulate Matter and Associated Health Burden in Nanjing. Int. J. Environ. Res. Public Health 2018, 15, 602. [Google Scholar] [CrossRef] [PubMed] [Green Version]
  4. Guo, C.; Zhang, Z.; Lau, A.K.H.; Lin, C.Q.; Chuang, Y.C.; Chan, J.; Jiang, W.K.; Tam, T.; Yeoh, E.-K.; Chan, T.-C.; et al. Effect of long-term exposure to fine particulate matter on lung function decline and risk of chronic obstructive pulmonary disease in Taiwan: A longitudinal, cohort study. Lancet Planet. Health 2018, 2, e114–e125. [Google Scholar] [CrossRef]
  5. Jia, J.; Yuan, X.; Peng, X.; Yan, B. Cr(VI)/Pb2+ are responsible for PM2.5-induced cytotoxicity in A549 cells while pulmonary surfactant alleviates such toxicity. Ecotoxicol. Environ. Saf. 2019, 172, 152–158. [Google Scholar] [CrossRef]
  6. Di, A.; Wu, Y.; Chen, M.; Nie, D.; Ge, X. Chemical Characterization of Seasonal PM2.5 Samples and Their Cytotoxicity in Human Lung Epithelial Cells (A549). Int. J. Environ. Res. Public Health 2020, 17, 4599. [Google Scholar] [CrossRef]
  7. Badaloni, C.; Cesaroni, G.; Cerza, F.; Davoli, M.; Brunekreef, B.; Forastiere, F. Effects of long-term exposure to particulate matter and metal components on mortality in the Rome longitudinal study. Environ. Int. 2017, 109, 146–154. [Google Scholar] [CrossRef]
  8. Nel, A.E.; Xia, T.; Mädler, L.; Li, N. Toxic Potential of Materials at the Nanolevel. Science 2006, 311, 622–627. [Google Scholar] [CrossRef] [Green Version]
  9. Kong, B.; Seog, J.H.; Graham, L.M.; Lee, S.B. Experimental considerations on the cytotoxicity of nanoparticles. Nanomedcine 2011, 6, 929–941. [Google Scholar] [CrossRef] [Green Version]
  10. Li, J.J.; Muralikrishnan, S.; Ng, C.-T.; Yung, L.-Y.L.; Bay, B.-H. Nanoparticle-induced pulmonary toxicity. Exp. Biol. Med. 2010, 235, 1025–1033. [Google Scholar] [CrossRef]
  11. Khan, W.; Godugu, C. Cytotoxicity of Nanomaterials: Using Nanotoxicology to Address the Safety Concerns of Nanoparticles. Pharm. Nanotechnol. 2018, 6, 3–16. [Google Scholar] [CrossRef]
  12. Fanizza, C.; De Berardis, B.; Ietto, F.; Soggiu, M.E.; Schirò, R.; Inglessis, M.; Ferdinandi, M.; Incoronato, F. Analysis of major pollutants and physico-chemical characteristics of PM2.5 at an urban site in Rome. Sci. Total Environ. 2018, 1457–1468. [Google Scholar] [CrossRef] [PubMed]
  13. Soto, K.; Garza, K.; Shi, Y.; Murr, L.E. Direct contact cytotoxicity assays for filter-collected, carbonaceous (soot) nanoparticulate material and observations of lung cell response. Atmos. Environ. 2008, 42, 1970–1982. [Google Scholar] [CrossRef]
  14. Lu, J.; Yang, S.; Ng, K.M.; Su, C.-H.; Yeh, C.-S.; Wu, Y.-N.; Shieh, D.-B. Solid-state synthesis of monocrystalline iron oxide nanoparticle based ferrofluid suitable for magnetic resonance imaging contrast application. Nanotechnology 2006, 17, 5812–5820. [Google Scholar] [CrossRef]
  15. Gong, C.; Tao, G.; Yang, L.; Liu, J.; He, H.; Zhuang, Z. The role of reactive oxygen species in silicon dioxide nanoparticle-induced cytotoxicity and DNA damage in HaCaT cells. Mol. Biol. Rep. 2011, 39, 4915–4925. [Google Scholar] [CrossRef] [PubMed]
  16. John, J. Determination of ATP in chlorella with the luciferin-luciferase enzyme system. Anal. Biochem. 1970, 37, 409–416. [Google Scholar] [CrossRef]
  17. Kouassi, K.S.; Billet, S.; Garã§on, G.; Verdin, A.; Diouf, A.; Cazier, F.; Djaman, J.; Courcot, D.; Shirali, P. Oxidative damage induced in A549 cells by physically and chemically characterized air particulate matter (PM2.5) collected in Abidjan, CÃ’te d’Ivoire. J. Appl. Toxicol. 2009, 30, 310–320. [Google Scholar] [CrossRef]
  18. Yuan, Y.; Wu, Y.; Ge, X.; Nie, D.; Wang, M.; Zhou, H.; Chen, M. In vitro toxicity evaluation of heavy metals in urban air particulate matter on human lung epithelial cells. Sci. Total. Environ. 2019, 678, 301–308. [Google Scholar] [CrossRef]
  19. Guan, L.; Rui, W.; Bai, R.; Zhang, W.; Zhang, F.; Ding, W. Effects of Size-Fractionated Particulate Matter on Cellular Oxidant Radical Generation in Human Bronchial Epithelial BEAS-2B Cells. Int. J. Environ. Res. Public Health 2016, 13, 483. [Google Scholar] [CrossRef] [Green Version]
  20. Zhang, Y.; Darland, D.C.; He, Y.; Yang, L.; Dong, X.; Chang, Y. Reduction of PM2.5 toxicity on human alveolar epithelial cells A549 by tea polyphenols. J. Food Biochem. 2018, 42, e12496. [Google Scholar] [CrossRef]
  21. Baulig, A.; Poirault, J.-J.; Ausset, P.; Schins, R.; Shi, T.; Baralle, D.; Dorlhene, P.; Meyer, M.; Lefevre, R.; Baeza-Squiban, A.; et al. Physicochemical Characteristics and Biological Activities of Seasonal Atmospheric Particulate Matter Sampling in Two Locations of Paris. Environ. Sci. Technol. 2004, 38, 5985–5992. [Google Scholar] [CrossRef] [PubMed]
  22. Matassoni, L.; Pratesi, G.; Centioli, D.; Cadoni, F.; Lucarelli, F.; Nava, S.; Malesani, P. Saharan dust contribution to PM10, PM2.5 and PM1 in urban and suburban areas of Rome: A comparison between single-particle SEM-EDS analysis and whole-sample PIXE analysis. J. Environ. Monit. 2011, 13, 732–742. [Google Scholar] [CrossRef] [PubMed]
  23. Smith, S.; Ward, M.; Lin, R.; Brydson, R.; Dall’Osto, M.; Harrison, R.M. Comparative study of single particle characterisation by Transmission Electron Microscopy and time-of-flight aerosol mass spectrometry in the London atmosphere. Atmos. Environ. 2012, 62, 400–407. [Google Scholar] [CrossRef]
  24. Jin, L.; Xie, J.; Wong, C.K.-C.; Chan, S.K.Y.; Abbaszade, G.; Schnelle-Kreis, J.; Zimmermann, R.; Li, J.; Zhang, G.; Fu, P.; et al. Contributions of City-Specific Fine Particulate Matter (PM2.5) to Differential In Vitro Oxidative Stress and Toxicity Implications between Beijing and Guangzhou of China. Environ. Sci. Technol. 2019, 53, 2881–2891. [Google Scholar] [CrossRef] [PubMed]
  25. Zou, Y.; Jin, C.; Su, Y.; Li, J.; Zhu, B. Water soluble and insoluble components of urban PM2.5 and their cytotoxic effects on epithelial cells(A549) in vitro. Environ. Pollut. 2016, 212, 627–635. [Google Scholar] [CrossRef] [PubMed]
  26. Buchman, J.T.; Hudson-Smith, N.V.; Landy, K.M.; Haynes, C.L. Understanding Nanoparticle Toxicity Mechanisms To Inform Redesign Strategies To Reduce Environmental Impact. Accounts Chem. Res. 2019, 52, 1632–1642. [Google Scholar] [CrossRef]
  27. Kim, W.; Jeong, S.-C.; Shin, C.-Y.; Song, M.-K.; Cho, Y.; Lim, J.-H.; Gye, M.C.; Ryu, J.-C. A study of cytotoxicity and genotoxicity of particulate matter (PM2.5) in human lung epithelial cells (A549). Mol. Cell. Toxicol. 2018, 14, 163–172. [Google Scholar] [CrossRef]
  28. Xia, T.; Kovochich, M.; Brant, J.; Hotze, M.; Sempf, J.; Oberley, T.; Sioutas, C.; Yeh, J.I.; Wiesner, M.R.; Nel, A.E. Comparison of the Abilities of Ambient and Manufactured Nanoparticles to Induce Cellular Toxicity According to an Oxidative Stress Paradigm. Nano Lett. 2006, 6, 1794–1807. [Google Scholar] [CrossRef]
  29. Li, N.; Xia, T.; Nel, A.E. The role of oxidative stress in ambient particulate matter-induced lung diseases and its implications in the toxicity of engineered nanoparticles. Free. Radic. Biol. Med. 2008, 44, 1689–1699. [Google Scholar] [CrossRef] [Green Version]
  30. Simon, H.-U.; Haj-Yehia, A.; Levi-Schaffer, F. Role of reactive oxygen species (ROS) in apoptosis induction. Apoptosis 2000, 5, 415–418. [Google Scholar] [CrossRef]
  31. Oberdörster, G.; Oberdörster, E.; Oberdörster, J. Nanotoxicology: An Emerging Discipline Evolving from Studies of Ultrafine Particles. Environ. Health Perspect. 2005, 113, 823–839. [Google Scholar] [CrossRef] [PubMed]
  32. Asharani, P.V.; Mun, G.L.K.; Hande, M.P.; Valiyaveettil, S. Cytotoxicity and Genotoxicity of Silver Nanoparticles in Human Cells. ACS Nano 2009, 3, 279–290. [Google Scholar] [CrossRef] [PubMed]
  33. Sun, L.; Li, Y.; Liu, X.; Jin, M.; Zhang, L.; Du, Z.; Guo, C.; Huang, P.; Sun, Z. Cytotoxicity and mitochondrial damage caused by silica nanoparticles. Toxicol. Vitr. 2011, 25, 1619–1629. [Google Scholar] [CrossRef] [PubMed]
  34. Lu, Y.; Su, S.; Jin, W.; Wang, B.; Li, N.; Shen, H.; Li, W.; Huang, Y.; Chen, H.; Zhang, Y.; et al. Characteristics and cellular effects of ambient particulate matter from Beijing. Environ. Pollut. 2014, 191, 63–69. [Google Scholar] [CrossRef] [PubMed]
  35. Carnovale, C.; Bryant, G.; Shukla, R.; Bansal, V. Identifying Trends in Gold Nanoparticle Toxicity and Uptake: Size, Shape, Capping Ligand, and Biological Corona. ACS Omega 2019, 4, 242–256. [Google Scholar] [CrossRef] [Green Version]
  36. Duch, M.C.; Budinger, G.R.S.; Liang, Y.T.; Soberanes, S.; Urich, D.; Chiarella, S.E.; Campochiaro, L.A.; Gonzalez, A.; Chandel, N.S.; Hersam, M.C.; et al. Minimizing Oxidation and Stable Nanoscale Dispersion Improves the Biocompatibility of Graphene in the Lung. Nano Lett. 2011, 11, 5201–5207. [Google Scholar] [CrossRef] [Green Version]
  37. Karakoti, A.S.; Hench, L.L.; Seal, S. The potential toxicity of nanomaterials—The role of surfaces. JOM 2006, 58, 77–82. [Google Scholar] [CrossRef]
  38. Tedesco, S.; Doyle, H.; Blasco, J.; Redmond, G.; Sheehan, D. Exposure of the blue mussel, Mytilus edulis, to gold nanoparticles and the pro-oxidant menadione. Comp. Biochem. Physiol. Part C Toxicol. Pharmacol. 2010, 151, 167–174. [Google Scholar] [CrossRef]
  39. Van Dong, P.; Ha, C.H.; Binh, L.T.; Kasbohm, J. Chemical synthesis and antibacterial activity of novel-shaped silver nanoparticles. Int. Nano Lett. 2012, 2, 9. [Google Scholar] [CrossRef] [Green Version]
  40. Saha, S.; Malik, M.; Qureshi, M. Study of Synergistic Effects of Antibiotics And Triangular Shaped Silver Nanoparticles, Synthesized Using UV-Light Irradiation, on S. Aureus and P. Aeruginosa. Mater. Today Proc. 2019, 18, 920–927. [Google Scholar] [CrossRef]
  41. Zhou, Q.; Wang, L.; Cao, Z.; Zhou, X.; Yang, F.; Fu, P.; Wang, Z.; Hu, J.; Ding, L.; Jiang, W. Dispersion of atmospheric fine particulate matters in simulated lung fluid and their effects on model cell membranes. Sci. Total. Environ. 2016, 542, 36–43. [Google Scholar] [CrossRef] [PubMed]
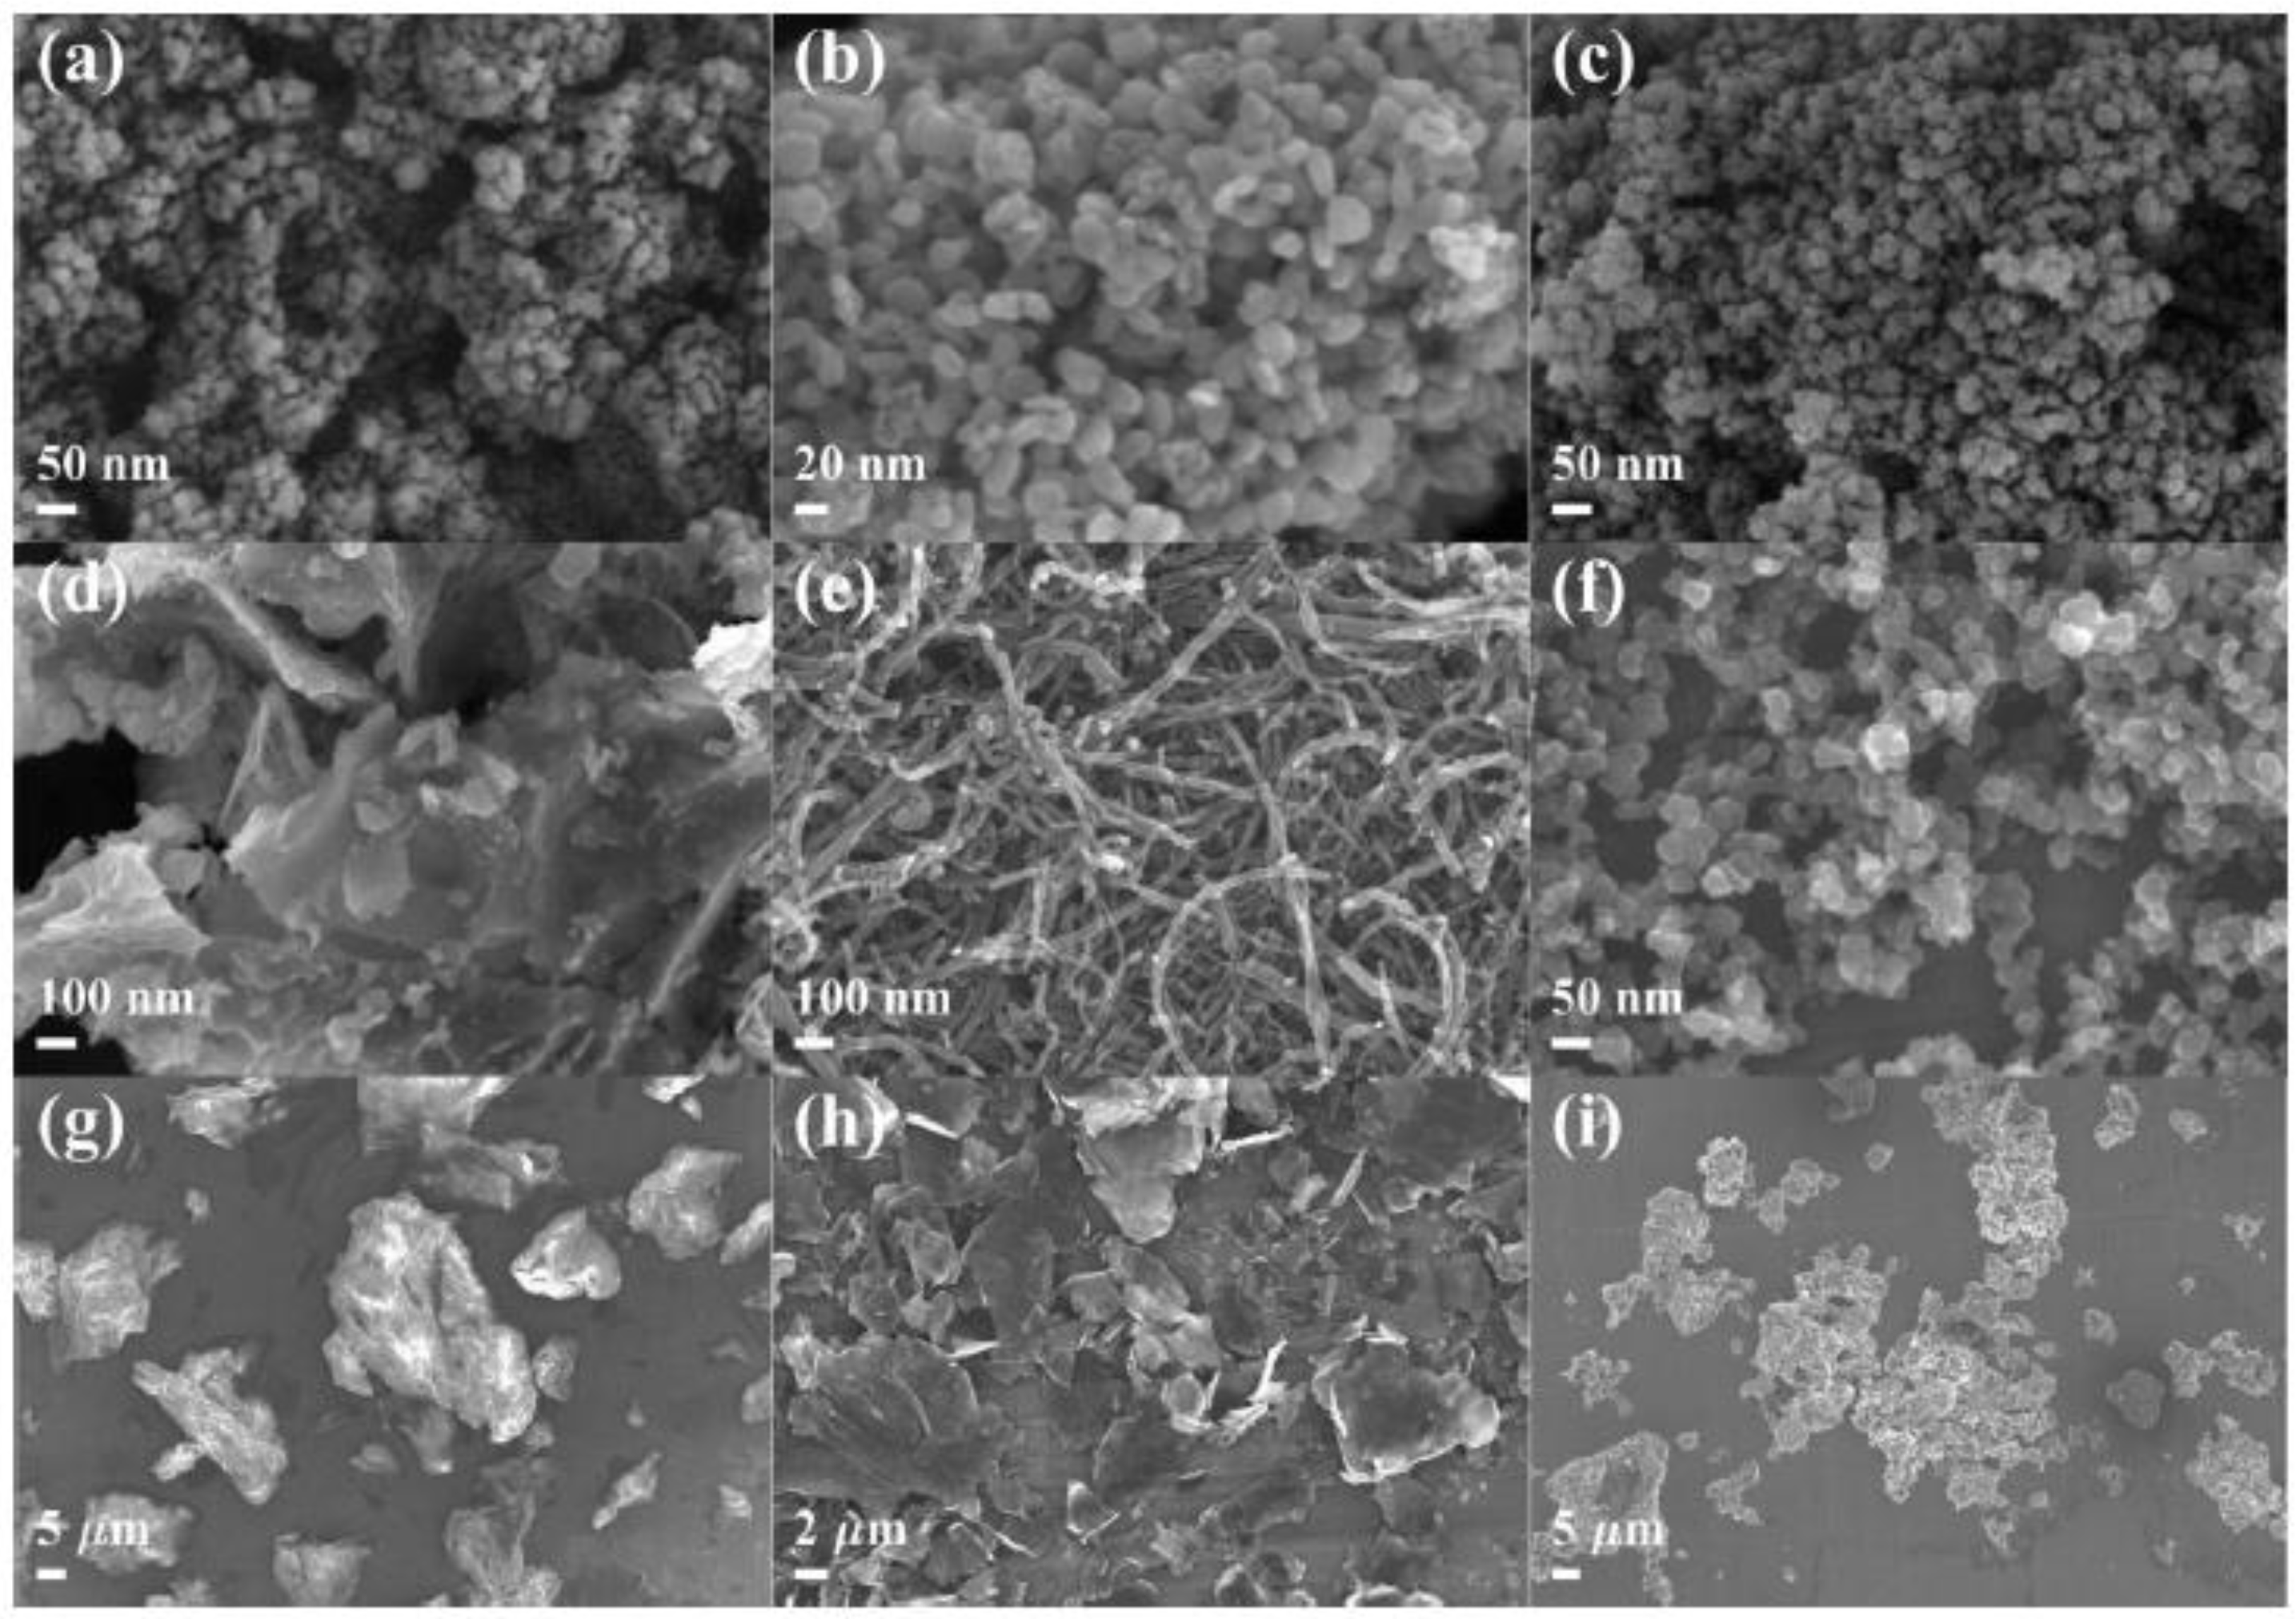
Figure 1. Typical field emission scanning electron microscope (FESEM) images of aluminum oxide nanoparticles (Al2O3 NPs) (a), titanium dioxide nanoparticles (TiO2 NPs) (b), silicon dioxide nanoparticles (SiO2 NPs) (c), iron oxide nanoparticles (FeOx NPs) (d), multi-walled carbon nanotubes (MWCNTs) (e), black carbons (BCs) (f), graphene oxides (GOs) (g), graphenes (h), and particulate matter (PM) (i).
Ijerph 18 00022 g001
Figure 2. The changes in the viability of A549 cells exposed to different NPs and PM. Data are mean ± SD (n = 12).
Ijerph 18 00022 g002
Figure 3. The calculated EC50 values of nine test particles. “NA” means not available.
Ijerph 18 00022 g003
Figure 4. Representative histograms of flow cytometric analysis of reactive oxygen species (ROS) production in A549 cells with or without NP/PM exposure. The exposure concentrations (EC50) were 177.9 μg/mL for SiO2 NPs, 11.3 μg/mL for FeOx NPs, 116.3 μg/mL for MWCNTs, 110.3 μg/mL for BCs, 32.0 μg/mL for GOs, 55.1 μg/mL for graphenes, and 148.7 μg/mL for PM. The concentration of 500 μg/mL was used here for Al2O3 NPs and TiO2 NPs. Mean FITC-H values (yellow-green fluorescence) were used to calculate the relative ROS levels.
Ijerph 18 00022 g004
Figure 5. Generation of reactive oxygen species (ROS) in A549 cells upon exposure to NPs and PM at the calculated EC50 (a) and a constant toxic concentration of 50 μg/mL (b). The EC50 values were 177.9 μg/mL for SiO2 NPs, 11.3 μg/mL for FeOx NPs, 116.3 μg/mL for MWCNTs, 110.3 μg/mL for BCs, 32.0 μg/mL for GOs, 55.1 μg/mL for graphenes, and 148.7 μg/mL for PM. The concentration of 500 μg/mL was used here for Al2O3 NPs and TiO2 NPs. Values for each stimulus sharing no common letters (a, b, c and d) were significantly different in the same experiment (p < 0.05, Duncan post hoc multiple comparisons). Data are mean ± SD (n = 6).
Ijerph 18 00022 g005
Figure 6. Changes in adenosine triphosphate (ATP) levels upon exposure to NPs and PM at the calculated EC50 (a) and a constant toxic concentration of 50 μg/mL (b). The EC50 values were 177.9 μg/mL for SiO2 NPs, 11.3 μg/mL for FeOx NPs, 116.3 μg/mL for MWCNTs, 110.3 μg/mL for BCs, 32.0 μg/mL for GOs, 55.1 μg/mL for graphenes, and 148.7 μg/mL for PM. The concentration of 500 μg/mL was used here for Al2O3 NPs and TiO2 NPs. Values for each stimulus sharing no common letters (a, b, c and d) were significantly different in the same experiment (p < 0.05, Duncan post hoc multiple comparisons). Data are mean ± SD (n = 6).
Ijerph 18 00022 g006
Table 1. Properties of the test particles.
ParticlesPrimary Particle SizeHydrodynamic Diameter (μm)Zeta Potential (mV)
pH = 7.4
Provided by the ManufacturersFESEM Images0 h48 h
Al2O3 NPs10–15 nm14–60 nm2.2 ± 0.22.4 ± 0.2−19.5 ± 2.7
TiO2 NPs15–25 nm15–45 nm1.4 ± 0.14.7 ± 1.2−23.9 ± 1.4
SiO2 NPs20 nm13–47 nm0.8 ± 0.11.4 ± 0.1−21.3 ± 0.5
FeOx NPs0.2–7.6 μm2.0 ± 0.11.9 ± 0.0−22.5 ± 1.3
MWCNTs30–50 nm in diameter;
0.5–2.0 μm in length
10–50 nm in diameter8.5 ± 1.38.2 ± 2.1−21.4 ± 1.2
BCs30–45 nm10–60 nm1.0 ± 0.11.1 ± 0.1−26.6 ± 1.0
GOs2–55 μm11.9 ± 0.428.3 ± 0.7−18.9 ± 1.3
Graphenes6–8 nm in thickness; 5 μm in width1–12 μm13.2 ± 0.111.7 ± 3.0−27.6 ± 1.6
PM5.85 μm1–26 μm12.6 ± 0.214.7 ± 3.1−18.8 ± 2.3
Publisher’s Note: MDPI stays neutral with regard to jurisdictional claims in published maps and institutional affiliations.