1. Introduction
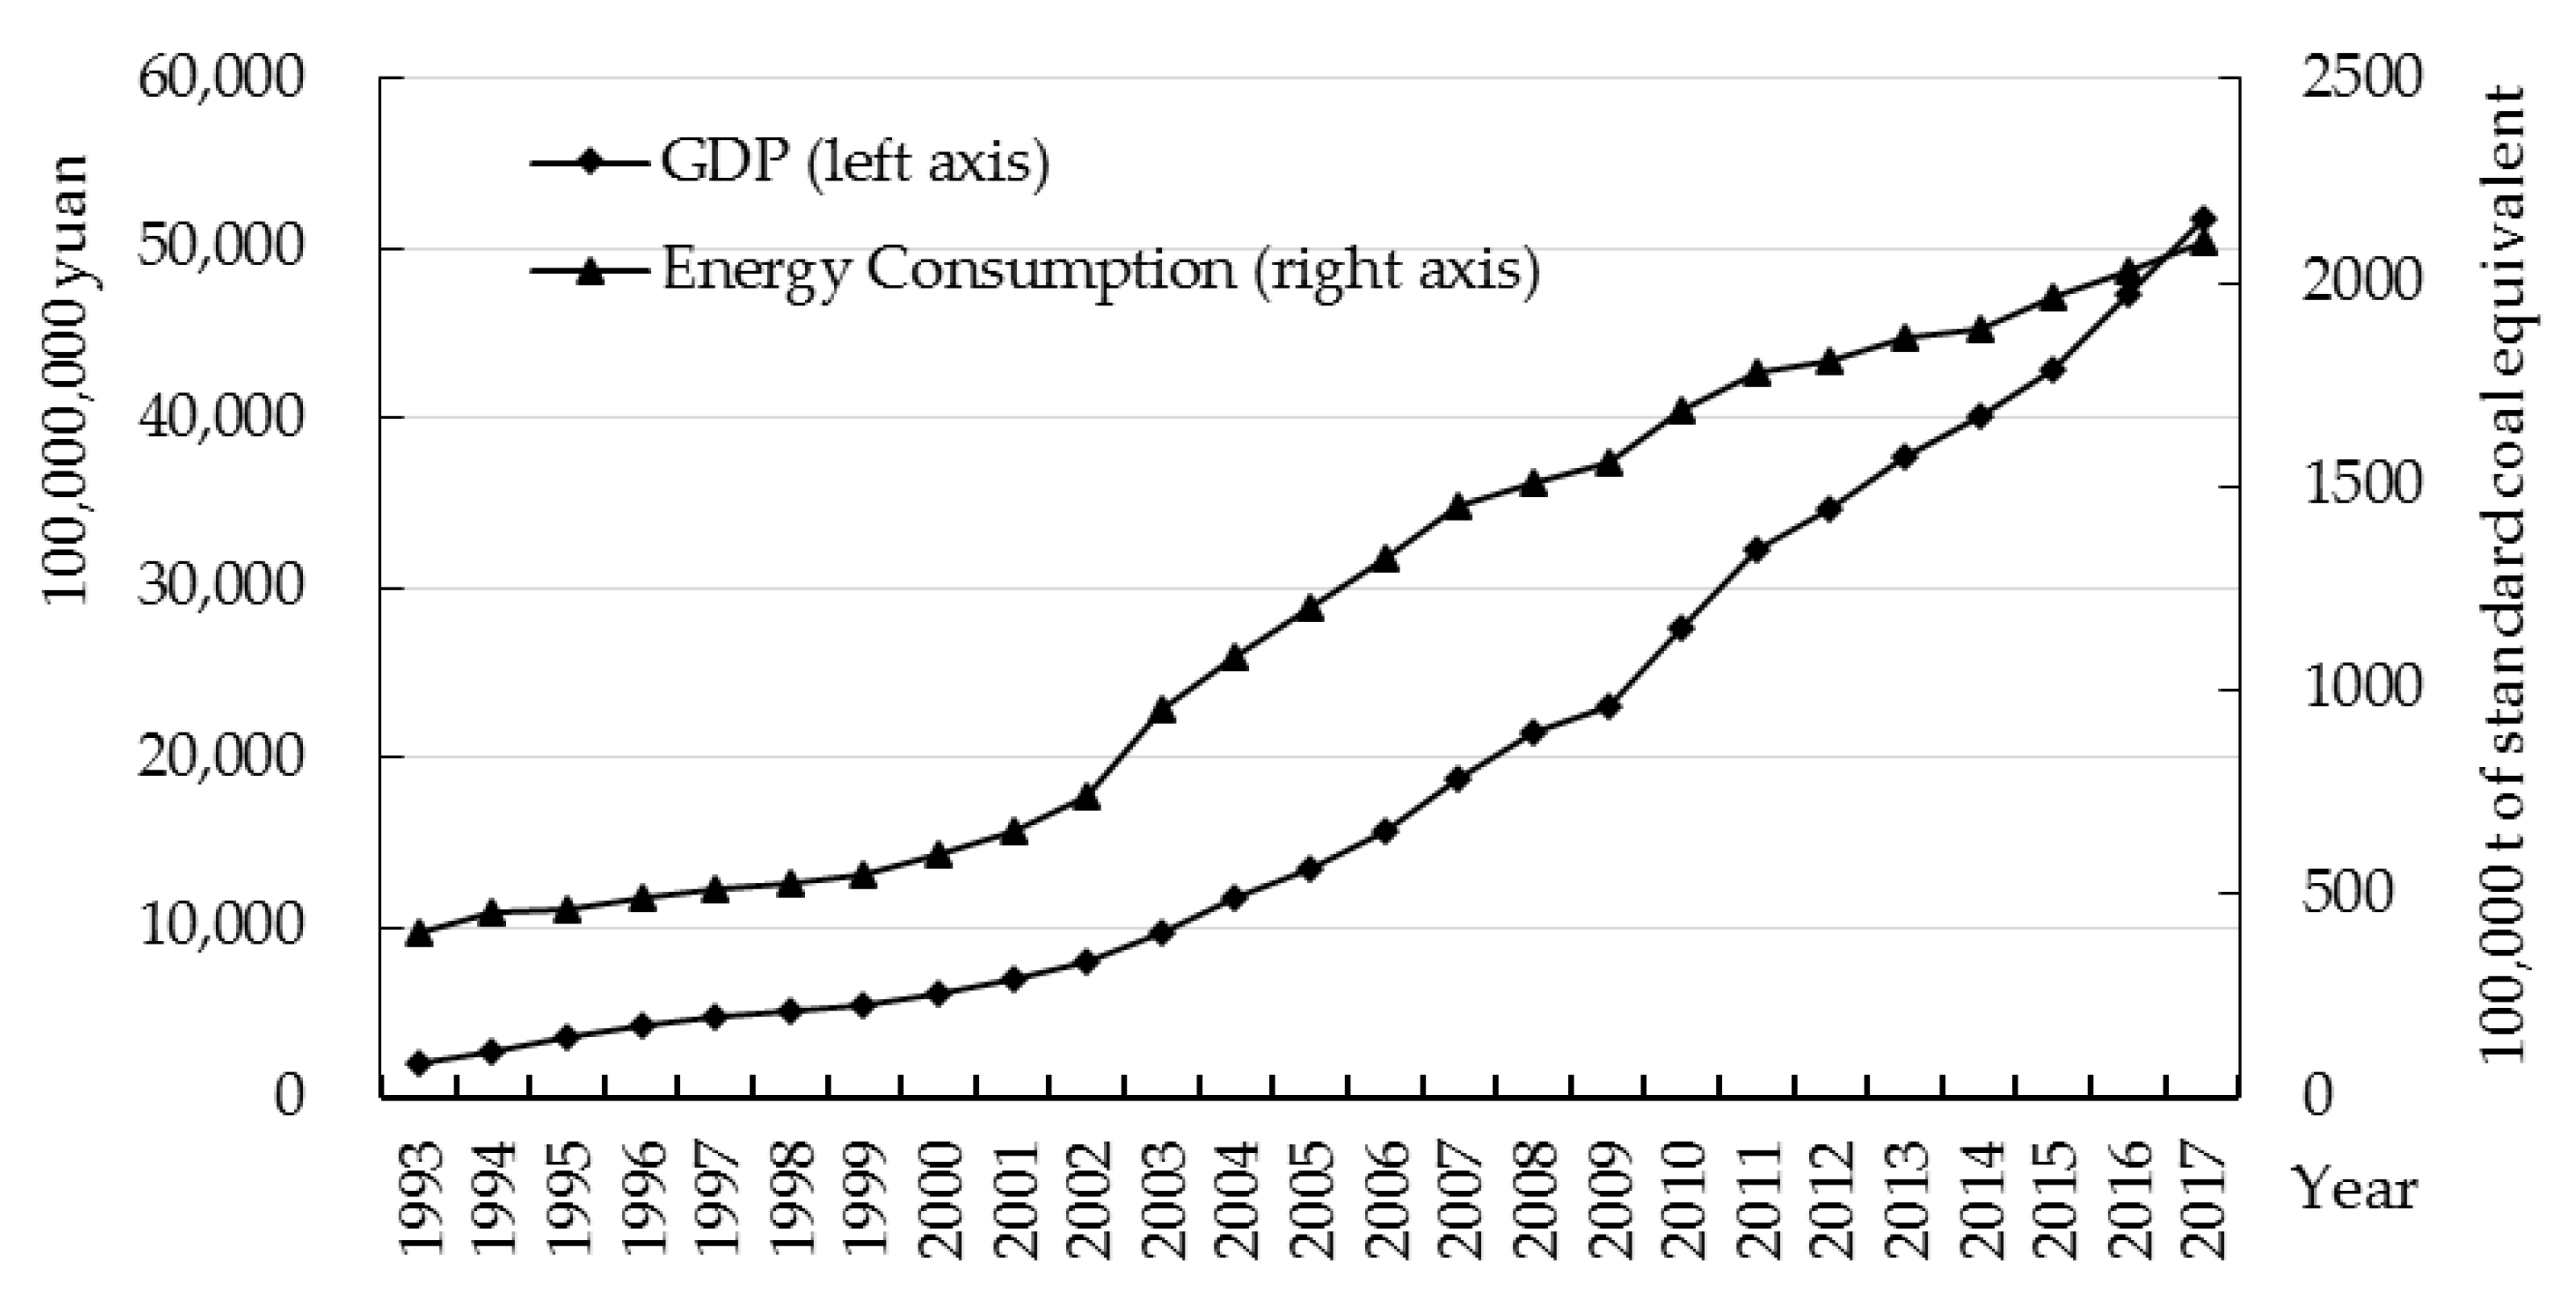
Since the start of the 40 years of the period of reform and the policy of opening up, China has persisted in making active use of foreign capital. China’s FDI flow and the volume of GDP have risen dramatically. At the same time, energy consumption has seen a significant increase. China has become the world’s largest energy consumer, accounting for 23.2% of global energy consumption and 33.6% of global energy consumption growth. The traditional economic development remains highly energy-intensive, with high energy consumption, high pollution, and high emissions. With rapid economic growth, the inefficient use of resources and increasing environmental pollution have caused extensive damage to the environment. To solve this problem, China needs to shift to high quality and sustainable growth, with a high-end industrial chain, high quality economic development, and efficient operation transformation. “Clear waters and green mountains are as good as mountains of gold and silver.” President Xi Jinping made this dialectic notion in his speech while he held office in Zhejiang. In China’s 13th Five-Year Plan, the Chinese government aims to reduce energy intensity by a total of 15% from 2016 to 2020. Chinese Premier Li Keqiang reported that China’s energy intensity fell by 5% in 2016 at China’s National People’s Congress. Therefore, exploring the relationship among economic growth, energy consumption, and Foreign Direct Investment (FDI) will help us to understand how the China’s economy shifts from the old equilibrium to the new equilibrium.
FDI is an important factor for rapid economic growth in China. Since the early 1990s, China has become one of the largest recipients of FDI among the developing countries. Neoclassical growth theory outlines the three factors necessary for a growing economy. These are labor, capital, and technology. The relationship between capital and labor of an economy determines its output. Technology is thought to augment labor productivity and increase the output capabilities of labor. New institutional economics incorporates the theory of institutions—laws, rules, customs, and norms—into economics. It builds on, modifies, and extends neoclassical theory. It believes the institutions play an important role in economic development. FDI inflow can promote economic development for a developing region or country. First, FDI improves the overall productivity. When FDI flows in, capital accumulates in the industrial sector, city income grows, and surplus labor from rural areas pours in. This movement improves developing country employment scales and structures and leads to productivity improvements. Second, FDI can enhance technology transfers to domestic firms through spillovers. FDI often comes with new technologies and innovations. It is potentially an important source of productivity growth as it may help host country domestic industries catch up with the international technology frontier and encourage the host country to optimize and upgrade its industrial structure. Furthermore, FDI helps the host country to establish a unified, open, orderly, and competitive market system. In order to attract FDI, government authorities must fully consider the impact of their policies and measures on market competition, creating a transparent, fair competition environment. A fair and open investment environment, in turn, attracts more FDI inflow. Yue et al. (2016) reckoned that FDI can not only affect the economic growth, but also affect the environmental protection of the host country [
1]. When evaluating the impact of FDI on China’s economy, we should not just evaluate the impact of FDI on economic growth, but also consider the impact of FDI on energy and the environment.
There are numerous research works on FDI that seek to investigate its impact on economic growth. However, few have been done on the relationship among energy consumption, FDI, and economic development. Empirical studies on examining the dynamic processes among them are even fewer. Zhejiang, located on the eastern coast of China, is a pioneer in China’s reform and opening up. A high-end equipment manufacturing industry is one of the pillar industries and continues to grow at a rapid pace in Zhejiang. The demand for energy remains high. The study on the relationships among energy consumption, FDI, and economic growth in Zhejiang Province can not only provide a theoretical framework for Zhejiang’s economic transformation and development, but also provide a good paragon of high quality development for other provinces in China. The VAR model is used to determine the relationships of energy consumption, FDI, and economic growth in Zhejiang. Cointegration tests, impulse responses, and variance decomposition are used to test the results.
The rest of paper is organized as follows:
Section 2 provides a review of the literature.
Section 3 contains a briefly discussion on economic growth, energy consumption, and FDI in Zhejiang. The theoretical analysis, description of data, and summary statistics are discussed in
Section 4. Empirical results and the robustness test are presented in
Section 5 and
Section 6, respectively.
Section 7 contains conclusion and policy recommendations.
2. Literature Review
The relationship among energy consumption, FDI, and economic growth is a hot topic in economics. The existing research mainly focuses on the following three perspectives: energy consumption and FDI, energy consumption and economic growth, and FDI and economic growth.
2.1. Energy Consumption and FDI
Sun et al. (2011) conducted an empirical test on panel data of 74 high income, middle income, and low income countries from 1985 to 2008. They found that energy consumption intensity decreased slightly as FDI increased [
2]. Zhao et al. (2007) used index decomposition analysis (IDA) to analyze changes in energy consumption over time, arguing that there was a strong relationship between industrial distribution of FDI and energy consumption in China. This implied that industrial distribution of FDI has played an important role in Chinese energy consumption [
3]. Li and Qi (2016) used the industrial panel data of each province and applied the Two-Stage Least Squares (TSLS) and GMM methods, finding that FDI has a negative effect on China’s industrial energy consumption [
4]. Zhang et al. (2017) obtained a similar result [
5]. Latief and Lefen (2019) analyzed the causality among the FDI in the power and energy sector, the energy consumption, and the economic growth of Pakistan in 1990–2017. The sector-wise flow of FDI revealed that the power and energy sector of Pakistan had received a higher amount of FDI than other sectors of the economy with trends of energy production and energy usage [
6]. Zhang and Xu (2016) reported that FDI and energy consumption structures were beneficial in improving carbon productivity in resource-intensive sectors [
7].
2.2. Energy Consumption and Economic Growth
Many studies tried to identify the causal relationship between energy consumption and economic growth. Yin and Wang (2011) used the Engle-Granger two step method, cointegration analysis, and the Granger causality test to identify the relationship between China’s energy consumption and economic growth based on the data for the period of 1953–2008. The results showed that although some short run fluctuation existed, there was a stable equilibrium in the long run. A single direction causality from energy consumption to economic growth was found [
8]. The cointegration model and Granger causality test were used to analyze the relationship between the energy consumption and the export in Guangdong (Shi, 2008). They found that there was a positive relationship between energy consumption and export. Energy consumption was the Granger cause of export, while export was not the Granger cause of energy consumption. The relationship was steady and had no structural change. This indicated that export highly depended on energy consumption in Guangdong [
9]. Latief and Lefen (2019) confirmed the presence of a positive bi-directional causal relationship between energy consumption and economic growth through empirical research [
6].
However, Ma et al. (2012) investigated the causal relationship between energy consumption and economic growth for China from 1978–2008, using a multivariate framework based on the neo-classical production function where economic output, energy consumption, capital stock, and labor level were treated as variables. They applied the vector error correction model (VECM) and the Johansen-Juselius cointegration test to examine the existence of cointegration and Granger causality in the long and short run. Their results suggested there was no Granger causality between energy consumption and economic growth in the short run, but a unidirectional causality running from economic growth to energy consumption in the long run [
10]. Werner K.R., et al. (2018) used panel data to identify the causality relationship between the GDP and energy consumption for 74 countries from 1972 to 2014. A bi-causality between electrical energy consumption and GDP was found in the long run, while single direction causality was verified from GDP to electricity consumption in the short run [
11].
2.3. FDI and Economic Growth
Regarding the relationship between FDI and economic growth, scholars generally believe that technological spillovers brought by FDI play a positive role in economic growth.
Cheng (2002) analyzed the correlation between FDI and open economic growth in three different income countries in the context of new growth theory. She set up the model of foreign direct investment-led open growth and tested the effect of FDI on economic growth in a cross-country regression framework. The results of 65 countries showed that the growth enhancing effects of FDI were more significant in high income countries than those of middle and low income. In addition, FDI had positive effects on increasing total factor productivity and economic growth in China, which linked the scale of FDI inward and human capital [
12]. Liu and Li (2013) concluded that there was a two way positive correlation between FDI and economic growth in China based on the VAR model. According to the 1985–2010 time series data, the VAR model including three variables—FDI, economic growth, and employment—were applied, showing that the FDI played a significant role in promoting China’s economic growth and employment; China’s economic growth had a positive impact on FDI inflows, but it was not stable. There was an interactive promoting relationship between FDI, economic growth, and employment [
13]. Chen and Li (2011) conducted an empirical analysis of data in Shandong Province and found that there was a long-term equilibrium relationship between FDI and economic growth in Shandong Province and that FDI was the Granger cause of economic growth [
14]. Comes, C.-A., et al. (2018) investigated the impact of FDI and remittances on economic growth, using panel data of seven countries from Central and Eastern Europe with a gross domestic product (GDP) per capita under 25,000
$. They found a positive impact of both FDI and remittances on GDP, but the influence of FDI was higher in all analyzed states, with accepting the assumption of ceteris paribus principles in limiting research caused by other possible determinants [
15]. Yue, S., et al. (2016), Wang, C.-N., et al. (2019), Dkhili and Dhiab (2018), Zhu and Ye (2018), and Kurecic and Kokotovic (2017) drew a similar conclusion on FDI and economic growth [
1,
16,
17,
18,
19].
However, some researchers had different perspectives. He and Wang (2011) used cointegration theory and the error correction model to reassess the relationship between economic growth and FDI involving BRIC countries. The empirical analysis found meaningful Granger causality relationships between FDI and the growth of Brazil, Russia, and India in the long term, but no long-term Granger causality relationship existed in China. In the short term, FDI did not exert a robust, positive influence on growth except in Russian, while economic growth did attract inward FDI except in India [
20]. Gherghina, Ș.C., et al. (2019) used panel data for 11 Central and Eastern European countries from 2003 to 2016, and the quantitative outcomes by means of panel data regression models led us to conclude that a non-linear association occurred between FDI and GDP per capita [
21]. Belloumi and Alshehry (2018) investigated the causal links between domestic capital investment, FDI, and economic growth in Saudi Arabia over the period 1970–2015 by using an Autoregressive Distributed Lag (ARDL) bounds testing to cointegration approach. The results showed that in the long term, there was negative bidirectional causality between non-oil GDP growth and FDI [
22]. Dinh, T. -H., et al. (2019) examined and provided additional and relevant quantitative evidence on the impact of FDI on economic growth, both in the short run and the long run in developing countries of the lower middle income group in 2000–2014. The results of this study showed that FDI helped stimulate economic growth in the long run, although it had a negative impact in the short run for the countries in this study [
23].
2.4. Causality between Energy Consumption, FDI, and Economic Growth
There were some literature works discussing energy consumption, FDI, and economic growth together. Huo (2015), based on China’s provincial panel data from 2001 to 2010, studied the relationship among economic growth, FDI, and energy consumption using simultaneous equation models. The empirical research results showed that for the whole country, a bidirectional causal relationship between economic growth and FDI was found. There was a unidirectional causal relationship from FDI to energy consumption. For the high GDP per capita provinces, a bidirectional causal relationship between economic growth and FDI was found. There were unidirectional causal relationships from economic growth and FDI to energy consumption. For the middle GDP per capita provinces, there were bidirectional causal relationships between economic growth and FDI and economic growth and energy consumption, and there was a unidirectional causal relationship from FDI to energy consumption. For the low GDP per capita provinces, a bidirectional causal relationship between economic growth and FDI was found. There were unidirectional causal relationships from economic growth and FDI to energy consumption [
24]. Hussain and Nor (2011) examined the causal relationship between electricity consumption, Consumer Price Index (CPI), GDP, and FDI with time series data used for these variables for the 1971 to 2009 period in Malaysia. VECM was employed to estimate the causal relationship. The result for long run causality from electricity consumption to FDI, GDP growth, and inflation was found to be significant. The economic growth in turn stimulated the growth of power consumption, and the increase in FDI would help reduce power consumption and promote economic growth [
25].
2.5. FDI and Sustainable Development
FDI is important for sustainable development. There are three major hypotheses: the FDI halo hypothesis, the pollution havens hypothesis, and the environmental Kuznets curve. Ma, C.-Q., et al. (2019) found that FDI had a significant positive effect on the upper emission provinces of the manufacturing industry, which proved that there was a pollution paradise hypothesis in China’s manufacturing industry, but no halo effect hypothesis [
26]. Liu and Kim (2018) found the pollution havens hypothesis to be true for FDI and GDP among Belt & Road Initiative (BRI) countries, after adopting weight values in the Panel Vector Autoregression (PVAR) estimation [
27]. Jun, W., et al. (2018) examined the effect of FDI on pollution in China, for the period 1982 to 2016. The results indicated that FDI created pollution havens in China [
28].
There are different views. Yan and Hu (2020) argued that an increase in the FDI in a city was associated with a decline in SO
2 emissions in the same city, indicating that the pollution haven hypothesis did not hold in eastern China. However, the spillover effect of FDI was positive, indicating that a larger FDI in neighboring cities tended to raise SO
2 emissions in the local city [
29]. Li, Z., et al. (2019) investigated the impact of FDI on environmental performance by constructing a panel quantile regression model. They found that FDI had an insignificant influence on EP (Environmental Performance), and the impact of FDI on EP between developed and developing countries was heterogeneous. Furthermore, there was heterogeneity regarding the effect of FDI on EP at different quantiles of EP in developed countries [
30].
Hu, J., et al. (2019) investigated the environmental regulatory threshold effect of labor-based FDI and capital-based FDI in terms of their green technology spillover. The results showed that environmental regulation was unable to promote the green technology spillover of labor-based FDI significantly. However, intensifying environmental regulation could reduce the negative effect of labor-based FDI on green total factor productivity. The effect of environmental regulation on the green technology spillover of capital-based FDI is more complex. In the static linear model, environmental regulation could significantly promote the green technology spillover of capital-based FDI [
31]. Wang, Y., et al. (2019) found that China’s two way FDI coordinated development presented a significant braking effect on carbon emissions during the research period [
32]. Adamu, T.M., et al. (2019) revealed that energy consumption, export variety, FDI, and income positively contributed to environmental degradation in India [
33].
2.6. Summary
Energy consumption, FDI, and economic growth are dynamic processes that affect and optimize each other in the actual economic development process. For the development of Zhejiang’s economy, the process of marketization can especially reflect the close relationship among them. Therefore, this paper uses the VAR model to explore the interrelationships of energy consumption, FDI, and economic growth in Zhejiang Province through cointegration tests, impulse responses, and variance decomposition.
6. Robustness Test
In order to identify the dynamic relationship among energy consumption, FDI, and economic growth in Zhejiang more accurately, we performed a VAR stability check and Granger causality test. Then, we constructed the impulse response and variance decomposition.
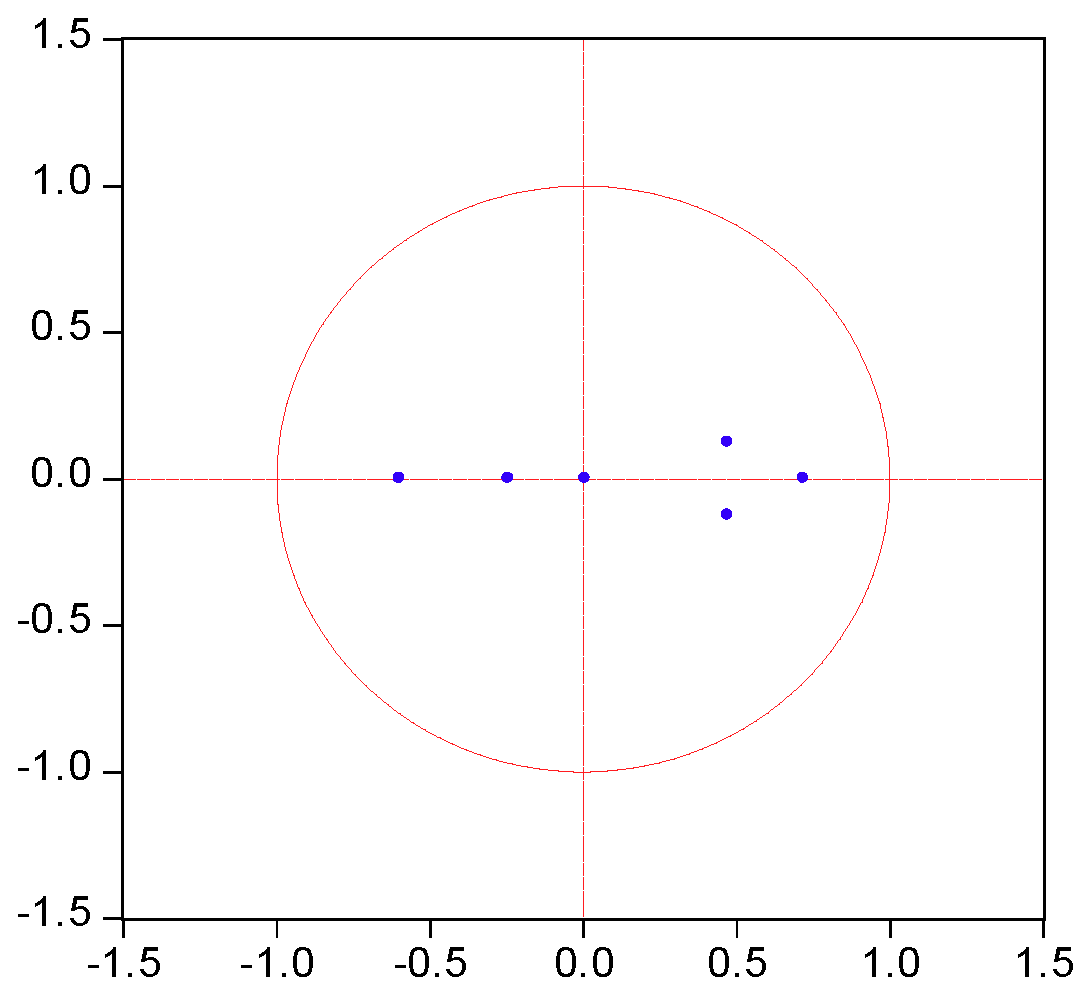
6.1. AR Roots Test
The test results are shown in
Table 9 and
Figure 4. We confirmed that no root lied outside the unit circle, as can be seen in
Figure 4, meaning that the VAR models conformed to the stability condition.
6.2. Granger Causality Test
The results of the Granger causality test are presented in
Table 10. The results indicated that only DLNFDI Granger caused on DLNENC and DLNGDP at the 0.1 level, which was consistent with the findings of Chen and Li (2011).
6.3. Impulse Response
The impulse response is the reaction of any dynamic system in response to some external change. As the VAR model conformed to the stability condition, impulse response analysis was used to examine the current and future impact of a single disturbance on all endogenous variables. With one standard deviation impact on the disturbance term, we obtained the impact on the current and future values of the endogenous variables. The results from the Cholesky impulse function are shown in
Figure 5,
Figure 6 and
Figure 7.
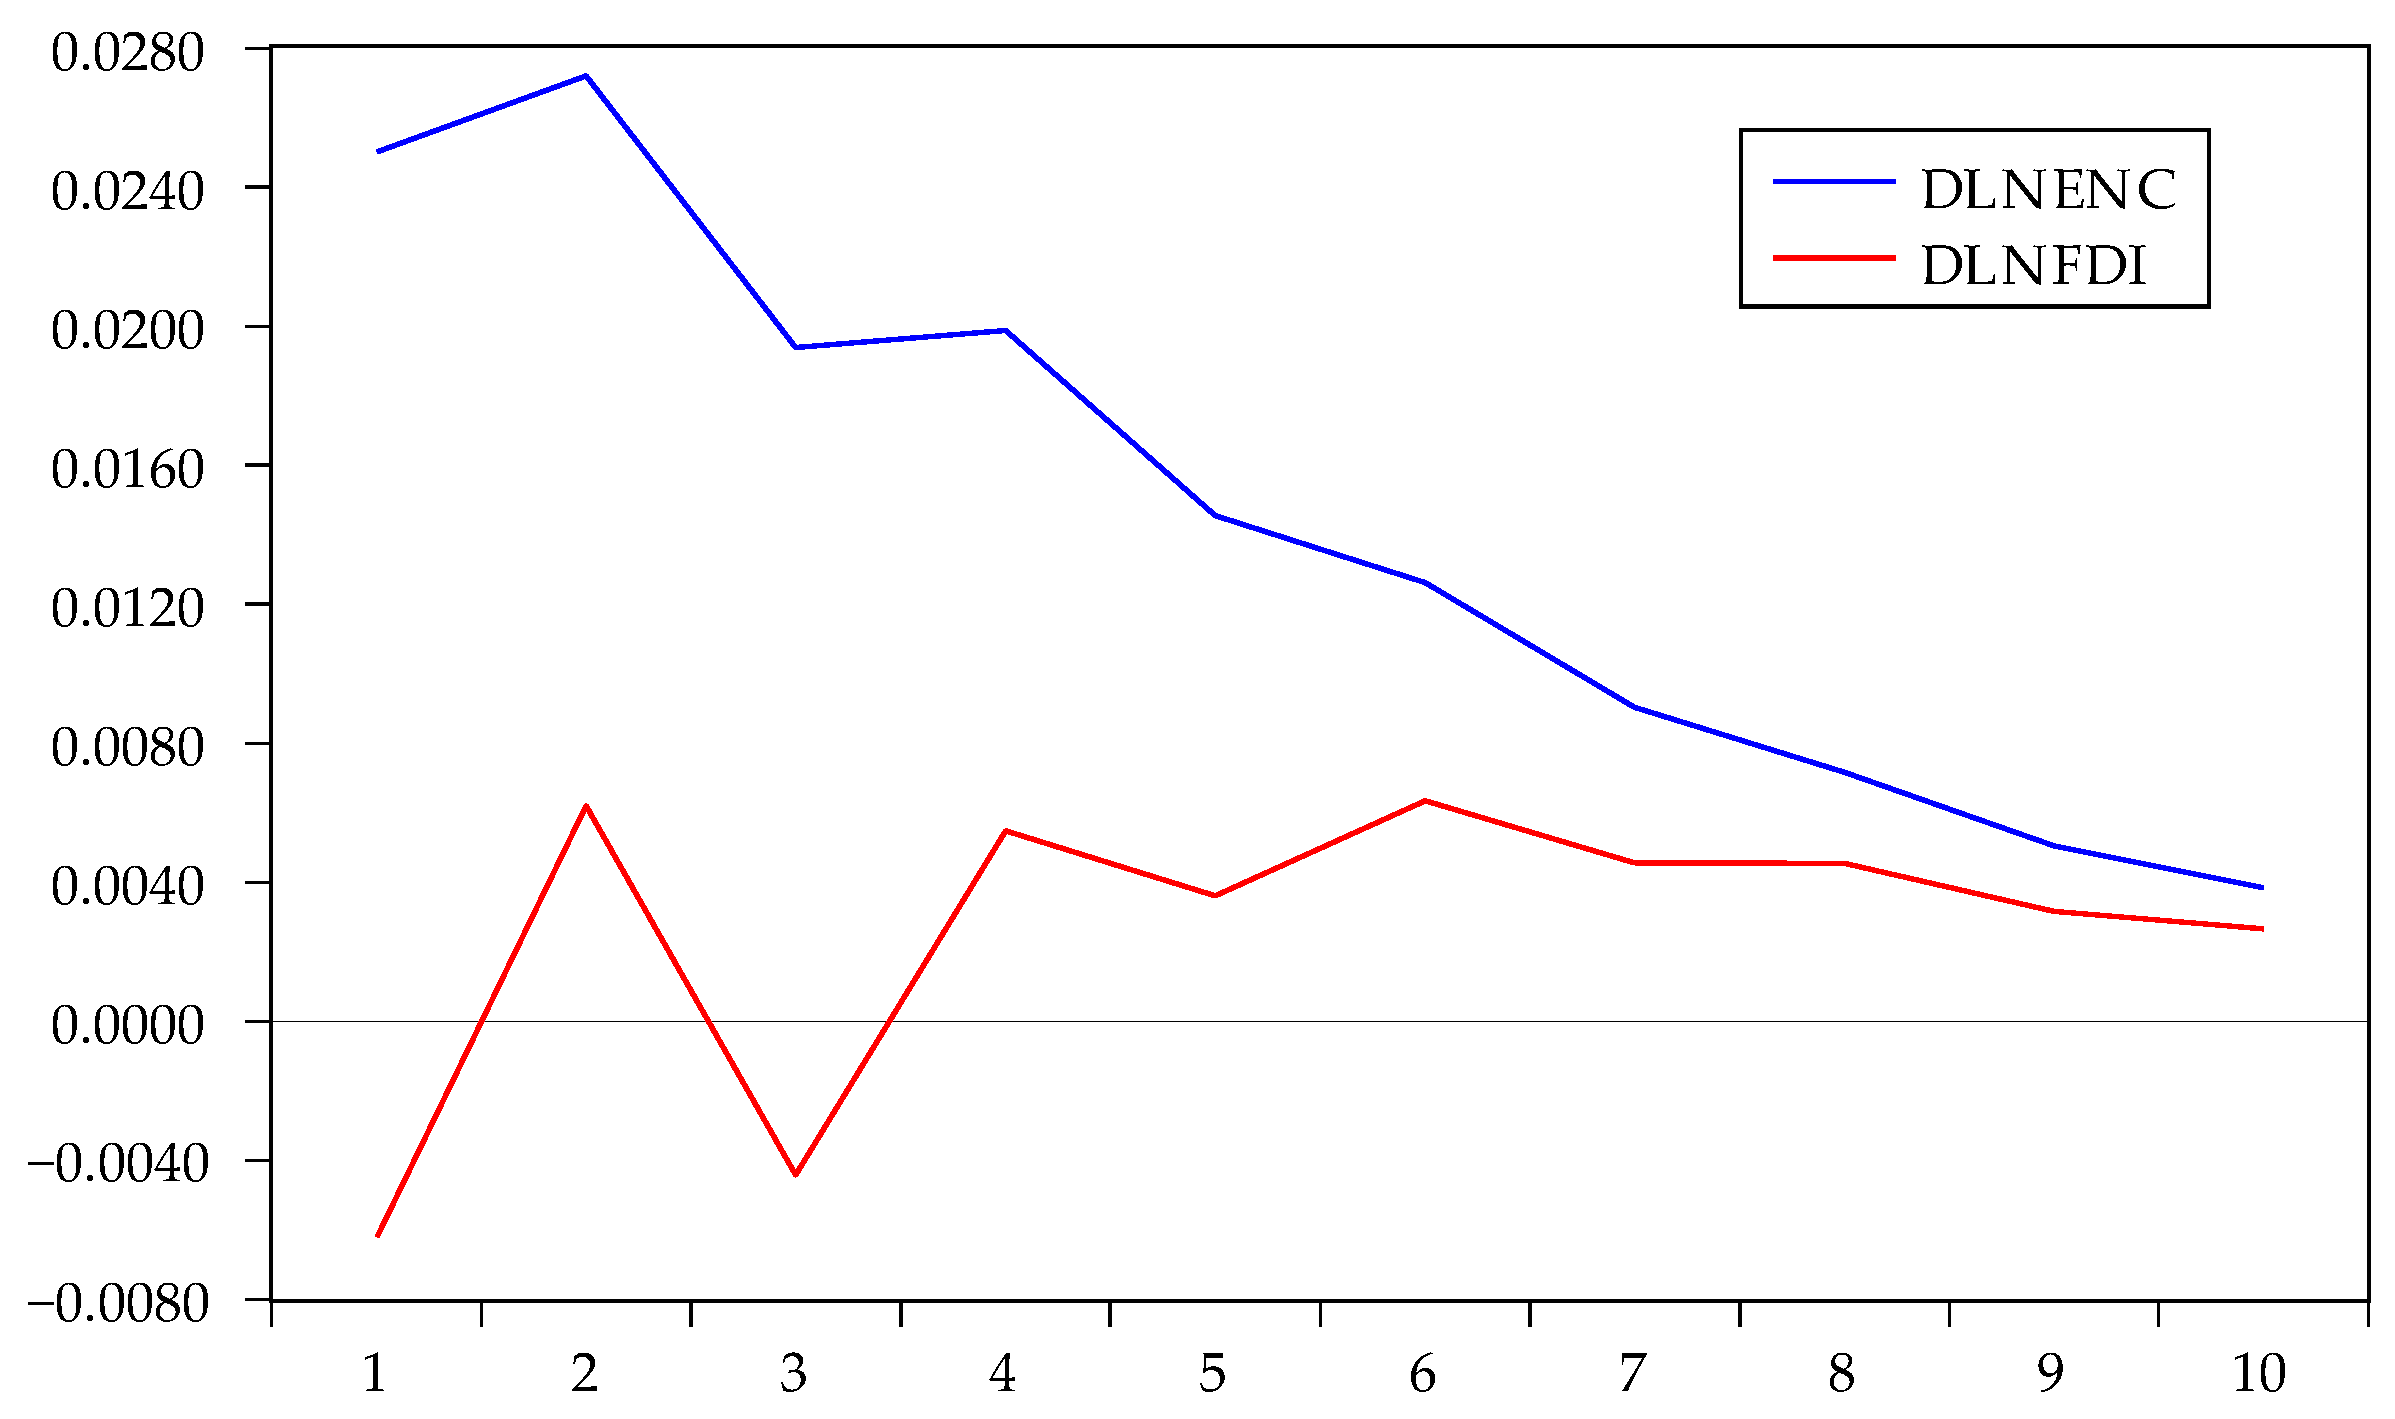
Ten periods were used for the lag interval of the impulse response in this paper. It can be seen from the response curve that the responses all tended to zero, indicating that the VAR model was stationary. The impulse response of energy consumption to one standard deviation is shown in
Figure 5. If we applied a positive shock to FDI and GDP in the current period, the response of energy consumption was highly positive, with a slightly declining trend in the long term. It is possible to observe that the positive effect of FDI on energy consumption was greater than the positive effect of GDP on energy consumption. After a lag period of FDI inflows, such as building plant production lines and obtaining production and operation licenses, a short period of time was needed to restart production. A large part of FDI was concentrated in high energy-consuming industries. At the same time, the economic development of Zhejiang could also encourage industries to scale up, which would lead to an increase in energy consumption.
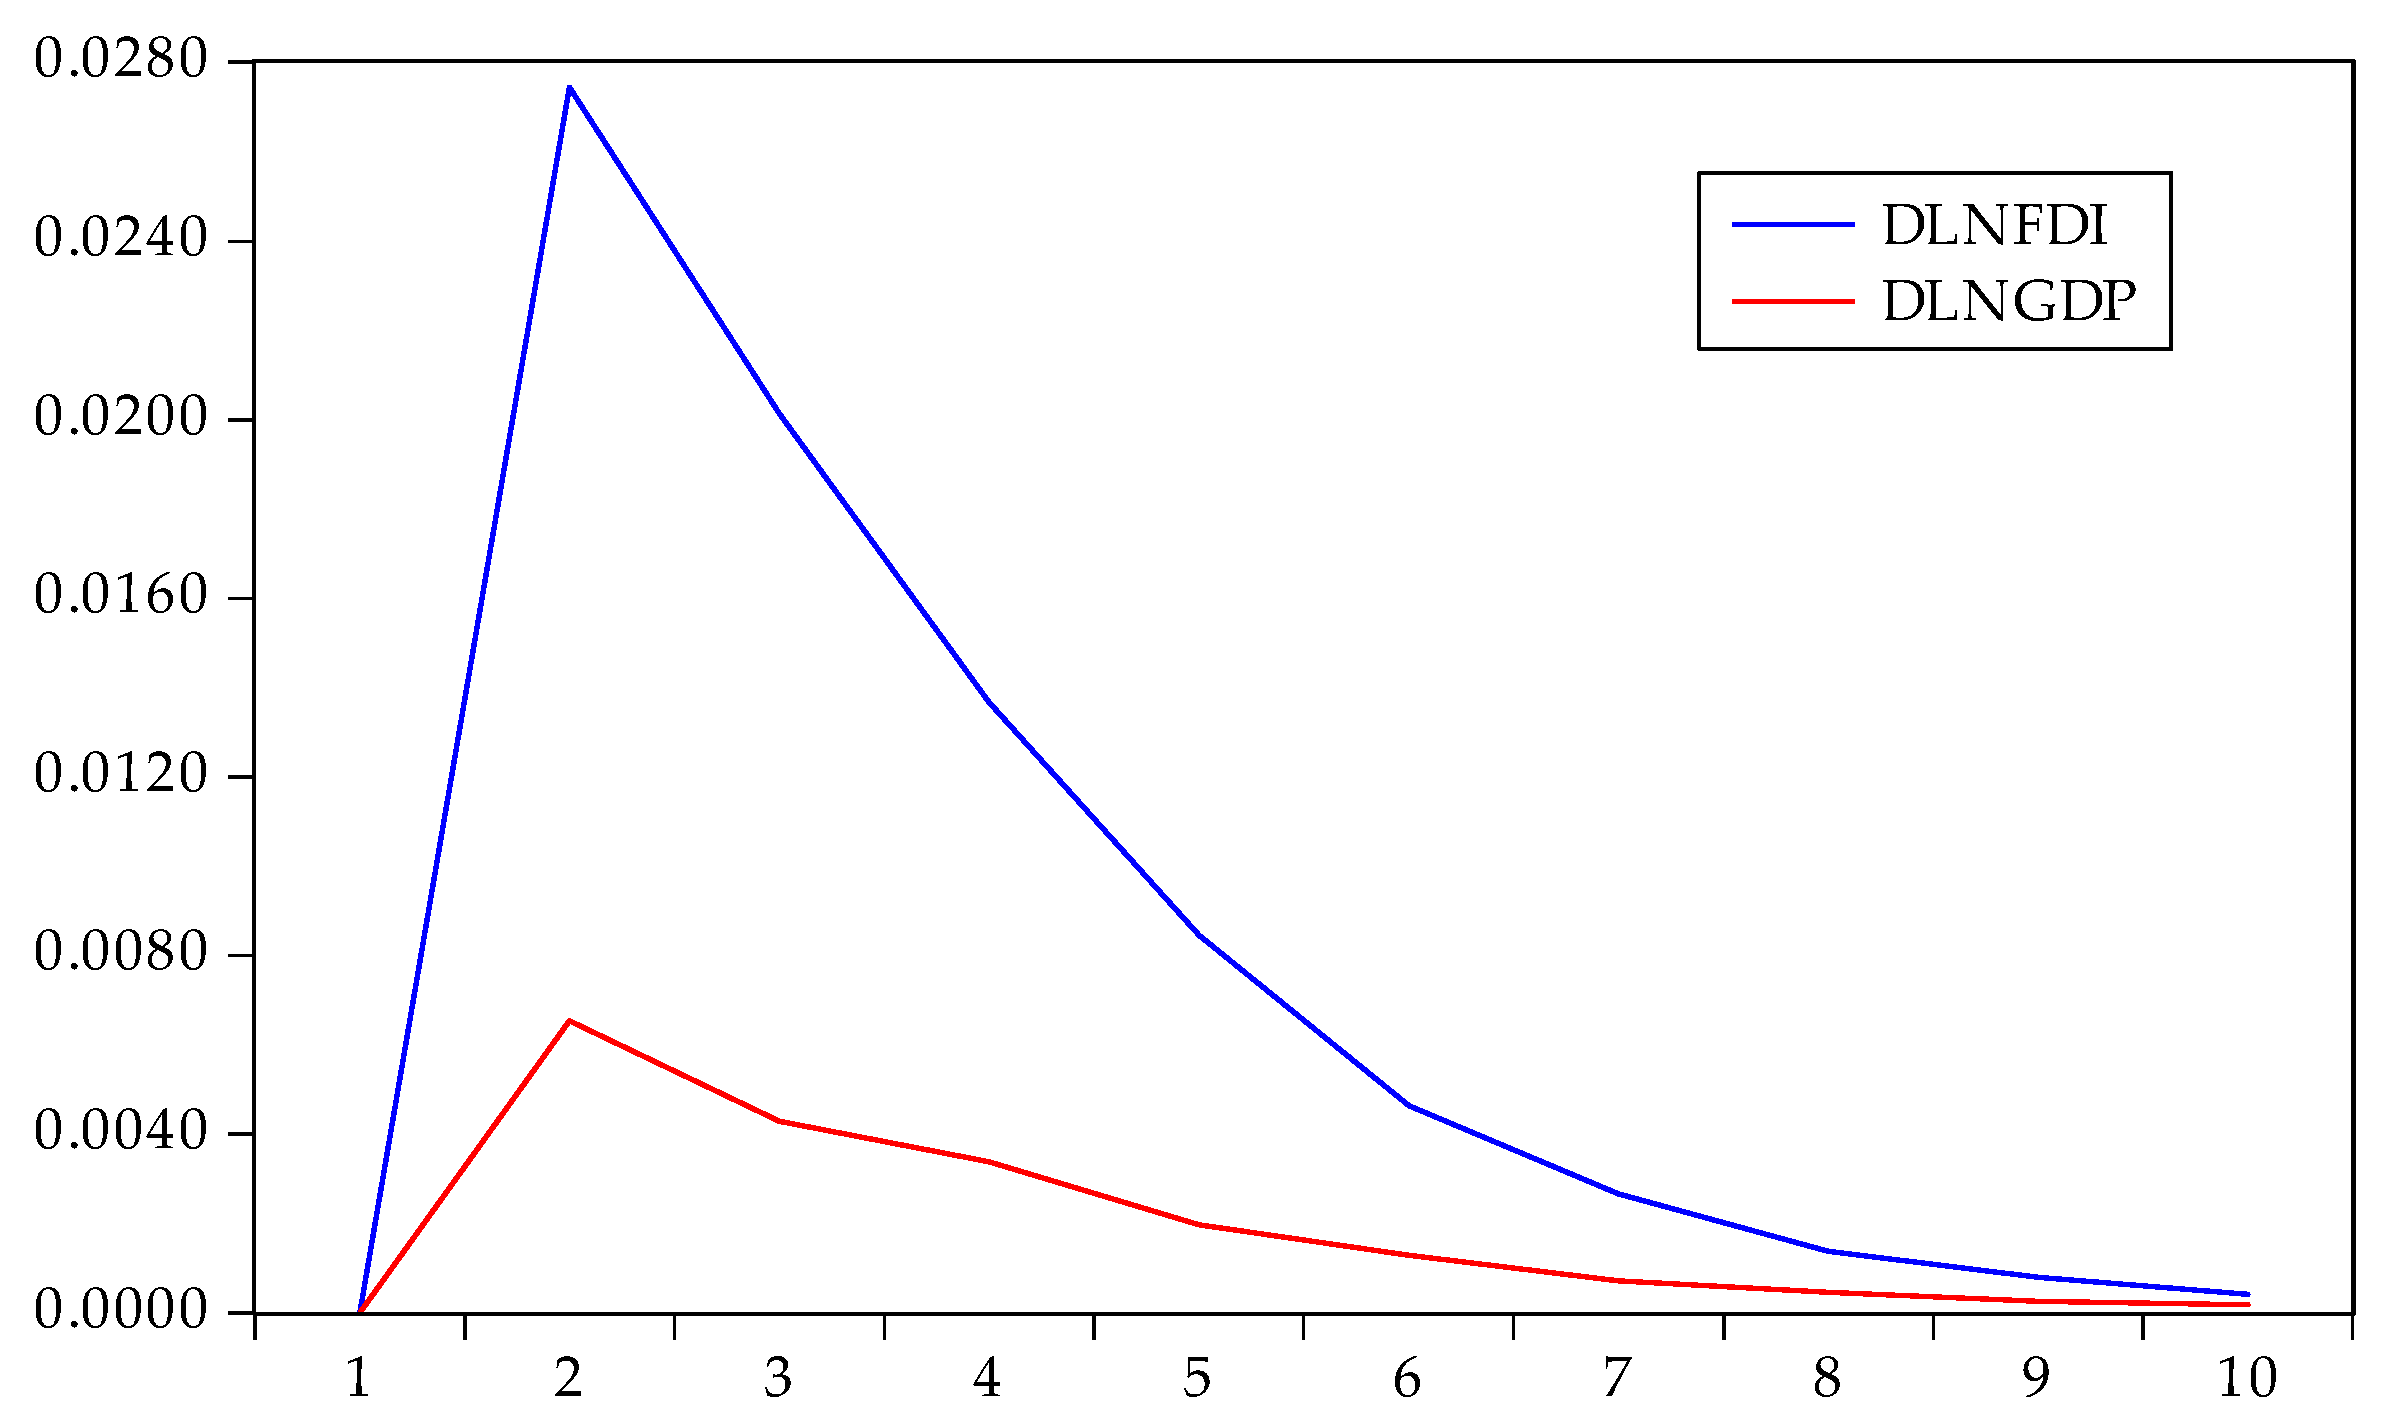
The impulse response of FDI under the Cholesky one standard deviation is shown in
Figure 6. The impact of energy consumption on FDI reached its maximum in the first period and declined gradually. The impact was close or equal to zero after six periods. The cumulative response of FDI to energy consumption was 0.1778, which indicated that the increase in energy consumption in Zhejiang stimulated FDI inflow for a long time. The impact of GDP on FDI lasted four periods, with very little impact in the fifth period. The impact of GDP on FDI was positive and significant. With the increasing GDP, FDI inflow increased in Zhejiang.
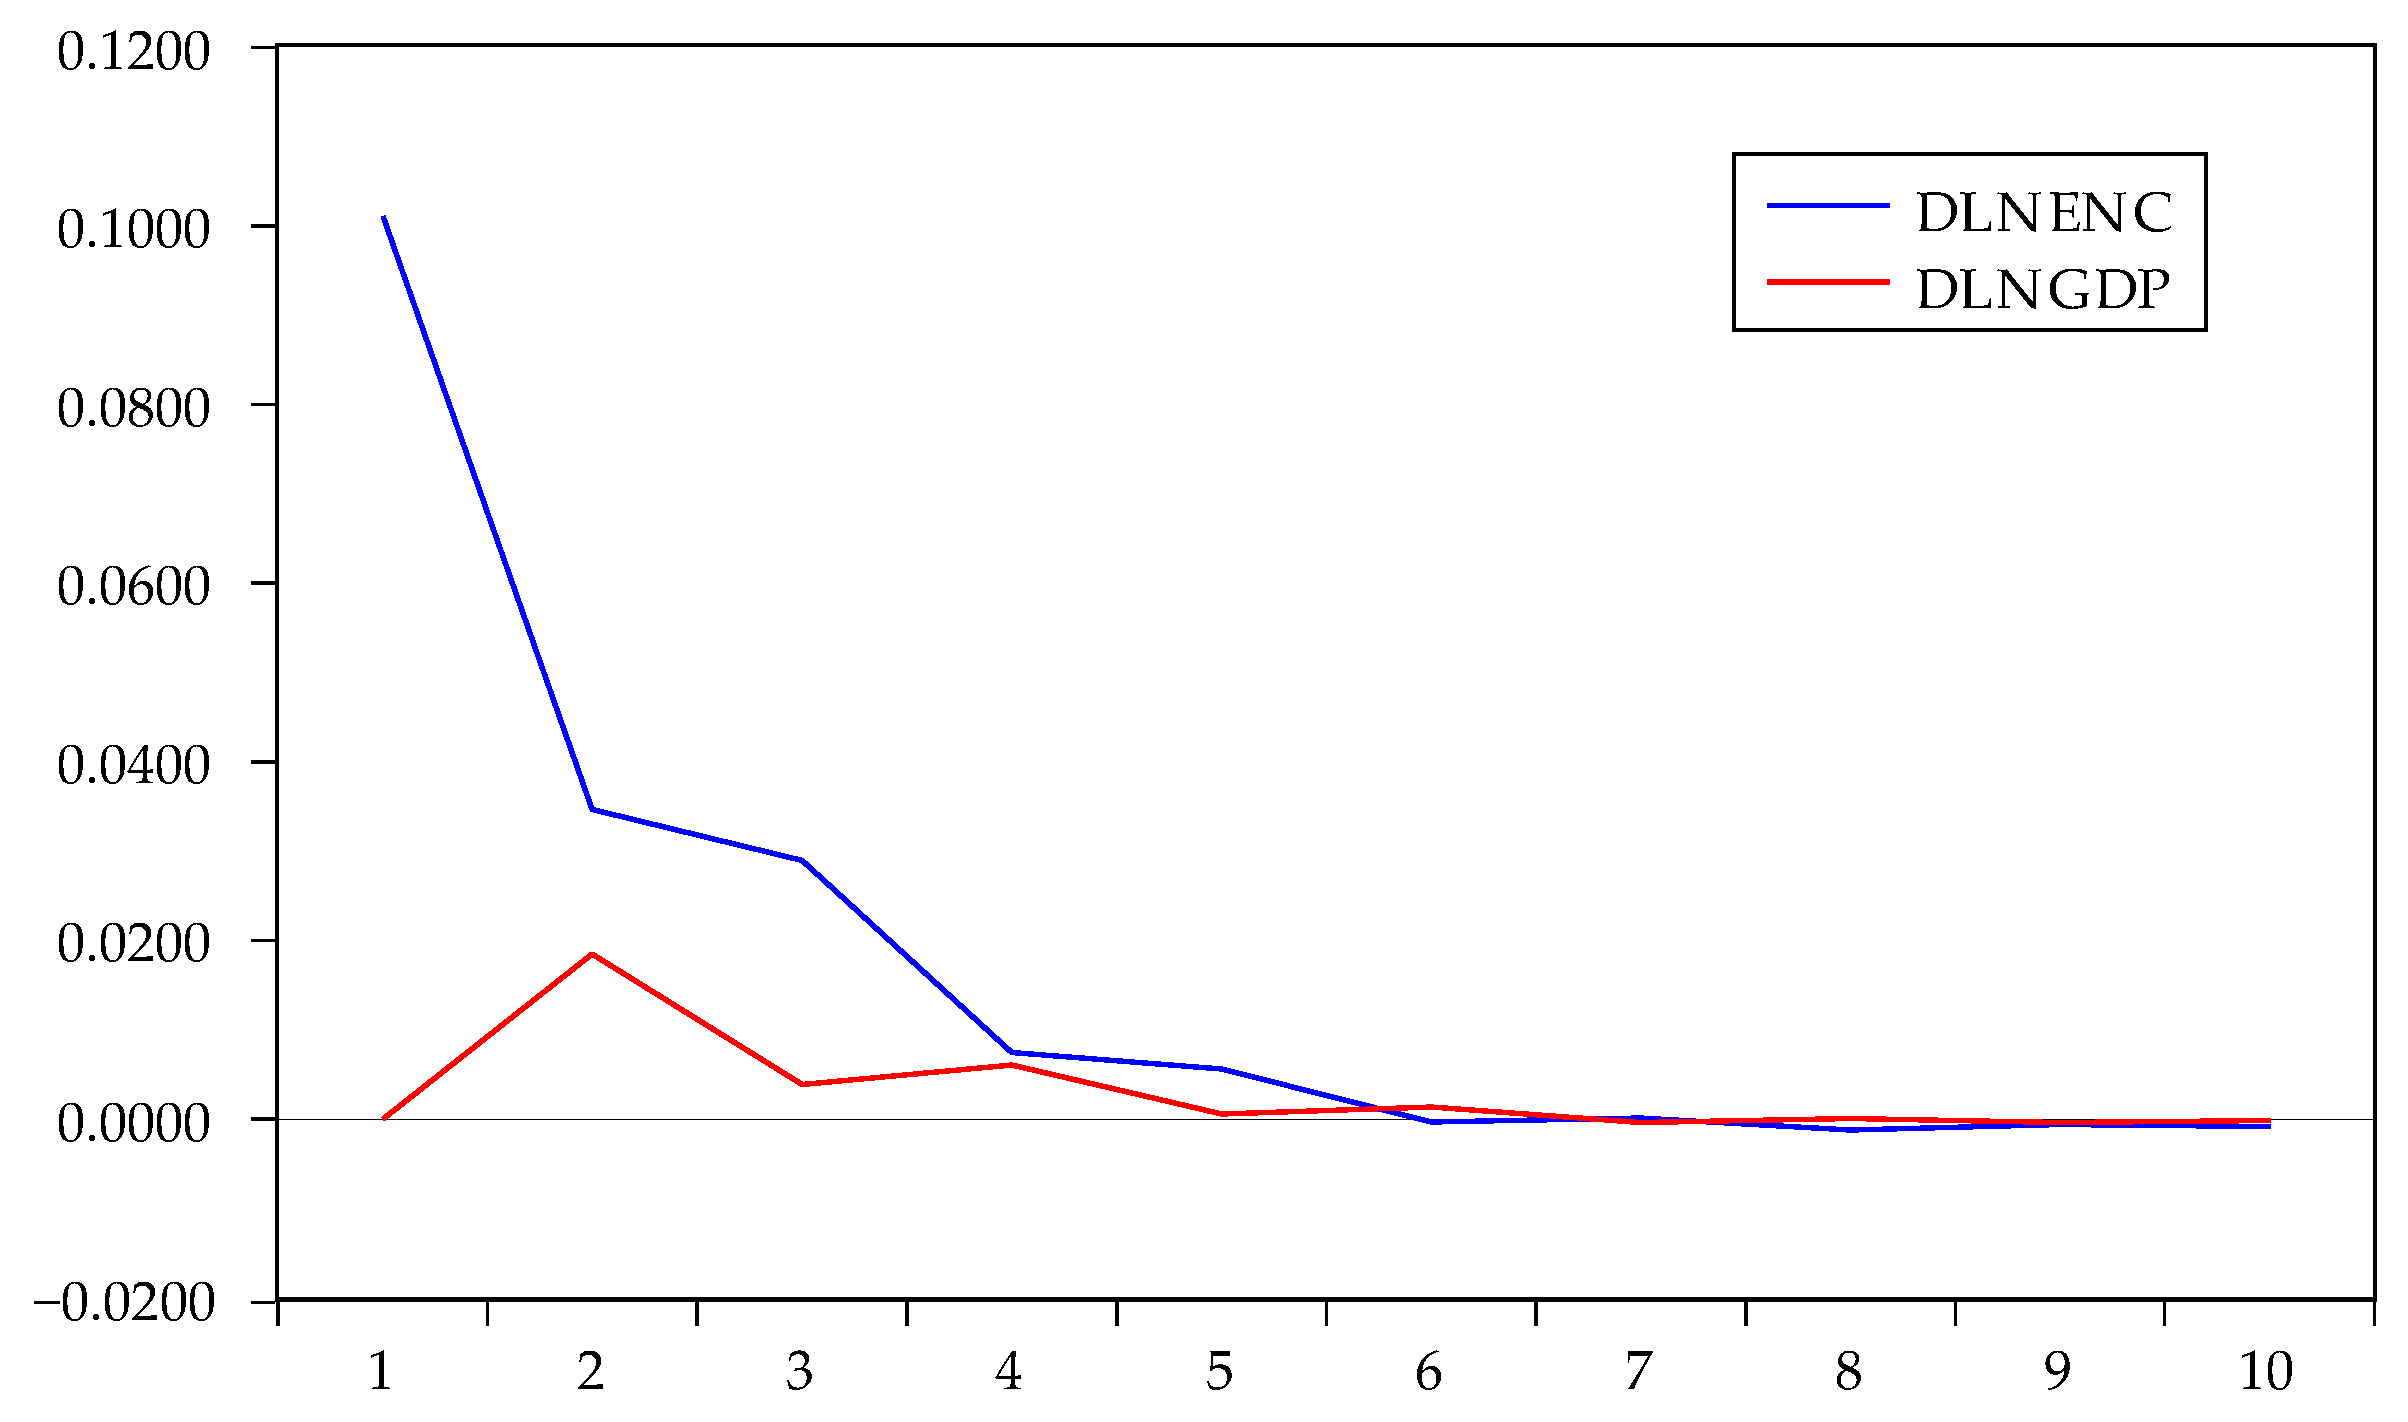
Figure 7 shows the impulse response paths of DLNGDP to DLNEC and DLNFDI under the Cholesky one standard deviation. The impact of FDI on GDP fluctuated in the previous periods, then gradually eased after the fourth period, and the overall value was low. This indicated that FDI impact on GDP was weak and complex. If we applied a positive shock to energy consumption, the response of GDP was significantly positive, with a decreasing trend. To some extent, the economic growth of Zhejiang still depended on the increase in the scale of energy consumption.
6.4. Variance Decomposition
Variance decomposition was used to further evaluate the importance of different structural shocks by analyzing the contribution of each structural shock to changes in endogenous variables, which are usually measured by variance. Therefore, variance decomposition could describe the relative importance of different shocks to FDI, GDP, and ENC. Based on the VAR model above, we applied variance decomposition. The results are shown in
Table 11.
The fluctuation of FDI was mainly explained by its own impact and the impact of energy consumption. The impact of GDP on FDI was minimal (See
Table 11). In the initial period, the impact of energy consumption was slightly greater than the impact of FDI itself. However, the impact of energy consumption gradually weakened, while the impact of FDI itself gradually strengthened. The impact of FDI shocks stabilized at about 58.5%, indicating that FDI still had an important role in Zhejiang’s opening economy.
For the fluctuation of energy consumption, the results of variance decomposition showed that only energy consumption had an impact itself in the early period. Although the impact gradually declined, it remained at a high level at 63.4%, and the impact of FDI could explain 34.7%. Therefore, there was a two way strong relationship between energy consumption and FDI.
The variance decomposition of GDP showed that the impact of energy consumption was also very significant. While the impact of GDP’s own shock was more significant in the initial stage, it gradually weakened over time. The proportion of FDI impact on GDP and the proportion of GDP impact on FDI were relatively small, indicating that the interaction between them was weak.
7. Conclusions and Policy Implications
7.1. Conclusions
This study examined the energy consumption, FDI, and high quality development in China by examining Zhejiang from 1993 to 2017. The results of cointegration tests showed that there was an equilibrium relationship among Zhejiang’s energy consumption, FDI, and economic growth in the long run. Impulse response analysis and variance decomposition showed that, in terms of short-term dynamic relationship, there was a strong positive relationship between FDI and energy consumption. This was consistent with the findings of Zhao et al. (2007) and Latief and Lefen (2019). In turn, energy consumption stimulated the increase of FDI. Although there was a time-lag between energy consumption and FDI, the effect was strong and persistent.
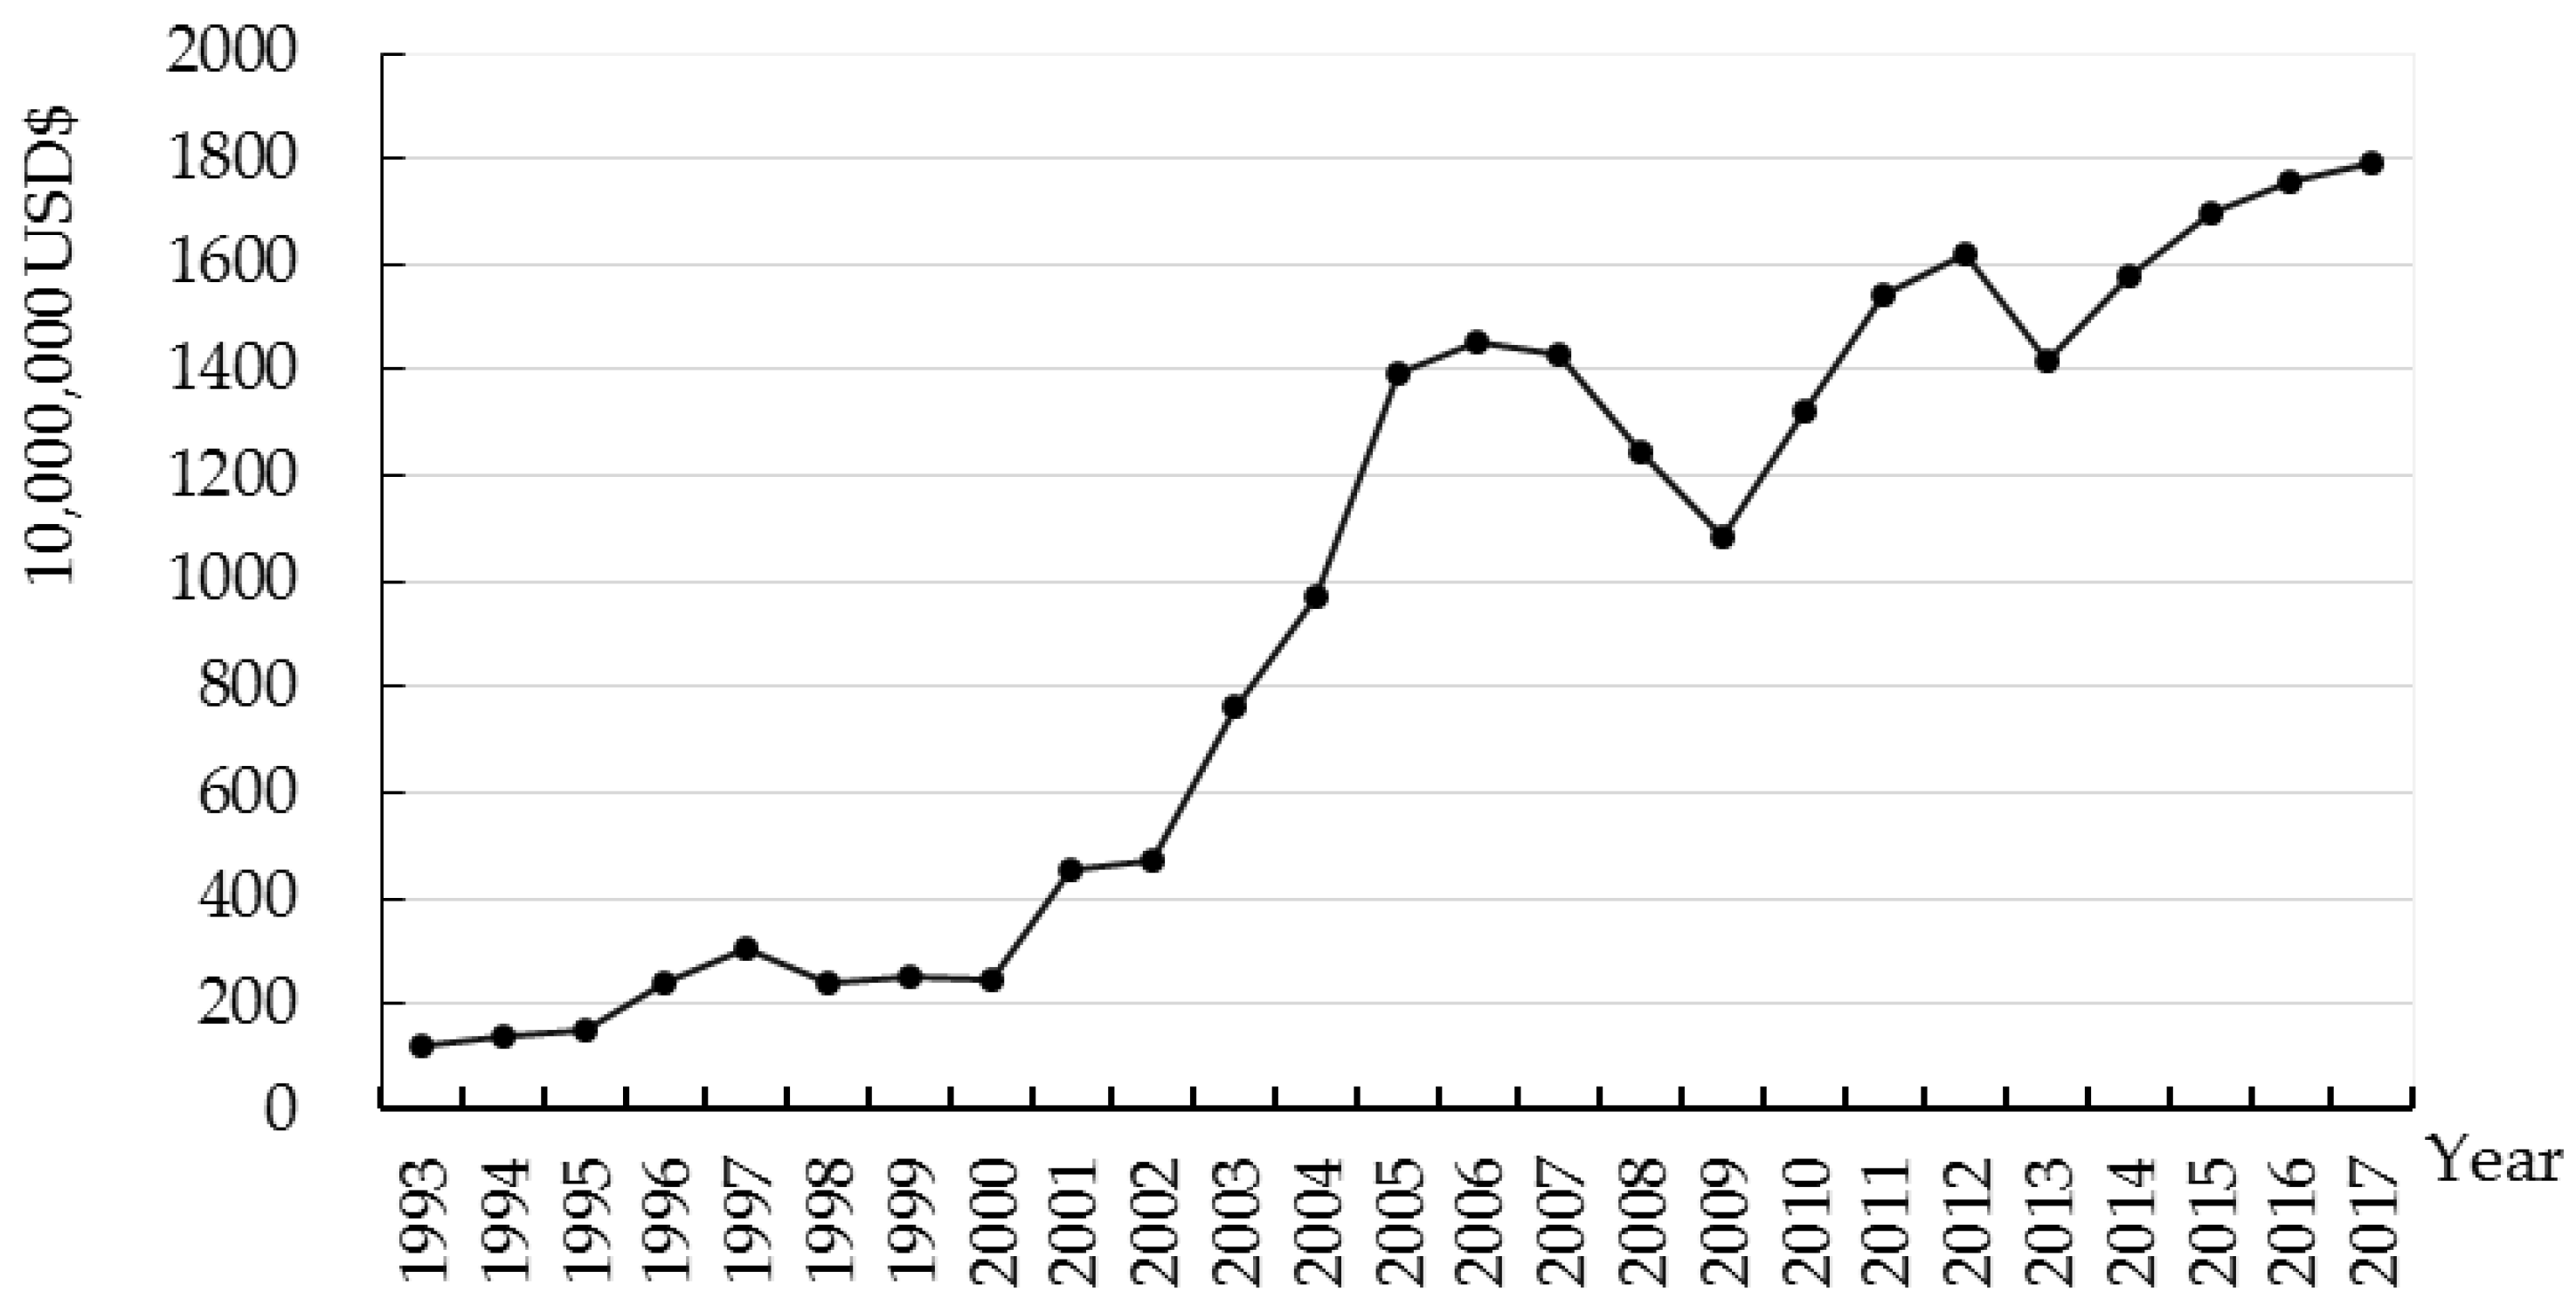
On the other hand, energy consumption had a strong positive impact on economic growth, which was consistent with the findings of Yin and Wang (2011) and Shi (2008). After China’s accession to the WTO, a higher level of opening up boosted the energy consumption in Zhejiang. Taking the advantage of convenient transportation, Zhejiang took the lead in entering high energy-consuming industries. These high energy-consuming industries played a very important role in promoting economic growth in Zhejiang. Then, the increase in energy consumption attracted more foreign investment in Zhejiang. Therefore, a closed-loop chain of “FDI-energy consumption-economic growth” was formed.
7.2. Policy Implications
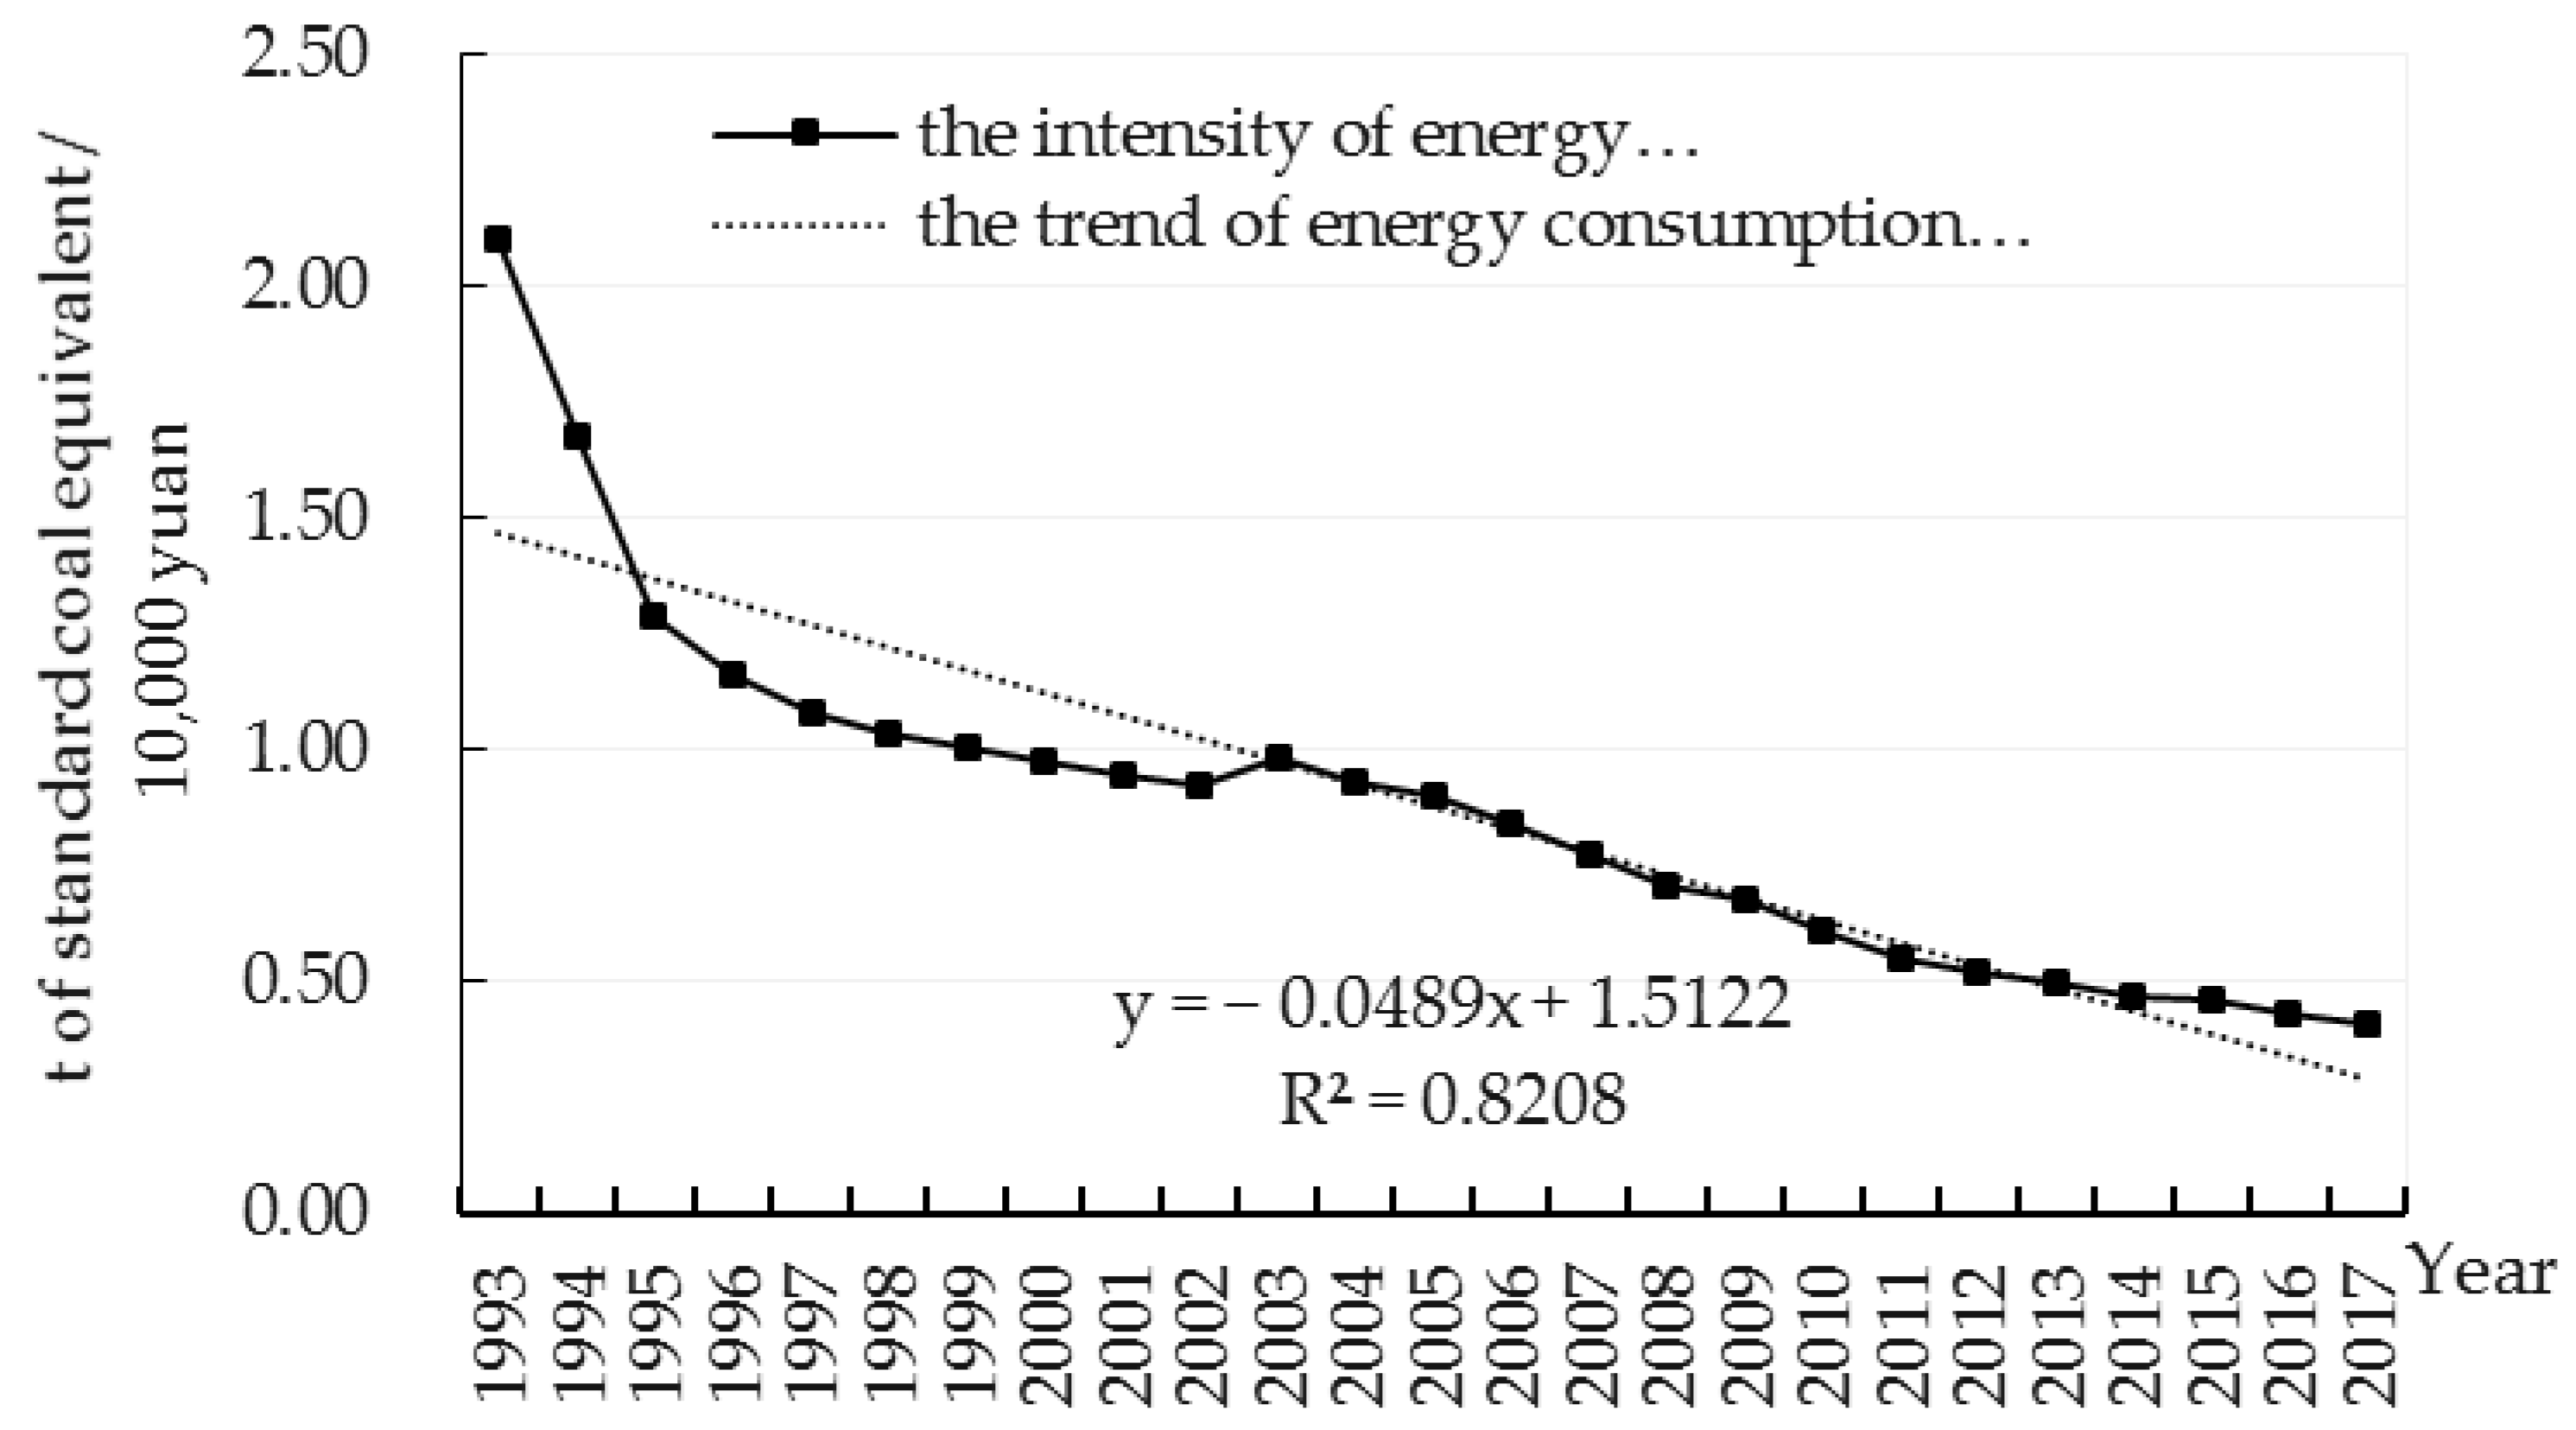
Zhejiang boasts a developed private economy and advances the construction of industry cluster areas and economic development zones for large enterprises and manufacturing. With the economic expansion, the marginal benefits of energy consumption decrease continuously, and the traditional economic growth method is difficult to sustain. In order to make full use of foreign investment, reduce energy consumption intensity, and promote stable economic growth, Zhejiang needs to pursue economic development in an environmentally sustainable manner and foster green growth of the economy. Based on this, we propose the following policy recommendations.
(1) Coordinate the relationship among energy consumption, economic growth, and FDI to achieve high quality economic development: The results of the cointegration test showed that there was a long-run equilibrium relationship. Therefore, from the perspective of long-run stable growth, policy makers should strike a balance among them, shifting from the old equilibrium to the new equilibrium, and achieve high quality economic development.
(2) Optimizing FDI structure and promoting industrial upgrading: It has been proven that the increase in FDI played an important role in promoting industrial development and economic growth in Zhejiang province. Zhejiang should improve the level of opening up and the quality of investment by encourage the development of low energy consumption and high output industries, as well as attract high quality foreign capital inflows. It is necessary to guide the foreign capital to industries with lower energy consumption. For example, taking advantage of agriculture and fishing resources in Anji and Zhoushan of Zhejiang, the government could introduce advanced machinery, equipment, and management technology through FDI to increase productivity and reduce energy consumption. The government could also attract FDI by making use of talent advantages in the fields of finance and the Internet to develop the tertiary industry in Zhejiang.
(3) Improve the environment for FDI and enhance technology spillover effects of FDI: The development of private enterprises plays a decisive role in promoting Zhejiang’s economic growth and improving people’s living standards. However, private enterprises have disadvantages such as outdated industrial structure and low management level. The technology spillover effects of FDI can solve these problems. However, in reality, foreign capital is only investing in downstream production and processing cycles in Zhejiang, but not setting up R&D institutions. Therefore, the technology spillover effect of FDI in Zhejiang is not obvious, and its driving effect on the private economy is weak. It is necessary to introduce a comprehensive protection system of property rights and copyrights, improve the policies of technology incentives, and support the guidance of FDI in the concentration of high-tech industries, as well as promote the joint establishment of mixed ownership enterprises by private capital and foreign capital.
(4) Develop the digital economy, reduce energy consumption intensity, and improve energy efficiency: Zhejiang has gathered a number of world-leading digital enterprises, such as Alibaba. Zhejiang has a first-mover advantage in the development of the digital economy. The construction of the “Internet +” and “AI +” (artificial intelligence) can promote traditional industrial digitalization. By supporting manufacturing companies in using big data, AI and other advanced technologies can speed up technological transformation and equipment upgrades. Production efficiency can also be improved by reducing energy consumption intensity and optimizing energy efficiency. Therefore, high quality development can be achieved.


