Influence of Interval Training Frequency on Time-Trial Performance in Elite Endurance Athletes

Abstract
1. Introduction
2. Materials and Methods
2.1. Subjects
2.2. Procedures
2.2.1. Interval Training
2.2.2. Test Day 1: Submaximal Exercise Test and VO2max
2.2.3. Test Day 2: Rollerski Time Trial Performance
2.3. Statistical Analyses
3. Results
3.1. Baseline
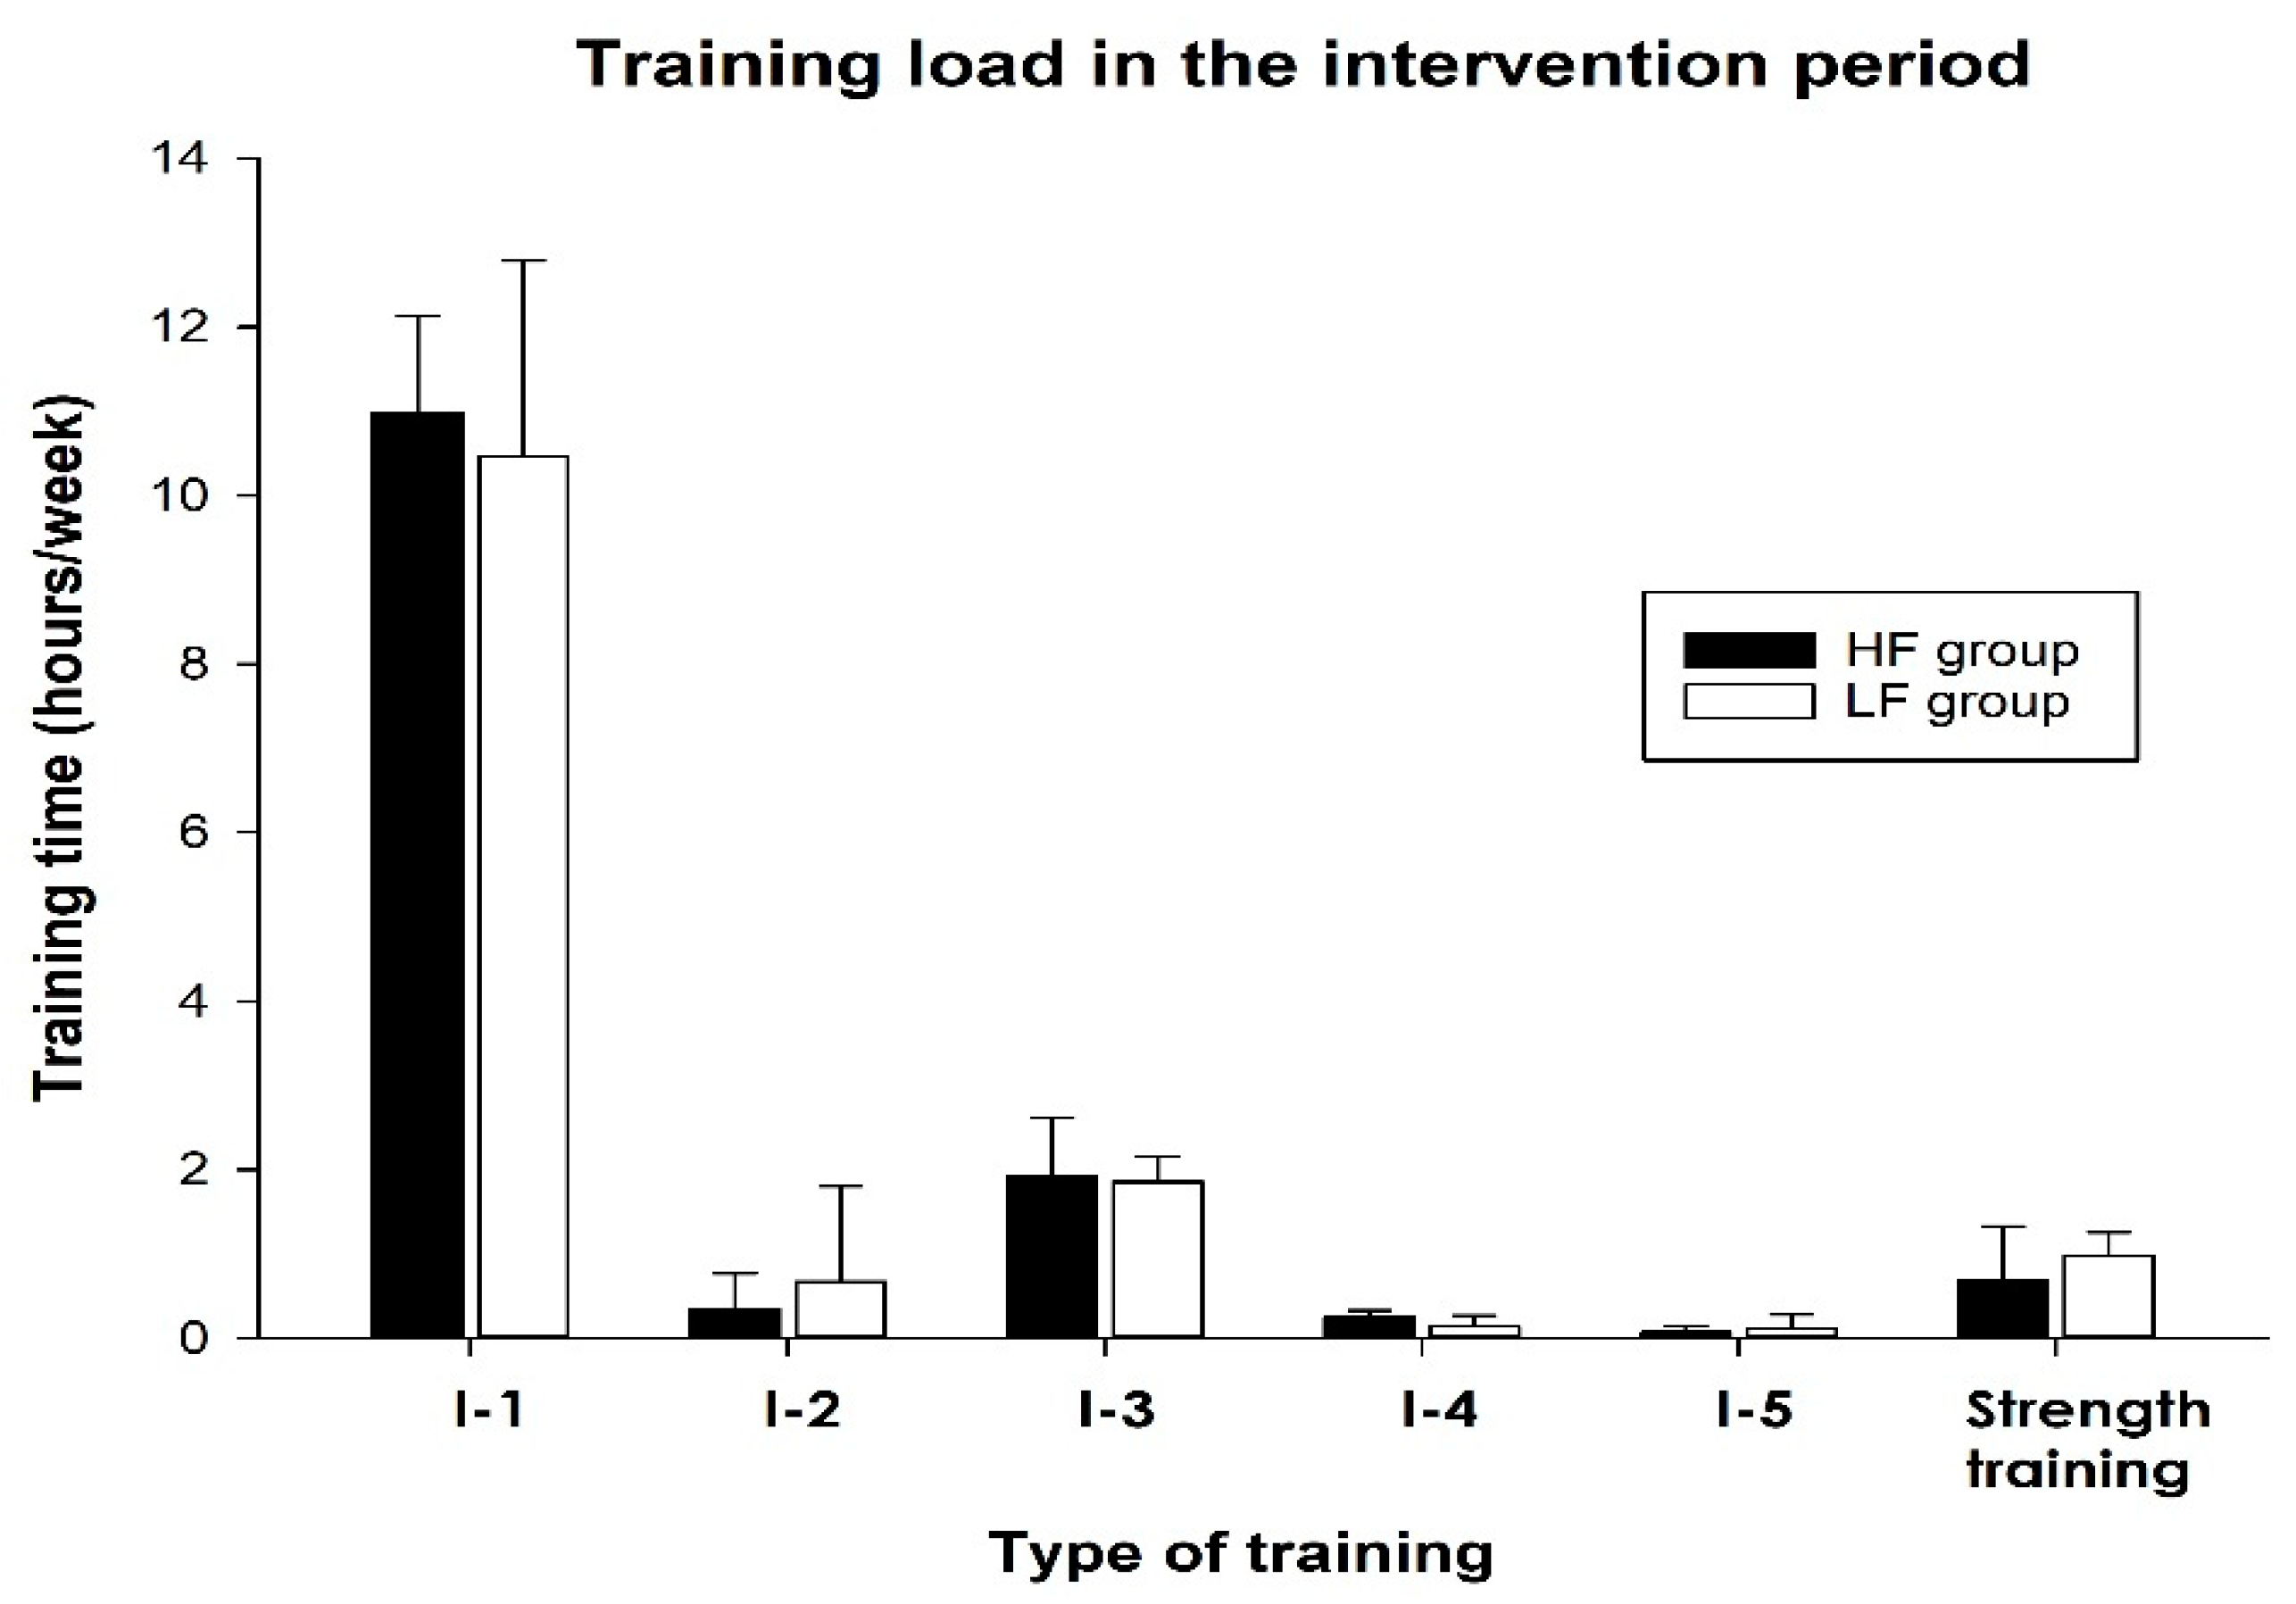
3.2. Training Load in the Intervention Period
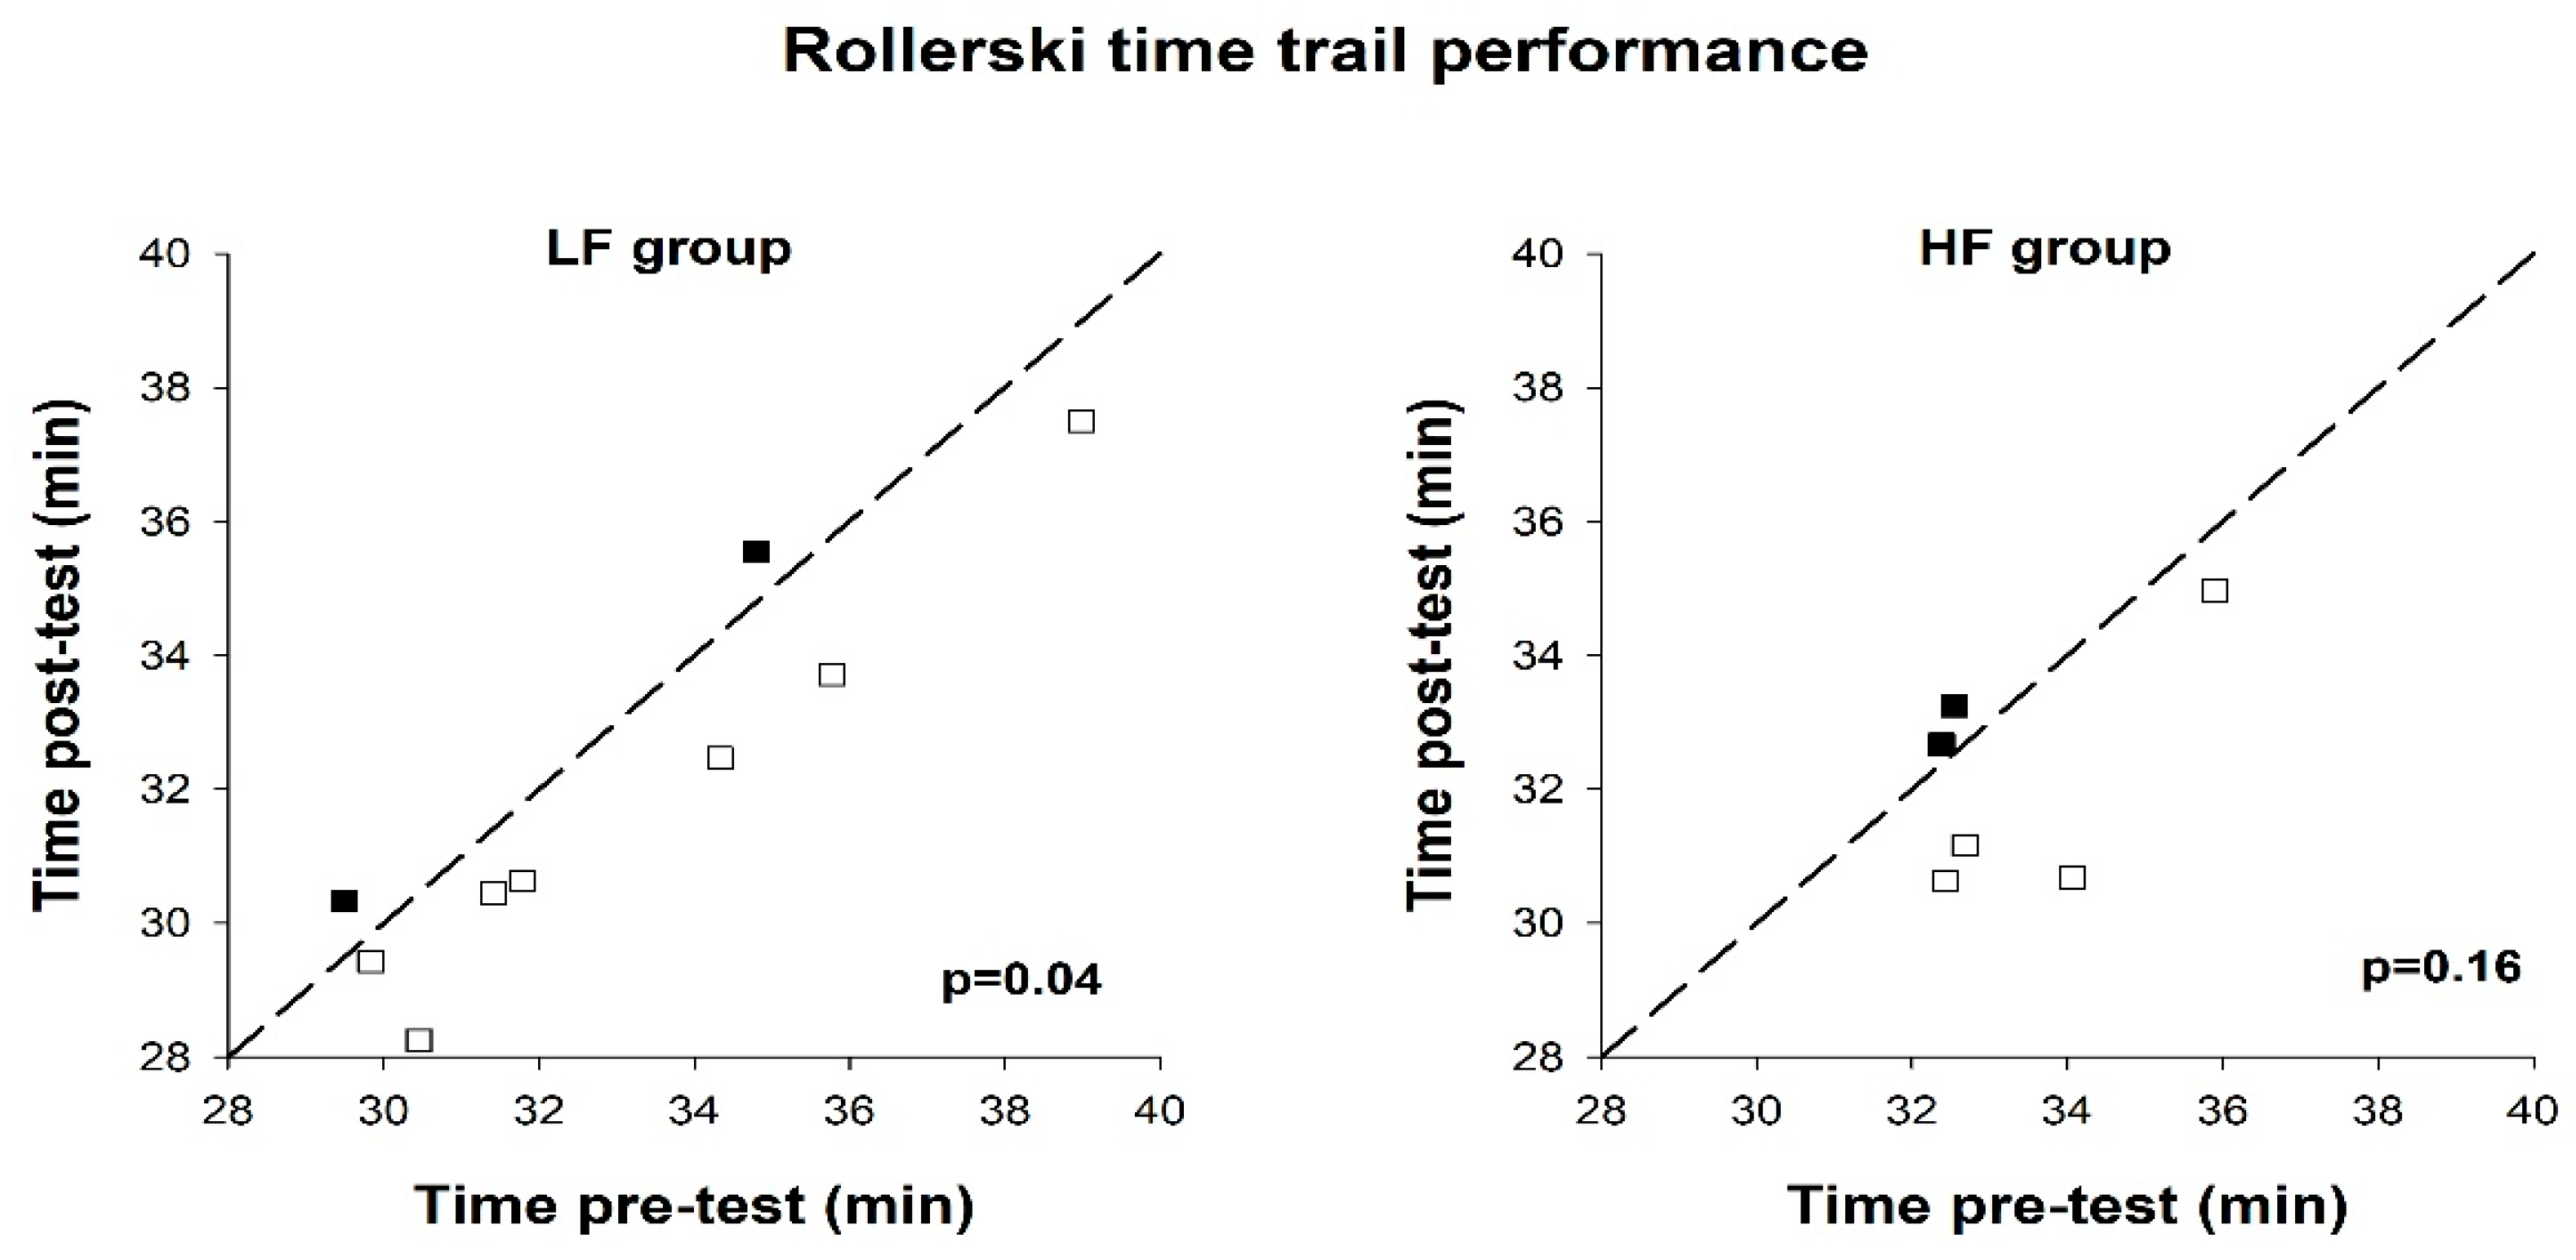
3.3. Time-Trial Performance
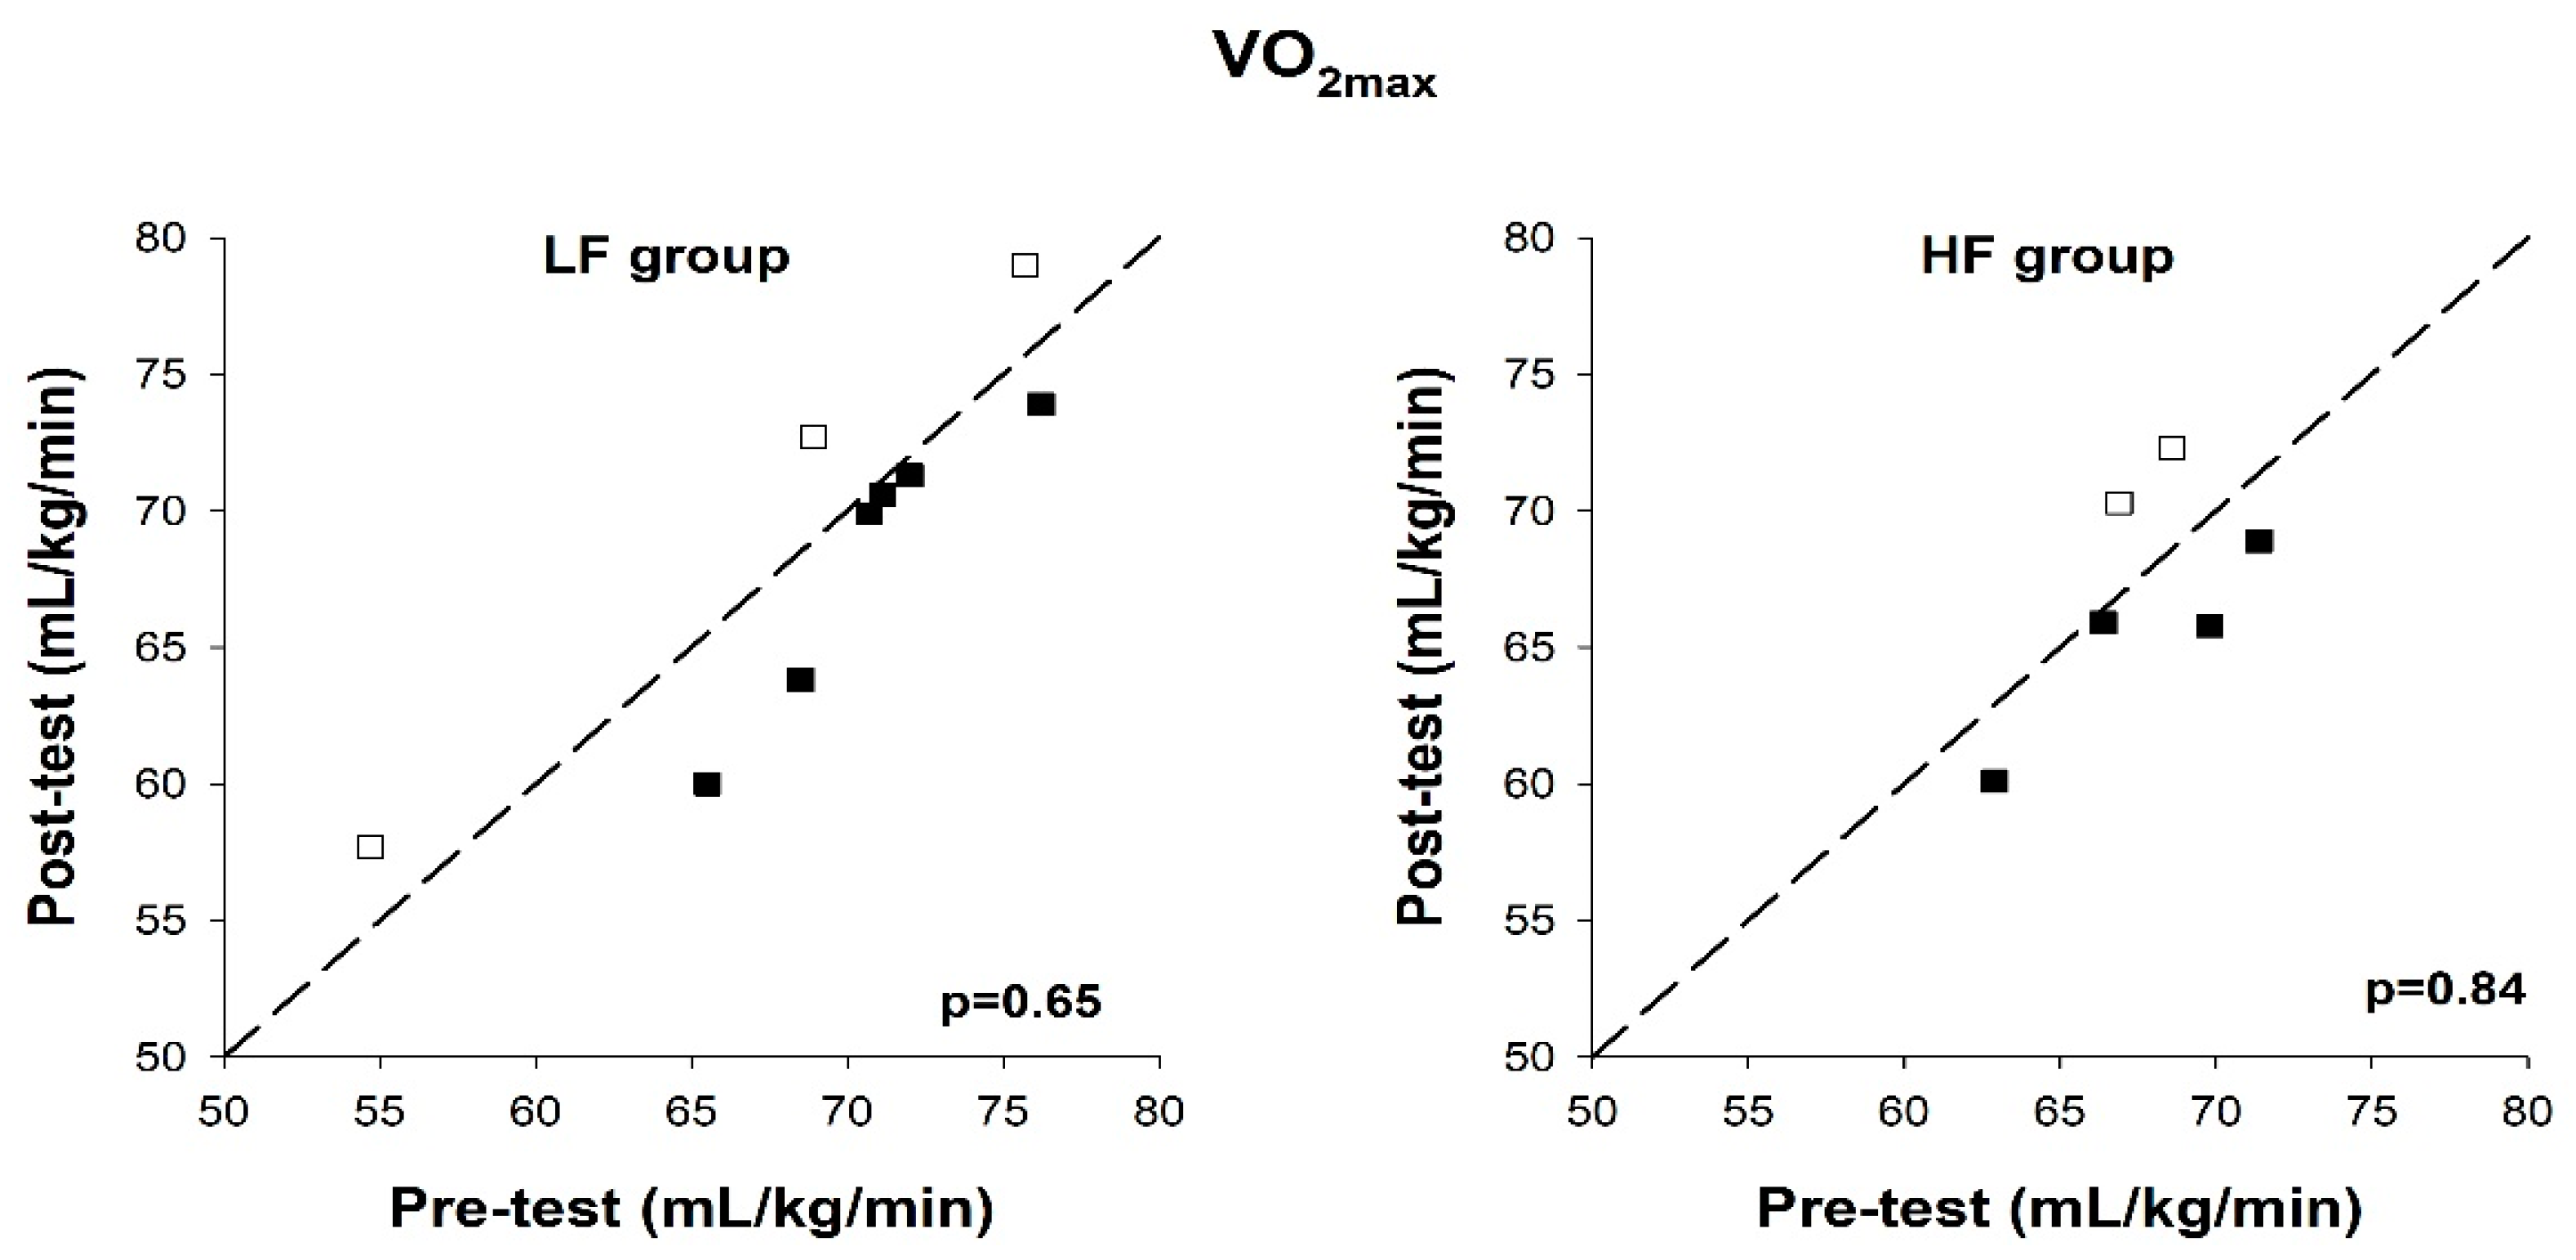
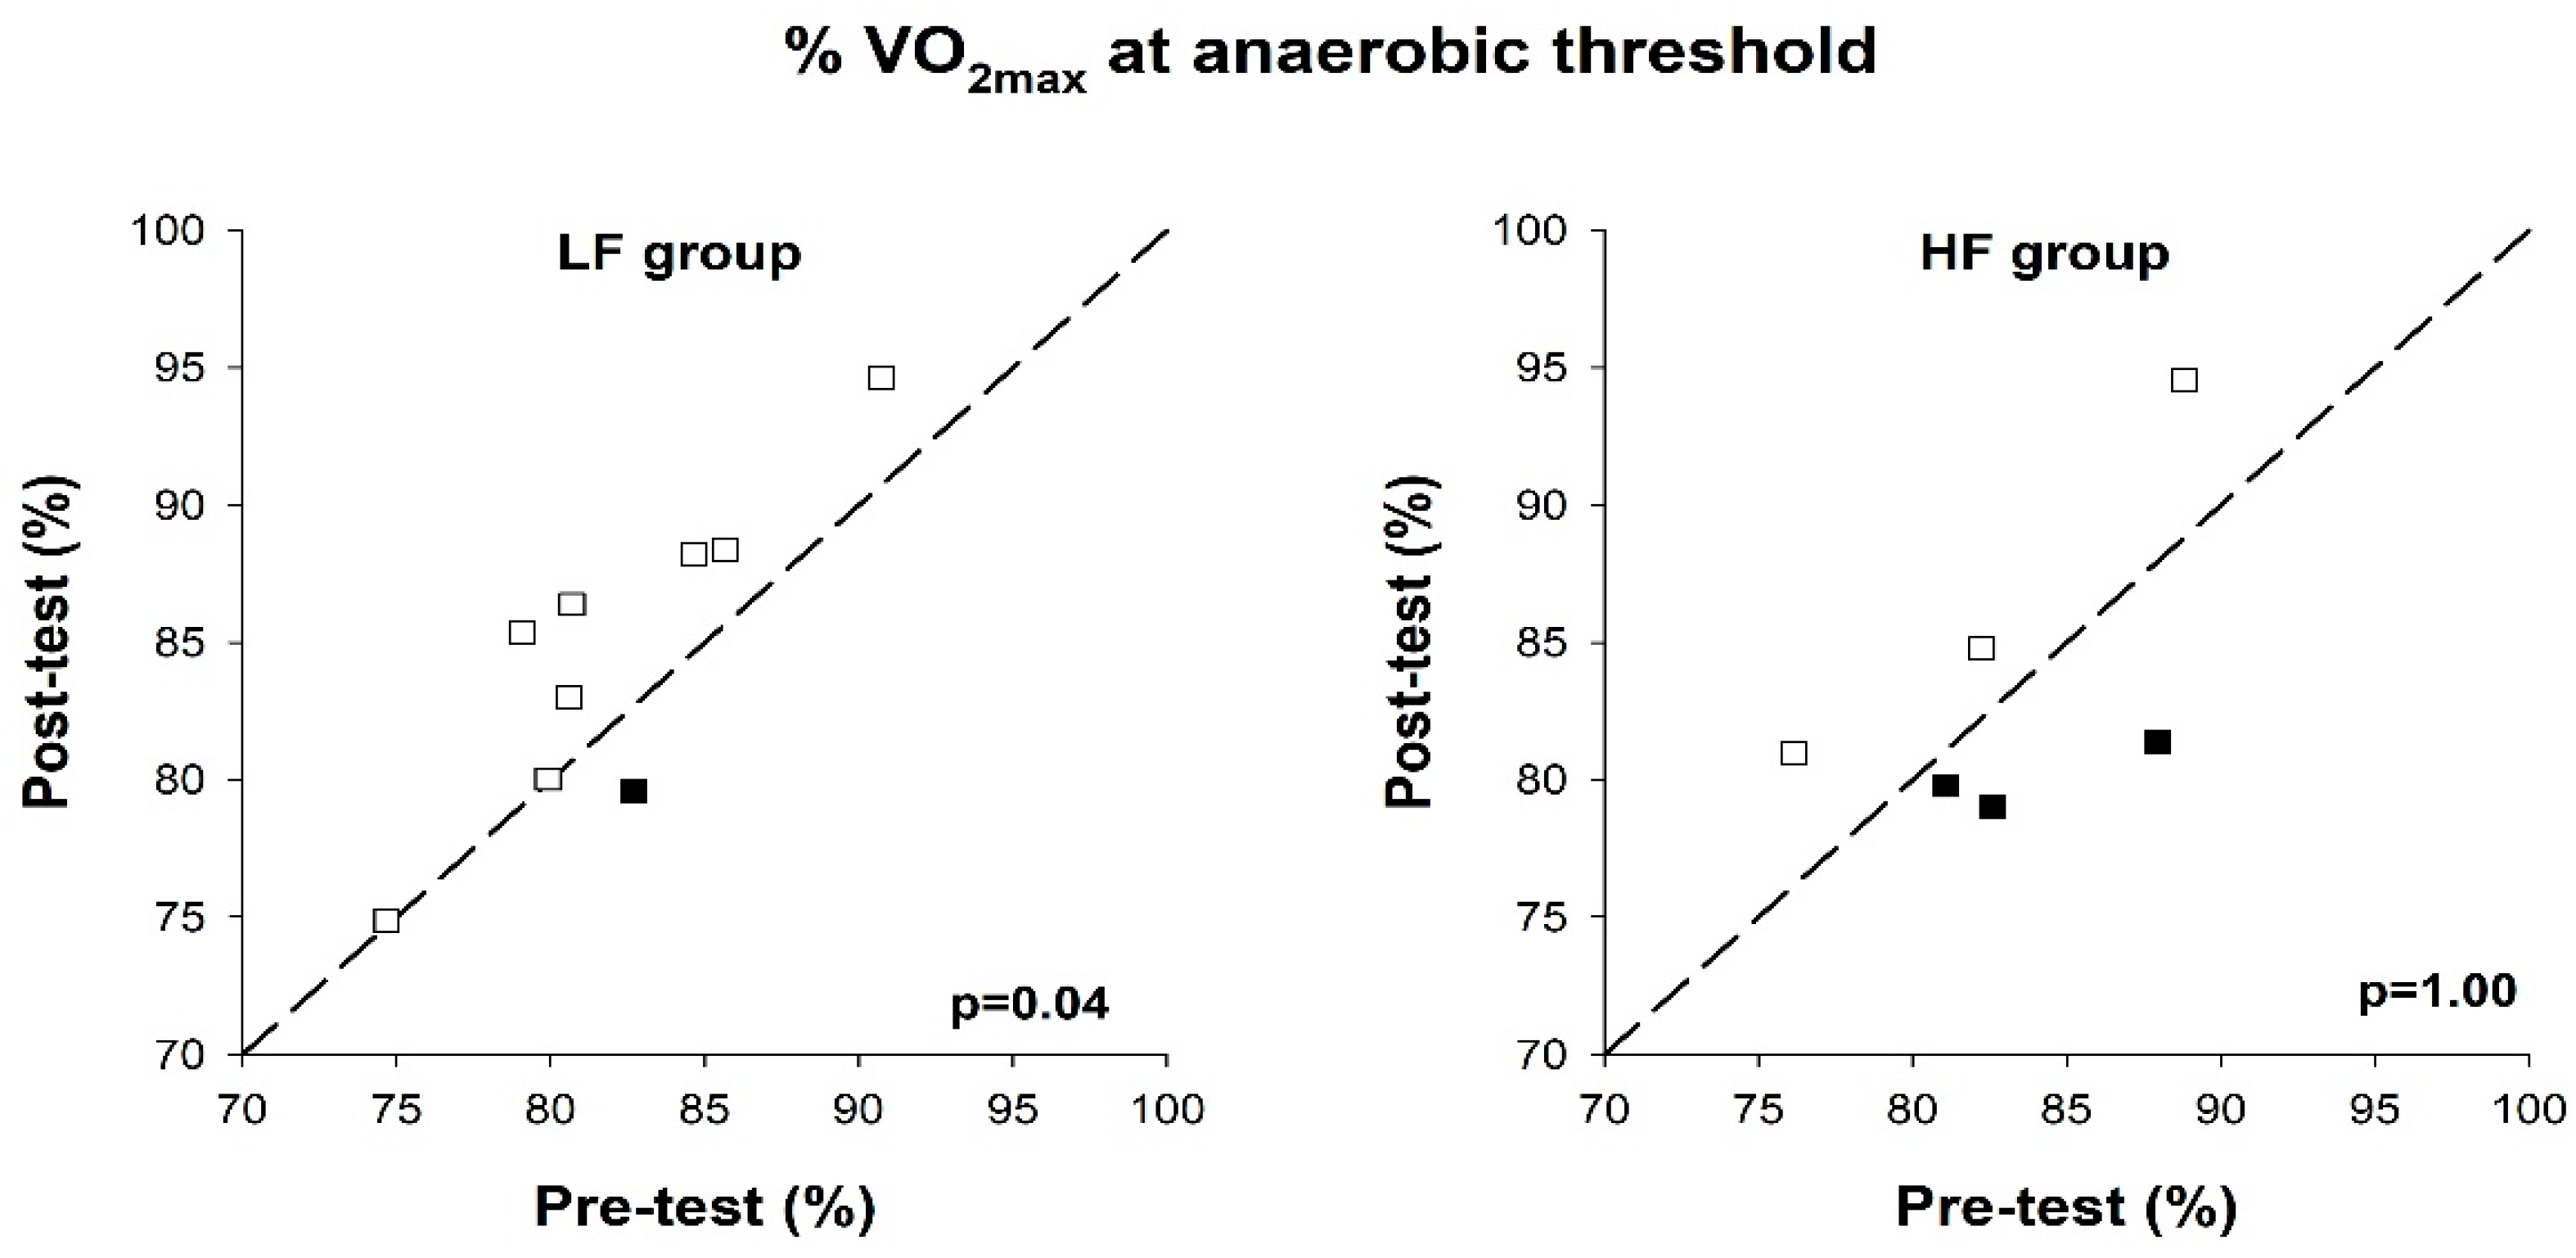
3.4. VO2max and % VO2max at AT
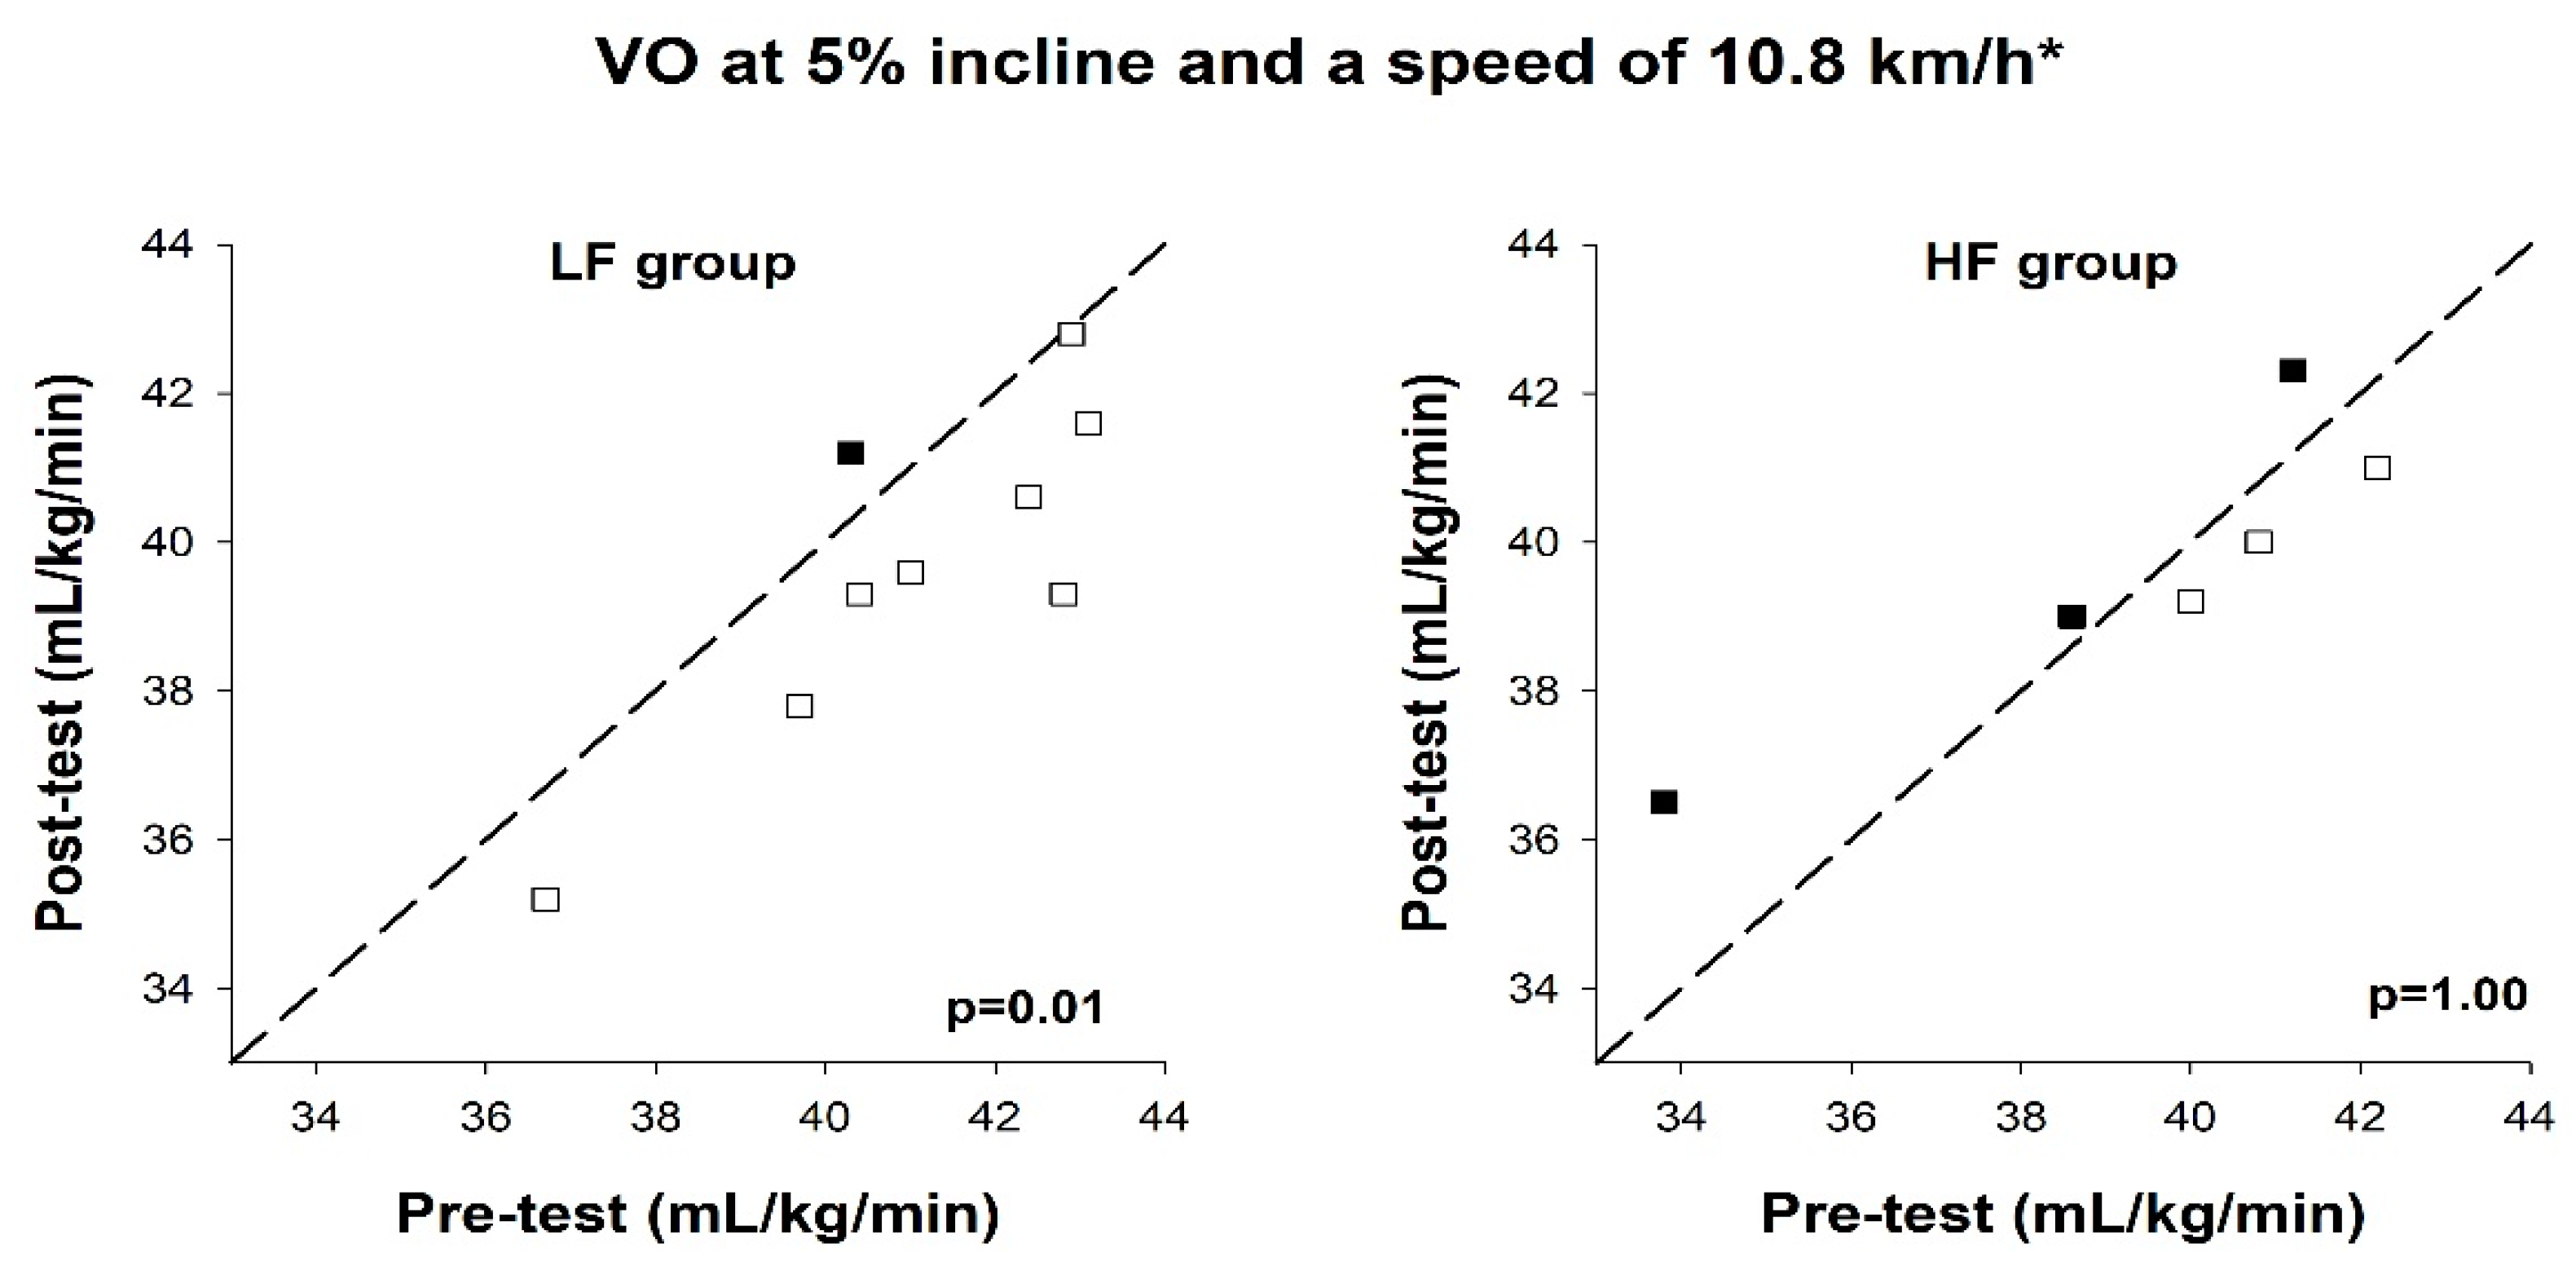
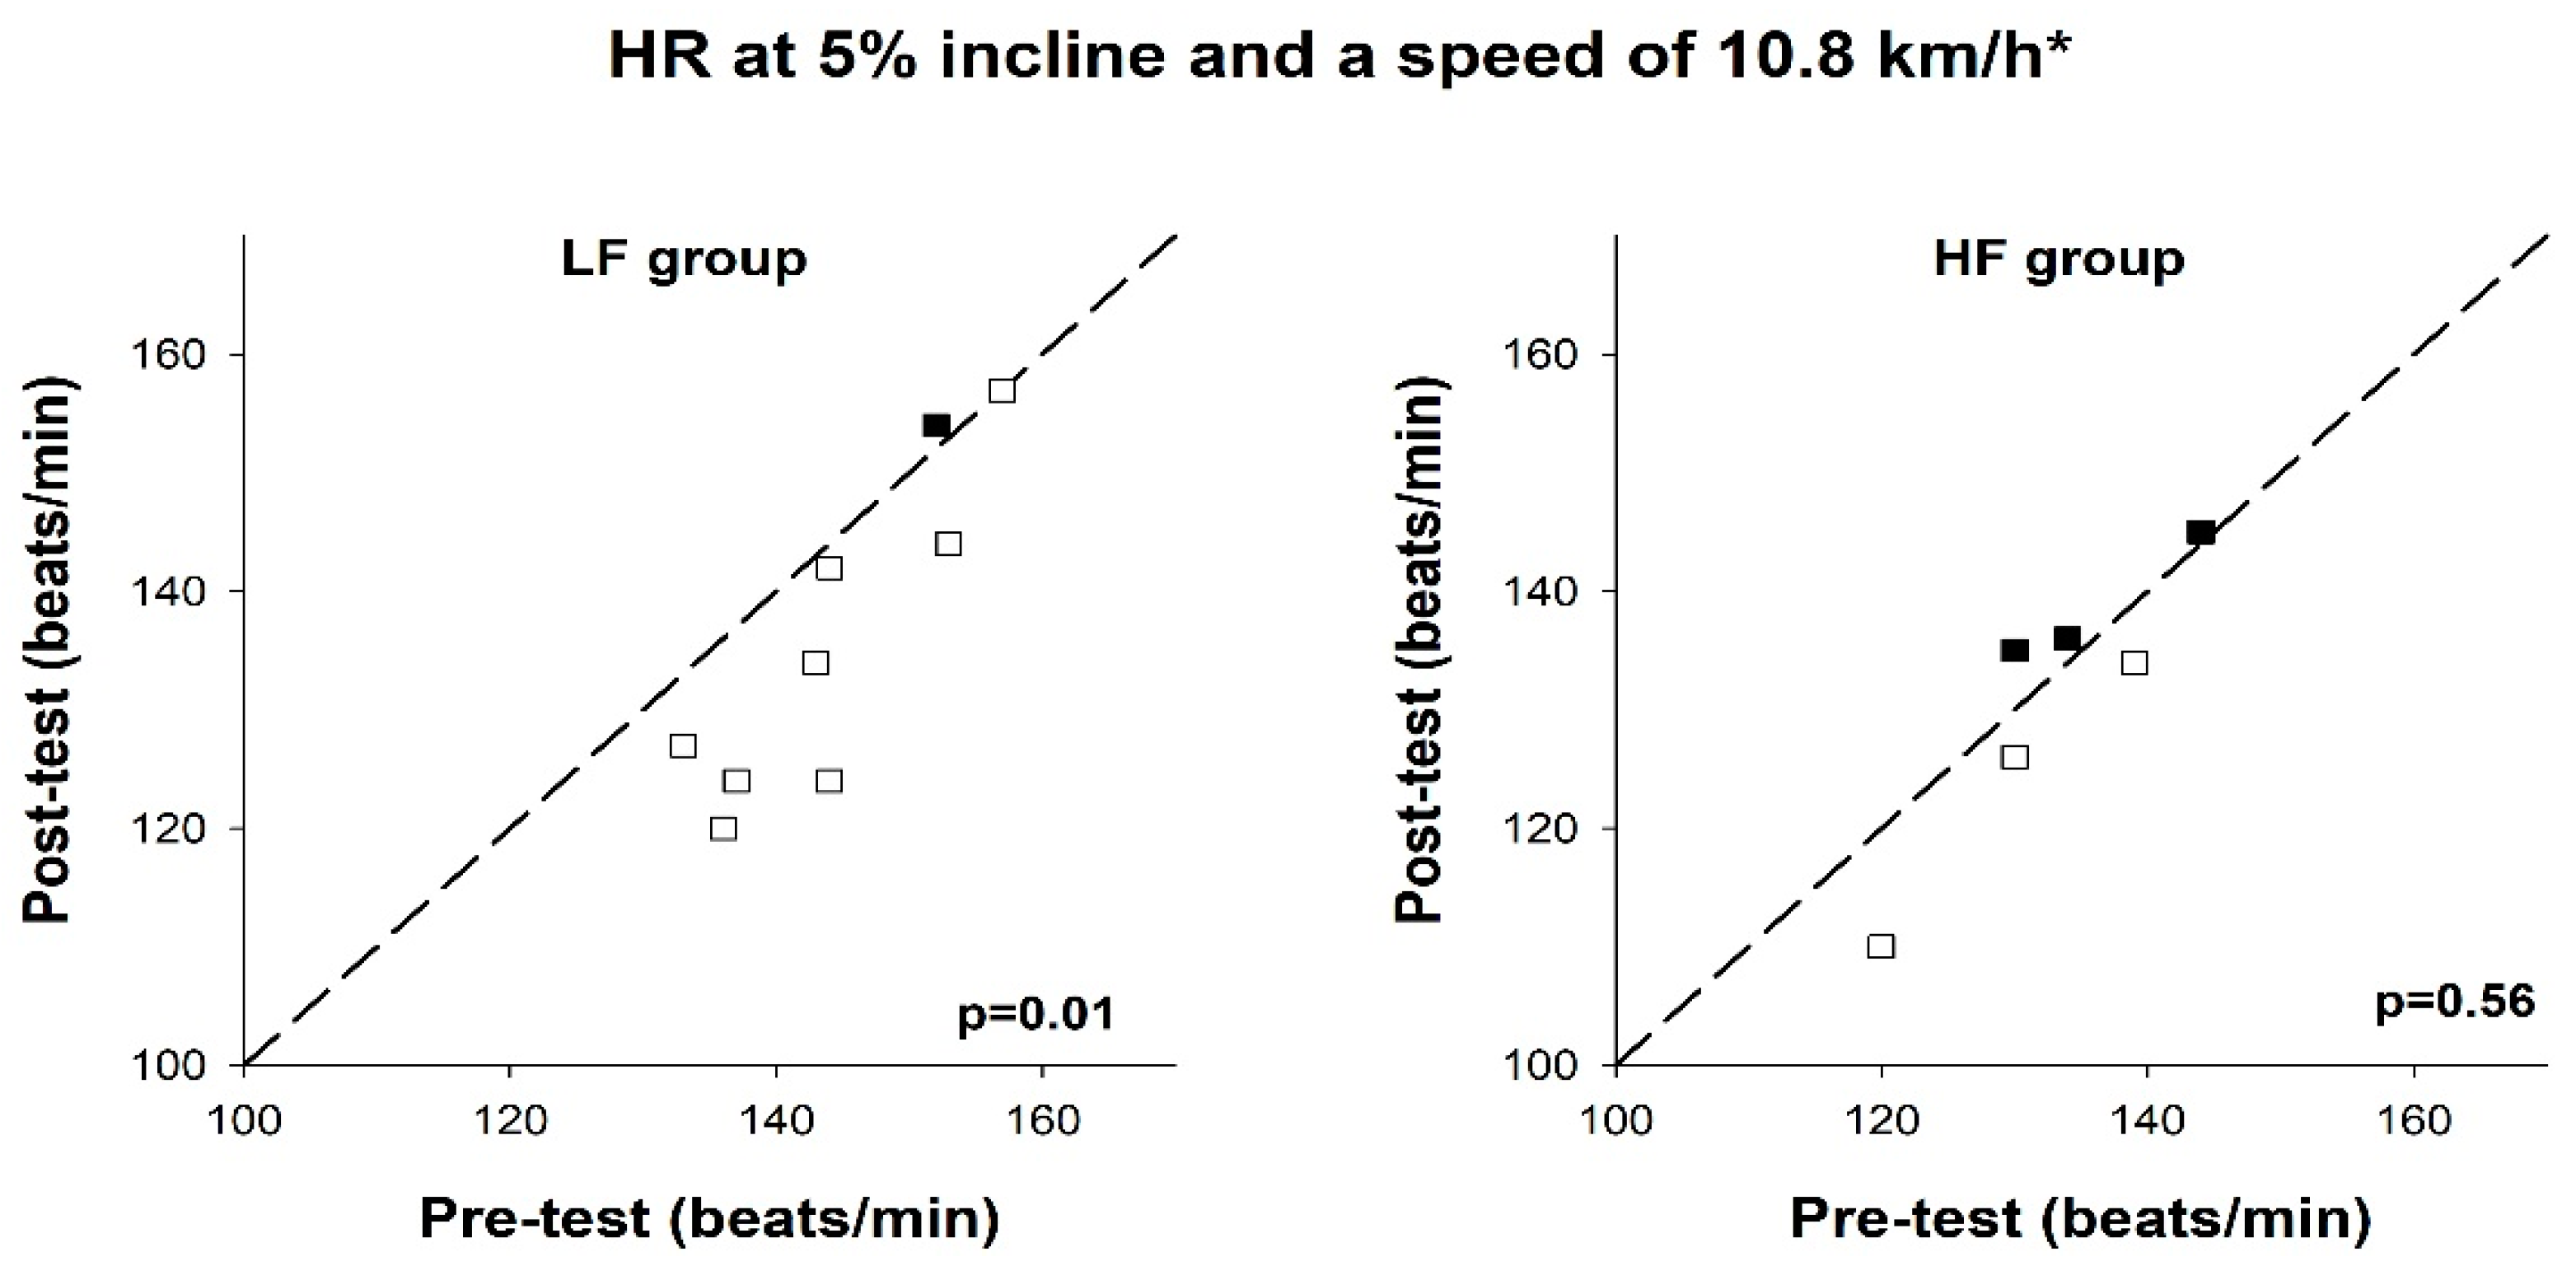
3.5. Exercise Economy
4. Discussion
4.1. Rollerski Time-Trial Performance
4.2. VO2max Test
4.3. Submaximal Rollerskiing
4.4. Practical Applications and Limitation of the Study
5. Conclusions
Author Contributions
Funding
Conflicts of Interest
References
- Billat, V.L.; Demarle, A.; Slawinski, J.; Paiva, M.; Koralsztein, J.P. Physical and training characteristics of top-class marathon runners. Med. Sci. Sports Exerc. 2001, 33, 2089–2097. [Google Scholar] [CrossRef] [PubMed]
- Seiler, S.; Tønnessen, E. Intervals, thresholds and long slow distance: The role of intensity and duration in endurance training. Sport Sci. 2009, 13, 32–53. [Google Scholar]
- Tønnessen, E. Hvorfor ble de Beste Best? En Casestudie av tre Kvinnelige Verdensenere i Orientering, Langrenn og Langdistanseløp; Norwegian School of Sport Sciences: Oslo, Norway, 2009. [Google Scholar]
- Reindell, H.; Roskamm, H. Ein Beitrag zu den physiologischen Grundlagen des Intervalltrainings unter besonderer Berücksichtigung des Kreislaufes. Schweiz. Z. Sportmed. 1959, 7, 1–8. [Google Scholar]
- Billat, V.L.; Slawinski, J.; Bocquet, V.; Demarle, A.; Lafitte, L.; Chassaing, P.; Koralsztein, J.P. Intermittent runs at the velocity associated with maximal oxygen uptake enables subjects to remain at maximal oxygen uptake for a longer time than intense but submaximal runs. Eur. J. Appl. Physiol. 2000, 81, 188–196. [Google Scholar] [CrossRef] [PubMed]
- Hurley, B.F.; Hagberg, J.M.; Allen, W.K.; Seals, D.R.; Young, J.C.; Cuddihee, R.W.; Holloszy, J.O. Effect of training on blood lactate levels during submaximal exercise. J. Appl. Physiol. Respir. Environ. Exerc. Physiol. 1984, 56, 1260–1264. [Google Scholar] [CrossRef]
- MacDougall, D.; Sale, D. Continuous vs. interval training: A review for the athlete and the coach. Can. J. Appl. Sport Sci. 1981, 6, 93–97. [Google Scholar] [PubMed]
- Smith, D.J.; Wenger, H.A. The 10 day aerobic mini-cycle: The effects of interval or continuous training at two different intensities. J. Sports Med. Phys. Fit. 1981, 21, 390–394. [Google Scholar]
- Daniels, J.; Scardina, N. Interval training and performance. Sports Med. 1984, 1, 327–334. [Google Scholar] [CrossRef]
- Daussin, F.N.; Ponsot, E.; Dufour, S.P.; Lonsdorfer-Wolf, E.; Doutreleau, S.; Geny, B.; Piquard, F.; Richard, R. Improvement of VO2max by cardiac output and oxygen extraction adaptation during intermittent versus continuous endurance training. Eur. J. Appl. Physiol. 2007, 101, 377–383. [Google Scholar] [CrossRef]
- Laursen, P.B.; Jenkins, D.G. The scientific basis for high-intensity interval training: Optimising training programmes and maximising performance in highly trained endurance athletes. Sports Med. 2002, 32, 53–73. [Google Scholar] [CrossRef]
- Rozenek, R.; Funato, K.; Kubo, J.; Hoshikawa, M.; Matsuo, A. Physiological responses to interval training sessions at velocities associated with VO2max. J. Strength Cond. Res. 2007, 21, 188–192. [Google Scholar]
- Helgerud, J.; Hoydal, K.; Wang, E.; Karlsen, T.; Berg, P.; Bjerkaas, M.; Simonsen, T.; Helgesen, C.; Hjorth, N.; Bach, R.; et al. Aerobic high-intensity intervals improve VO2max more than moderate training. Med. Sci. Sports Exerc. 2007, 39, 665–671. [Google Scholar] [CrossRef]
- Sandbakk, O.; Sandbakk, S.B.; Ettema, G.; Welde, B. Effects of intensity and duration in aerobic high-intensity interval training in highly trained junior cross-country skiers. J. Strength Cond. Res. 2013, 27, 1974–1980. [Google Scholar] [CrossRef]
- Seiler, S.; Joranson, K.; Olesen, B.V.; Hetlelid, K.J. Adaptations to aerobic interval training: Interactive effects of exercise intensity and total work duration. Scand. J. Med. Sci. Sports 2013, 23, 74–83. [Google Scholar] [CrossRef]
- Wenger, H.A.; Bell, G.J. The interactions of intensity, frequency and duration of exercise training in altering cardiorespiratory fitness. Sports Med. 1986, 3, 346–356. [Google Scholar] [CrossRef]
- Wakefield, B.R.; Glaister, M. Influence of work-interval intensity and duration on time spent at a high percentage of VO2max during intermittent supramaximal exercise. J. Strength Cond. Res. 2009, 23, 2548–2554. [Google Scholar] [CrossRef]
- Howley, E.T.; Bassett, D.R., Jr.; Welch, H.G. Criteria for maximal oxygen uptake: Review and commentary. Med. Sci. Sports Exerc. 1995, 27, 1292–1301. [Google Scholar] [CrossRef]
- Losnegard, T.; Mikkelsen, K.; Ronnestad, B.R.; Hallen, J.; Rud, B.; Raastad, T. The effect of heavy strength training on muscle mass and physical performance in elite cross country skiers. Scand. J. Med. Sci. Sports 2011, 21, 389–401. [Google Scholar] [CrossRef]
- Ronnestad, B.R.; Kojedal, O.; Losnegard, T.; Kvamme, B.; Raastad, T. Effect of heavy strength training on muscle thickness, strength, jump performance, and endurance performance in well-trained Nordic Combined athletes. Eur. J. Appl. Physiol. 2012, 112, 2341–2352. [Google Scholar] [CrossRef]
- Jones, A.M. A five year physiological case study of an Olympic runner. Br. J. Sports Med. 1998, 32, 39–43. [Google Scholar] [CrossRef]
- Rusko, H.K. Development of aerobic power in relation to age and training in cross-country skiers. Med. Sci. Sports Exerc. 1992, 24, 1040–1047. [Google Scholar] [CrossRef]
- Bangsbo, J. Estimation of lactate release from contracting muscles in man. Acta Physiol. Scand 1994, 150, 349–350. [Google Scholar] [CrossRef] [PubMed]
- Holloszy, J.O.; Coyle, E.F. Adaptations of skeletal muscle to endurance exercise and their metabolic consequences. J. Appl. Physiol. Respir. Environ. Exerc. Physiol. 1984, 56, 831–838. [Google Scholar] [CrossRef]
- Egginton, S. Physiological factors influencing capillary growth. Acta Physiol. 2011, 202, 225–239. [Google Scholar] [CrossRef]
- Ronnestad, B.R.; Ellefsen, S.; Nygaard, H.; Zacharoff, E.E.; Vikmoen, O.; Hansen, J.; Hallen, J. Effects of 12 weeks of block periodization on performance and performance indices in well-trained cyclists. Scand. J. Med. Sci. Sports 2014, 24, 327–335. [Google Scholar] [CrossRef]
- Hopker, J.; Coleman, D.; Passfield, L. Changes in cycling efficiency during a competitive season. Med. Sci. Sports Exerc. 2009, 41, 912–919. [Google Scholar] [CrossRef]
- Tokmakidis, S.P.; Leger, L.A.; Pilianidis, T.C. Failure to obtain a unique threshold on the blood lactate concentration curve during exercise. Eur. J. Appl. Physiol. Occup. Physiol. 1998, 77, 333–342. [Google Scholar] [CrossRef]
- Sahlin, K. Metabolic factors in fatigue. Sports Med. 1992, 13, 99–107. [Google Scholar] [CrossRef]
- Hansen, A.K.; Fischer, C.P.; Plomgaard, P.; Andersen, J.L.; Saltin, B.; Pedersen, B.K. Skeletal muscle adaptation: Training twice every second day vs. training once daily. J. Appl. Physiol. 2005, 98, 93–99. [Google Scholar] [CrossRef]


| Characteristics of the Subjects | HF Group | LF Group |
|---|---|---|
| Gender | ♂ = 5, ♀ = 1 | ♂ = 8, ♀ = 1 |
| Age (years) | 22.0 (18.8–26.0) | 22.0 (18.0–22.5) |
| Height (m) | 1.81 (1.75–1.86) | 1.82 (1.80–1.84) |
| Body mass (kg) | 72.3 (64.6–78.0) | 76.9 (72.1–79.9) |
| VO2max (mL/min/kg) | 67.8 (65.5–70.2) | 70.7 (67.0–73.9) |
| Training volume last 12 months (hours) | 565 (431–638) | 650 (520–755) |
| Training volume last 2 months (hours) | 65 (58–81) | 75 (63–80) |
| Intensity Zone | % of HRmax | Blood Lactate (mmol/L) * | Examples of Training Models |
|---|---|---|---|
| I-zone 5 | 92–100 | 6.0–10.0 | Interval training with maximal or near maximal exertion. Recovery period equivalent to 70%–90% of the work interval time. |
| I-zone 4 | 87–92 | 4.0–6.0 | High-intensity continuous training or intervals with a high level of exertion. Recovery periods equivalent to approximately 50% of the work time. |
| I-zone 3 | 82–87 | 2.5–4.0 | Natural interval training, intensive continuous training, or long intervals. Recovery periods equivalent to 20%–30% of the work time. |
| I-zone 2 | 72–82 | 1.5–2.5 | Moderate intensity continuous work. |
| I-zone 1 | 55–72 | <1.5 | Recovery sessions and low-intensity continuous work. |
© 2020 by the authors. Licensee MDPI, Basel, Switzerland. This article is an open access article distributed under the terms and conditions of the Creative Commons Attribution (CC BY) license (http://creativecommons.org/licenses/by/4.0/).
Share and Cite
Tønnessen, E.; Hisdal, J.; Ronnestad, B.R. Influence of Interval Training Frequency on Time-Trial Performance in Elite Endurance Athletes. Int. J. Environ. Res. Public Health 2020, 17, 3190. https://doi.org/10.3390/ijerph17093190
Tønnessen E, Hisdal J, Ronnestad BR. Influence of Interval Training Frequency on Time-Trial Performance in Elite Endurance Athletes. International Journal of Environmental Research and Public Health. 2020; 17(9):3190. https://doi.org/10.3390/ijerph17093190
Chicago/Turabian StyleTønnessen, Espen, Jonny Hisdal, and Bent R. Ronnestad. 2020. "Influence of Interval Training Frequency on Time-Trial Performance in Elite Endurance Athletes" International Journal of Environmental Research and Public Health 17, no. 9: 3190. https://doi.org/10.3390/ijerph17093190
APA StyleTønnessen, E., Hisdal, J., & Ronnestad, B. R. (2020). Influence of Interval Training Frequency on Time-Trial Performance in Elite Endurance Athletes. International Journal of Environmental Research and Public Health, 17(9), 3190. https://doi.org/10.3390/ijerph17093190