Multi-Agent-Based Urban Vegetation Design

 ,
, 


Abstract
1. Introduction
2. Literature Review
2.1. Vegetation Practices in Urban Street Planning
2.2. Need for an Automated Urban Street Planting Approach
3. Research Design and Framework
4. Proposed Prototype System Based on Framework
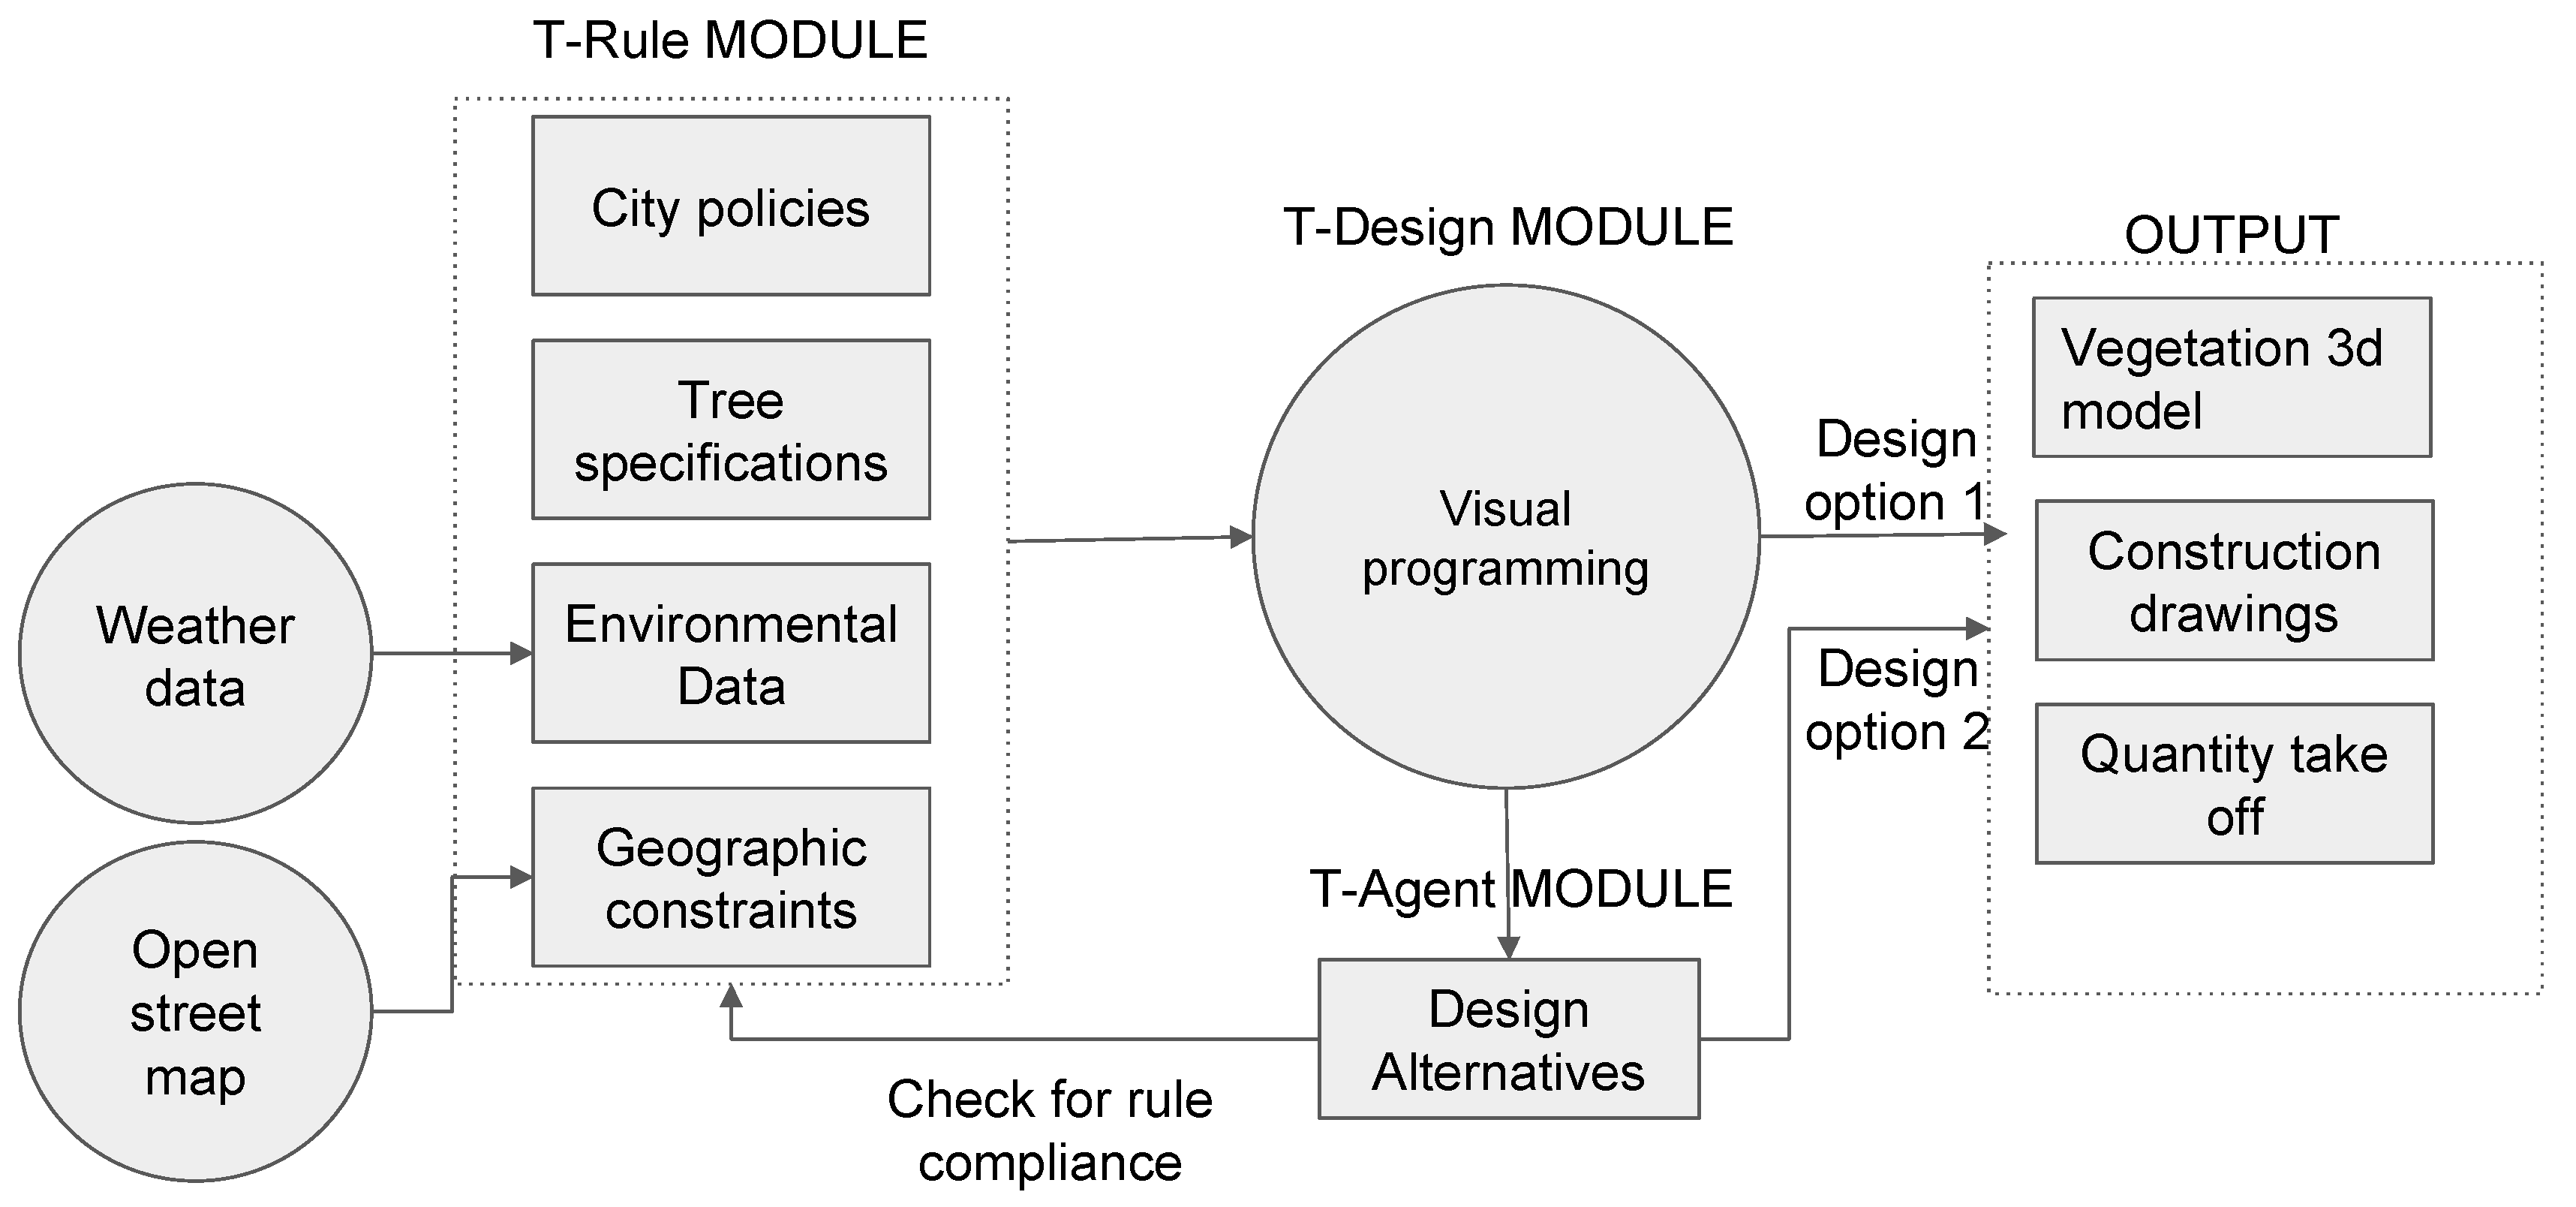
4.1. Rule Extraction (T-Rule) Module
4.2. Street Vegetation Design (T-Design) Module
4.3. Multi-Agent Alternative Generation (T-Agent) Module
5. Experimental Run
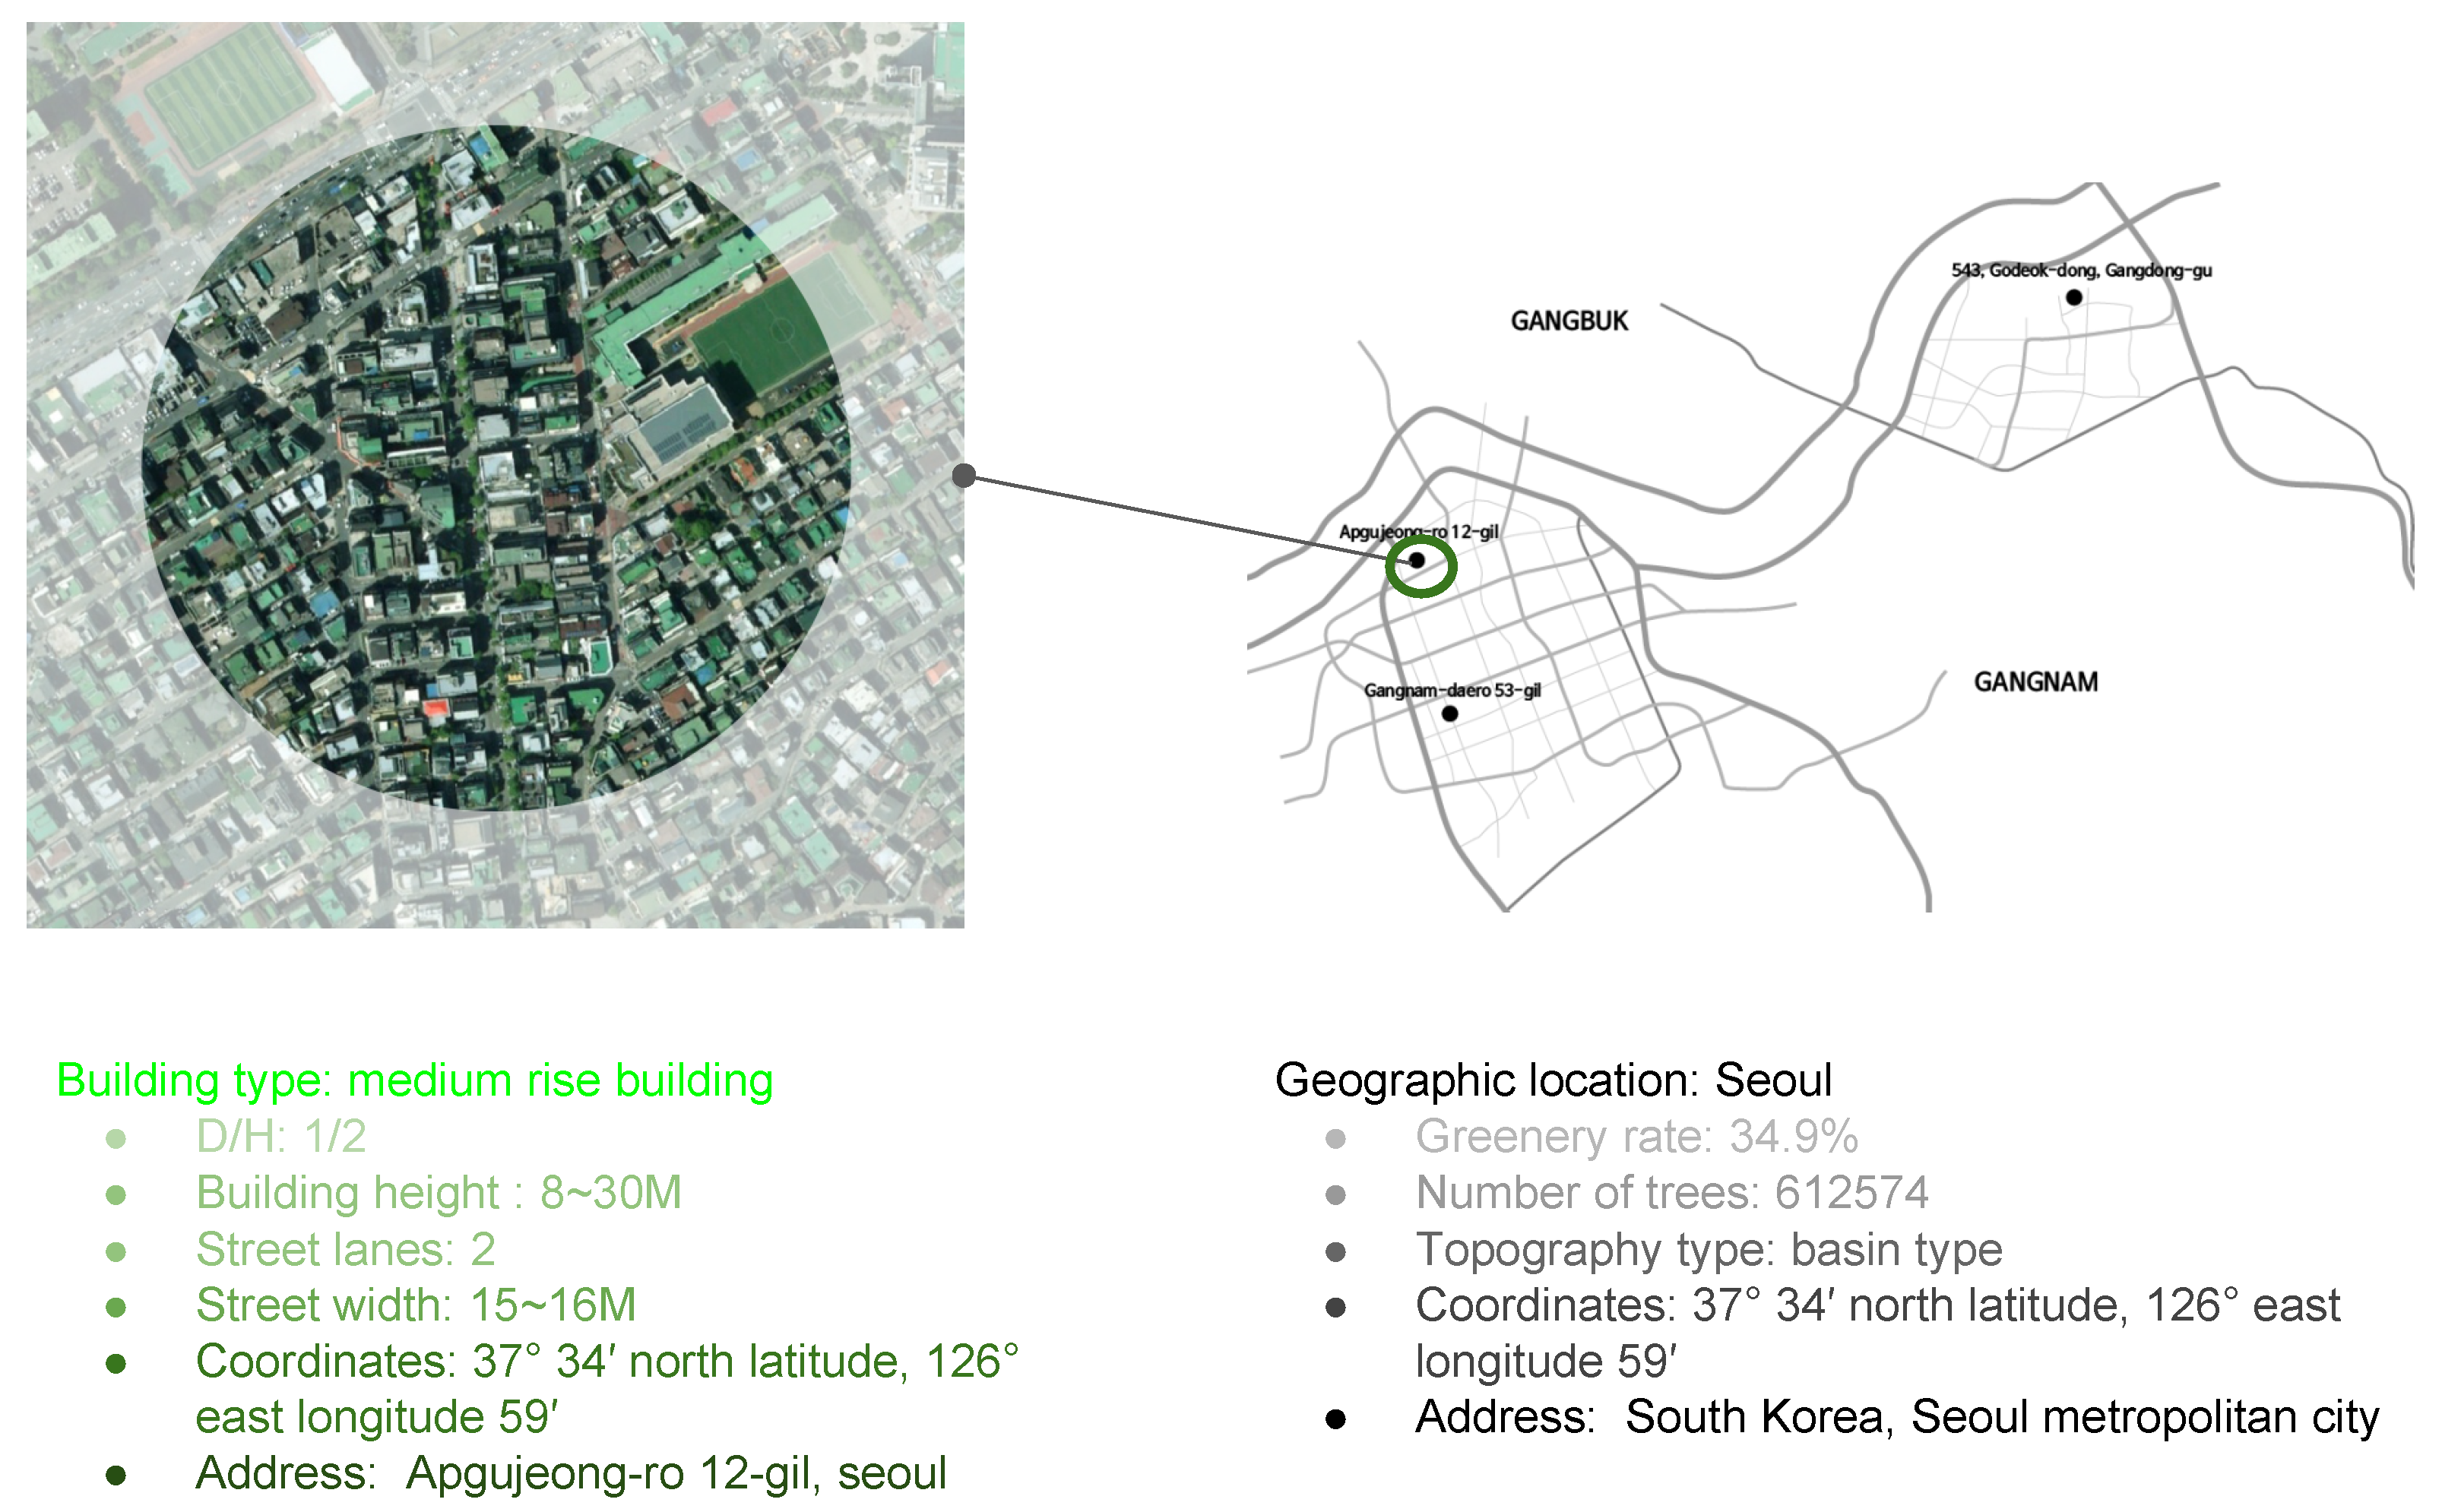
5.1. Case Study
- 1.
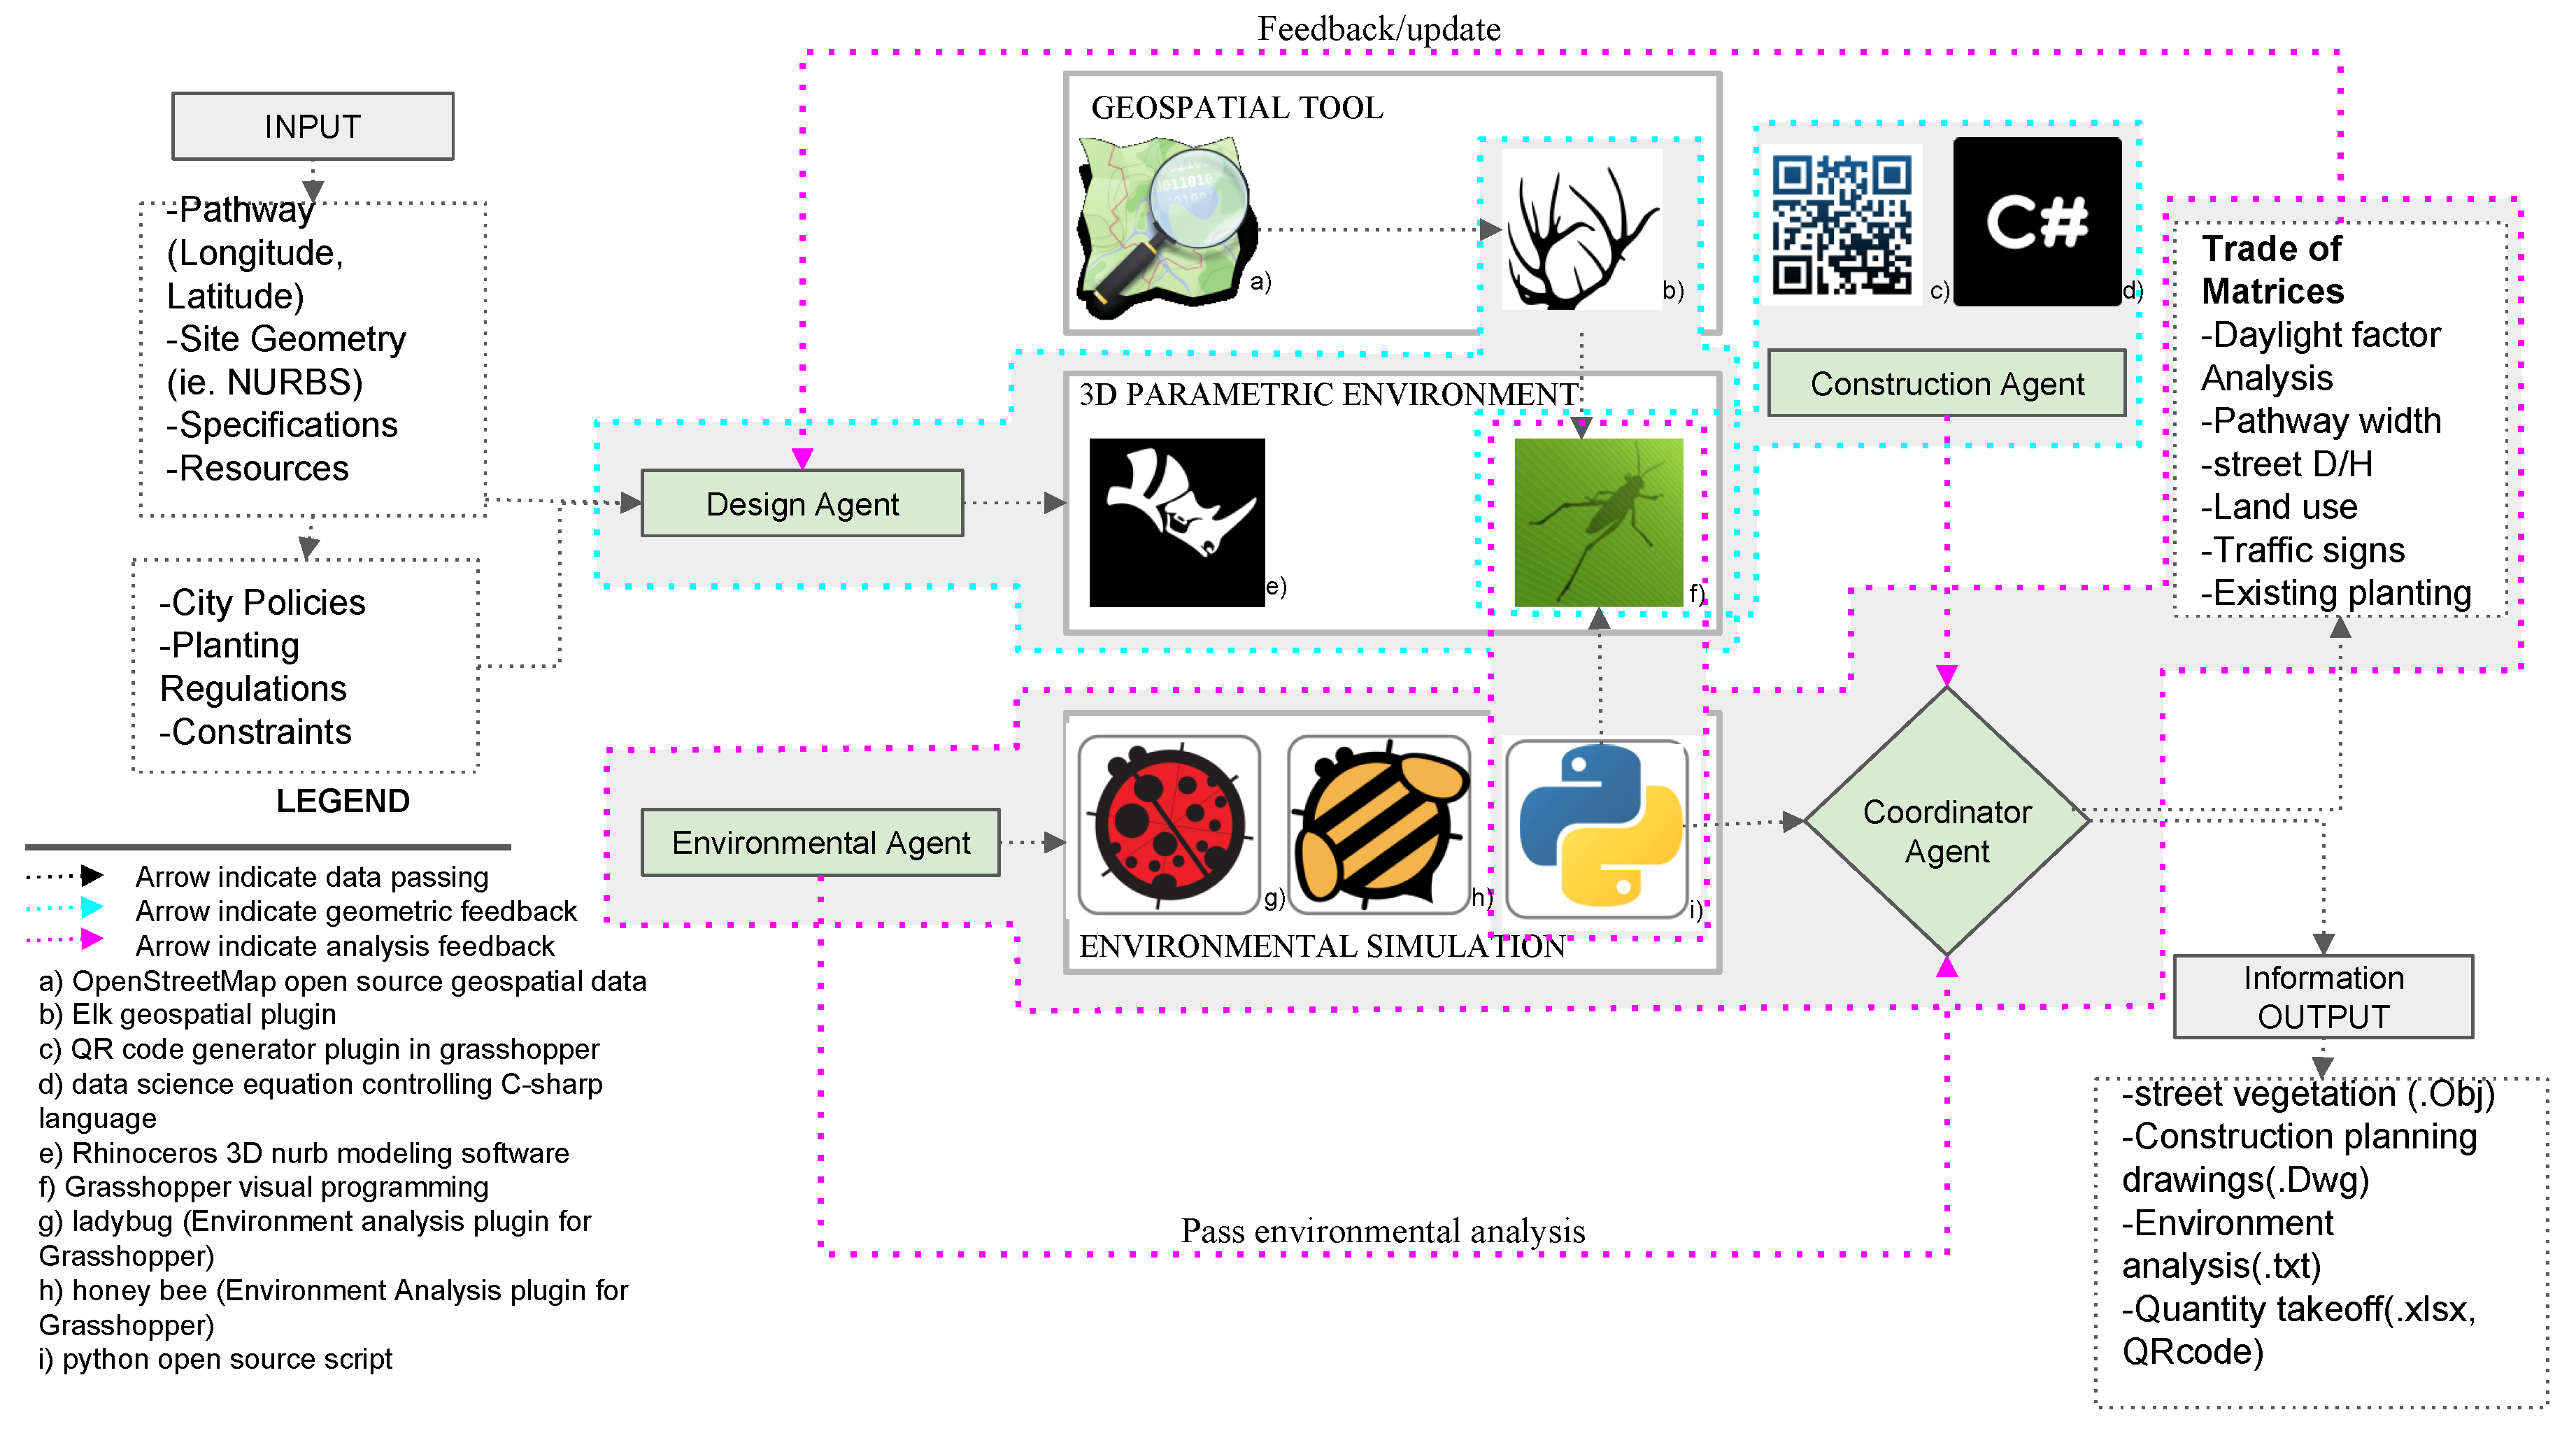
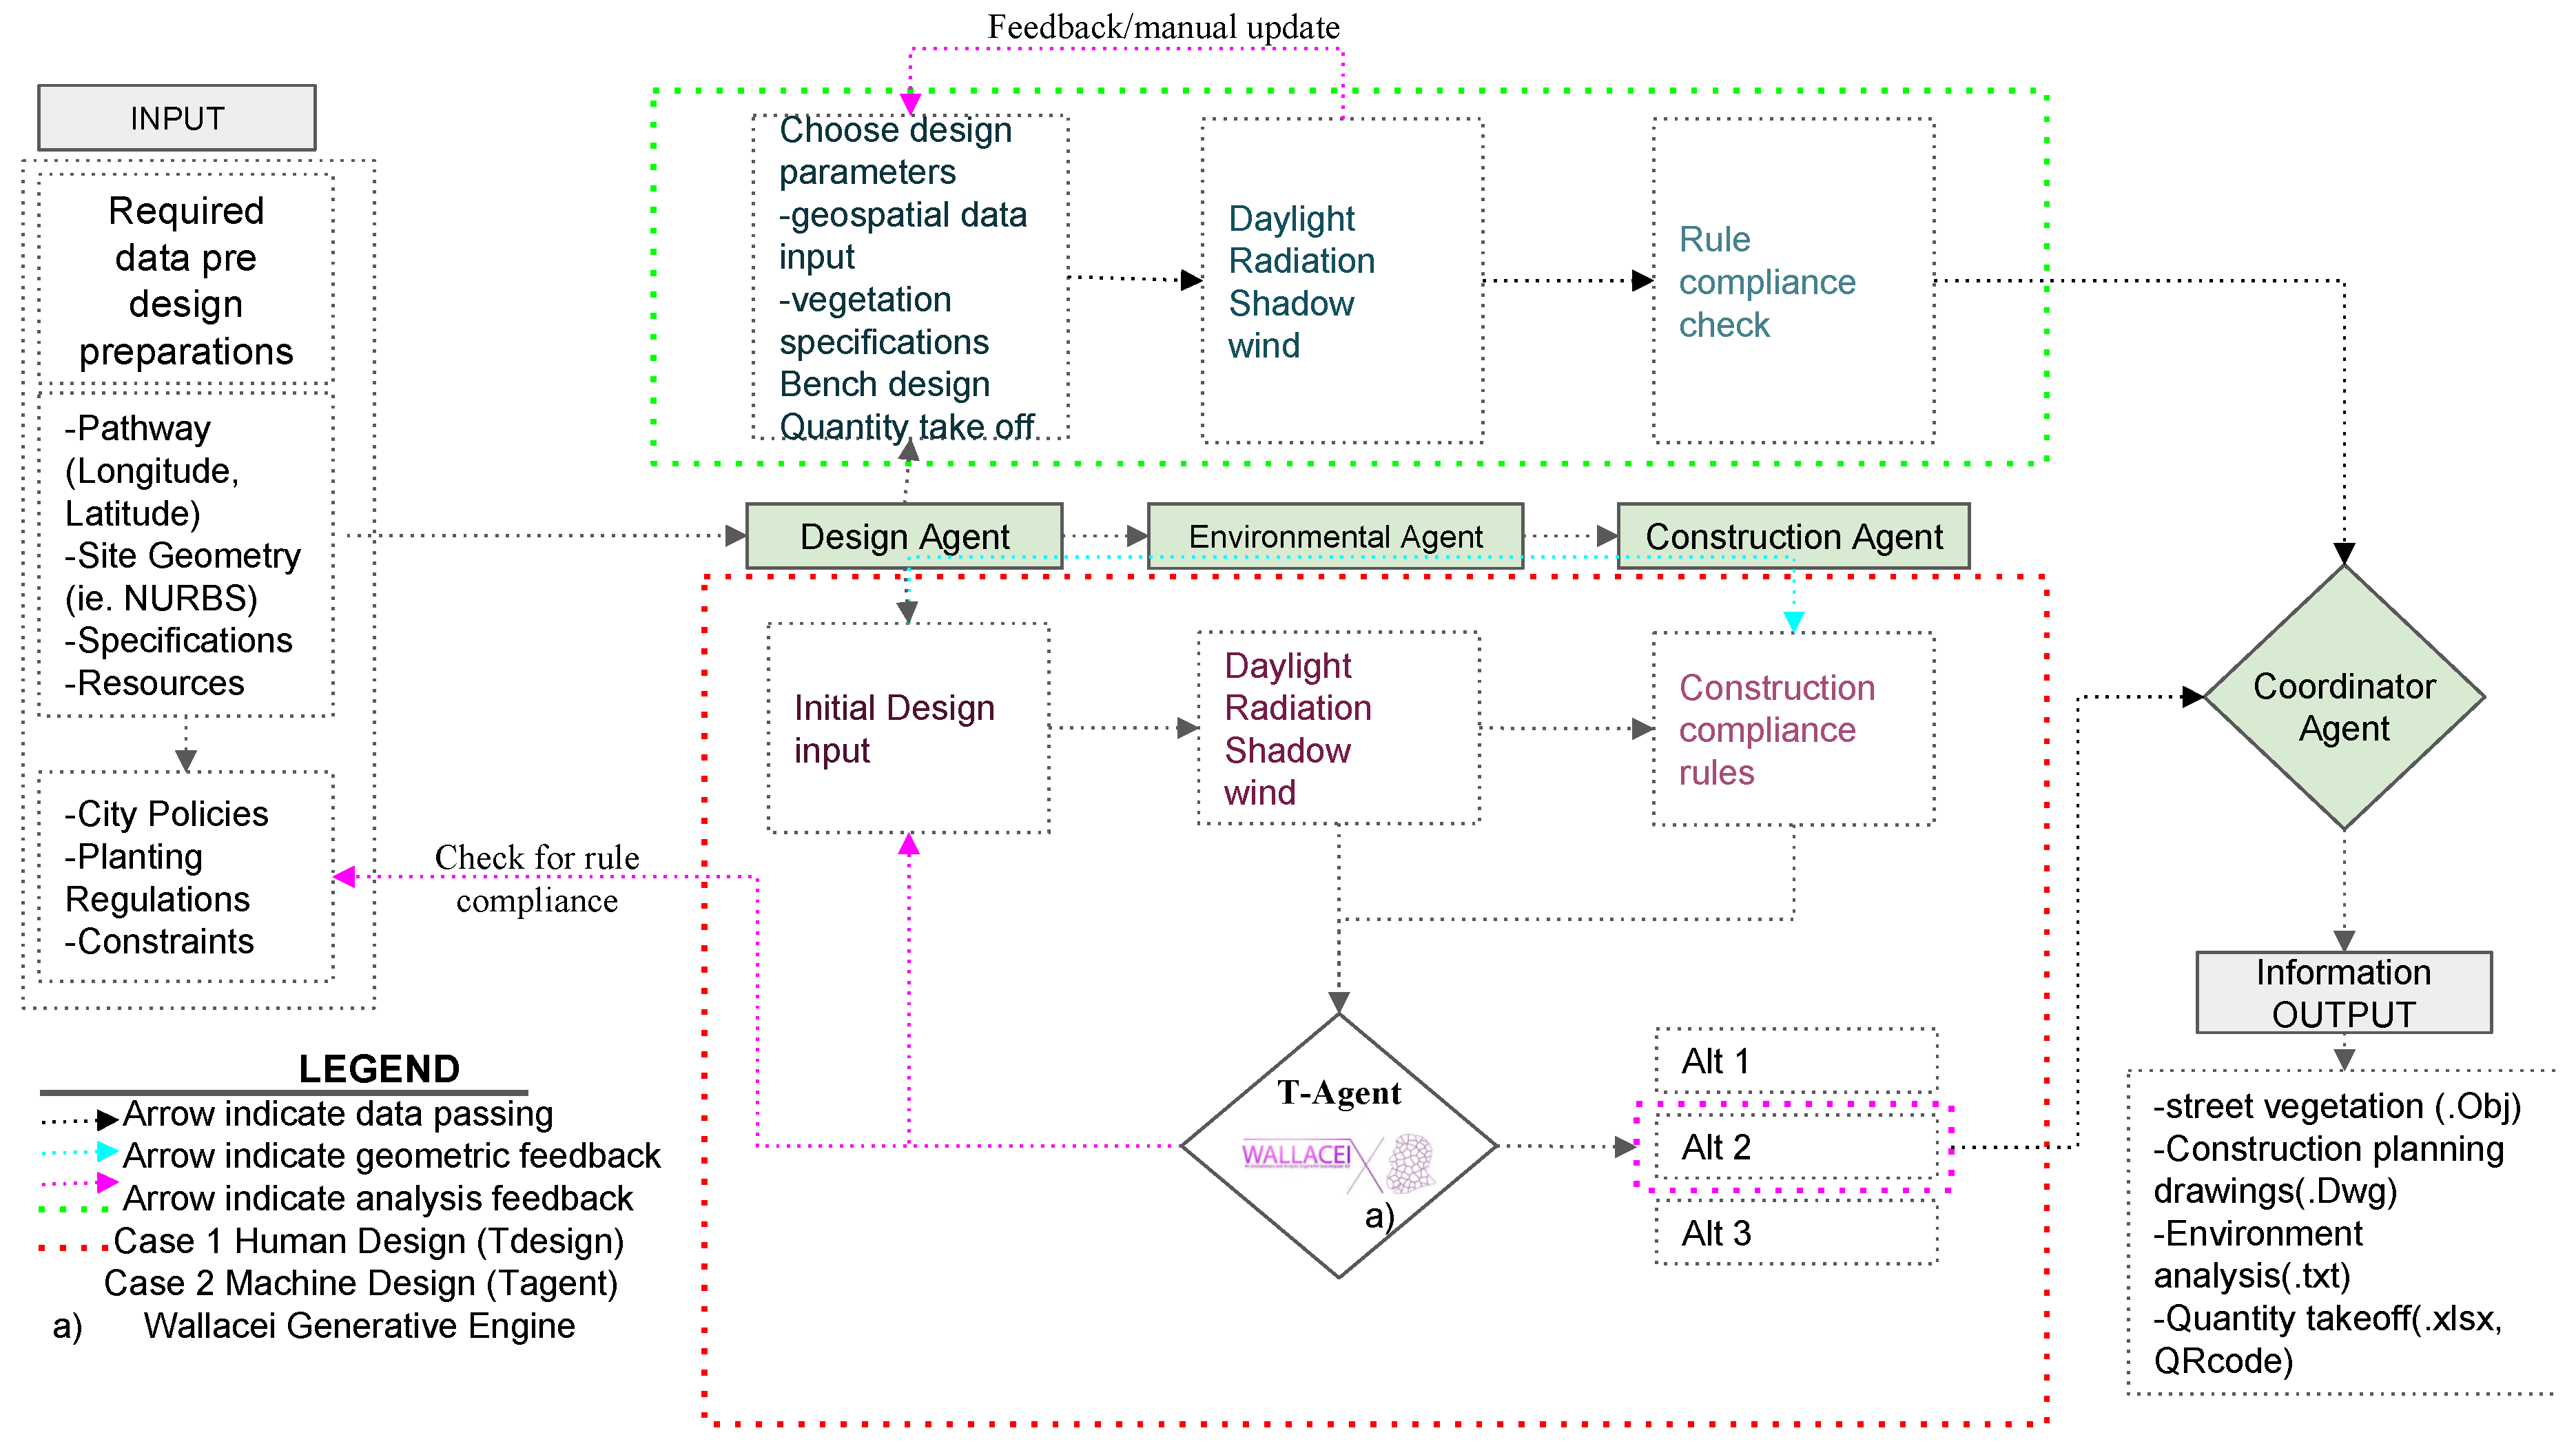
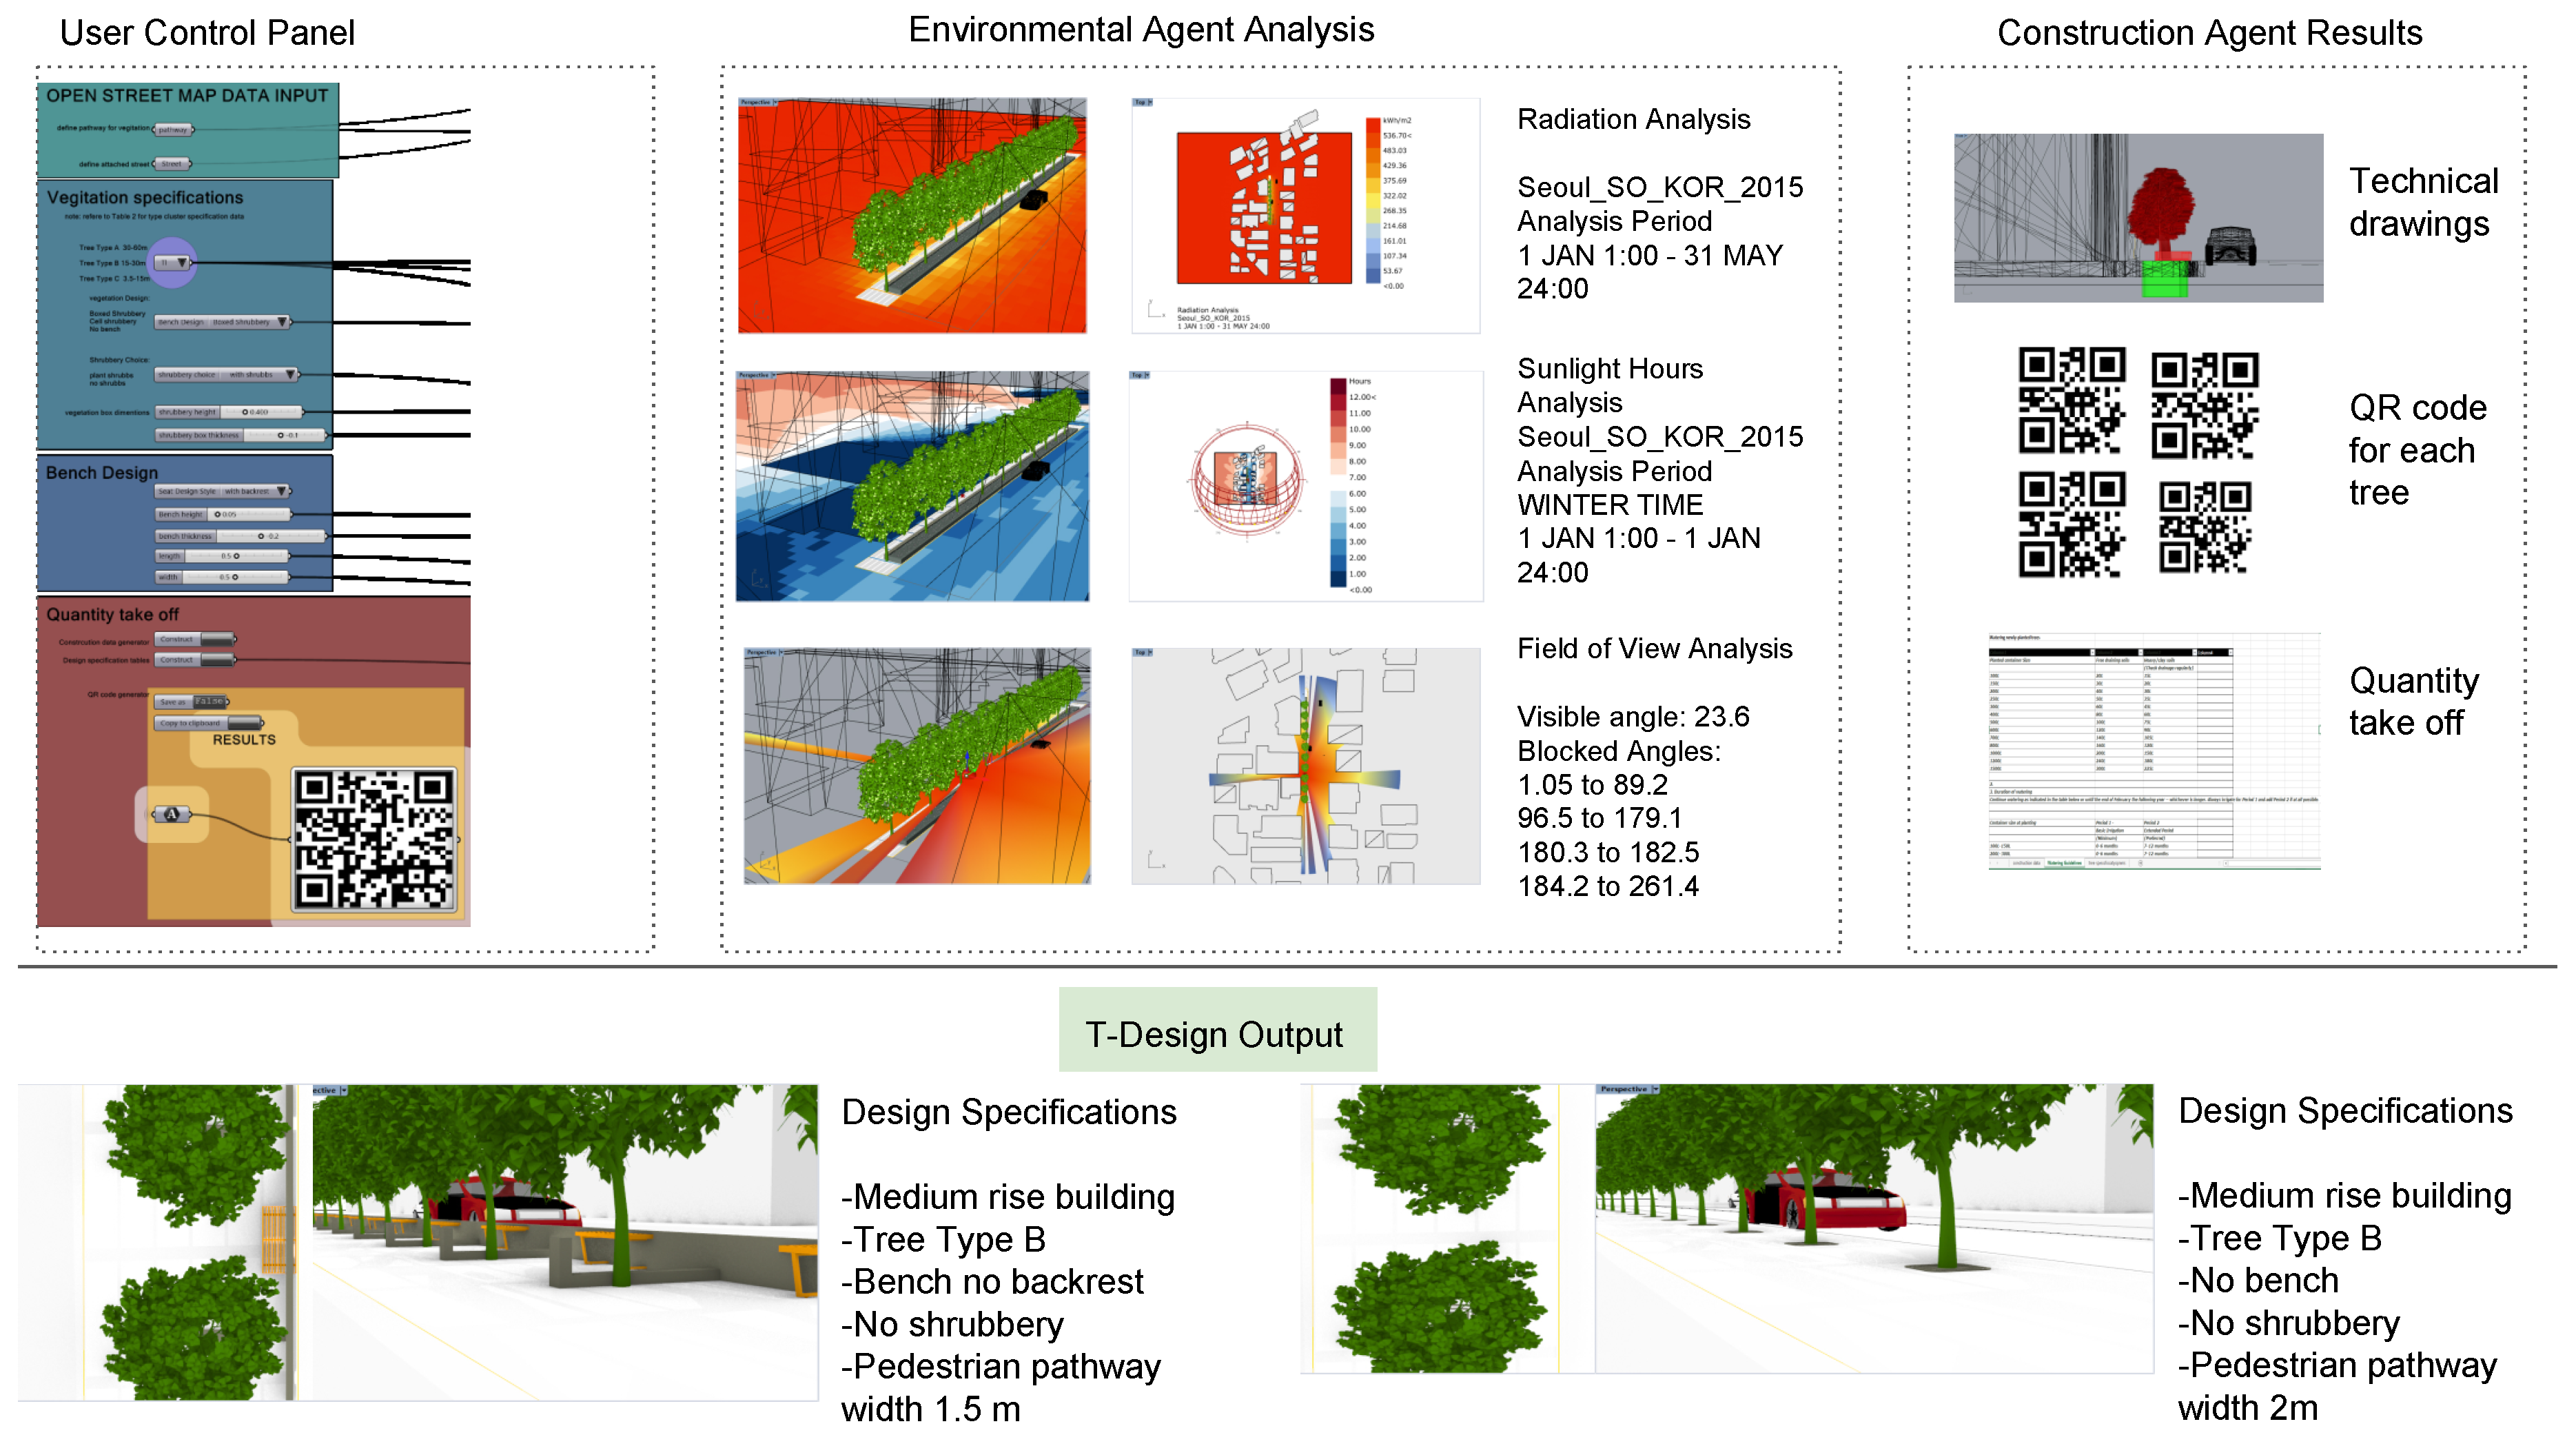
- The user sets input parameters and initializes the design agent runs. The system implements the environmental agent to find the optimal tree positions. At each iteration, the system produces a unique model where the position of trees provides comfort daylight to the surrounding. The produced models are passed onto the DLA and CDA for lighting analysis.
- 2.
- When the environmental analysis is completed, the produced models are ranked and passed onto the construction agent to apply the regulation equations terms of metrics. Then, it produces the technical drawings for the construction planning stage.
- 3.
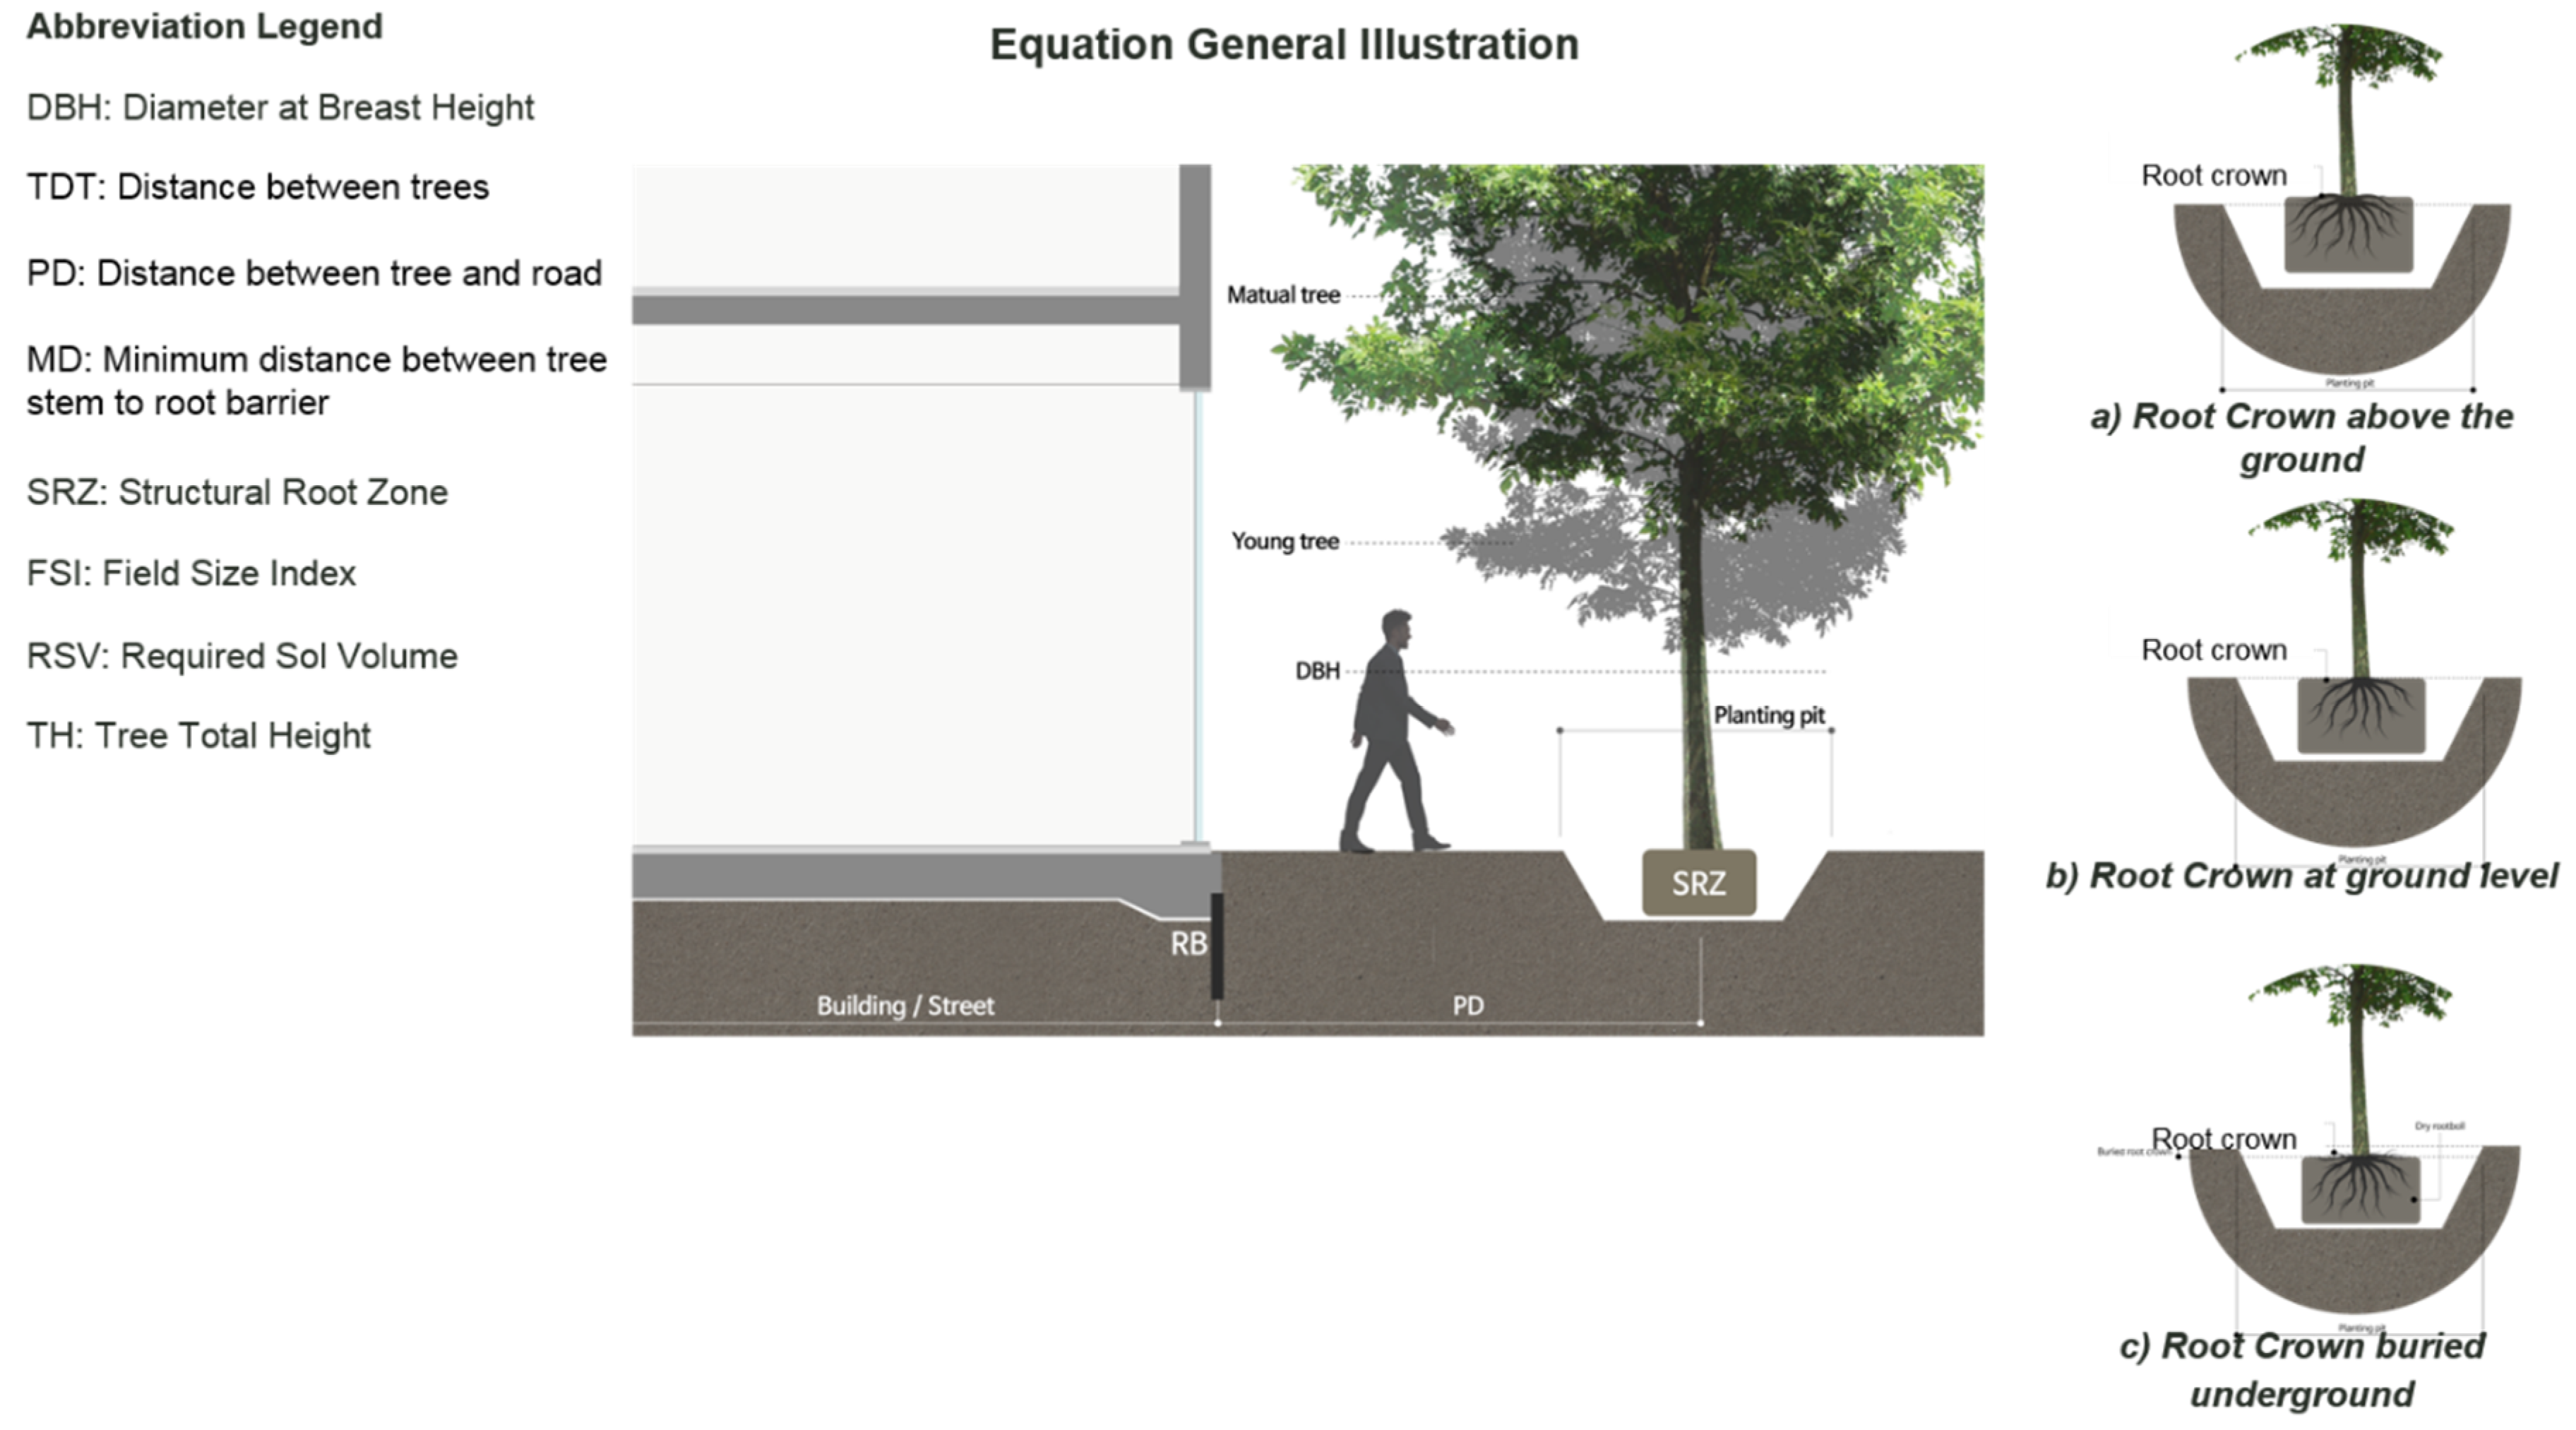
- The construction agent assigns equation logics to control different variables and defines the heuristic function as follows: (a) Equation (1) and Equation (7) control the distance between trees; (b) Equations (2) and (3) calculate the distance between the tree root crown and the street centerline depending on the tree type; (c) Equations (4)–(6) cluster the trees depending on the D/H of the neighborhood buildings and calculates the diameter at breast height; (d) Equation (8) calculate the SRZ needed for each tree type cluster in correspondence with the infrastructure or restriction defined by the user; (e) Equation (9) installs the RB at the minimum distance between the street and the tree stem; (f) Equation (10) calculates the soil volume needed for each tree cluster type defined by the previous equations as illustrated in Table 1.
- 4.
- The coordinator agent outputs are street vegetation design model, construction planning technical drawings, environmental analysis, and quantity take-off as shown in Figure 6.
5.2. T-Design Tool Usage Feedback Questionnaire
6. Discussion
7. Conclusions
- 1.
- The research depicted that the developed tool has ample potential to enhance the urban vegetation planning by producing designs that comply with city regulations and tree specifications. In addition, citizens can generate their own pathway vegetation automatic 3D models without prior knowledge in urban planning, which helps to narrow the gap between the urban planners and occupants and helps the citizens engage more in vegetation awareness and shape their city.
- 2.
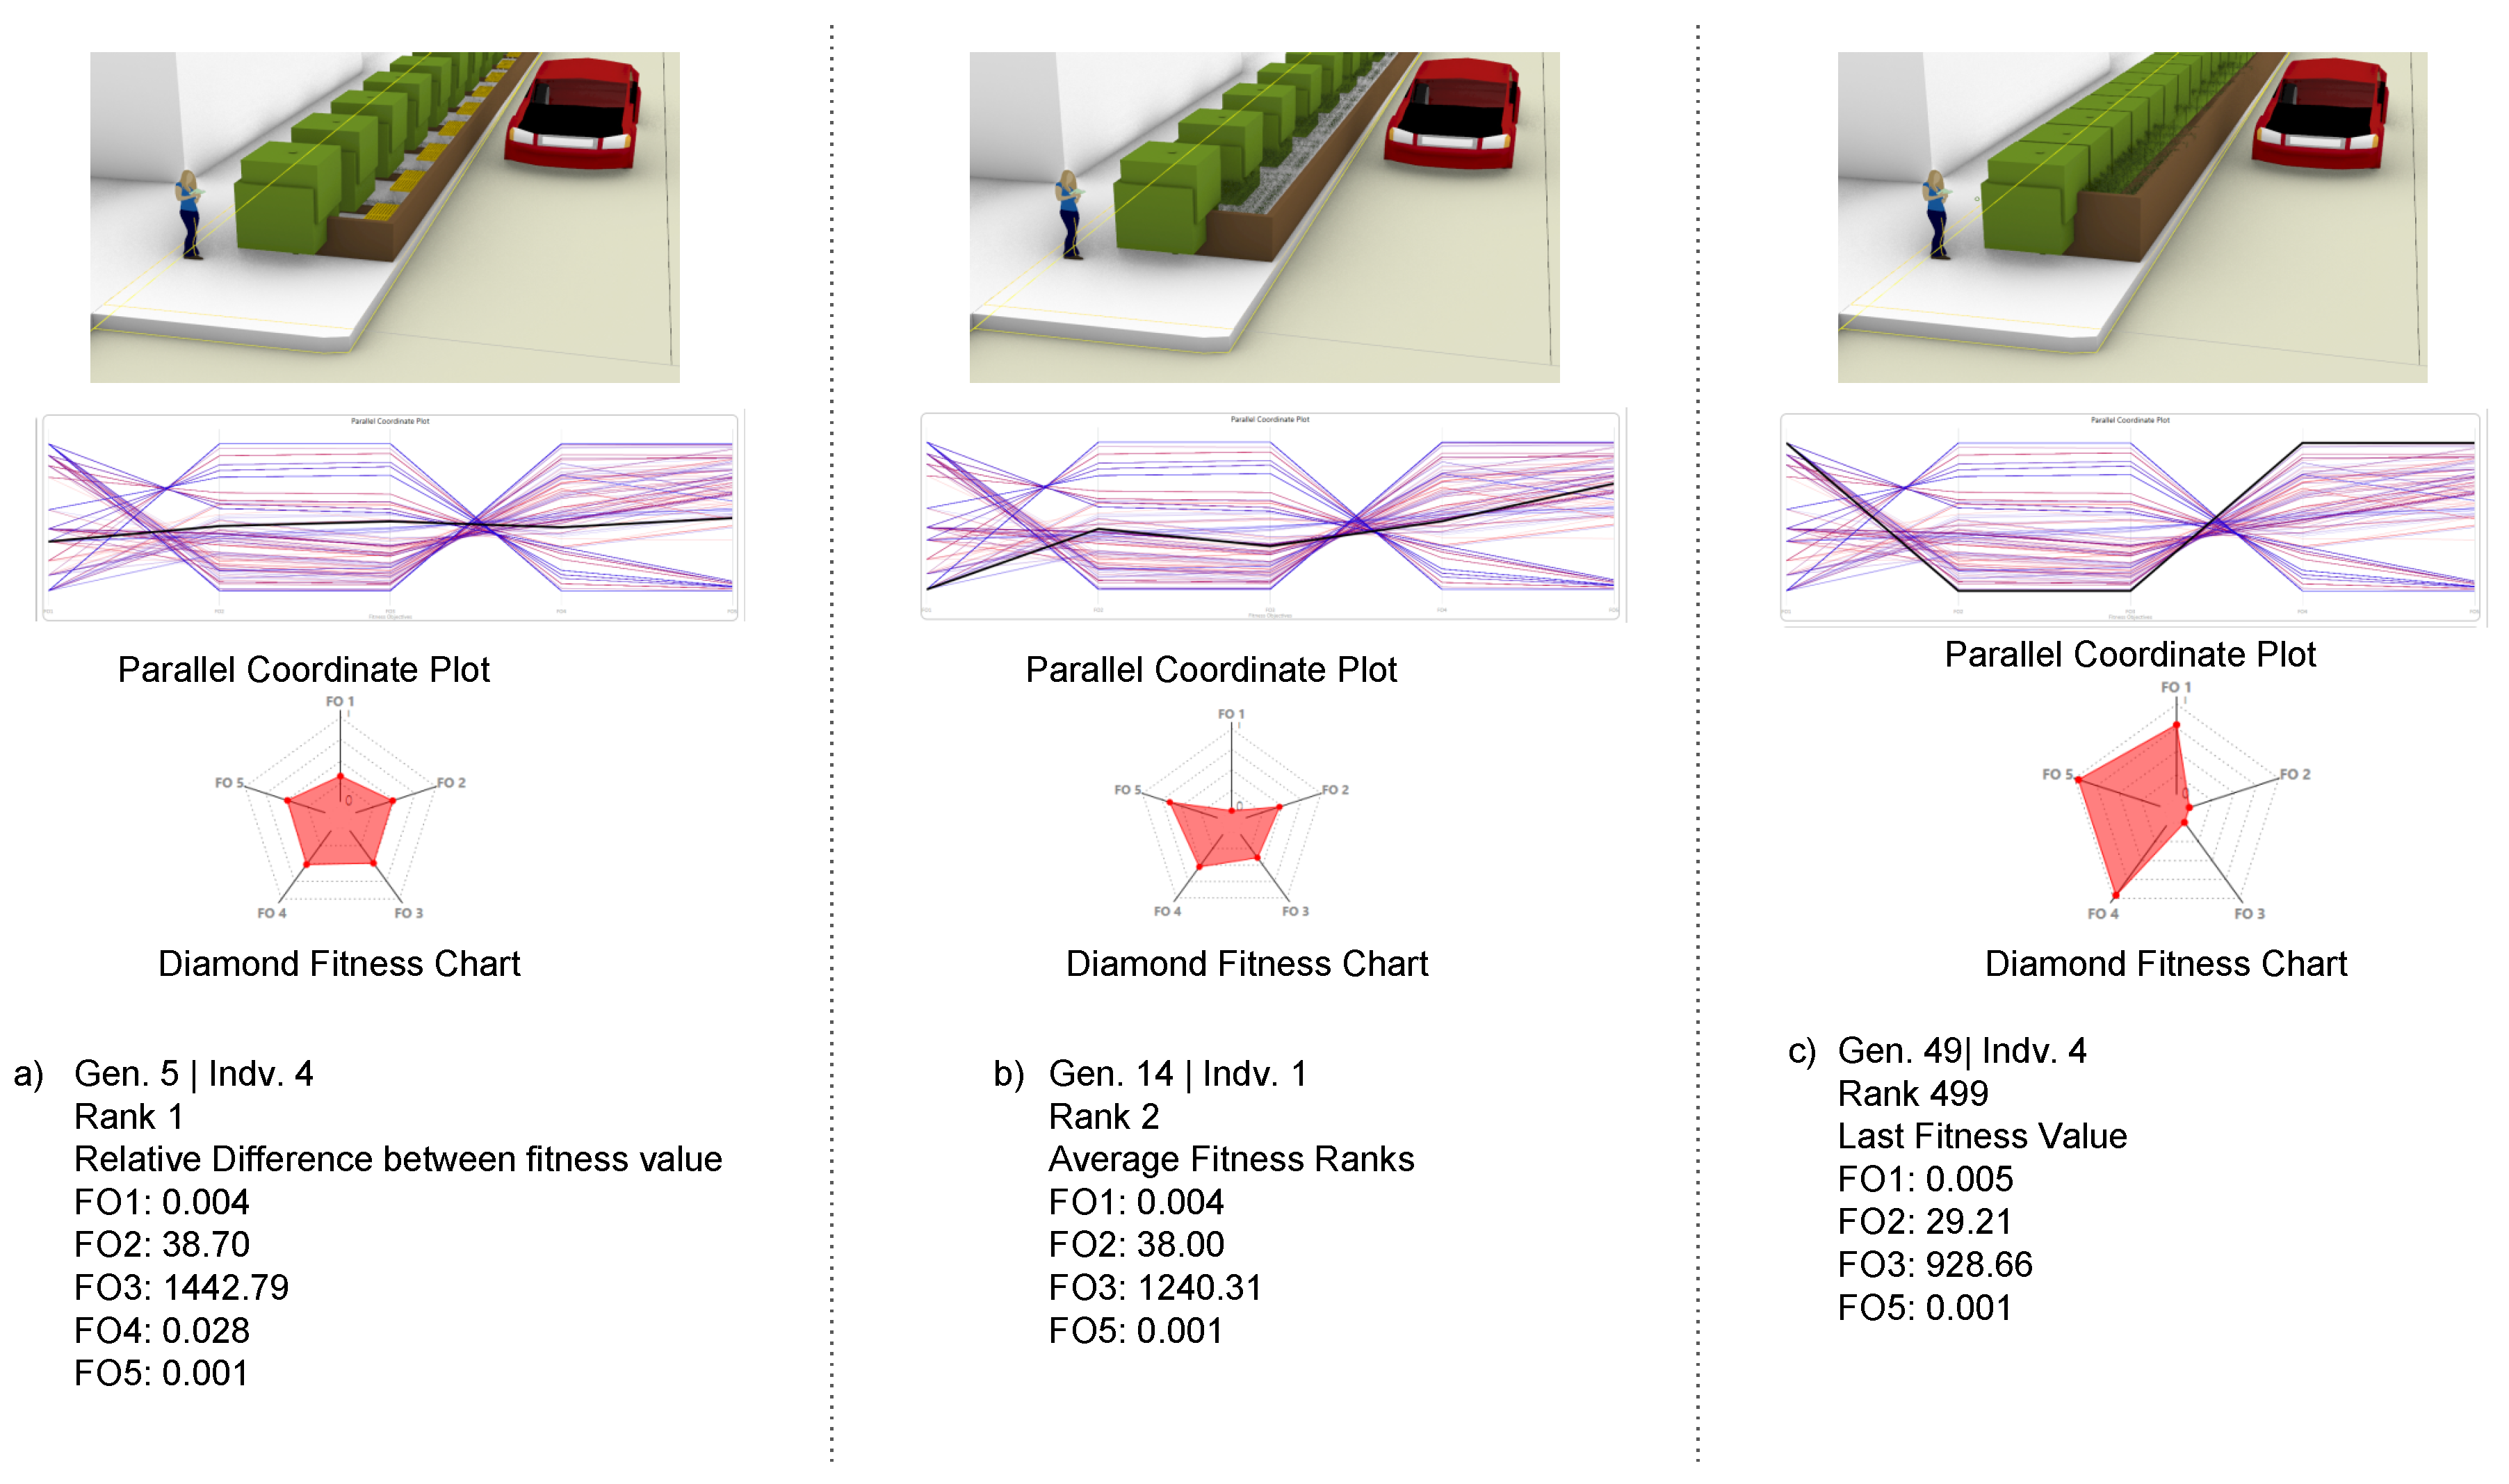
- Multi-Agent system generative 3D modeling of the pathway vegetation with its environmental analysis, construction drawings, and quantity take-off is another contribution of this study. It is expected that the T-Agent can generate many different types of alternatives to meet city regulations and assist decision-makers in developing more efficient urban vegetation plans that comply with the complex metropolitan city requirements.
Supplementary Materials
Author Contributions
Funding
Acknowledgments
Conflicts of Interest
References
- Brown, R.D.; Vanos, J.; Kenny, N.; Lenzholzer, S. Designing urban parks that ameliorate the effects of climate change. Landsc. Urban Plan. 2015, 138, 118–131. [Google Scholar] [CrossRef]
- Golany, G.S. Ethics and Urban Design: Culture, Form, and Environment; John Wiley & Sons: New York, NY, USA, 1995. [Google Scholar]
- Al-Kodmany, K.; Ali, M.M. The Future of the City: Tall Buildings and Urban Design; WIT Press: Southampton, UK, 2013. [Google Scholar]
- Richards, B. Future Transport in Cities; Taylor & Francis: London, UK, 2012. [Google Scholar]
- Trees in Hard Landscapes: A Guide for Delivery—Trees and Design Action Group. Available online: http://www.tdag.org.uk/trees-in-hard-landscapes.html (accessed on 25 April 2020).
- Escobedo, F.J.; Kroeger, T.; Wagner, J.E. Urban forests and pollution mitigation: Analyzing ecosystem services and disservices. Environ. Pollut. 2011, 159, 2078–2087. [Google Scholar] [CrossRef] [PubMed]
- Avissar, R. Potential effects of vegetation on the urban thermal environment. Atmos. Environ. 1996, 30, 437–448. [Google Scholar] [CrossRef]
- Grote, R.; Samson, R.; Alonso, R.; Amorim, J.H.; Cariñanos, P.; Churkina, G.; Fares, S.; Thiec, D.L.; Niinemets, Ü.; Mikkelsen, T.N. Functional traits of urban trees: Air pollution mitigation potential. Front. Ecol. Environ. 2016, 14, 543–550. [Google Scholar] [CrossRef]
- Ng, W.-Y.; Chau, C.-K.; Powell, G.; Leung, T.-M. Preferences for street configuration and street tree planting in urban Hong Kong. Urban For. Urban Green. 2015, 14, 30–38. [Google Scholar] [CrossRef]
- Sæbø, A.; Benedikz, T.; Randrup, T.B. Selection of trees for urban forestry in the Nordic countries. Urban For. Urban Green. 2003, 2, 101–114. [Google Scholar] [CrossRef]
- Hanzl, M. Information technology as a tool for public participation in urban planning: A review of experiments and potentials. Des. Stud. 2007, 28, 289–307. [Google Scholar] [CrossRef]
- Thaiutsa, B.; Puangchit, L.; Kjelgren, R.; Arunpraparut, W. Urban green space, street tree and heritage large tree assessment in Bangkok, Thailand. Urban For. Urban Green. 2008, 7, 219–229. [Google Scholar] [CrossRef]
- Jim, C.Y.; Chen, W.Y. Assessing the ecosystem service of air pollutant removal by urban trees in Guangzhou (China). J. Environ. Manag. 2008, 88, 665–676. [Google Scholar] [CrossRef]
- Cunningham, S.A.; Floyd, R.B.; Griffiths, M.W.; Wylie, F.R. Patterns of host use by the shoot-borer Hypsipyla robusta (Pyralidae: Lepidoptera) comparing five Meliaceae tree species in Asia and Australia. For. Ecol. Manag. 2005, 205, 351–357. [Google Scholar] [CrossRef]
- Nowak, D.J.; Crane, D.E.; Stevens, J.C. Air pollution removal by urban trees and shrubs in the United States. Urban For. Urban Green. 2006, 4, 115–123. [Google Scholar] [CrossRef]
- Bernstein, M.J.; Wiek, A.; Brundiers, K.; Pearson, K.; Minowitz, A.; Kay, B.; Golub, A. Mitigating urban sprawl effects: A collaborative tree and shade intervention in Phoenix, Arizona, USA. Local Environ. 2016, 21, 414–431. [Google Scholar] [CrossRef]
- Armson, D.; Stringer, P.; Ennos, A.R. The effect of tree shade and grass on surface and globe temperatures in an urban area. Urban For. Urban Green. 2012, 11, 245–255. [Google Scholar] [CrossRef]
- Tan, Z.; Lau, K.K.-L.; Ng, E. Urban tree design approaches for mitigating daytime urban heat island effects in a high-density urban environment. Energy Build. 2016, 114, 265–274. [Google Scholar] [CrossRef]
- Asgarzadeh, M.; Koga, T.; Hirate, K.; Farvid, M.; Lusk, A. Investigating oppressiveness and spaciousness in relation to building, trees, sky and ground surface: A study in Tokyo. Landsc. Urban Plan. 2014, 131, 36–41. [Google Scholar] [CrossRef]
- Giles-Corti, B.; Broomhall, M.H.; Knuiman, M.; Collins, C.; Douglas, K.; Ng, K.; Lange, A.; Donovan, R.J. Increasing walking: How important is distance to, attractiveness, and size of public open space? Am. J. Prev. Med. 2005, 28, 169–176. [Google Scholar] [CrossRef] [PubMed]
- Nuckols, M.S.; Connor, E.F. Do Trees in Urban or Ornamental Plantings Receive More Damage by Insects Than Trees in Natural Forests. Ecol. Entomol 1995, 20, 253–260. [Google Scholar] [CrossRef]
- Davis, K.L.; Jones, R.E. Modeling environmental concern for urban tree protection using biophysical and social psychological indicators. Soc. Nat. Resour. 2014, 27, 372–388. [Google Scholar] [CrossRef]
- Weber, F.; Kowarik, I.; Säumel, I. A walk on the wild side: Perceptions of roadside vegetation beyond trees. Urban For. Urban Green. 2014, 13, 205–212. [Google Scholar] [CrossRef]
- D’Amato, G.; Cecchi, L.; Bonini, S.; Nunes, C.; Annesi-Maesano, I.; Behrendt, H.; Liccardi, G.; Popov, T.; Van Cauwenberge, P. Allergenic pollen and pollen allergy in Europe. Allergy 2007, 62, 976–990. [Google Scholar] [CrossRef]
- North, E.A.; D’Amato, A.W.; Russell, M.B.; Johnson, G.R. The influence of sidewalk replacement on urban street tree growth. Urban For. Urban Green. 2017, 24, 116–124. [Google Scholar] [CrossRef]
- D’Amato, G. Effects of climatic changes and urban air pollution on the rising trends of respiratory allergy and asthma. Multidiscip. Respir. Med. 2011, 6, 28. [Google Scholar] [CrossRef] [PubMed]
- Gromke, C.; Blocken, B. Influence of avenue-trees on air quality at the urban neighborhood scale. Part II: Traffic pollutant concentrations at pedestrian level. Environ. Pollut. 2015, 196, 176–184. [Google Scholar] [CrossRef] [PubMed]
- Buccolieri, R.; Salim, S.M.; Leo, L.S.; Di Sabatino, S.; Chan, A.; Ielpo, P.; de Gennaro, G.; Gromke, C. Analysis of local scale tree–atmosphere interaction on pollutant concentration in idealized street canyons and application to a real urban junction. Atmos. Environ. 2011, 45, 1702–1713. [Google Scholar] [CrossRef]
- Kardel, F.; Wuyts, K.; Maher, B.A.; Samson, R. Intra-urban spatial variation of magnetic particles: Monitoring via leaf saturation isothermal remanent magnetisation (SIRM). Atmos. Environ. 2012, 55, 111–120. [Google Scholar] [CrossRef]
- Herzog, T.R. A cognitive analysis of preference for urban spaces. J. Environ. Psychol. 1992, 12, 237–248. [Google Scholar] [CrossRef]
- Kim, J.; Kim, S. Finding the Optimal D/H Ratio for an Enclosed Urban Square: Testing an Urban Design Principle Using Immersive Virtual Reality Simulation Techniques. Int. J. Environ. Res. Public Health 2019, 16, E865. [Google Scholar] [CrossRef]
- Pauleit, S. Urban street tree plantings: Identifying the key requirements. Proc. Inst. Civ. Eng. Munic. Eng. 2003, 156, 43–50. [Google Scholar] [CrossRef]
- Van Noordwijk, M.; Roshetko, J.M.; Angeles, M.D.; Fay, C.; Tomich, T.P. Farmer tree planting barriers to sustainable forest management. In Smallholder Tree Growing for Rural Development and Environmental Services; Springer: Berlin, Germany, 2008; pp. 429–451. [Google Scholar]
- Smith, A.; Dodge, M.; Doyle, S. Visual Communication in Urban Planning and Urban Design; University College London, Centre for Advanced Spatial Analysis (CASA): London, UK, 1998. [Google Scholar]
- Indraprastha, A.; Shinozaki, M. The investigation on using Unity3D game engine in urban design study. J. ICT Res. Appl. 2009, 3, 1–18. [Google Scholar] [CrossRef]
- De Amicis, R.; Conti, G.; Simões, B.; Lattuca, R.; Tosi, N.; Piffer, S.; Pellitteri, G. Geo-visual analytics for urban design in the context of future internet. Int. J. Interact. Des. Manuf. (IJIDeM) 2009, 3, 55–63. [Google Scholar] [CrossRef]
- Beirão, J.; Arrobas, P.; Duarte, J. Parametric Urban Design: Joining Morphology and Urban Indicators in a Single Interactive Model. In Proceedings of the 30th eCAADe Conference; Prague, Czech Republic, 12–14 September 2012.
- Al-Kodmany, K. Residential visual privacy: Traditional and modern architecture and urban design. J. Urban Des. 1999, 4, 283–311. [Google Scholar] [CrossRef]
- Scharenbroch, B.C.; Morgenroth, J.; Maule, B. Tree species suitability to bioswales and impact on the urban water budget. J. Environ. Qual. 2016, 45, 199–206. [Google Scholar] [CrossRef] [PubMed]
- Säumel, I.; Kowarik, I. Urban rivers as dispersal corridors for primarily wind-dispersed invasive tree species. Landsc. Urban Plan. 2010, 94, 244–249. [Google Scholar] [CrossRef]
- Lu, J.W.; Svendsen, E.S.; Campbell, L.K.; Greenfeld, J.; Braden, J.; King, K.L.; Falxa-Raymond, N. Biological, Social, and Urban Design Factors Affecting Young Street Tree Mortality in New York City; USDA: New York, NY, USA, 2010.
- McPherson, E.G. Selecting reference cities for i-Tree Streets. Arboric. Urban For. 2010, 36, 230–240. [Google Scholar]
- Koukoulas, S.; Blackburn, G.A. Mapping individual tree location, height and species in broadleaved deciduous forest using airborne LIDAR and multi-spectral remotely sensed data. Int. J. Remote Sens. 2005, 26, 431–455. [Google Scholar] [CrossRef]
- Lawrence, H.W. Origins of the tree-lined boulevard. Geogr. Rev. 1988, 78, 355–374. [Google Scholar] [CrossRef]
- Singzon, S.B. Post-Logging Ban Timber Tree Planting in Thailand and the Philippines; Discussion Paper Series-Southeast Asian Regional Center for Graduate Study and Research in Agriculture (SEARCA): Avignion, France, 2012. [Google Scholar]
- Niskanen, A.; Saastamoinen, O. Tree Plantations in the Philippines and Thailand Economic, Social and Environmental Evaluation; UNU/WIDER: Helsinki, Finland, 1996. [Google Scholar]
- Bachman, D. Grasshopper: Visual Scripting for Rhinoceros 3D; Industrial Press Inc.: New York, NY, USA, 2017. [Google Scholar]
- Roudsari, M.S.; Pak, M.; Smith, A. Ladybug: A parametric environmental plugin for grasshopper to help designers create an environmentally-conscious design. In Proceedings of the 13th International IBPSA Conference, Lyon, France, 25–30 August 2013. [Google Scholar]
- Fabbri, K.; Di Nunzio, A.; Gaspari, J.; Antonini, E.; Boeri, A. Outdoor Comfort: The ENVI-BUG tool to evaluate PMV values Output Comfort point by point. Energy Procedia 2017, 111, 510–519. [Google Scholar] [CrossRef]
- Dwyer, J.F.; McPherson, E.G.; Schroeder, H.W.; Rowntree, R.A. ASSESSING THE BENEFITS AND COSTS OF THE URBAN FOREST. J. Arboric. 1992, 18, 227. [Google Scholar]
- Russell, J.S.; Cameron, D.M.; Whan, I.F.; Beech, D.F.; Prestwidge, D.B.; Rance, S.J. Rainforest trees as a new crop for Australia. For. Ecol. Manag. 1993, 60, 41–58. [Google Scholar] [CrossRef]
- Oxman, R. The New Structuralism: Conceptual Mapping of Emerging Key Concepts in Theory and Praxis. Int. J. Arch. Comput. 2010, 8, 419–438. [Google Scholar] [CrossRef]
- Acero, J.A.; Arrizabalaga, J.; Kupski, S.; Katzschner, L. Deriving an Urban Climate Map in coastal areas with complex terrain in the Basque Country (Spain). Urban Clim. 2013, 4, 35–60. [Google Scholar] [CrossRef]
- Wong, N.H.; Jusuf, S.K.; Tan, C.L. Integrated urban microclimate assessment method as a sustainable urban development and urban design tool. Landsc. Urban Plan. 2011, 100, 386–389. [Google Scholar] [CrossRef]
- Shneiderman, B. Tree visualization with tree-maps: 2-d space-filling approach. ACM Trans. Gr. (TOG) 1992, 11, 92–99. [Google Scholar] [CrossRef]
- Johnston, K.; Ver Hoef, J.M.; Krivoruchko, K.; Lucas, N. Using ArcGIS Geostatistical Analyst; Esri Redlands: New York, NY, USA, 2001; Volume 380. [Google Scholar]
- Zacharias, J. Preferences for view corridors through the urban environment. Landsc. Urban Plan. 1999, 43, 217–225. [Google Scholar] [CrossRef]
- Herzog, T.R.; Chernick, K.K. Tranquility and danger in urban and natural settings. J. Environ. Psychol. 2000, 20, 29–39. [Google Scholar] [CrossRef]
- Nowak, D.J.; Crane, D.E. The Urban Forest Effects (UFORE) Model: Quantifying urban forest structure and functions. In Integrated Tools for Natural Resources Inventories in the 21st Century; General Technical Report NC-212; Hansen, M.H., Burk, T.B., Eds.; US Dept. of Agriculture, Forest Service, North Central Forest Experiment Station: St. Paul, MN, USA, 2000; Volume 212, pp. 714–720. [Google Scholar]
- Jim, C.Y. Managing urban trees and their soil envelopes in a contiguously developed city environment. Environ. Manag. 2001, 28, 819–832. [Google Scholar] [CrossRef]
- Brown, T.J.; Itami, R.M. Landscape principles study: Procedures for landscape assessment and management—Australia. Landsc. J. 1982, 1, 113–121. [Google Scholar] [CrossRef]
- Richards, N.A. Diversity and stability in a street tree population. Urban Ecol. 1983, 7, 159–171. [Google Scholar] [CrossRef]
- Benenson, I.; Kharbash, V. Geographic Automata Systems: From The Paradigm to the Urban Modeling Software. In Proceedings of the AGILE Conference, Denver, CO, USA, 24–29 July 2005; p. 20. [Google Scholar]
- Ion, P.; Miner, R.; Buswell, S.; Devitt, A. Mathematical Markup Language (MathML) 1.0 Specification; World Wide Web Consortium (W3C): Cambridge, MA, USA, 1998. [Google Scholar]
- Isaacson, M.D.; Lloyd, L.L.; Schleppenbach, D. Reducing multiple interpretations of mathematical expressions with MathSpeak. In Proceedings of the First International Conference on Technology-Based Learning with Disability, Dayton, OH, USA, 19–20 July 2017. [Google Scholar]
- Büscher, M.; Christensen, M.; Hansen, K.M.; Mogensen, P.; Shapiro, D. Bottom-up, Top-down? Connecting Software Architecture Design with Use. In Configuring User-Designer Relations: Interdisciplinary Perspectives; Computer Supported Cooperative Work; Büscher, M., Slack, R., Rouncefield, M., Procter, R., Hartswood, M., Voss, A., Eds.; Springer: London, UK, 2009; pp. 157–191. ISBN 978-1-84628-925-5. [Google Scholar]
- Ouria, M.; Sevinc, H. Evaluation of the potential of solar energy utilization in Famagusta, Cyprus. Sustain. Cities Soc. 2018, 37, 189–202. [Google Scholar] [CrossRef]
- Trees Impact. Available online: http://www.treesimpact.com.au/ (accessed on 7 April 2020).
- The New NATSPEC Specification for Trees and Its Relevance to TREENET Trials—Treenet. Available online: https://treenet.org/resources/the-new-natspec-specification-for-trees-and-its-relevance-to-treenet-trials/ (accessed on 25 April 2020).
- 국가법령정보센터. Available online: http://www.law.go.kr/LSW/main.html (accessed on 11 April 2020).
- Berland, A.; Shiflett, S.A.; Shuster, W.D.; Garmestani, A.S.; Goddard, H.C.; Herrmann, D.L.; Hopton, M.E. The role of trees in urban stormwater management. Landsc. Urban Plan. 2017, 162, 167–177. [Google Scholar] [CrossRef]
- Lormand, J.R. The Effects of Urban Vegetation on Stormwater Runoff in an Arid Environment; The University of Arizona: Tucson, AZ, USA, 1988. [Google Scholar]
- De Abreu-Harbich, L.V.; Labaki, L.C.; Matzarakis, A. Effect of tree planting design and tree species on human thermal comfort in the tropics. Landsc. Urban Plan. 2015, 138, 99–109. [Google Scholar] [CrossRef]
- Wallacei. Available online: https://www.wallacei.com/ (accessed on 10 April 2020).


| Sources of Rule Legislation | Objective | Equation Number | RULE | Rule No. | Standard | Explanation |
| Rules from Gov | Distance between Trees (TDT) | (1) | TDT = 6~8 m | Act on the Creation and Management of Streets in Seoul Article 7 | Criteria of Planting Materials of Garosu District, Management of Streets in Seoul, South Korea | The distance of the plants is based on the 6~8 m rule |
| Distance between tree and road (PD) | (2) | Min. PD = 1 m | Chapter 2 (Creating a street tree) Article 4 | Vegetation Reposition Location | Minimum distance from the road and pathway border to the center of a street tree ≧1 m | |
| (3) | PD ≥ 2 m | Plant a tree on the road without a sidewalk ≧2 m from the edge of the road | ||||
| Rules from standards | Calculate Diameter at Breast Height (DBH) | (4) | Type A: DBH = 2.5% expected tree height | Australian Standard Appendix D: 2303:2015 | Tree stock height and calliper | DBH estimates suggest that DBH, as a percentage of tree height, varies from 2.0% to 3.0% for tall, slender, growing species through to 5%–6% for stockier/thick-stemmed species, with general species somewhere in between |
| (5) | Type B: DBH = 4% expected tree height | |||||
| (6) | Type C: DBH = 5.5% expected tree height (TH) | |||||
| Calculate PD according to DBH | (7) | . | Australian Standard for the Protection of Trees AS 4970-2009 | Development Sites | PD is measured from the center of the planting pit | |
| Structural Root Zone (SRZ) | (8) | the area required for tree stability | Root Zone in AS4970:2009 | |||
| Calculating Minimum Distance (MD) between tree steam and Root Barriers (RB) | (9) | AS 4970:2009 | Protection of trees on development sites | - | ||
| Calculating Required Soil Volume (RSV) and Field Size Index (FSI) Needs of Trees in Urban Situations | (10) | Australian Standard 2303:2015 | Balance formula found in the National Building Specification (NATSPEC) for landscape trees [69] | - |
| Tree Class | Tree Height | Species Included | Remarks |
|---|---|---|---|
| entry 1 | data | data | |
| Type A | >12 m | Maidenhair tree, Metasequoia glyptostroboides, American sycamore | Tall, slender growing species |
| Type B | 6~12 m | Yoshino Cherry, Castanopsis sieboldii, Japanese maple | Medium-height trees general species (will apply in most cases) |
| Type C | <6 m | Tetradium daniellii, Crepe-myrtle, Japanese camellia | Small-height trees classified by the Municipality of Seoul |
| Analysis Period | Context-1 | Context-2 | Context-3 | Vegetation Environmental Effect Rate Difference between Context-1 and Context-2 | |
| pathway | - | Surrounding objects | Surrounding objects and vegetation | Vegetation only | - |
| Average radiation analysis result in | (summer) Jun-1- 12:00 to 13:00 | Average: 1.73 Total = 334.15 | Average = 1.06 Total = 204.48 | Average = 1.12 Total = 216.76 | −38.73 |
| (Winter season) Jan-1- 12:00 to 13:00 | Average = 0.89 Total = 171.70 | Average = 0.46 Total = 88.08 | Average = 0.49 Total = 93.95 | −48.31 | |
| Sunlight hours analysis (hours) | (summer) Jun-1- 01:00 to 24:00 | Average = 6.11 Total = 1179.24 | Average = 3.10 Total = 599.36 | Average = 6.27 Total = 1210.74 | −49.26 |
| (winter) Jan-1- 01:00 to 24:00 | Average = 2.01 Total = 386.65 | Average = 0.84 Total = 162.53 | Average = 3.68 Total 711.25 | −58.20 | |
| Field of view (visible angle in degrees | - | 27.10 | 12.66 | 206.32 | −53.28 |
| Area occupation in the pathway for pedestrians in meter square | - | 192.61 | 104.76 | 104.76 | −45.59 |
| Control Variables | Percentage of Participants | Number of Participants | |
|---|---|---|---|
| Age | 21–30 | 80% | 16 |
| 31–40 | 20% | 4 | |
| Gender | Female | 10% | 2 |
| Male | 90% | 18 | |
| Education | University | 50% | 10 |
| Grade School | 50% | 10 | |
| Current city resident | Seoul | 90% | 18 |
| others | 10% | 2 | |
| Number | Question Statements | Mean (Standard Deviation) |
| 1 | Overall, T-Design tool is easy to use | 4.6 (0.50) |
| 2 | Citizens with no urban planning background can use this tool | 4.2 (0.83) |
| 3 | I want to use this tool to give feedback to urban planners about my neighborhood vegetation design | 4.35 (0.67) |
| 4 | Environment analysis helped me understand the effect of vegetation on pathway | 4.55 (0.69) |
| 5 | I produced vegetation Quantity take-off and QR code easily | 4.8 (0.41) |
| 6 | Visual quality of the 3D model was good | 4.35 (0.88) |
| 7 | T-Design can improve citizen’s awareness of urban vegetation importance | 4.35 (0.75) |
© 2020 by the authors. Licensee MDPI, Basel, Switzerland. This article is an open access article distributed under the terms and conditions of the Creative Commons Attribution (CC BY) license (http://creativecommons.org/licenses/by/4.0/).
Share and Cite
Ali, A.K.; Song, H.; Lee, O.J.; Kim, E.S.; Mohammed Ali, H.H. Multi-Agent-Based Urban Vegetation Design. Int. J. Environ. Res. Public Health 2020, 17, 3075. https://doi.org/10.3390/ijerph17093075
Ali AK, Song H, Lee OJ, Kim ES, Mohammed Ali HH. Multi-Agent-Based Urban Vegetation Design. International Journal of Environmental Research and Public Health. 2020; 17(9):3075. https://doi.org/10.3390/ijerph17093075
Chicago/Turabian StyleAli, Ahmed Khairadeen, Hayub Song, One Jae Lee, Eun Seok Kim, and Haneen Hashim Mohammed Ali. 2020. "Multi-Agent-Based Urban Vegetation Design" International Journal of Environmental Research and Public Health 17, no. 9: 3075. https://doi.org/10.3390/ijerph17093075
APA StyleAli, A. K., Song, H., Lee, O. J., Kim, E. S., & Mohammed Ali, H. H. (2020). Multi-Agent-Based Urban Vegetation Design. International Journal of Environmental Research and Public Health, 17(9), 3075. https://doi.org/10.3390/ijerph17093075