Characterising the Burden of Work-Related Injuries in South Australia: A 15-Year Data Analysis


 ,
,
Abstract
1. Introduction
2. Materials and Methods
3. Results
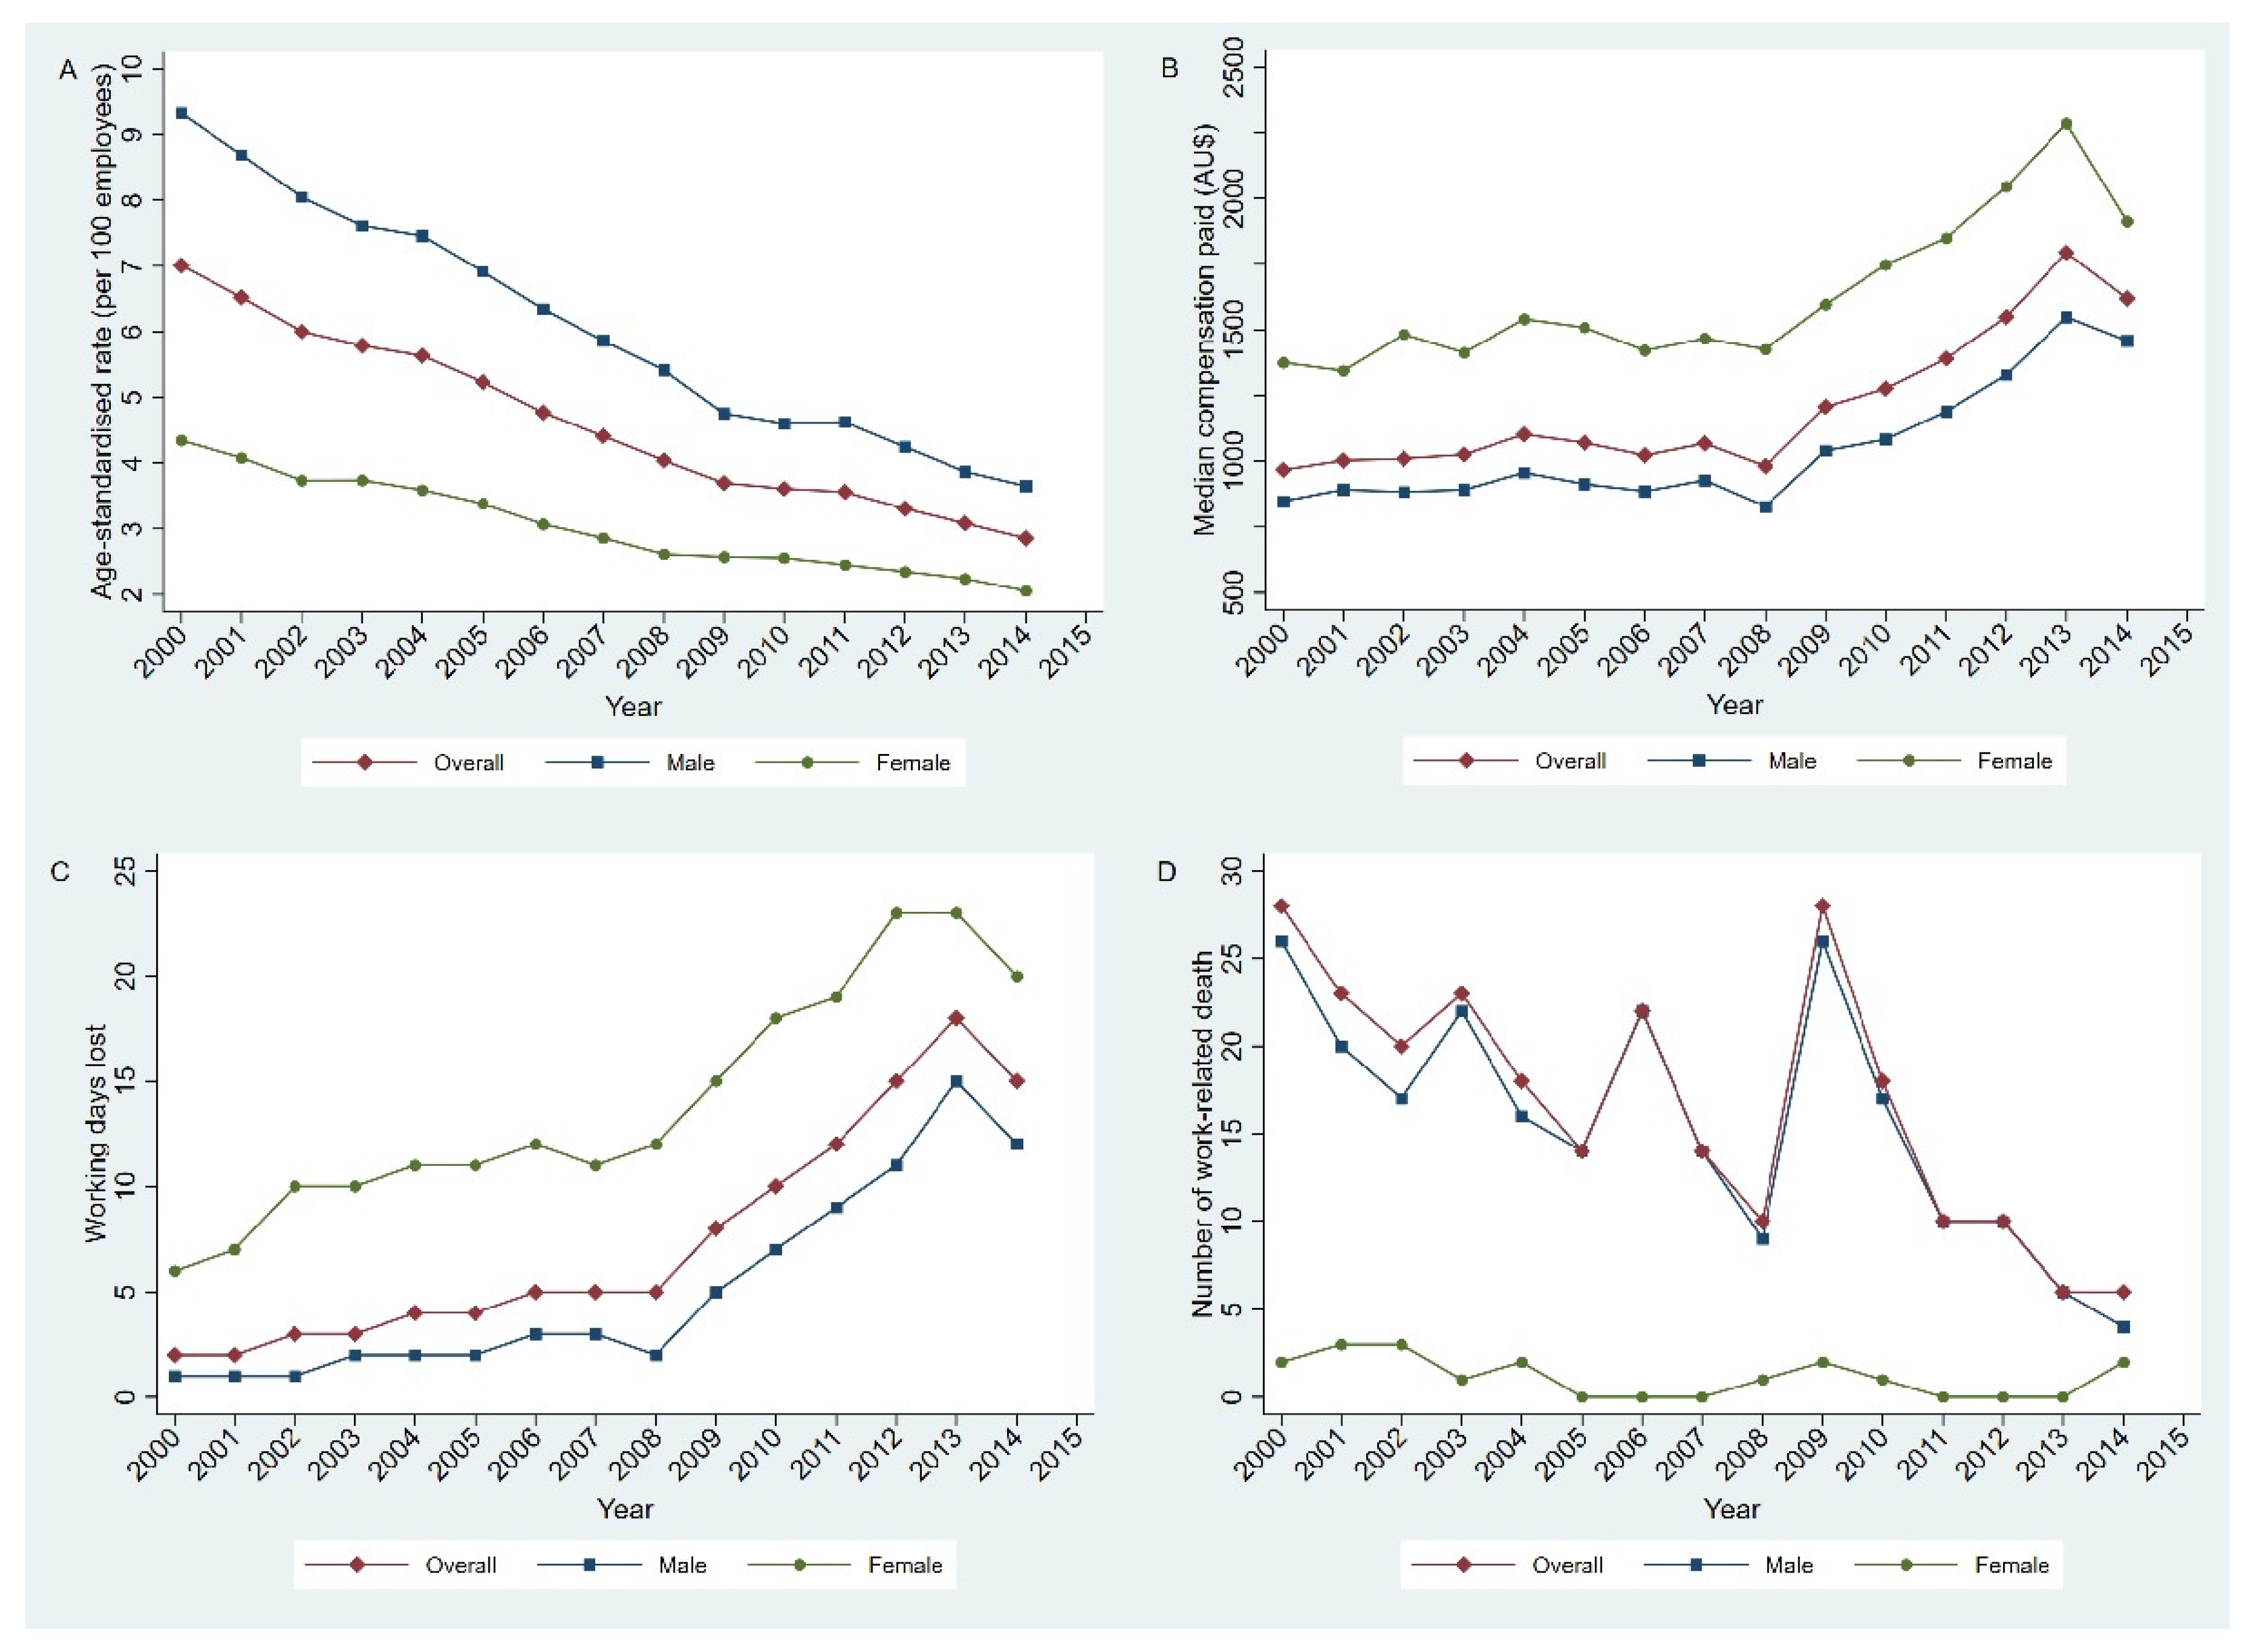
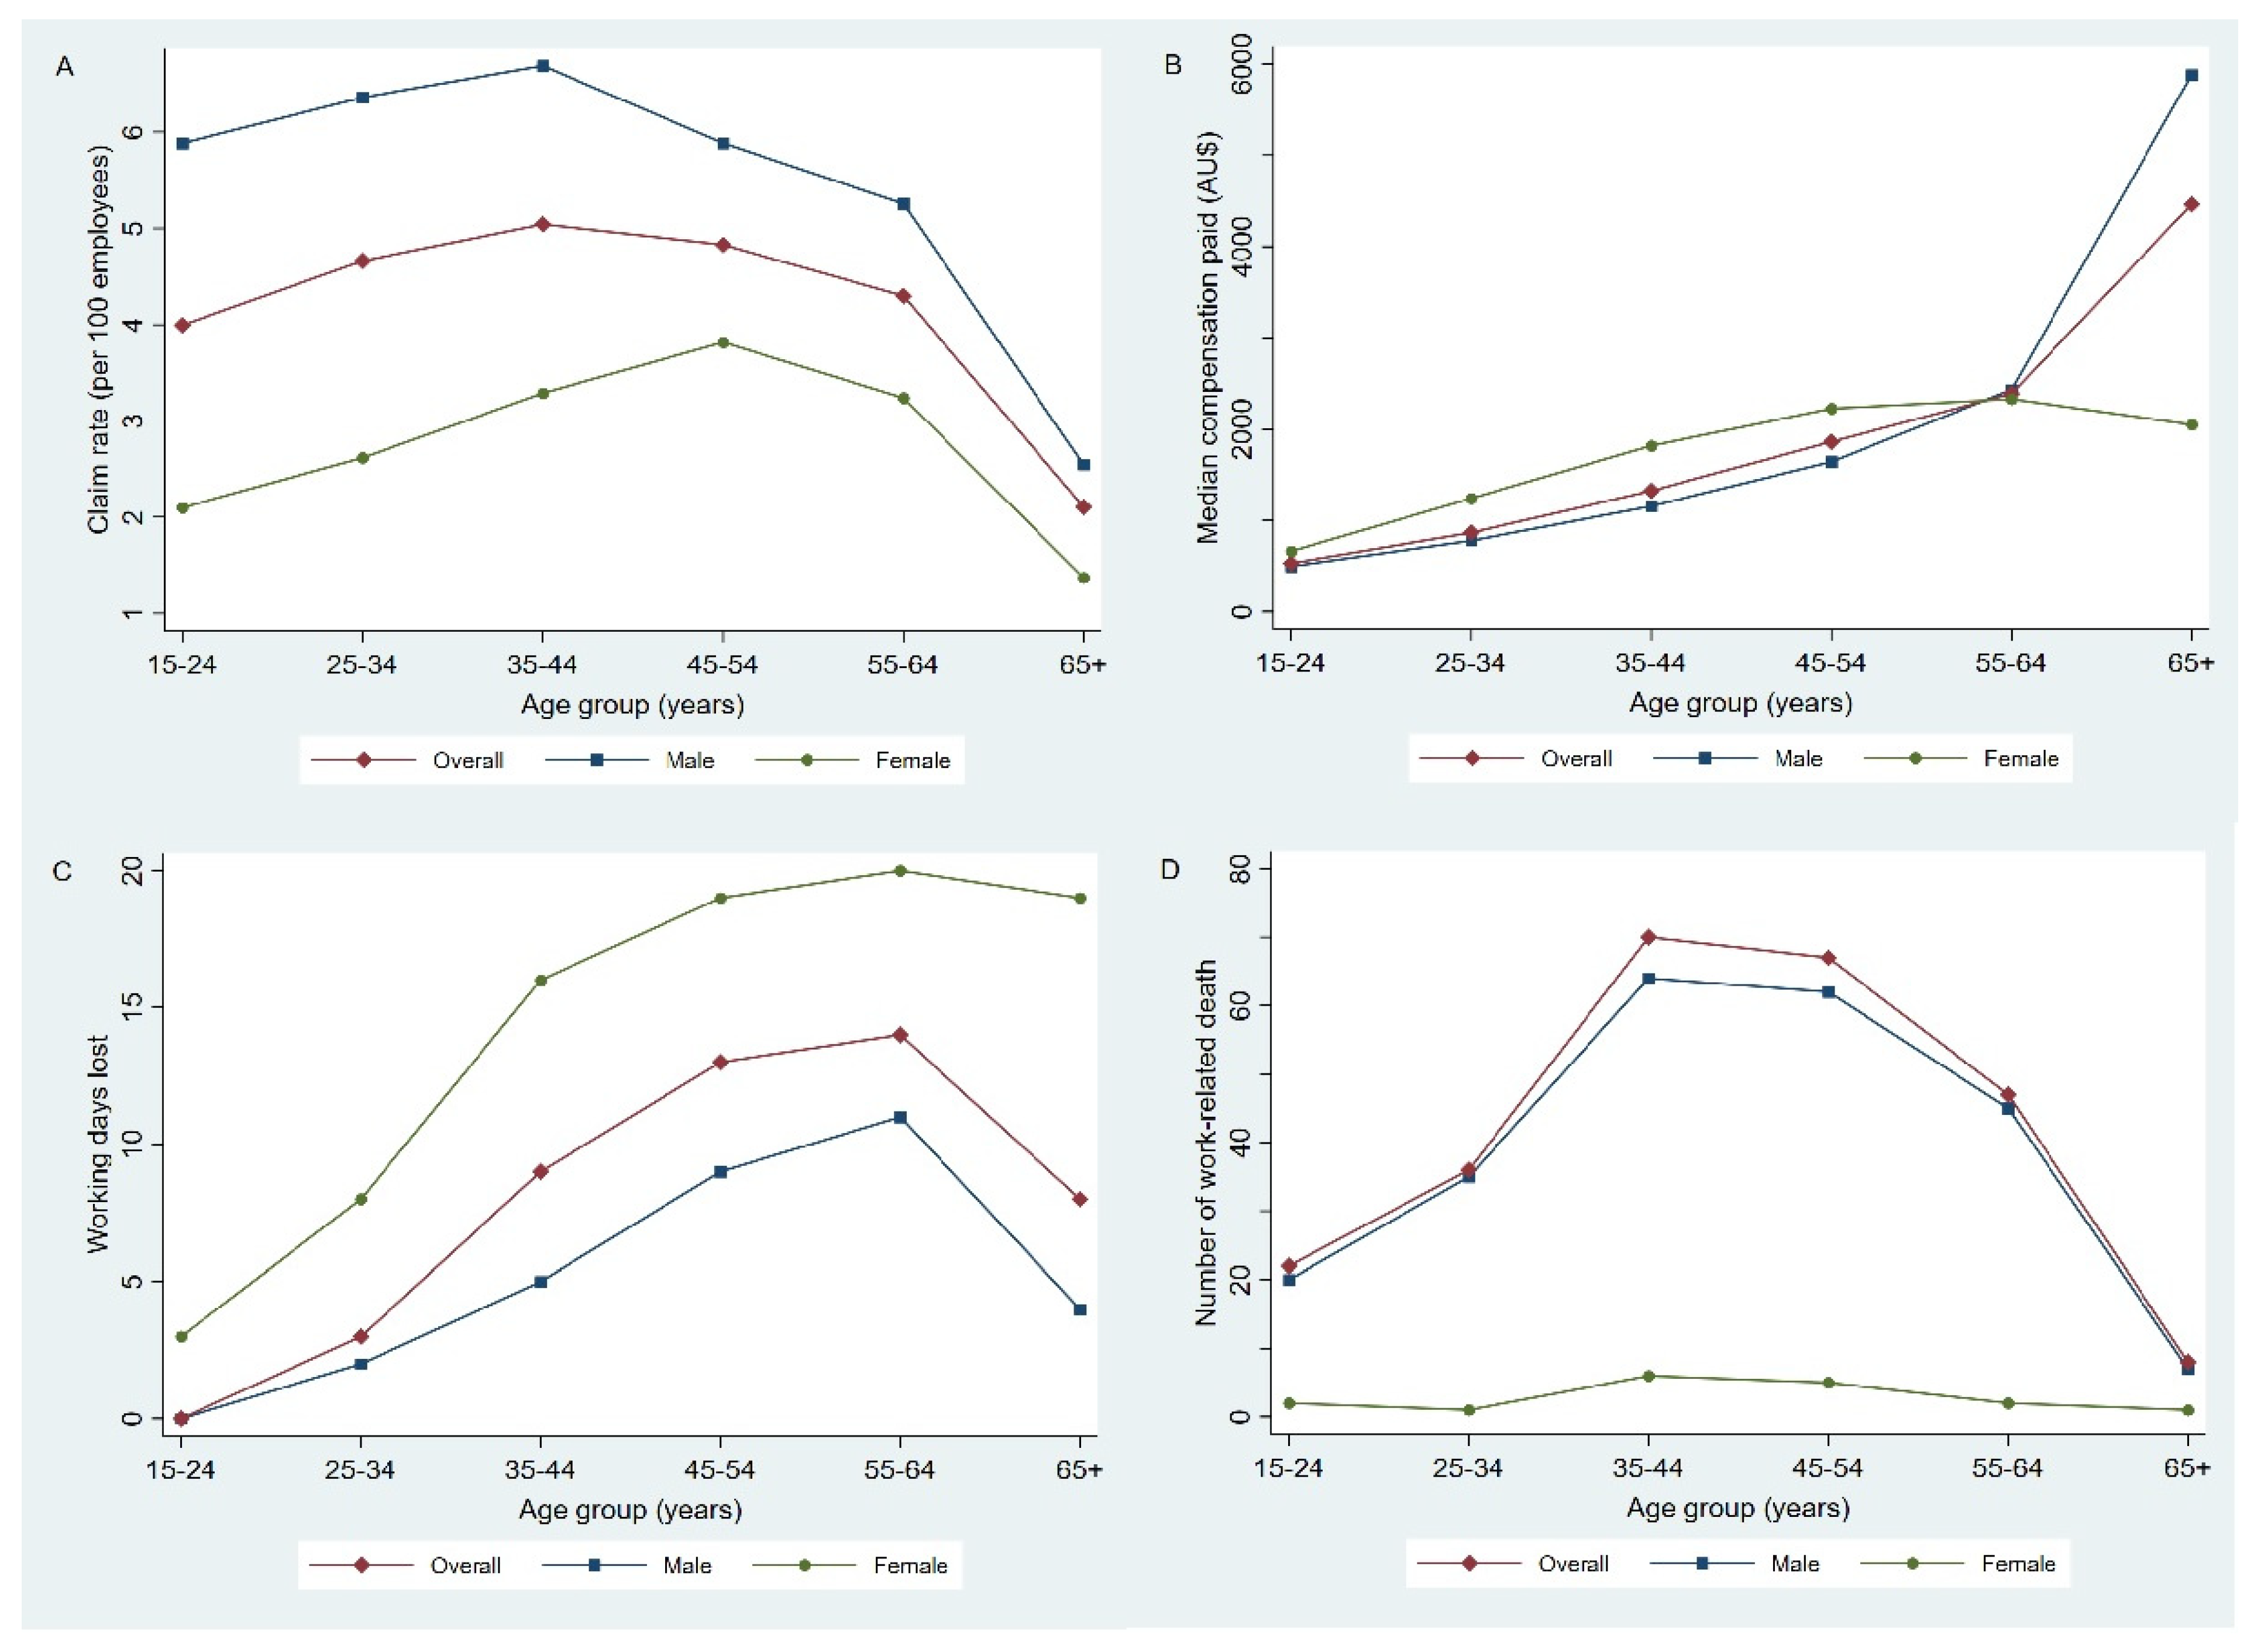
3.1. Age and Gender
3.2. Industry
3.3. Occupation
3.4. Nature of Injury
3.5. Mechanism of Injury
3.6. Work Experience, Business Size, and Birth Place
4. Discussion
4.1. A Downward Trend: Implications for Intervention Effectiveness Evaluation
4.2. Identification of Local Specific Priorities for Targeted Risk Reduction
4.3. Gender Differences
4.4. Injury Severity: Growing Challenges of an Aging Labour Force
4.5. Limitations
5. Conclusions
Supplementary Materials
Author Contributions
Funding
Acknowledgments
Conflicts of Interest
References
- Leigh, J.; Macaskill, P.; Kuosma, E.; Mandryk, J. Global burden of disease and injury due to occupational factors. Epidemiology 1999, 10, 626–631. [Google Scholar] [CrossRef]
- Leigh, J.P.; Robbins, J.A. Occupational disease and workers’ compensation: Coverage, costs, and consequences. Milbank Q. 2004, 82, 689–721. [Google Scholar] [CrossRef]
- Safe Work Australia. The Cost of Work–Related Injury and Illness for Australian Employers, Workers and the Community: 2012–2013. Available online: https://www.safeworkaustralia.gov.au/system/files/documents/1702/cost–of–work–related–injury–and–disease–2012–13.docx.pdf (accessed on 10 December 2019).
- O’Neill, S.; Nonna, M.B.; Angela, C. Issues in the Measurement and Reporting of Work Health and Safety Performance: A Review. Available online: https://www.safeworkaustralia.gov.au/system/files/documents/1703/issues–measurement–reporting–whs–performance.pdf (accessed on 1 August 2019).
- Safe Work Australia. Australian Workers’ Compensation Statistics 2015–2016. Available online: https://www.safeworkaustralia.gov.au/system/files/documents/1801/awcs_2015–16_report–20171023_v3_0.pdf (accessed on 20 August 2019).
- Government of South Australia. Workers Rehabilitation and Compensation Act 1986 (Version: 15.10.2009 to 31.12.2009). Available online: https://www.legislation.sa.gov.au/LZ/C/A/WORKERS%20REHABILITATION%20AND%20COMPENSATION%20ACT%201986.aspx (accessed on 1 August 2019).
- Lane, T.; Collie, A.; Hassani-Mahmooei, B. Work–Related Injury and Illness in Australia, 2004 to 2014. Available online: https://research.iscrr.com.au/__data/assets/pdf_file/0020/540830/work–related–injury–illness–in–Australia–20042014.pdf (accessed on 29 July 2019).
- Safe Work Australia. Comparison of Workers’ Compensation Arrangements in Australia and New Zealand. Available online: https://www.safeworkaustralia.gov.au/doc/comparison–workers–compensation–arrangements–australia–and–new–zealand–2018 (accessed on 23 July 2019).
- Collie, A.; Lane, T.J.; Hassani-Mahmooei, B.; Thompson, J.; McLeod, C. Does time off work after injury vary by jurisdiction? A comparative study of eight Australian workers’ compensation systems. BMJ Open 2016, 6, e010910. [Google Scholar]
- Safe Work Australia. Type of Occurrence Classification System (TOOCS) 3rd Edition. Available online: https://www.safeworkaustralia.gov.au/system/files/documents/1702/type_of_occurrence_classification_system_3rd_edition_revision_1.pdf (accessed on 5 November 2019).
- Australian Institute of Health and Welfare. Principles on the Use of Direct Age–Standardisation in Administrative Data Collections: For Measuring the Gap between Indigenous and Non–Indigenous Australians. Available online: https://www.aihw.gov.au/getmedia/95237794–4b77–4683–9f00–77c4d33e0e7c/13406.pdf.aspx?inline=true (accessed on 11 December 2019).
- Australian Bureau of Statistics. E13–Employed Persons by Occupation (ANZSCO Major Group), State and Territory, Sex, Age and Actual Hours Worked, August 1991 Onwards. Available online: https://www.abs.gov.au/AUSSTATS/abs@.nsf/DetailsPage/6291.0.55.003Feb%202014?OpenDocument (accessed on 2 November 2019).
- Australian Bureau of Statistics. Consumer Price Index, Australia. TABLE 13. CPI: Group, Expenditure Class and Selected Analytical Series Index Numbers, Seasonally Adjusted, Weighted Average of Eight Capital Cities (6401.0). Available online: http://www.abs.gov.au/AUSSTATS/abs@.nsf/DetailsPage/6401.0Mar%202018?OpenDocument (accessed on 5 December 2019).
- Dinno, A. Nonparametric pairwise multiple comparisons in independent groups using Dunn’s test. Stata J. 2015, 15, 292–300. [Google Scholar] [CrossRef]
- Lane, T.J.; Gray, S.; Hassani-Mahmooei, B.; Collie, A. Effectiveness of employer financial incentives in reducing time to report worker injury: An interrupted time series study of two Australian workers’ compensation jurisdictions. BMC Public Health 2018, 18, 100. [Google Scholar] [CrossRef] [PubMed]
- Robson, L.S.; Stephenson, C.M.; Schulte, P.A.; Amick III, B.C.; Irvin, E.L.; Eggerth, D.E.; Chan, S.; Bielecky, A.R.; Wang, A.M.; Heidotting, T.L. A systematic review of the effectiveness of occupational health and safety training. Scand. J. Work Environ. Health 2012, 38, 193–208. [Google Scholar] [CrossRef] [PubMed]
- Safe Work Australia. The Effectiveness of Work Health and Safety Interventions by Regulators: A Literature Review. Available online: https://www.safeworkaustralia.gov.au/system/files/documents/1702/effectiveness–whs–interventions–by–regulators–literature–review.pdf (accessed on 28 October 2019).
- Tompa, E.; Kalcevich, C.; Foley, M.; McLeod, C.; Hogg-Johnson, S.; Cullen, K.; MacEachen, E.; Mahood, Q.; Irvin, E. A systematic literature review of the effectiveness of occupational health and safety regulatory enforcement. Am. J. Ind. Med. 2016, 59, 919–933. [Google Scholar] [CrossRef] [PubMed]
- Tompa, E.; Dolinschi, R.; de Oliveira, C.; Irvin, E. A systematic review of occupational health and safety interventions with economic analyses. J. Occup. Environ. Med. 2009, 51, 1004–1023. [Google Scholar] [CrossRef] [PubMed]
- Safe Work Australia. Australian Work Health and Safety Strategy 2012–2022. Available online: https://www.safeworkaustralia.gov.au/system/files/documents/1804/australian–work–health–safety–strategy–2012–2022v2_1.pdf (accessed on 31 August 2019).
- Reid, A.; Peters, S.; Felipe, N.; Lenguerrand, E.; Harding, S. The impact of migration on deaths and hospital admissions from work-related injuries in Australia. Aust. N. Z. J. Public Health 2016, 40, 49–54. [Google Scholar] [CrossRef] [PubMed]
- Loomis, D.; Richardson, D.B.; Bena, J.F.; Bailer, A.J. Deindustrialisation and the long term decline in fatal occupational injuries. Occup. Environ. Med. 2004, 61, 616–621. [Google Scholar] [CrossRef] [PubMed]
- Breslin, F.C.; Tompa, E.; Mustard, C.; Zhao, R.; Smith, P.; Hogg-Johnson, S. Association between the decline in workers’ compensation claims and workforce composition and job characteristics in Ontario, Canada. Am. J. Public Health 2007, 97, 453–455. [Google Scholar] [CrossRef] [PubMed]
- Shraim, M.; Cifuentes, M.; Willetts, J.L.; Marucci-Wellman, H.R.; Pransky, G. Length of disability and medical costs in low back pain: Do state workers’ compensation policies make a difference? J. Occup. Environ. Med. 2015, 57, 1275–1283. [Google Scholar] [CrossRef] [PubMed]
- Driscoll, T.; Marsh, S.; McNoe, B.; Langley, J.; Stout, N.; Feyer, A.M.; Williamson, A. Comparison of fatalities from work related motor vehicle traffic incidents in Australia, New Zealand, and the United States. Inj. Prev. 2005, 11, 294–299. [Google Scholar] [CrossRef] [PubMed]
- Warmerdam, A.; Newnam, S.; Sheppard, D.; Griffin, M.; Stevenson, M. Workplace road safety risk management: An investigation into Australian practices. Accid. Anal. Prev. 2017, 98, 64–73. [Google Scholar] [CrossRef] [PubMed]
- Vinodkumar, M.; Bhasi, M. Safety climate factors and its relationship with accidents and personal attributes in the chemical industry. Saf. Sci. 2009, 47, 659–667. [Google Scholar] [CrossRef]
- Chau, N.; Wild, P.; Dehaene, D.; Benamghar, L.; Mur, J.-M.; Touron, C. Roles of age, length of service and job in work-related injury: A prospective study of 446 120 person-years in railway workers. Occup. Environ. Med. 2010, 67, 147–153. [Google Scholar] [CrossRef]
- Khanzode, V.V.; Maiti, J.; Ray, P.K. Occupational injury and accident research: A comprehensive review. Saf. Sci. 2012, 50, 1355–1367. [Google Scholar] [CrossRef]
- Fabiano, B.; Currò, F.; Pastorino, R. A study of the relationship between occupational injuries and firm size and type in the Italian industry. Saf. Sci. 2004, 42, 587–600. [Google Scholar] [CrossRef]
- Champoux, D.; Brun, J.-P. Occupational health and safety management in small size enterprises: An overview of the situation and avenues for intervention and research. Saf. Sci. 2003, 41, 301–318. [Google Scholar] [CrossRef]
- Australian Bureau of Statistics. Census Reveals a Fast Changing, Culturally Diverse Nation. Available online: http://www.abs.gov.au/ausstats/abs@.nsf/lookup/Media%20Release3 (accessed on 5 November 2019).
- Smith, P.M.; Mustard, C.A. Comparing the risk of work–related injuries between immigrants to Canada and Canadian–born labour market participants. Occup. Environ. Med. 2009, 66, 361–367. [Google Scholar] [CrossRef]
- Zhang, X.; Yu, S.; Wheeler, K.; Kelleher, K.; Stallones, L.; Xiang, H. Work-related non-fatal injuries among foreign-born and US-born workers: Findings from the US National Health Interview Survey, 1997–2005. Am. J. Ind. Med. 2009, 52, 25–36. [Google Scholar] [CrossRef] [PubMed]
- Salminen, S. Have young workers more injuries than older ones? An international literature review. J. Saf. Res. 2004, 35, 513–521. [Google Scholar]
- Safe Work Australia. Work-Related Injuries in Australia, 2005–2006: Factors Affecting Applications for Workers’ Compensation. Available online: https://www.safeworkaustralia.gov.au/system/files/documents/1702/work_related_injuries_2005_06_factors_affecting_application_wc.pdf (accessed on 11 November 2019).
- Breslin, F.C.; Day, D.; Tompa, E.; Irvin, E.; Bhattacharyya, S.; Clarke, J.; Wang, A. Non–agricultural work injuries among youth: A systematic review. Am. J. Prev. Med. 2007, 32, 151–162. [Google Scholar] [CrossRef] [PubMed]
- Estes, C.; Jackson, L.; Castillo, D. Occupational injuries and deaths among younger workers—United States, 1998–2007. Morb. Mortal. Wkly. Rep. 2010, 59, 449–455. [Google Scholar]
- Australian Workplace Gender Equality Agency. Australia’s Gender Pay Gap Statistics. Available online: https://www.wgea.gov.au/sites/default/files/gender–pay–gap–statistic.pdf (accessed on 2 October 2019).
- Rogers, E.; Wiatrowksi, W.J. Injuries, illnesses, and fatalities among older workers. Mon. Lab. Rev. 2005, 128, 24–30. [Google Scholar]
- Ramaswamy, S.K. Analysis of Workers’ Compensation Claims Data for Improving Safety Outcomes in Agribusiness Industries. Ph.D. Thesis, Iowa State University, Ames, IA, USA, 2017. [Google Scholar]
- Schwatka, N.V.; Butler, L.M.; Rosecrance, J.C. Age in relation to worker compensation costs in the construction industry. Am. J. Ind. Med. 2013, 56, 356–366. [Google Scholar] [CrossRef] [PubMed]
- Brorsson, B. Age and injury severity. Scand. J. Soc. Med. 1989, 17, 287–290. [Google Scholar] [CrossRef] [PubMed]
- Toossi, M. Employment outlook: 2008–2018–labor force projections to 2018: Older workers staying more active. Mon. Lab. Rev. 2009, 132, 30. [Google Scholar]
- Australian Bureau of Statistics. E12–Employed Persons by Industry (ANZSIC Division), Sex, State and Territory, Age and Actual Hours Worked, August 1991 Onwards. Available online: https://www.abs.gov.au/AUSSTATS/abs@.nsf/DetailsPage/6291.0.55.003Feb%202014?OpenDocument (accessed on 22 August 2019).
- Australian Bureau of Statistics. 6324.0–Work–Related Injuries, Australia, 2009–2010: Job Where Most Recent Work–Related Injury or Illness Occurred, Whether Received Workers’ Compensation. Available online: https://www.abs.gov.au/AUSSTATS/abs@.nsf/DetailsPage/6324.02009–10?OpenDocument (accessed on 12 December 2019).
- Government of South Australia. Workers Rehabilitation and Compensation Act 1986 (Version 2.10.2008 to 31.12.2008). Available online: https://www.legislation.sa.gov.au/LZ/C/A/WORKERS%20REHABILITATION%20AND%20COMPENSATION%20ACT%201986.aspx (accessed on 12 December 2019).


| SAWIC Industrial Classification | Claims: n (%) | Claim Rate (per 100) | Total Cost (Million): n (%) | Median Cost for Serious/Non-Serious Claims | Total Time-Loss Days: n (%) | Time-Loss Days for Serious Claims: Median (25–75th Percentile) | Death: n (%) | Death Rate (per 100,000) |
|---|---|---|---|---|---|---|---|---|
| Community Services † | 132,361 (28.2) | 5.9 | 4242 (28.4) | 34,815/764 | 6,069,528 (29.1) | 59 (27–185) | 35 (14.0) | 1.5 |
| Manufacturing | 120,511 (26.0) | 10.1 | 3479 (23.3) | 46,925/662 | 4,029,229 (19.3) | 52 (26–193) | 33 (13.2) | 2.8 |
| Wholesale and Retail Trade | 73,668 (15.9) | 4.6 | 1947 (13.0) | 37,262/570 | 3,025,014 (14.5) | 62 (29–252) | 21 (8.4) | 1.6 |
| Construction | 33,157 (7.1) | 6.0 | 1409 (9.4) | 37,812/562 | 2,054,175 (9.8) | 65 (30–302) | 39 (15.6) | 7.5 |
| Recreation, Personal, and Other Services | 24,365 (5.3) | 2.1 | 759 (5.1) | 29,608/533 | 1,351,372 (6.5) | 63 (28–243) | 8 (3.2) | 0.8 |
| Transport and Storage | 23,774 (5.1) | 6.2 | 1109 (7.4) | 41,096/753 | 1,528,404 (7.3) | 64 (29–262) | 64 (25.6) | 16.1 |
| Finance, Property, and Business Services | 17,198 (3.7) | 1.2 | 754 (5.0) | 49,566/739 | 1,251,742 (6.0) | 87 (34–375) | 15 (6.0) | 1.0 |
| Public Administration and Defence | 15,549 (3.4) | 2.6 | 258 (1.7) | 26,196/1,456 | 242,829 (1.2) | 34 (21–74) | * (*) | 0.3 |
| Agriculture, Forestry, Fishing, and Hunting | 14,255 (3.1) | 4.4 | 623 (4.2) | 26,540/546 | 978,519 (4.7) | 55 (28–198) | 22 (8.8) | 6.5 |
| Mining | 5397 (1.2) | 4.5 | 280 (1.9) | 50,171/813 | 275,133 (1.3) | 56 (27–210) | 10 (4.0) | 7.1 |
| Electricity, Gas, and Water | 3612 (0.8) | 3.0 | 49 (0.3) | 36,230/751 | 22,788 (0.1) | 35 (22–75) | * (*) | 0.8 |
| Communication | 257 (0.1) | 0.2 | 21 (0.1) | 65,603/724 | 29,580 (0.1) | 107 (45–471) | 0 (0.0) | 0.0 |
| Non-Classifiable | 35 (0.01) | - | 3 (0.02) | 107,549/2,506 | 2690 (0.01) | 188 (113–373) | 0 (0.0) | - |
| Total | 464,139(100.0) | 4.6 | 14,934 (100.0) | 37,428/671 | 20,861,003 (100.0) | 58 (27–210) | 250 (100.0) | 2.5 |
| Occupation Classification | Claims: n (%) | Claim Rate (per 100) | Total Cost (Million): n (%) | Median Cost for Serious/Non-Serious Claims | Total Time-Loss Days: n (%) | Time-Loss Days For Serious Claims: Median (25–75th Percentile) | Death: n (%) | Death Rate (per 100,000) |
|---|---|---|---|---|---|---|---|---|
| Labourers | 125,043 (27.0) | 9.9 | 4110 (27.5) | 35,554/626 | 6,186,878 (29.7) | 57 (27–227) | 44 (17.6) | 3.3 |
| Technicians and Trades Workers | 107,766 (23.2) | 8.3 | 2662 (17.8) | 33,564/523 | 3,511,634 (16.8) | 50 (26–176) | 47 (18.8) | 3.0 |
| Machinery Operators and Drivers | 75,787 (16.3) | 11.2 | 2829 (18.9) | 42,829/753 | 3,654,779 (17.5) | 60 (28–235) | 96 (38.4) | 11.8 |
| Community and Personal Service Workers | 53,504 (11.5) | 5.0 | 1714 (11.5) | 29,927/867 | 2,702,035 (13.0) | 56 (27–175) | 10 (4.0) | 1.0 |
| Professionals | 35,172 (7.6) | 1.7 | 1276 (8.5) | 45,466/1,045 | 1,473,488 (7.1) | 64 (30–189) | 22 (8.8) | 1.1 |
| Sales Workers | 30,409 (6.6) | 3.2 | 879 (5.9) | 40,113/628 | 1,347,844 (6.5) | 65 (30–251) | * (*) | 0.5 |
| Clerical and Administrative Workers | 21,820 (4.7) | 1.2 | 753 (5.0) | 44,460/1,064 | 1,072,727 (5.1) | 66 (29–215) | * (*) | 0.3 |
| Managers | 14,460 (3.1) | 1.3 | 699 (4.7) | 53,954/837 | 891,038 (4.3) | 84 (34–318) | 22 (8.8) | 1.2 |
| Unknown | 178 (0.04) | - | 12 (0.1) | 82,212/493 | 20,578 (0.1) | 107 (49–643) | * (*) | - |
| Nature of Injury | Claims: n (%) | Total Cost (Million): n (%) | Median Cost for Serious/Non-Serious Claims | Total Time-Loss Days: n (%) | Time-Loss Days For Serious Claims: Median (25–75th Percentile) | Death: n (%) | Case Fatality Rate (per 100,000) |
|---|---|---|---|---|---|---|---|
| Traumatic joint/ligament and muscle/tendon injury | 220,456 (43.2) | 6280 (42.1) | 35,038/944 | 8,440,125 (40.5) | 53 (25–176) | *(*) | 1 |
| Wounds, lacerations, amputations, and internal organ damage | 102,481 (22.1) | 807 (5.4) | 21,568/388 | 976,560 (4.7) | 35 (22–81) | 20 (8.0) | 20 |
| Musculoskeletal and connective tissue diseases | 53,983 (11.6) | 3551 (23.8) | 57,401/1,703 | 5,615,172 (26.9) | 86 (34–378) | * (*) | 4 |
| Fractures | 19,888 (4.3) | 1024 (6.9) | 24,702/1,292 | 1,554,378 (7.5) | 50 (29–493) | 12 (4.8) | 60 |
| Nervous system and sense organ diseases | 15,167 (3.3) | 608 (4.1) | 36,980/4,505 | 622,725 (3.0) | 57 (29–194) | * (*) | 0 |
| Mental diseases | 14,722 (3.2) | 1699 (11.4) | 72,936/3,046 | 2,570,326 (12.3) | 132 (51–355) | * (*) | 34 |
| Burns | 10,434 (2.3) | 96 (0.6) | 20,182/374 | 95,887 (0.5) | 28 (19–57) | * (*) | 48 |
| Skin and subcutaneous tissue diseases | 7161 (1.5) | 92 (0.6) | 17,650/429 | 131,182 (0.6) | 36 (20–107) | * (*) | 0 |
| Digestive system diseases | 4464 (1.0) | 113 (0.8) | 17,584/6,995 | 171,047 (0.8) | 31 (22–46) | * (*) | 22 |
| Intracranial injuries | 3317 (0.7) | 130 (0.9) | 59,245/627 | 137,222 (0.7) | 74 (29–493) | 15 (6.0) | 452 |
| Respiratory system diseases | 1332 (0.3) | 62 (0.4) | 45,643/1,764 | 79,106 (0.4) | 73 (36–194) | * (*) | 0 |
| Infectious and parasitic diseases | 1033 (0.2) | 20 (0.1) | 16,170/768 | 27,510 (0.1) | 37 (21–102) | * (*) | 194 |
| Injury to nerves and spinal cord | 557 (0.1) | 62 (0.4) | 33,456/2,176 | 63,203 (0.3) | 57 (25–441) | * (*) | 0 |
| Circulatory system diseases | 556 (0.1) | 110 (0.7) | 106,762/1,667 | 102,090 (0.5) | 99 (46–453) | 42 (16.8) | 7554 |
| Neoplasms (cancer) | 157 (0.03) | 10 (0.1) | 70,511/5,254 | 4717 (0.0) | 37 (18–348) | * (*) | 1911 |
| Other | 28,431 (6.1) | 146 (1.0) | 54,939/293 | 269,735 (1.3) | 76 (30–394) | 141 (56.4) | 496 |
| Total | 464,139 (100.0) | 14,934 (100.0) | 37,428/671 | 20,861,003 (100.0) | 58 (27–210) | 250 (100.0) | 54 |
| Mechanism of injury | Claims: n (%) | Total cost (million): n (%) | Median cost for serious/non-serious claims | Total time-loss days: n (%) | Time-loss days for serious claims: median (25–75th percentile) | Death: n (%) | Case fatality rate (per 100,000) |
|---|---|---|---|---|---|---|---|
| Body stressing | 178,824 (38.5) | 7253 (48.6) | 39,502/1,164 | 10,327,010 (49.5) | 59 (27–222) | 12 (4.8) | 7 |
| Being hit by moving objects | 84,750 (18.3) | 1393 (9.3) | 26,725/433 | 1,904,359 (9.1) | 45 (25–130) | 51 (20.4) | 60 |
| Falls, trips, and slips | 74,588 (16.1) | 2627 (17.6) | 32,543/830 | 3,758,039 (18.0) | 54 (27–165) | 15 (6.0) | 20 |
| Hitting objects with a part of the body | 59,981 (12.9) | 433 (2.9) | 19,406/385 | 565,074 (2.7) | 35 (22–74) | * (*) | 3 |
| Vehicle incidents | 18,187 (3.9) | 1055 (7.1) | 46,553/1,004 | 1,424,469 (6.8) | 73 (30–325) | 122 (48.8) | 671 |
| Mental stress | 14,415 (3.1) | 1691 (11.3) | 73,111/3,114 | 2,531,989 (12.1) | 131 (51–355) | 24 (9.6) | 166 |
| Chemicals and other substances | 12,636 (2.7) | 142 (0.9) | 29,763/298 | 182,082 (0.9) | 54 (24–231) | 8 (3.2) | 63 |
| Heat, electricity, and other environment | 12,473 (2.7) | 113 (0.8) | 20,329/363 | 116,152 (0.6) | 30 (20–66) | 14 (5.6) | 112 |
| Sound and pressure | 6189 (1.3) | 194 (1.3) | 32,168/25,589 | 12,195 (0.1) | 46 (27–157) | 0 (0.0) | 0 |
| Biological factors | 1983 (0.4) | 31 (0.2) | 15,302/366 | 35,588 (0.2) | 36 (21–94) | * (*) | 50 |
| Other | 113 (0.02) | 3 (0.02) | 23,734/329 | 4044 (0.02) | 62 (20–331) | * (*) | 885 |
| Category | Claims: n (%) | Total Cost (Million): n (%) | Median Cost for Serious/Non-Serious Claims | Total Time-Loss Days: n (%) | Time-Loss Days for Serious Claims: Median (25–75th Percentile) | Death: n (%) | Case Fatality Rate (per 100,000) |
|---|---|---|---|---|---|---|---|
| New worker * | |||||||
| Yes | 72,382 (15.6) | 2735 (18.3) | 36,861/455 | 4,201,254 (20.1) | 64 (27–210) | 50 (20.0) | 69 |
| No | 391,757 (84.4) | 12,199 (81.7) | 37,530/744 | 16,659,747 (79.8) | 58 (27–195) | 200 (80.0) | 51 |
| Business size # | |||||||
| Large | 238,715 (51.9) | 6594 (44.7) | 38,433/886 | 7,425,747 (35.6) | 50 (25–142) | 54 (21.6) | 23 |
| Medium | 145,213 (31.6) | 4561 (30.9) | 36,572/506 | 7,101,593 (34.0) | 65 (29–291) | 84 (33.6) | 58 |
| Small | 76,391 (16.6) | 3583 (24.3) | 35,233/563 | 6,142,663 (29.4) | 73 (31–360) | 107 (42.8) | 140 |
| First language | |||||||
| English | 451,802 (97.3) | 14,241 (95.4) | 36,758/668 | 19,851,622 (95.2) | 58 (27–203) | 247 (98.8) | 55 |
| Other | 12,337 (2.7) | 693 (4.6) | 77,560/816 | 1,009,379 (4.8) | 99 (33–528) | 3 (1.2) | 24 |
| Born in Australia | |||||||
| Yes | 342,429 (73.4) | 10,342 (69.3) | 35,427/628 | 14,715,462 (70.5) | 57 (27–200) | 191 (76.4) | 56 |
| No | 121,710 (26.2) | 4592 (30.7) | 43,180/828 | 6,145,539 (29.5) | 62 (28–235) | 59 (23.6) | 48 |
© 2020 by the authors. Licensee MDPI, Basel, Switzerland. This article is an open access article distributed under the terms and conditions of the Creative Commons Attribution (CC BY) license (http://creativecommons.org/licenses/by/4.0/).
Share and Cite
Xiang, J.; Mittinty, M.; Tong, M.X.; Pisaniello, D.; Bi, P. Characterising the Burden of Work-Related Injuries in South Australia: A 15-Year Data Analysis. Int. J. Environ. Res. Public Health 2020, 17, 2015. https://doi.org/10.3390/ijerph17062015
Xiang J, Mittinty M, Tong MX, Pisaniello D, Bi P. Characterising the Burden of Work-Related Injuries in South Australia: A 15-Year Data Analysis. International Journal of Environmental Research and Public Health. 2020; 17(6):2015. https://doi.org/10.3390/ijerph17062015
Chicago/Turabian StyleXiang, Jianjun, Murthy Mittinty, Michael Xiaoliang Tong, Dino Pisaniello, and Peng Bi. 2020. "Characterising the Burden of Work-Related Injuries in South Australia: A 15-Year Data Analysis" International Journal of Environmental Research and Public Health 17, no. 6: 2015. https://doi.org/10.3390/ijerph17062015
APA StyleXiang, J., Mittinty, M., Tong, M. X., Pisaniello, D., & Bi, P. (2020). Characterising the Burden of Work-Related Injuries in South Australia: A 15-Year Data Analysis. International Journal of Environmental Research and Public Health, 17(6), 2015. https://doi.org/10.3390/ijerph17062015